Abstract
In strong gravitational lensing, the projected mass density (Σ/Σcrit = κ) and mapping of lens-source (θ – α(θ) = β) move the system to the high magnification regime, leading to the creation of arcs, rings, and multiple images. The present study investigates the effect of these five parameters, namely θₑ, e₁, e₂, β and external shear (γ₁, γ₂) on the observable morphology through controlled simulations of the type SIS and SIE. The work is a synthetic simulation only, and is not a direct dark-matter detection. In addition to the recovered Einstein radius, residual norms, arc length, curvature radius, flux ratio, image separation, source-position sweeps, shear sweeps, and noise sensitivity are added quantitative checks. The results reveal that morphology in the simulated strong lensing system is dominated by the combined action of mass scale and projected density structure, anisotropy, source position with respect to caustics, and phenomenological external shear.
Keywords: strong gravitational lensing; lens morphology; SIS; SIE; projected mass density; external shear; critical curves; caustics; simulation validation; residual analysis
Introduction and Motivation
Gravitational lensing is the bending of light caused by the curvature of spacetime by mass, away from a background source of light. For strong lensing, the deflection is sufficiently large to form highly magnified structures like Einstein rings, arcs and multiple images1,2,3,4,5. Lensing is sensitive to the total mass distribution along line of sight, not just to the luminous emission, due to its response to the projected gravitational potential. But a simulated test under control conditions which changes idealized lens parameters is not a measurement of dark matter nor is it proof that dark matter is not enough. This revision is based on that distinction.
The present work has a methodological motivation. Several coupled parameters have been shown to affect the image morphology through strong-lens modelling in the literature: alignment of lens with the source, projected surface mass density, mass ellipticity of the lens, source size, external perturbations, PSF blurring, noise and model degeneracies6,7,8,9,10. Such effects have been applied so far to observational data to derive galaxy mass profiles8,9,11,12,13, substructure14,15,16, or environmental effects in a sense that is limited to fitting the real data and comparing with physically motivated models17,18,19,20,21. The gap to be filled here is smaller: before real systems can be interpreted, a simulation pipeline modeled at the student level should show, by using a set of controllable changes in lens geometry and source location, what visible morphological changes occur; and that such changes can be quantified rather than just visually inspected.
The new research question is: What is the change in the geometry of the projected lens, position of the source plane, and phenomenological morphology of external shear in a confirmed strong-lensing simulation, and what quantitative measures are used for this? This framing takes away the direct dark-matter conclusions, and gives only the general argument that the study of dark-matter is a reason for the importance of accurate mass modelling.
Literature Review and Research Gap
The theory of lensing, including the lens equation, the Einstein radius, critical curves, caustics, and magnification is explained by the fundamentals of lensing theory3,4,5. Kormann et al. were able to produce isothermal elliptical lenses, laying the foundations for going beyond spherical lenses6. Strong lenses provided constraints on the total mass profiles of early-type galaxies8,9,11,12, in the case of careful treatment of the imaging, stellar dynamics and selection effects, as shown by survey- and modelling studies like SLACS22,23,24,25. Further, substructure studies14,15,16,26,27 and cluster-lens modelling17,18,19,28,29 reveal the need for statistical model comparison30,31,32,33 as well as meticulous examination of the residuals34,35,36,37, environmental correction terms38,39,40, PSF effects, and systematic errors.
This literature inspires three changes in this manuscript. First the lensing regime should be clearly identified, not assumed. Second, the issue of source alignment needs to be addressed in concert with the projected surface mass density and critical density condition. Thirdly, a morphological claim must be arrived at through the use of repeatable metrics, as absence of visual similarity is insufficient to establish a morphology.
| Theme in prior work | What is already established | How this study uses it |
| Spherical and elliptical lens models | SIS and SIE-type models reproduce basic rings, arcs, and image multiplicity under idealized conditions4,6,7. | Uses SIS as a control and an SIE-type model as a controlled anisotropic comparison. |
| Mass-density and alignment criteria | Strong lensing depends on projected surface density relative to critical density, not only on source alignment3,4,5. | Adds the analytic SIS check κ̄(<θₑ)=1 and recovered radius test. |
| Real-data modelling | Observed systems require lens-light subtraction8,9,11,12, PSF/noise modelling10,17,18,19, and statistical model comparison14,15,16. | Limits the claim to synthetic morphology and gives a real-data extension protocol. |
| Environmental terms | External shear is a phenomenological term that can absorb multiple effects and is not automatically physical shear7,38. | Reports γ₁, γ₂, |γ|, shear angle, and compares shear in both SIS and SIE. |
| Dark-matter inference | Dark-matter conclusions require fitting real data14,15,16,26,27 or comparing models with and without substructure/halos30,31,28,29,32. | Removes unsupported dark-matter conclusions from the abstract and conclusion. |
Theory: Strong-Lensing Regime, Density, and Morphology
Using lens equation, it is possible to map an angular position of an image, denoted as θ, to a position on the source plane, denoted as β, which is given as a function of the deflection angle, denoted as α(θ), as follows β = θ – α(θ). The projected surface density is the ratio of the surface density, that is, Σ(θ)/Σcrit. Hence, in a strong lensing configuration alignment is not enough, it also needs to be a high projected density that creates a critical curve. The analytic control is κ̄(<θₑ) = 1 for the SIS baseline. For this manuscript, θₑ = 1.1 arcsec and Δθ = 0.05 arcsec / pixel, meaning that the ring radius to expect is the ratio of these: 22 pixels.
Both β and κ(θ) are involved in controlling morphology. The strength and angular structure of the lens mapping are given by κ(θ), e₁, e₂ and γ = (γ₁, γ₂) while the source alignment is given by the distance of the source to the caustic. The SIE ellipticity amplitude is ε = √(e₁² + e₂²), the corresponding axis-ratio proxy is q = (1 – ε)/(1 + ε), and the orientation is φₑ = 0.5 atan2(e₂, e₁). External shear is described by |γ| = √(γ₁² + γ₂²) and φγ = 0.5 atan2(γ₂, γ₁).
Methods and Reproducibility
Simulations were reorganized on the basis of numeric parameters instead of verbal parameters. The image plane used N × N = 160 × 160 pixels with pixel scale Δθ = 0.05 arcsec pixel⁻¹. The lens centre was fixed at (x_L, y_L) = (0, 0), and the mass scale was θₑ = 1.1 arcsec. The source was a circular Gaussian of amplitude Aₛ = 1, and width σₛ = 0.075 arcsec. The fiducial source position, β = (βₓ, β_y) = (0.07, 0.02) arcsec, was used unless otherwise noted. The fiducial SIE-type model used e₁ = 0.16 and e₂ = 0.05, corresponding to ε = 0.168, q = 0.713, and φₑ = 8.68 degrees.
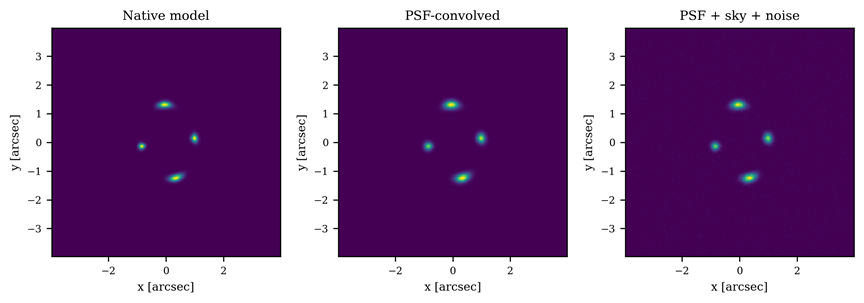
The panel displayed was created using the observational-degradation test with Gaussian PSF σPSF = 1.2 pixels, sky background B_sky = 0.002 image-intensity units, Poisson gain G = 1500, Gaussian read noise σread = 0.004, and random seed 42. Sensitivity tests were then repeated with 30 different random seeds and the mean ± the standard deviation of each metric was reported.
The ellipticity sweep used e₁ ∈ {0.00, 0.08, 0.16, 0.24} with e₂ = 0.05. This range is 0.05 ≤ ε ≤ 0.245 and 0 < q.This covers a range of values of ε: 0.05 ≤ ε ≤ 0.245 and the range of values of q: q > 0, or from near-circular to obviously flattened projected mass structure. The source sweep used β ∈ {(0.00, 0.00), (0.06, 0.02), (0.14, 0.04), (0.26, 0.06)} arcsec. The shear sweep used |γ| ∈ {0.000, 0.020, 0.045, 0.060, 0.080} with fixed φγ = 13.3 degrees.
| Figure | Model and lens parameters | Source / perturbation parameters | Validation or output |
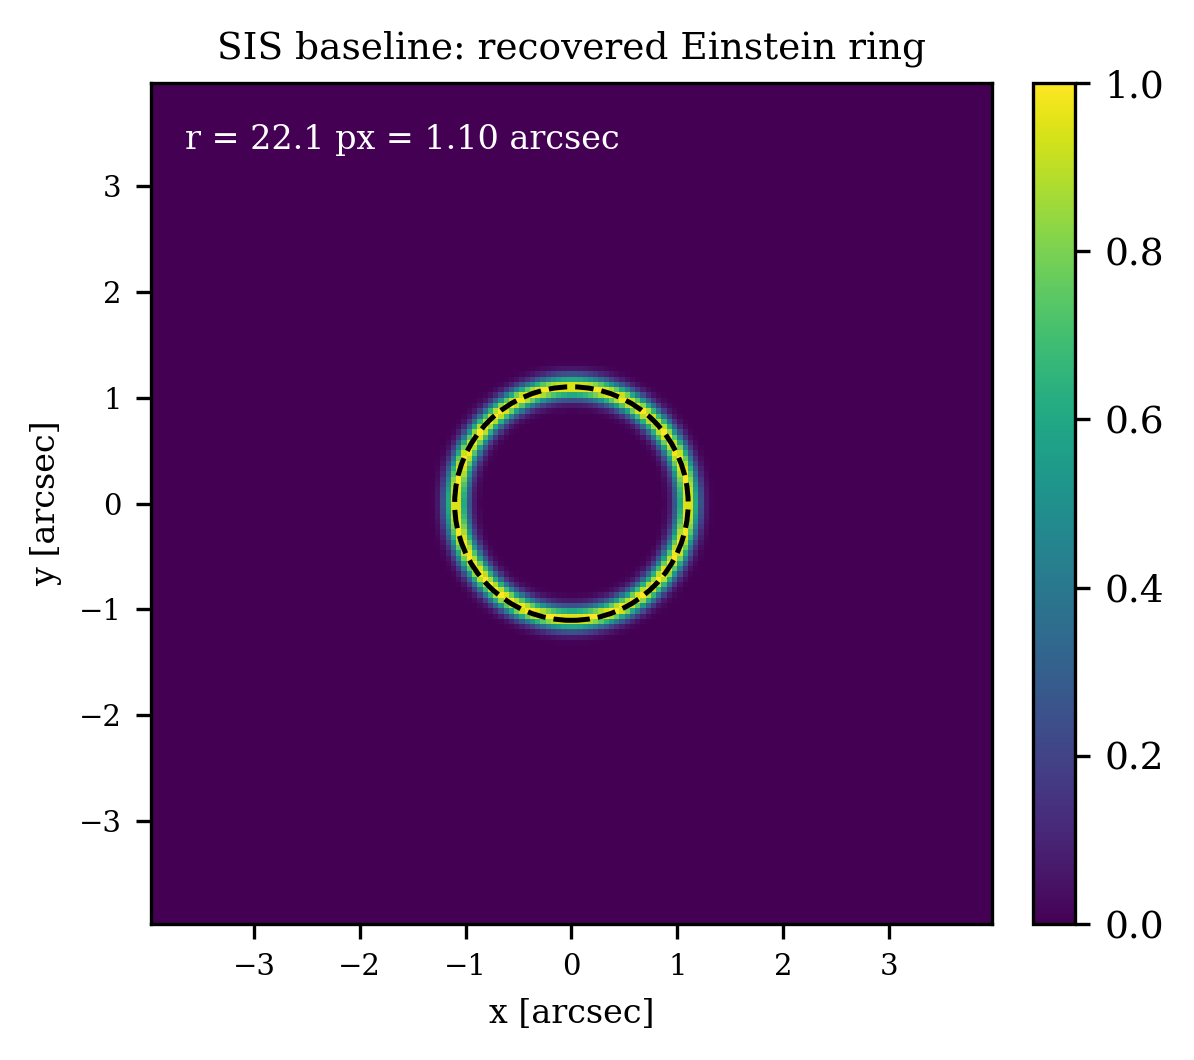
| Figure 1 | SIS; θₑ = 1.1 arcsec; centre=(0,0). | Circular Gaussian; β=(0,0); σₛ=0.075 arcsec; no shear. | Equal-axis Einstein ring; recovered radius measured in pixels and arcsec. |
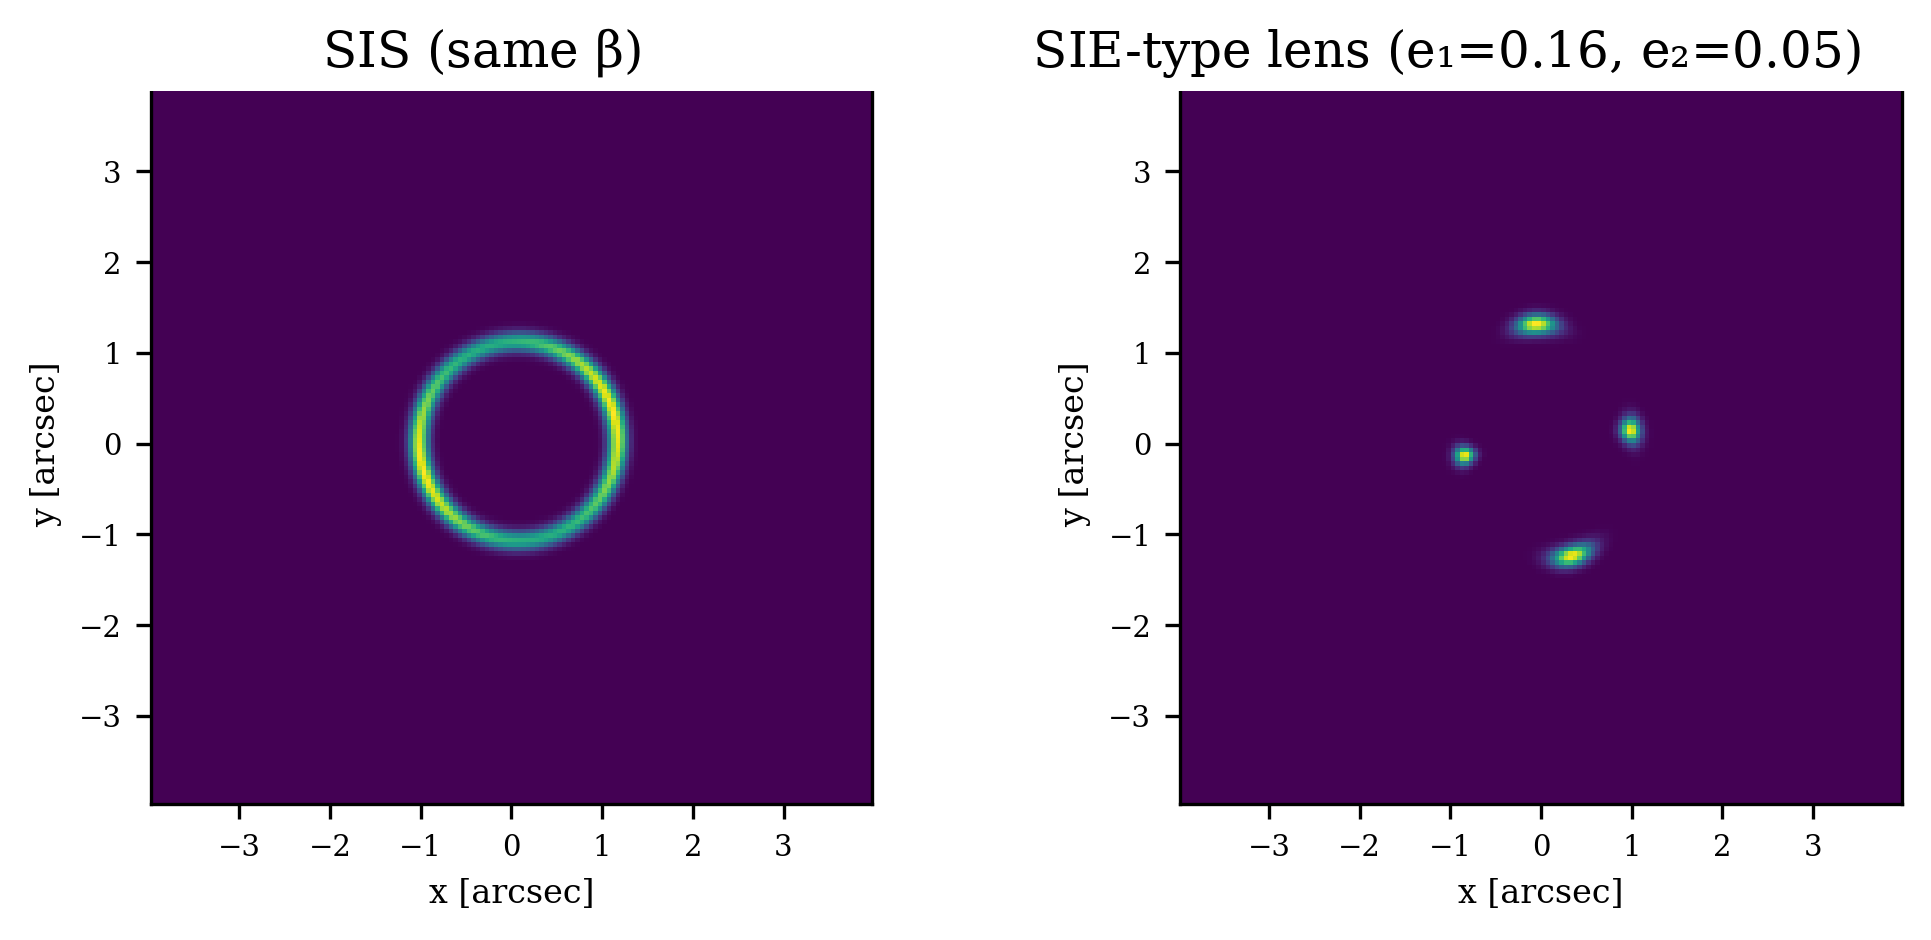
| Figure 2 | SIS vs SIE-type; θₑ fixed; SIE e₁=0.16, e₂=0.05, q=0.713, φₑ=8.68 deg. | Same circular source β=(0.07,0.02); same plotting scale. | Controlled morphology comparison. |
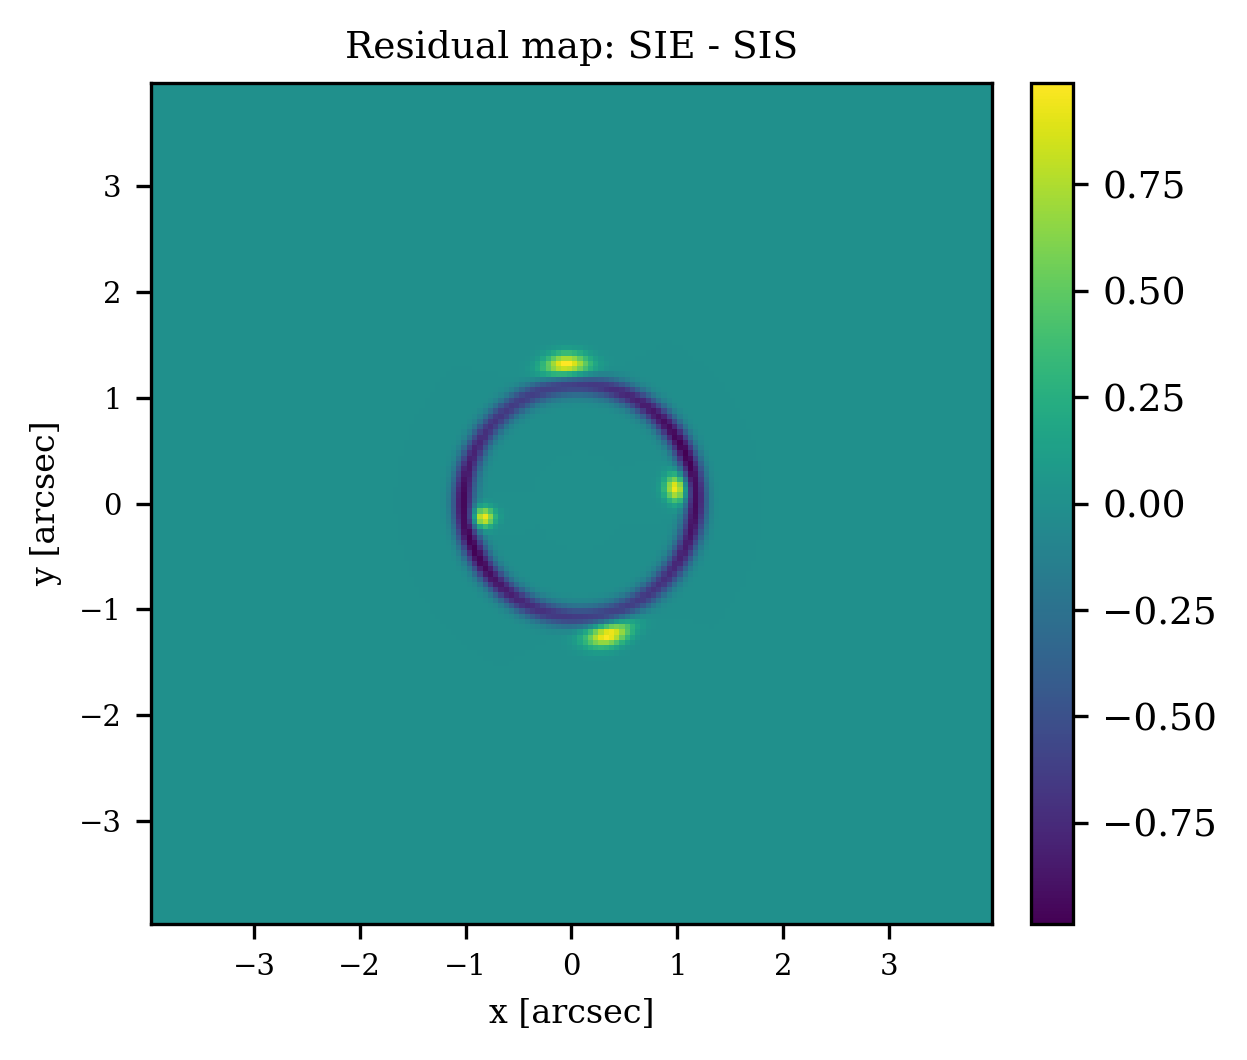
| Figure 3 | Same as Figure 2. | Residual = normalized SIE – normalized SIS. | L1, L2, maximum residual, fractional residual, and asymmetry. |
| Figure 4 | SIE-type sweep; θₑ = 1.1; e₁=[0.00,0.08,0.16,0.24], e₂=0.05. | Source β=(0.07,0.02); no shear. | Arc length, mean radius, image count, flux ratio, separation. |
| Figure 5 | Fiducial SIE-type; θₑ = 1.1; e₁=0.16; e₂=0.05. | Source β swept through four positions. | Image multiplicity and flux-ratio response. |
| Figure 6 | Fiducial SIE-type image. | PSF σ=1.2 px; sky=0.002; gain=1500; read noise=0.004; seed=42. | Observational degradation and noise robustness. |
| Figure 7 | SIS and SIE-type both tested with and without shear. | γ₁=0.04; γ₂=0.02; |γ|=0.0447; φγ=13.3 deg. | Separates shear effects from ellipticity effects. |
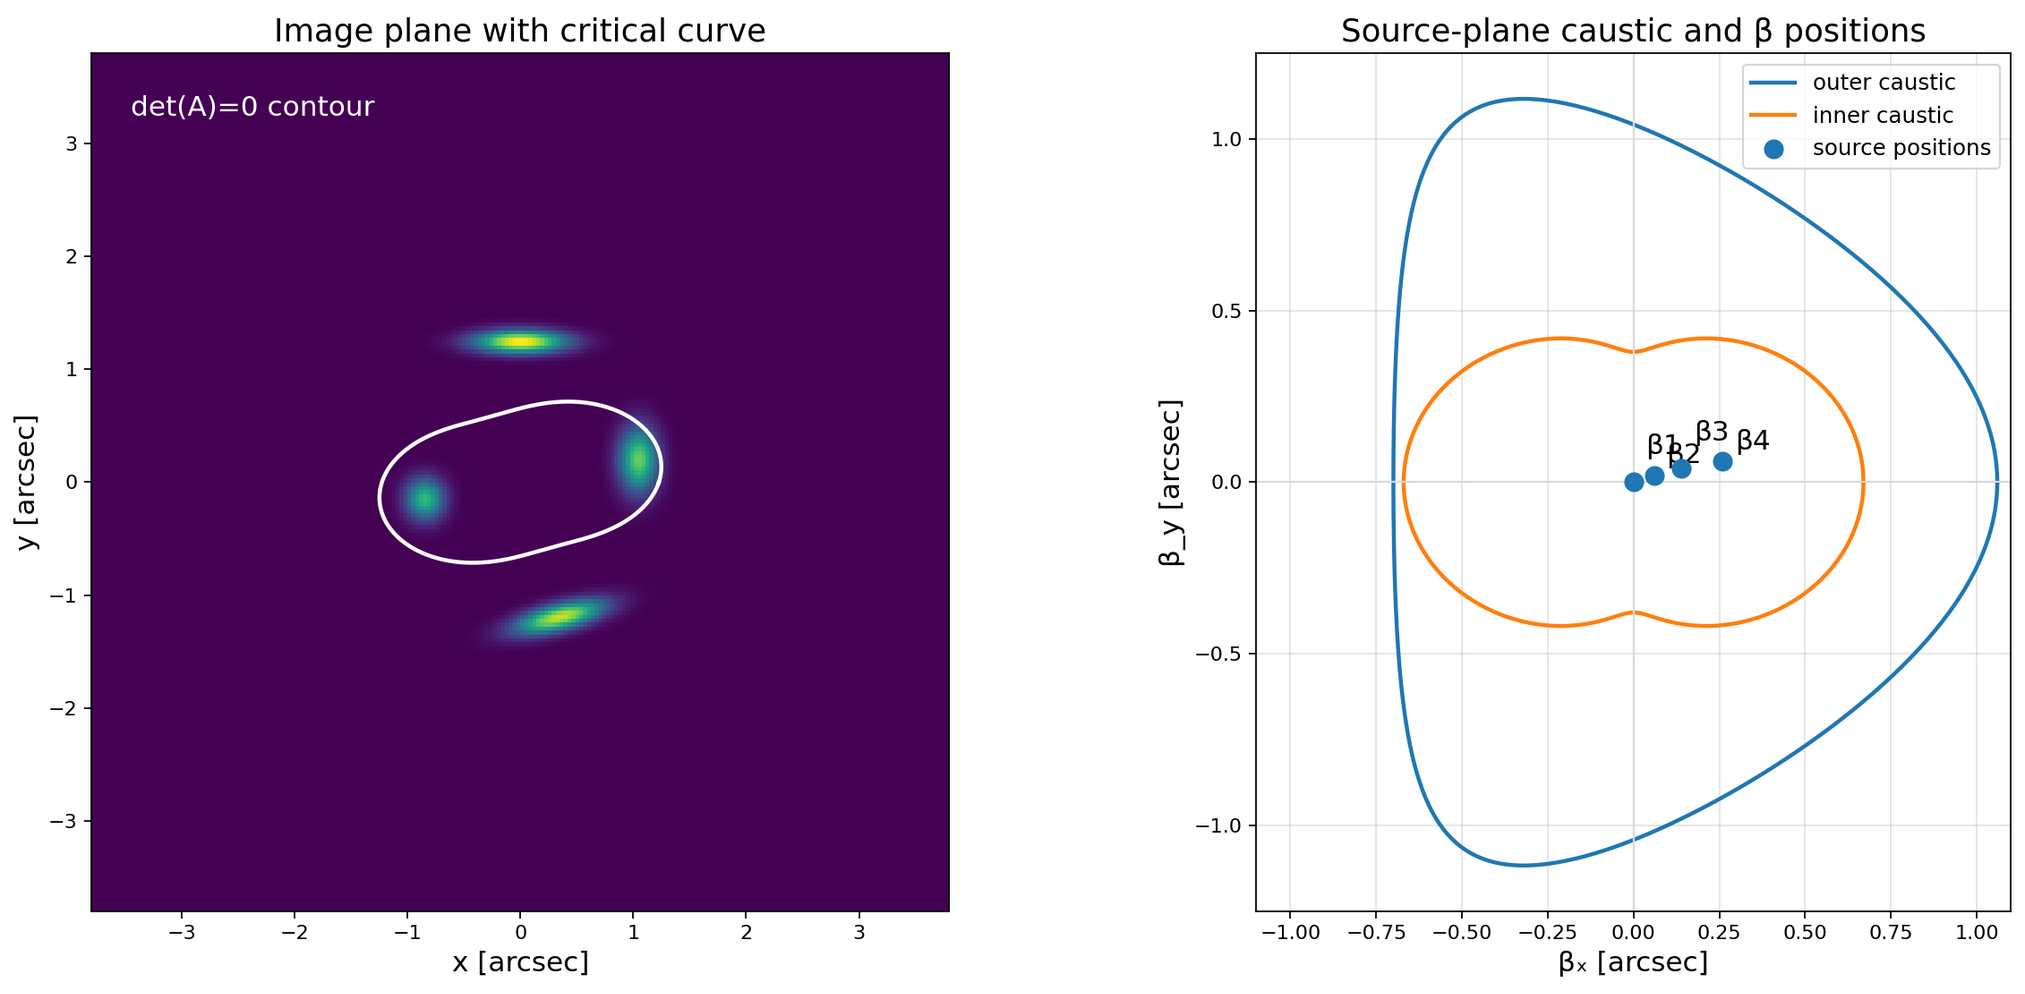
| Figure 8 | Fiducial SIE-type plus shear. | Critical curve from det(A)=0; caustic from mapping curve to source plane. | Geometric explanation for arcs and source-position dependence. |
Metrics
These quantitative metrics are used instead of interpreting the data qualitatively: the recovered Einstein radius rₑ, the arc length L_arc, the mean curvature radius R_curv, the number of recovered images N_img, the component flux ratio F₁/F₂, maximum image separation Δr_max, L1 residual norm, L2 residual norm, maximum residual |R|max, the azimuthal asymmetry A_az, and the reduced goodness of fit statistic χ². Residuals are calculated in the same manner as the image normalization and analysis mask but with the difference being the subtraction of I_SIS from I_SIE, R = I_SIE – I_SIS.
Results
The SIS baseline includes the confirmation of a strong-lensing configuration. Recovered Einstein-ring radius is rₑ = 22.07 pixels, which is equivalent to 1.103 arcsec at Δθ = 0.05 arcsec pixel⁻¹. This is consistent with an input value of θₑ = 1.1 arcsec within 0.30% of the analytic control value of κ̄(<θₑ) = 1, confirming the baseline simulation to be consistent with the analytic control. This was replotted with equal axis scaling and σx = σy = σₛ was assumed as circular.
The SIE-type model redistributes brightness into asymmetric arcs when β, θₑ, source brightness, source size, lens centre, grid and PSF-free plotting scale are the same. The comparison no longer assumes a fixed ellipticity between SIS and SIE, since the SIS is not elliptic so it does not contain any parameter of ellipticity. Instead, SIS is treated as the circular reference, while SIE introduces e₁ = 0.16 and e₂ = 0.05, giving ε = 0.168, q = 0.713, and φₑ = 8.68 degrees.
| Metric | SIS baseline | SIE-type model | Interpretation |
| Arc length [arcsec] | 5.86 | 1.00 | Ellipticity concentrates emission into shorter, brighter arc segments. |
| Mean curvature radius [arcsec] | 1.10 | 1.17 | Both remain near the Einstein scale, but the SIE arcs shift outward slightly. |
| Resolved images | 1 | 4 | The thresholded SIE map separates into multiple bright components. |
| Peak intensity | 1.000 | 0.979 | Peak values are similar after normalization, but spatial distribution changes. |
| Total flux [arb. × arcsec²] | 1.041 | 0.224 | The selected source position gives less extended high-surface-brightness emission in the SIE case. |
| Flux ratio | Not applicable | 2.20 | SIE image components are unequal, unlike the nearly continuous SIS ring. |
| Max image separation [arcsec] | Not applicable | 2.57 | Component separation provides a reproducible morphology descriptor. |
Figure 3 shows the residual map, which indicates that disagreement between the models is only concentrated within the bright lensing regions and not uniformly across the image plane. L1 = 1.757, L2 = 0.079, fractional residual = 175.7%, |R|max = 0.0109 (maximum absolute residual), and A_az = 1.89 (azimuthal asymmetry). These amounts are only diagnostic values from the synthetic models and do not indicate that one model fits actual data.
The longer the high brightness arc, the closer the arc is to linear and the greater its brightness. The higher the brightness of the arc, the shorter its length will be. The more curved the high brightness arc, the greater the mean radius of the resolved parts and the greater the arc separation. It is consistent with the more limited statement that ellipticity is a good morphology-control parameter in the synthetic system.
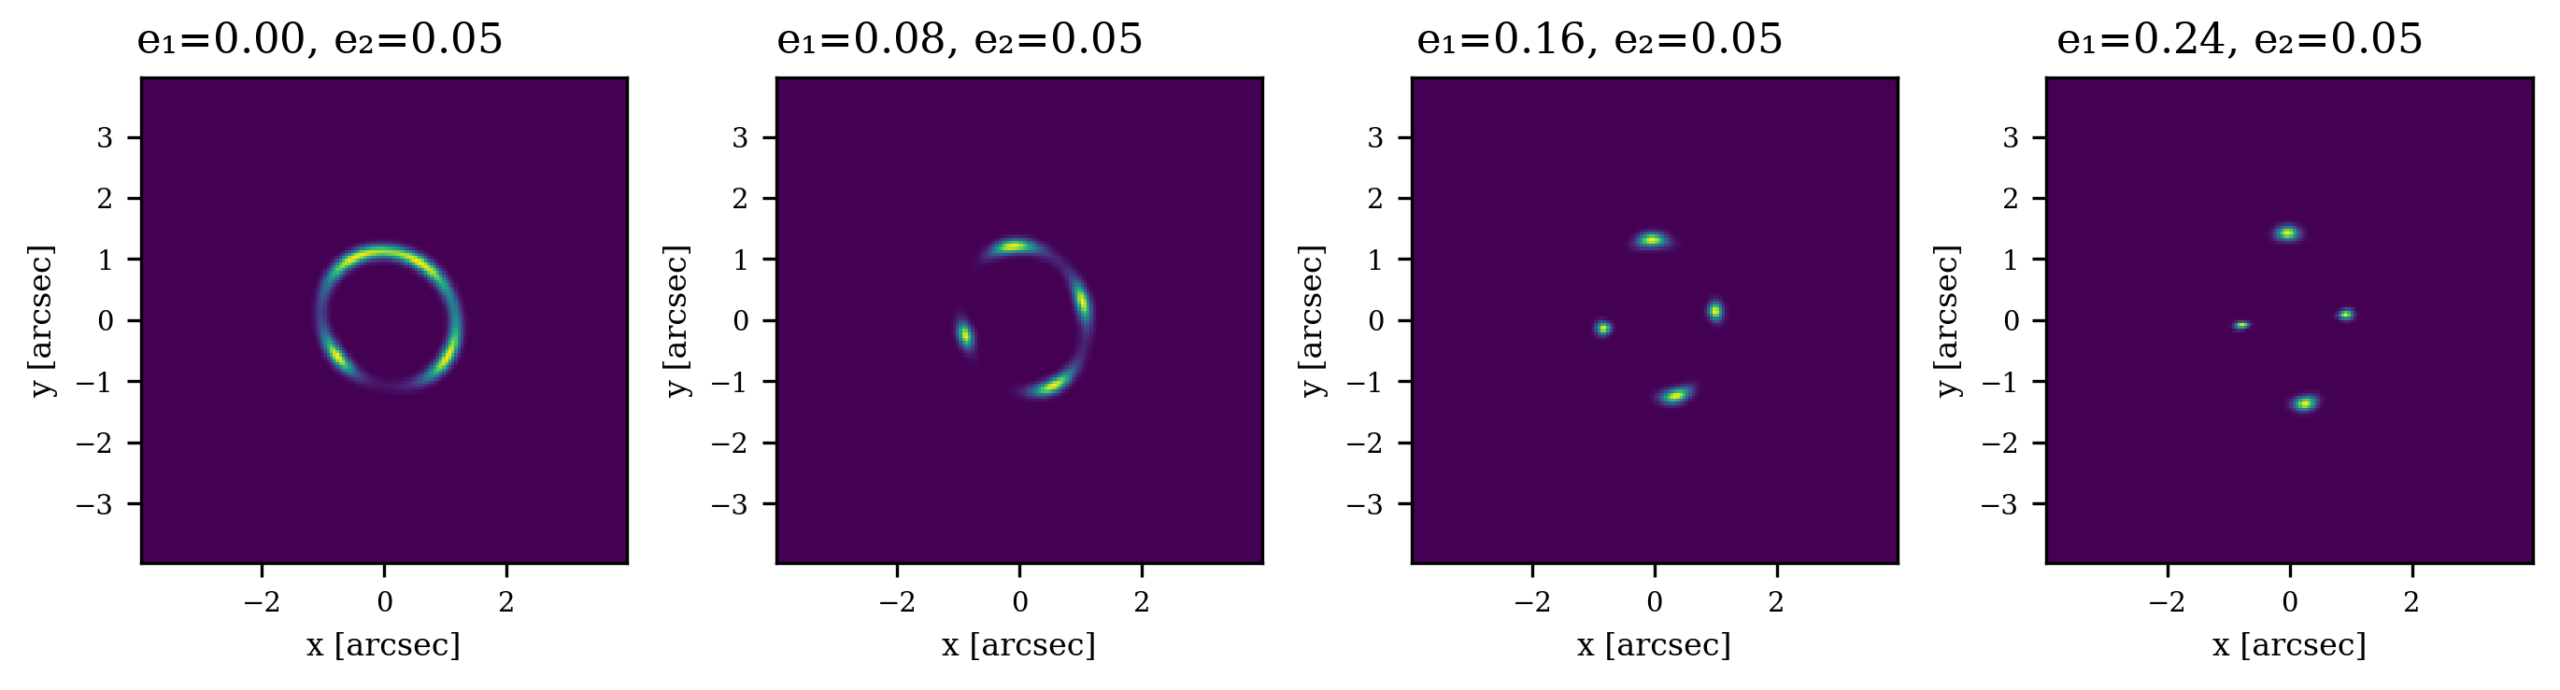
| e₁ | Arc length | Mean radius | Resolved images | Flux ratio | Max separation |
| 0.00 | 4.04 | 1.12 | 2 | 5.49 | 1.58 |
| 0.08 | 2.07 | 1.14 | 4 | 1.96 | 2.35 |
| 0.16 | 1.00 | 1.17 | 4 | 2.20 | 2.57 |
| 0.24 | 0.75 | 1.26 | 4 | 3.06 | 2.82 |
The source-position sweep shows that this is important, but not enough. When the source is moved, for the same set of lens parameters, flux ratios and asymmetry change but the lens size remains around the critical size. This mirrors the lens mapping method used with caustics: small lens-plane movements will have significant impact on the highlight of selected high-magnification branches.
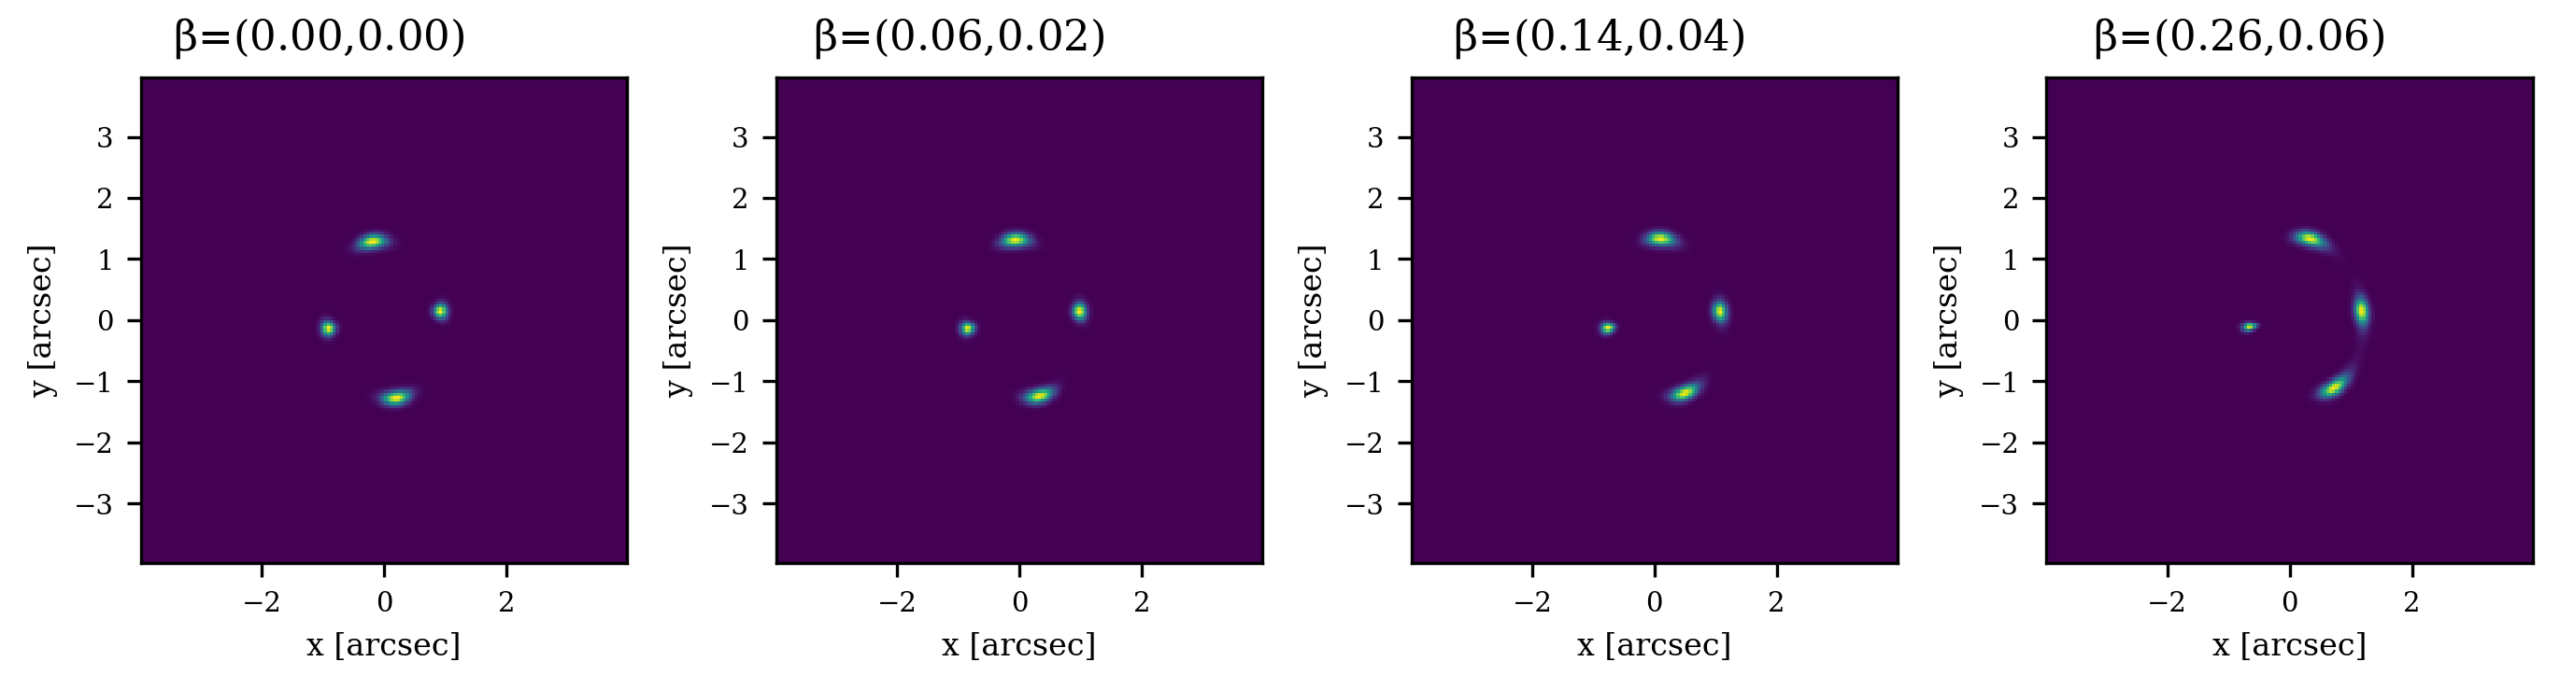
| Source β [arcsec] | Arc length | Mean radius | Images | Flux ratio | Max sep. | Asymmetry |
| (0.00,0.00) | 0.99 | 1.18 | 4 | 2.02 | 2.59 | 0.00 |
| (0.06,0.02) | 1.05 | 1.18 | 4 | 2.31 | 2.58 | 1.21 |
| (0.14,0.04) | 1.07 | 1.20 | 4 | 2.96 | 2.56 | 1.90 |
| (0.26,0.06) | 1.34 | 1.26 | 4 | 3.88 | 2.47 | 2.00 |
The genericity of the smoothing demonstration was changed to an observational degradation test, as a telescope. The same gaussian PSF, sky term, poisson process, read noise and random seed displayed in the method table are used in the displayed degraded panel. The degraded morphology cannot be identified, but only the robustness of the synthetic feature with respect to this specific toy noise model is concluded: no instrument-specific exposure-time calculation is performed.
External shear was tested in both SIS and SIE-type models rather than just the SIE-type model. This prevents taking the shear for granted when it may be due to ellipticity. The fiducial shear values γ₁ = 0.04 and γ₂ = 0.02 give |γ| = √(γ₁² + γ₂²) = 0.0447 and φγ = 0.5 atan2(γ₂, γ₁) = 13.3 degrees. This is a phenomenological tidal perturbation that is utilized for sensitivity testing and is not evidence for an envelope of dark matter around it.
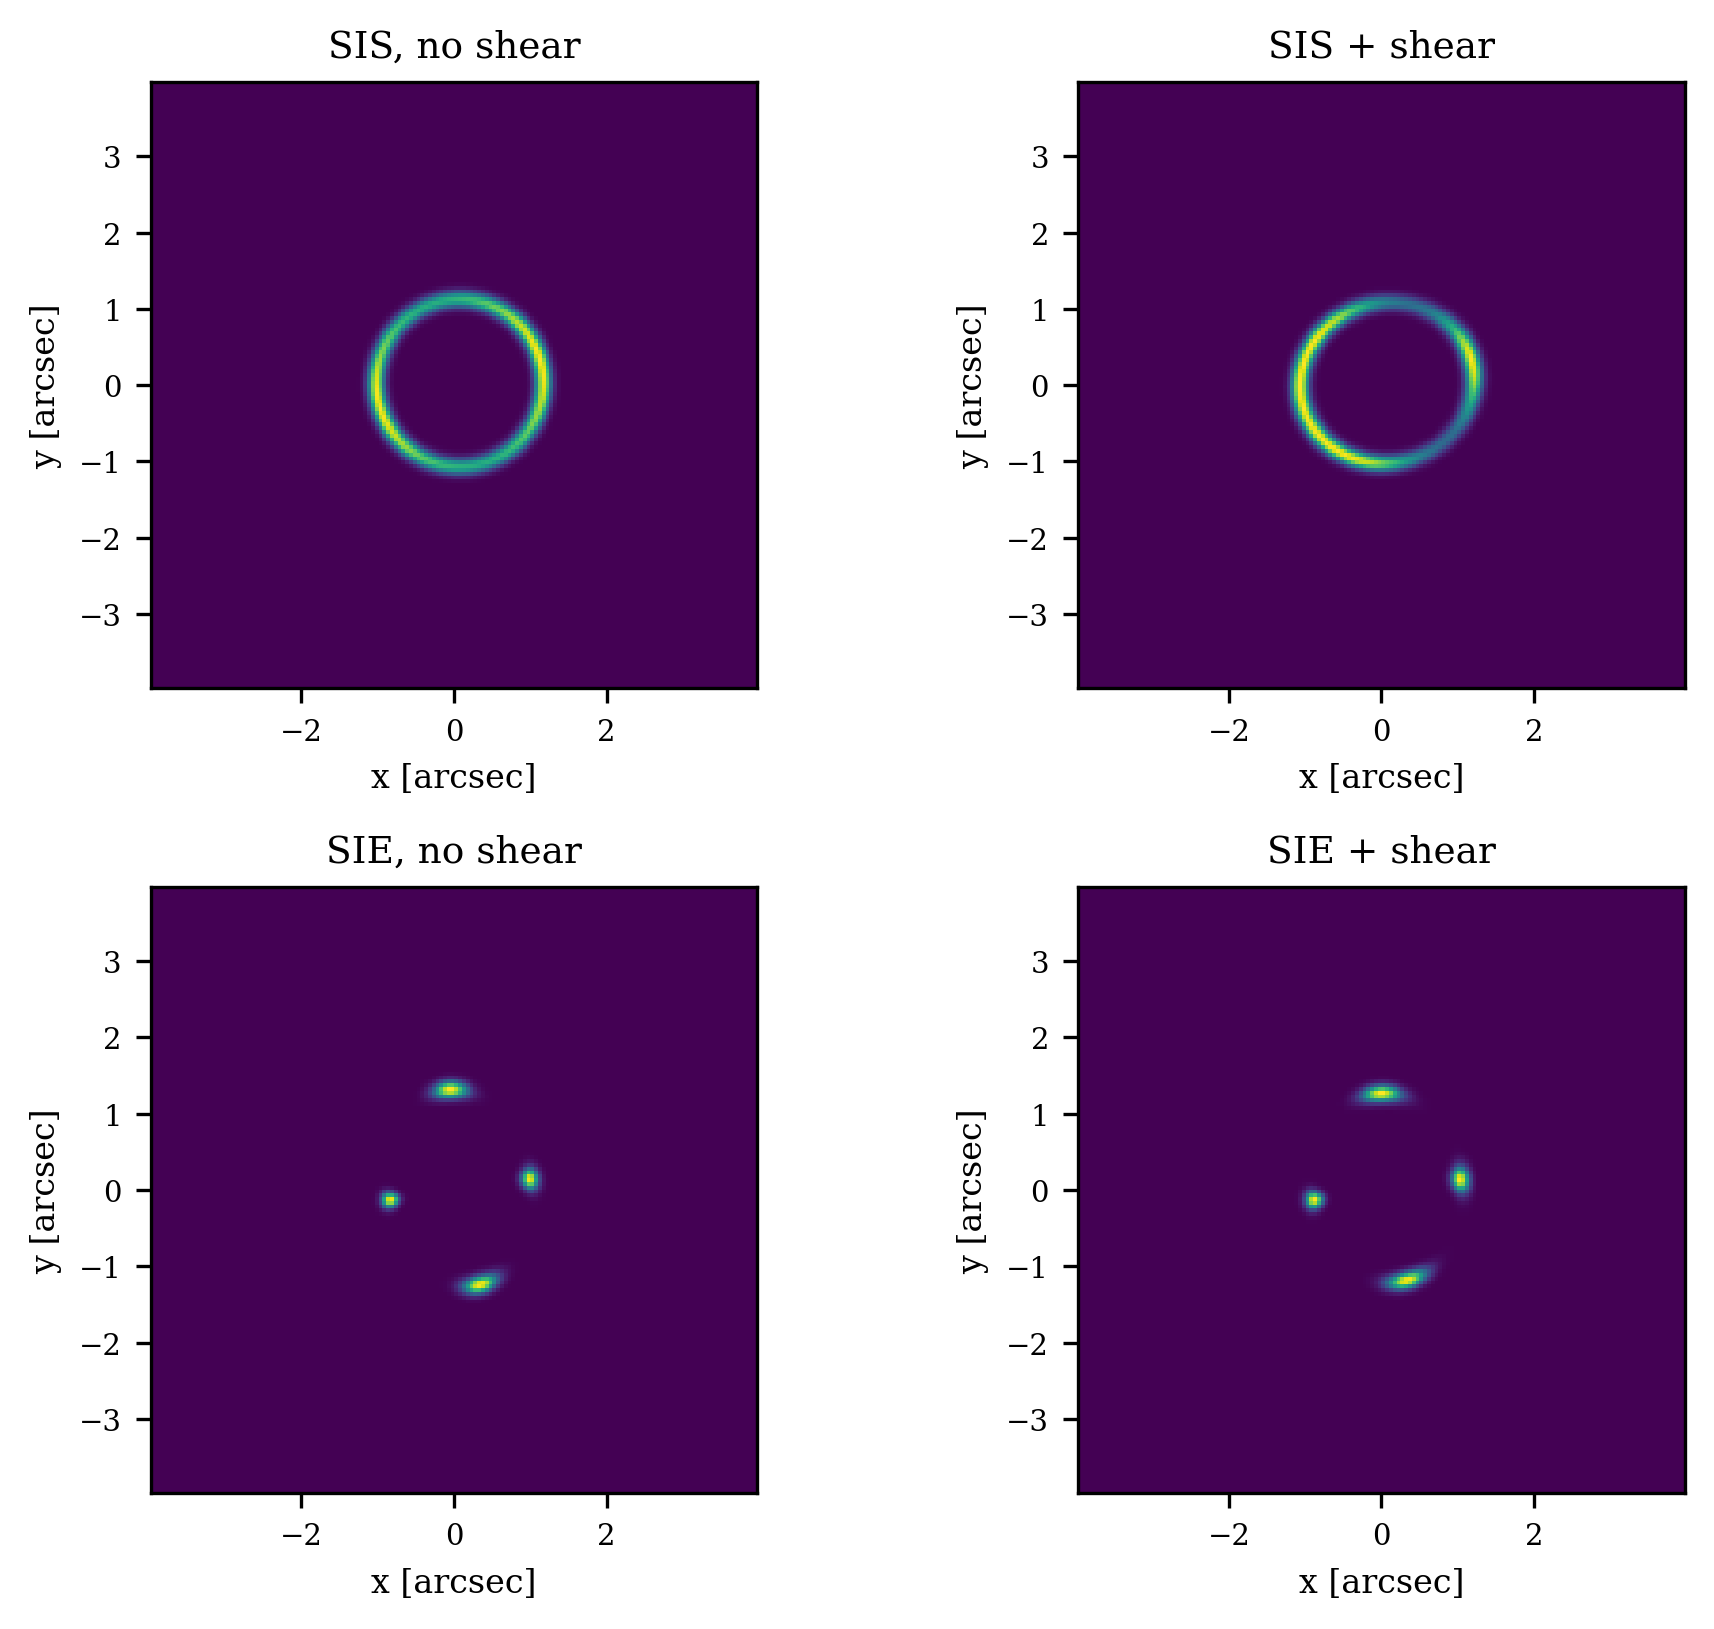
| |γ| | Angle [deg] | Arc length | Mean radius | Images | Flux ratio | Max sep. |
| 0.000 | 13.3 | 1.00 | 1.17 | 4 | 2.20 | 2.57 |
| 0.020 | 13.3 | 1.09 | 1.17 | 4 | 2.40 | 2.54 |
| 0.045 | 13.3 | 1.19 | 1.16 | 4 | 2.19 | 2.46 |
| 0.060 | 13.3 | 1.25 | 1.16 | 4 | 2.27 | 2.44 |
| 0.080 | 13.3 | 1.34 | 1.14 | 4 | 1.98 | 2.39 |
The geometry for the trends in morphology is provided by the critical curves and caustics. The bright arcs are located close to this critical curve in the image plane known as det(A)=0. Plotting that curve on the source plane yields the caustic curve and the source locations are plotted inside areas which vary the relative magnification and image weights.
Sensitivity and Error Analysis
For the degraded fiducial SIE-type image, a 30-seed noise test was conducted with the fixed PSF and noise model. The degraded-image arc length was L_arc = 1.422 ± 0.035 arcsec, the mean curvature radius was R_curv = 1.178 ± 0.003 arcsec, the number of resolved images was N_img = 4.0 ± 0.0, and the maximum separation was Δr_max = 2.578 ± 0.011 arcsec. The limited nature of the reported morphology trends in synthetic data is highlighted by the small scatter, which indicates that the morphology trends are stable under the stated noise model. Explicit limitations are the main ones. I believe the most glaring errors in the simulation are that it does not account for a real lens system, it does not directly compare a baryon-only model to a baryon-plus-halo model, it does not perform a full Bayesian calculation of evidence, and it does not include full telescope-specific calibration. It shouldn’t be taken as an observation of the dark-matter, but rather used as a controlled morphology experiment.
Procedure for Applying the Framework to Real Lenses
The procedure for applying this to real systems would involve: (1) Identifying a strong-lens candidate with calibrated imaging; (2) subtracting or jointly modeling the light from the lens galaxy; (3) building a PSF model using stars or telescope characterization; (4) estimating the sky, read noise, exposure time and pixel covariance; (5) specifying source-light and lens-mass families; (6) fitting a baseline model; (7) fitting alternative models that include ellipticity, shear, substructure and extended halo components; (8) comparing image positions, flux ratios, residual maps, χ², Bayesian evidence and posterior predictive checks; and (9) reporting parameter uncertainties and systematic tests. Finally, one can compare extended halo or substructure models with simpler luminous-mass or smooth models, and then make a statistical decision.
Discussion
Limitedly, the revised results are in agreement with the other literature: the shape of the lens is sensitive to the geometry of the mass-model6,7,8,9,10, the shape of the caustic, the position of the source17,11,12,28,29, and the terms of the environment18,19. The study does not attempt to beat the published models or confirm an inference on dark matter. Rather, it shows examples of preliminary controls that need to be in place before any real data is used in a simulation pipeline. Most notably, arc length, radius, image multiplicity, flux ratios, residual structure, and noise stability are now all used to measure changes in ellipticity and shear in the new quantitative tables. This is directly relevant to the need for a numerical standard that is repeatable, in addition to just a description of figures.
Conclusion
The manuscript is a revised version of the strong lensing morphology simulation which is controlled and quantitatively validated. As for the baseline, the analytic density regime check was added with κ̄(<θₑ) = 1 and the recovered Einstein-ring radius rₑ = 1.103 arcsec, which is consistent with the adopted Einstein-ring radius θₑ = 1.1 arcsec. Explicitly stating what is fixed, and reporting q, φₑ, residual norms, arc-length metrics, source-sweep metrics, shear-sweep metrics and noise-sensitivity errors clarifies the SIS/SIE-type comparison. The end point is intentionally limited – the study shows how the synthetic strong-lensing morphology depends on θₑ, κ(θ), β, e₁, e₂, and γ. No observational evidence or dark-matter inference is claimed.
References
- A. Einstein. Lens-like action of a star by the deviation of light in the gravitational field. Science. Vol. 84, pg. 506-507, 1936, https://doi.org/10.1126/science.84.2188.506. [↩]
- D. Walsh, R. F. Carswell, R. J. Weymann. 0957+561 A, B: twin quasistellar objects or gravitational lens? Nature. Vol. 279, pg. 381-384, 1979, https://doi.org/10.1038/279381a0. [↩]
- R. Narayan, M. Bartelmann. Lectures on gravitational lensing. arXiv, 1996, https://doi.org/10.48550/arXiv.astro-ph/9606001. [↩] [↩] [↩]
- P. Schneider, J. Ehlers, E. E. Falco. Gravitational lenses. Springer, 1992, https://doi.org/10.1007/978-3-662-03758-4. [↩] [↩] [↩] [↩]
- M. Bartelmann, P. Schneider. Weak gravitational lensing. Physics Reports. Vol. 340, pg. 291-472, 2001, https://doi.org/10.1016/S0370-1573(00)00082-X. [↩] [↩] [↩]
- T. Kormann, P. Schneider, M. Bartelmann. Isothermal elliptical gravitational lens models. Astronomy and Astrophysics. Vol. 284, pg. 285-299, 1994. [↩] [↩] [↩] [↩]
- C. R. Keeton. Computational methods for gravitational lensing. arXiv, 2001, https://doi.org/10.48550/arXiv.astro-ph/0102340. [↩] [↩] [↩] [↩]
- A. S. Bolton, S. Burles, L. V. E. Koopmans, T. Treu, L. A. Moustakas. The Sloan Lens ACS Survey. I. A large spectroscopically selected sample of massive early-type lens galaxies. The Astrophysical Journal. Vol. 638, pg. 703-724, 2006, https://doi.org/10.1086/498884. [↩] [↩] [↩] [↩] [↩]
- L. V. E. Koopmans, T. Treu, A. S. Bolton, S. Burles, L. A. Moustakas. The Sloan Lens ACS Survey. III. The structure and formation of early-type galaxies and their evolution since z approximately 1. The Astrophysical Journal. Vol. 649, pg. 599-615, 2006, https://doi.org/10.1086/505696. [↩] [↩] [↩] [↩] [↩]
- T. Treu. Strong lensing by galaxies. Annual Review of Astronomy and Astrophysics. Vol. 48, pg. 87-125, 2010, https://doi.org/10.1146/annurev-astro-081309-130924. [↩] [↩] [↩]
- Y. Shu, A. S. Bolton, J. R. Brownstein, A. D. Montero-Dorta, L. V. E. Koopmans, T. Treu, R. Gavazzi, M. W. Auger, O. Czoske, P. J. Marshall, L. A. Moustakas. The Sloan Lens ACS Survey. XII. Extending strong lensing to lower masses. The Astrophysical Journal. Vol. 803, pg. 71, 2015, https://doi.org/10.1088/0004-637X/803/2/71. [↩] [↩] [↩] [↩]
- R. Gavazzi, T. Treu, J. D. Rhodes, L. V. E. Koopmans, A. S. Bolton, S. Burles, R. J. Massey, L. A. Moustakas. The Sloan Lens ACS Survey. IV. The mass density profile of early-type galaxies out to 100 effective radii. The Astrophysical Journal. Vol. 667, pg. 176-190, 2007, https://doi.org/10.1086/519237. [↩] [↩] [↩] [↩]
- S. H. Suyu, V. Bonvin, F. Courbin, C. D. Fassnacht, C. E. Rusu, D. Sluse, T. Treu, K. C. Wong, M. W. Auger, X. Ding, S. Hilbert, P. J. Marshall, N. Rumbaugh, A. Sonnenfeld, M. Tewes, O. Tihhonova, A. Agnello, R. D. Blandford, G. C.-F. Chen, T. Collett, L. V. E. Koopmans, K. Liao, G. Meylan, C. Spiniello. H0LiCOW I. H0 Lenses in COSMOGRAIL’s Wellspring: program overview. Monthly Notices of the Royal Astronomical Society. Vol. 468, pg. 2590-2604, 2017, https://doi.org/10.1093/mnras/stx483. [↩]
- S. Vegetti, L. V. E. Koopmans. Statistics of mass substructure from strong gravitational lensing: quantifying the mass fraction and mass function. Monthly Notices of the Royal Astronomical Society. Vol. 400, pg. 1583-1592, 2009, https://doi.org/10.1111/j.1365-2966.2009.15559.x. [↩] [↩] [↩] [↩]
- S. Vegetti, L. V. E. Koopmans, A. Bolton, T. Treu, R. Gavazzi. Detection of a dark substructure through gravitational imaging. Monthly Notices of the Royal Astronomical Society. Vol. 408, pg. 1969-1981, 2010, https://doi.org/10.1111/j.1365-2966.2010.16865.x. [↩] [↩] [↩] [↩]
- D. Clowe, M. Bradač, A. H. Gonzalez, M. Markevitch, S. W. Randall, C. Jones, D. Zaritsky. A direct empirical proof of the existence of dark matter. The Astrophysical Journal. Vol. 648, pg. L109-L113, 2006, https://doi.org/10.1086/508162. [↩] [↩] [↩] [↩]
- M. Meneghetti, M. Bartelmann, H. Dahle, M. Limousin. Arc statistics. Space Science Reviews. Vol. 177, pg. 31-74, 2013, https://doi.org/10.1007/s11214-013-9981-x. [↩] [↩] [↩] [↩]
- M. Meneghetti, P. Natarajan, D. Coe, E. Contini, G. De Lucia, C. Giocoli, A. Acebron, S. Borgani, M. Bradač, J. M. Diego, A. Hoag, M. Ishigaki, T. L. Johnson, E. Jullo, R. Kawamata, D. Lam, M. Limousin, J. Liesenborgs, M. Oguri, K. Sebesta, K. Sharon, L. L. R. Williams, A. Zitrin. The Frontier Fields lens modelling comparison project. Monthly Notices of the Royal Astronomical Society. Vol. 472, pg. 3177-3216, 2017, https://doi.org/10.1093/mnras/stx2064. [↩] [↩] [↩] [↩]
- A. Acebron, E. Jullo, M. Limousin, A. Tilquin, C. Giocoli, M. Jauzac, G. Mahler, J. Richard. Hubble Frontier Fields: systematic errors in strong lensing models of galaxy clusters – implications for cosmography. Monthly Notices of the Royal Astronomical Society. Vol. 470, pg. 1809-1825, 2017, https://doi.org/10.1093/mnras/stx1330. [↩] [↩] [↩] [↩]
- S. Birrer, A. Amara. lenstronomy: multi-purpose gravitational lens modelling software package. Physics of the Dark Universe. Vol. 22, pg. 189-201, 2018, https://doi.org/10.1016/j.dark.2018.11.002. [↩]
- S. Birrer, A. Shajib, D. Gilman, A. Galan, J. Aalbers, M. Millon, R. Morgan, G. Pagano, J. Park, L. Teodori, N. Tessore, M. Ueland, L. Van de Vyvere, S. Wagner-Carena, E. Wempe, L. Yang, X. Ding, T. Schmidt, D. Sluse, M. Zhang, A. Amara. lenstronomy II: a gravitational lensing software ecosystem. Journal of Open Source Software. Vol. 6, pg. 3283, 2021, https://doi.org/10.21105/joss.03283. [↩]
- A. Sonnenfeld. The SLACS strong lens sample, debiased. Astronomy and Astrophysics. Vol. 697, pg. A95, 2025, https://doi.org/10.1051/0004-6361/202452846. [↩]
- A. S. Bolton, S. Burles, L. V. E. Koopmans, T. Treu, R. Gavazzi, L. A. Moustakas, R. Wayth, D. J. Schlegel. The Sloan Lens ACS Survey. V. The full ACS strong-lens sample. The Astrophysical Journal. Vol. 682, pg. 964-984, 2008, https://doi.org/10.1086/589327. [↩]
- M. W. Auger, T. Treu, A. S. Bolton, R. Gavazzi, L. V. E. Koopmans, P. J. Marshall, L. A. Moustakas, S. Burles. The Sloan Lens ACS Survey. X. Stellar, dynamical, and total mass correlations of massive early-type galaxies. The Astrophysical Journal. Vol. 724, pg. 511-525, 2010, https://doi.org/10.1088/0004-637X/724/1/511. [↩]
- A. Sonnenfeld, R. Gavazzi, S. H. Suyu, T. Treu, P. J. Marshall. The SL2S Galaxy-scale Lens Sample. III. Lens models, surface photometry, and stellar masses for the final sample. The Astrophysical Journal. Vol. 777, pg. 97, 2013, https://doi.org/10.1088/0004-637X/777/2/97. [↩]
- Y. D. Hezaveh, N. Dalal, D. P. Marrone, Y.-Y. Mao, W. Morningstar, D. Wen, R. D. Blandford, J. E. Carlstrom, C. D. Fassnacht, G. P. Holder, A. Kemball, P. J. Marshall, N. Murray, L. Perreault Levasseur, J. D. Vieira, R. H. Wechsler. Detection of lensing substructure using ALMA observations of the dusty galaxy SDP.81. The Astrophysical Journal. Vol. 823, pg. 37, 2016, https://doi.org/10.3847/0004-637X/823/1/37. [↩] [↩]
- D. Gilman, S. Birrer, A. Nierenberg, T. Treu, X. Du, A. Benson. Warm dark matter chills out: constraints on the halo mass function and the free-streaming length of dark matter with eight quadruple-image strong gravitational lenses. Monthly Notices of the Royal Astronomical Society. Vol. 491, pg. 6077-6101, 2020, https://doi.org/10.1093/mnras/stz3480. [↩] [↩]
- A. J. Shajib, G. Vernardos, T. E. Collett, V. Motta, D. Sluse, L. L. R. Williams, P. Saha, S. Birrer, C. Spiniello, T. Treu. Strong lensing by galaxies. Space Science Reviews. Vol. 220, pg. 87, 2024, https://doi.org/10.1007/s11214-024-01105-x. [↩] [↩] [↩]
- P. Natarajan, L. L. R. Williams, M. Bradač, C. Grillo, A. Ghosh, K. Sharon, J. Wagner. Strong lensing by galaxy clusters. Space Science Reviews. Vol. 220, pg. 19, 2024, https://doi.org/10.1007/s11214-024-01051-8. [↩] [↩] [↩]
- D. Gilman, S. Birrer, T. Treu. TDCOSMO III. Dark matter substructure meets dark energy: effects of (sub)halos on strong-lensing measurements of H0. Astronomy and Astrophysics. Vol. 642, pg. A194, 2020, https://doi.org/10.1051/0004-6361/202038829. [↩] [↩]
- N. Anau Montel, A. Coogan, C. Correa, K. Karchev, C. Weniger. Estimating the warm dark matter mass from strong lensing images with truncated marginal neural ratio estimation. Monthly Notices of the Royal Astronomical Society. Vol. 518, pg. 2746-2760, 2023, https://doi.org/10.1093/mnras/stac3215. [↩] [↩]
- S. Vegetti, S. Birrer, G. Despali, C. D. Fassnacht, D. Gilman, Y. Hezaveh, L. Perreault Levasseur, J. P. McKean, D. M. Powell, C. M. O’Riordan, G. Vernardos. Strong gravitational lensing as a probe of dark matter. Space Science Reviews. Vol. 220, pg. 58, 2024, https://doi.org/10.1007/s11214-024-01087-w. [↩] [↩]
- S. Wagner-Carena, J. Aalbers, S. Birrer, E. O. Nadler, E. Darragh-Ford, P. J. Marshall, R. H. Wechsler. From images to dark matter: end-to-end inference of substructure from hundreds of strong gravitational lenses. The Astrophysical Journal. Vol. 942, pg. 75, 2023, https://doi.org/10.3847/1538-4357/aca525. [↩]
- N. Tessore, R. B. Metcalf. The elliptical power law profile lens. Astronomy and Astrophysics. Vol. 580, pg. A79, 2015, https://doi.org/10.1051/0004-6361/201526773. [↩]
- E. Ritondale, S. Vegetti, G. Despali, M. W. Auger, L. V. E. Koopmans, J. P. McKean. Low-mass halo perturbations in strong gravitational lenses at redshift z approximately 0.5 are consistent with CDM. Monthly Notices of the Royal Astronomical Society. Vol. 485, pg. 2179-2193, 2019, https://doi.org/10.1093/mnras/stz464. [↩]
- Q. Minor, S. Gad-Nasr, M. Kaplinghat, S. Vegetti. An unexpected high concentration for the dark substructure in the gravitational lens SDSSJ0946+1006. Monthly Notices of the Royal Astronomical Society. Vol. 507, pg. 1662-1683, 2021, https://doi.org/10.1093/mnras/stab2247. [↩]
- J. W. Nightingale, R. J. Smith, Q. He, C. M. O’Riordan, J. A. Kegerreis, A. Amvrosiadis, A. C. Edge, A. Etherington, R. G. Hayes, A. Kelly, J. R. Lucey, R. J. Massey. Abell 1201: detection of an ultramassive black hole in a strong gravitational lens. Monthly Notices of the Royal Astronomical Society. Vol. 521, pg. 3298-3322, 2023, https://doi.org/10.1093/mnras/stad587. [↩]
- A. Etherington, J. W. Nightingale, R. Massey, S.-I. Tam, X. Cao, A. Niemiec, Q. He, A. Robertson, R. Li, A. Amvrosiadis, S. Cole, J. M. Diego, C. S. Frenk, B. L. Frye, D. Harvey, M. Jauzac, A. M. Koekemoer, D. J. Lagattuta, S. Lange, M. Limousin, G. Mahler, E. Sirks, C. L. Steinhardt. Strong gravitational lensing’s ‘external shear’ is not shear. Monthly Notices of the Royal Astronomical Society. Vol. 531, pg. 3684-3697, 2024, https://doi.org/10.1093/mnras/stae1375. [↩] [↩]
- G. Despali, S. Vegetti, S. D. M. White, C. Giocoli, F. C. van den Bosch. Modelling the line-of-sight contribution in substructure lensing. Monthly Notices of the Royal Astronomical Society. Vol. 475, pg. 5424-5442, 2018, https://doi.org/10.1093/mnras/sty159. [↩]
- J.-W. Hsueh, W. Enzi, S. Vegetti, M. W. Auger, C. D. Fassnacht, G. Despali, L. V. E. Koopmans, J. P. McKean. SHARP VII. New constraints on the dark matter free-streaming properties and substructure abundance from gravitationally lensed quasars. Monthly Notices of the Royal Astronomical Society. Vol. 492, pg. 3047-3059, 2020, https://doi.org/10.1093/mnras/stz3177. [↩]