
Abstract
AI depends on data centers, which need large amounts of electricity and capital to build. Energy efficiency at these facilities is usually treated as an engineering question, but it may also shape how that construction is financed. This review asks whether Power Usage Effectiveness (PUE), the standard efficiency metric, affects cash flow, collateral value, debt capacity and therefore cost of capital, and under what conditions that linkage holds. Sources included engineering literature, government energy reports, empirical studies of energy performance in other property markets, and public rating methodologies for data center securitizations. Public data does not show that a specific PUE number produces a specific rating or bond price, but engineering research and rating-agency methodology point to indirect connections. When the operator pays the power bill, better efficiency lowers operating costs directly. Where tenants pay for power, the more common arrangement for large facilities, efficiency can still affect occupancy costs and lease renewal. These factors feed into the cash flow and collateral assessments rating agencies evaluate. Evidence from commercial and residential mortgage markets shows efficient buildings default less often, though the measured effect on borrowing cost is small. No public data assigns a given PUE value to a specific rating, loan-to-value or credit spread, and securitization data describes stabilized, built-to-suit assets rather than the project financing stage where the efficiency investment is made. The evidence is best treated as a plausible hypothesis rather than a demonstrated one; transaction-level data would be needed to measure the effect precisely.
Keywords: data center energy efficiency, Power Usage Effectiveness, asset-backed securities, structured finance, capital formation
Introduction
Why This Matters
Artificial intelligence is driving a rapid expansion of digital infrastructure. Although AI is usually discussed in terms of models and software, its continued growth also depends on physical facilities capable of supplying large amounts of computing power. Those facilities require substantial and reliable supplies of electricity. The International Energy Agency estimates data centers used about 415 terawatt-hours of electricity in 2024, around 1.5% of all electricity used on Earth, and projects that to climb to roughly 945 terawatt-hours by 2030, with AI driving most of the increase1. In the U.S. specifically, Lawrence Berkeley National Lab estimated data centers used about 4.4% of the country’s electricity in 2023, and that could hit somewhere between 6.7% and 12% by 2028, depending on how fast things grow2.
Developing this infrastructure requires substantial capital investment from the largest tech companies, which exceeded $400 billion in 2025 and is expected to grow by another 75% in 2026. JLL projects the global data center market will grow about 14% a year through 2030, adding almost 100 gigawatts of new capacity, which is close to doubling existing global capacity3.
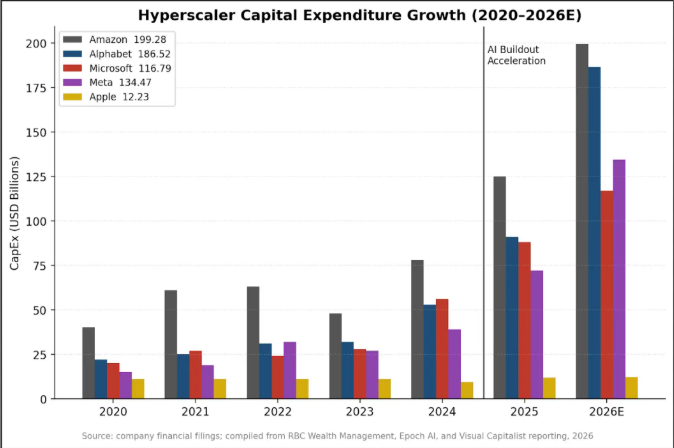
Amazon leads in absolute spend with capex projected to reach $199 billion in 2026. Both Alphabet and Microsoft capex have roughly doubled year over year in 2025 and are projected to do the same in 2026. As capital expenditures are expected to grow into the hundreds of billions of dollars, the ability to operate efficient facilities and access capital effectively has become increasingly important for sustaining future expansion.
Electricity is usually 40 to 60% of a data center’s operating cost. The industry measures facility-level energy efficiency using Power Usage Effectiveness, or PUE, which is calculated by dividing total facility energy use by the energy consumed by IT equipment. PUE therefore captures the additional energy required for items such as cooling, power distribution, lighting, and other building systems. It does not measure how efficiently the servers themselves perform computations4. A theoretical PUE of 1.0 would mean that all facility energy was consumed by IT equipment, with no additional energy required for cooling or other supporting systems. Google reports a fleet-wide PUE around 1.09; the industry average is closer to 1.54 to 1.565. As Section 3.2 describes, this kind of PUE comparison needs to be used carefully, as it is not always reliable basis for comparing facilities when they are using different cooling technologies. In addition, continuously operating facilities, even modest differences in PUE can produce substantial differences in annual electricity consumption.
The ability to source power itself is becoming a constraint as well. The IEA estimates that about 20% of planned data center projects worldwide could face delays because the local power grid can’t connect them fast enough, and building new transmission lines can take four to eight years1. In Frankfurt, data centers already use 42% of local electricity. In Dublin, it’s closer to 80%6. In some places, whether a project gets built at all now depends on power availability more than on investor demand. In addition, there is growing public backlash against data center construction, as local consumers do not want increased electricity prices or grid instability.
Objective
Much of the existing literature treats data-center efficiency as an engineering or environmental question: how facilities can cut electricity use, emissions, and pressure on the grid. This review asks a more specific question which is not simply whether energy efficiency and financing efficiency are connected, and if four specific links hold up: 1) whether lower PUE mechanically reduces a facility’s electricity use for a given IT load (a matter of definition), 2) where an operator as opposed to a tenant pays for electricity, does this reduce operating cost and strengthen cash flow (will depend upon specific lease), 3) how rating agencies factor in cash flow, collateral value, and technological competitiveness (including power efficiency) into their analysis of how much debt a facility can support (this link is described in public methodology, but not quantitatively material) and 4) does a greater quantum of debt lead to a lower required equity share and therefore a lower cost of capital (a direct consequence of 3). The sections below evaluate each link independently rather than assume the chain holds across all four.
Public data doesn’t show that a specific PUE number produces a specific credit rating or bond price. The narrower question here is whether efficiency affects cash flow and long-term competitiveness enough to show up in how rating agencies assess debt capacity.
Interest in this topic came from two areas that don’t usually overlap: studying AI’s energy footprint from an environmental angle and separately learning how data centers actually get financed. These two areas were more connected than initially suggested, though as the Results and Discussion show, the connection is more conditional than the author had originally expected.
The scope stays narrow on purpose: large, AI-oriented data centers, facilities where most of the critical IT load supports training or inference, with liquid cooling, with the financing analysis centered on U.S. asset-backed securities and structured finance markets, where documentation is most publicly available. Precise leverage and advance-rate data on individual deals isn’t always public, which limits how precisely some claims can be quantified. This review was undertaken by locating sources and screening them iteratively. No claim of exhaustive coverage is made.
Literature Review
The significance of energy efficiency in buildings has been studied for about 15 years primarily in office and residential markets. Many findings state that energy-certified buildings command rent and price premiums7,8,9,10,11 Related work examines what tenants are willing to pay for specific green features, whether certification reflects real operating performance, and the returns to sustainability in private equity real estate12,13,14. The most recent estimate from a study of Western European offices puts operating income at around 12% higher and transaction prices at around 10% higher than comparable noncertified15 buildings. The advantage comes from the building earning more, rather than buyer preference, which is the same pathway that this review applies to data centers. However, the US certified properties showed higher rent, occupancy, and price levels, although there was no increase in rental growth. 16
There is a well-established link between efficiency and credit performance already. More efficient buildings experience fewer defaults across three collateral types. The odds of default on an ENERGY STAR home in 71,062 US residential mortgages were about a third lower. 17Data from Dutch Loans that were matched to buildings’ energy ratings show similar trend, with a stronger effect for low-income borrowers, as utility bill reductions have a greater impact on savings for this population. 18 In securitized commercial collateral, 6304 office CMBS loans showed that green buildings carried 34% less default risk19. Many other related works found comparable associations between the credit risk of a property and its energy efficiency20,21,22,23. A one-point improvement in HERS score reduced default odds by 4% and default risk falls as LEED points and Energy star scores rise17,19 It is worth noting that An and Pivo included debt service coverage in their model so cash flow benefit would have already factored in. The effect on risk of default still held, as green buildings tend to appreciate more, which further lowers loan to value. 19.
The existing link from efficiency to cost of debt is shallow. Green certifications at the origination of the loan are only worth from 11.5 to 14.6 basis points of spread on commercial mortgages, which is seemingly economically negligible against overall default rates19,24. Green bonds are priced around two basis points below conventional ones, and green corporate bonds are three to eight basis points lower25,26. The pricing effect is consistent, but too small to make a big difference in capital structure27,28,29.
The certification is not a good enough representation for the underlying economics. Two findings explain why a certification should not be used as sole evidence for financial performance. Energy labels showed no additional variance in pricing once operating expenses, net operating income, and capitalization rates were controlled variables30. Whether the project was genuinely green did not have an impact on green bond premium26. Therefore, the energy cost exposure itself is what impacts value and risk, rather than the label. From another direction, a single ratio such as PUE can also be a weak basis for comparison: swapping an economizer cooling system with a different type of economizer due to climate conditions alone increased modelled PUE by 0.05. 31Therefore, PUE may not be an incredibly accurate measure of how well a facility is being run.
This data does not directly cover data centers, however. Property value evidence refers to offices and homes while the default data refers to residential, multifamily, and office collateral. Therefore, data centers may differ in many significant ways as power is a much larger portion of operating cost, leases are longer, and the assets are built for one single purpose. This review acknowledges this gap and specifies what transaction level evidence, such as PUE being linked to advance rates and bonds spreads at issuance, would prove the distinction of efficiency effects on data centers specifically.
Methods
Sources came from Google Scholar, IEEE Xplore, arXiv, government reports, and the public methodology pages of the major credit rating agencies, covering material published between 2019 and mid-2026. Searches used terms including data center energy efficiency, Power Usage Effectiveness, AI workload electricity consumption, data center ABS, data center securitization, and data center rating methodology. A source was included if it addressed facility energy performance, AI computing demand, data-center financing, or credit analysis. Primary sources — actual rating-agency criteria and engineering studies rather than summaries of them — were prioritized over trade and vendor publications, since a lot of the important detail about how these deals get sized doesn’t show up in secondary sources.
The findings fell into a few different categories of certainty. Some relationships are true by definition or direct calculation, like the math behind PUE itself. Others depend on facility or lease structure, like whether efficiency actually strengthens cash flow. And some are proposed connections, like a direct link between PUE and bond spreads, that public data hasn’t demonstrated yet. No systematic screening log (e.g., number of sources identified, screened, excluded) was kept during this search process, since it was conducted as an iterative narrative review rather than a systematic review under a registered protocol.
This review draws on source types with varying evidentiary weight, 1) peer-reviewed engineering papers for efficiency and cooling claims, 2) government and inter-agency reports and rating agency criteria for electricity demand and rating methodology claims, and corporate press releases for specific, verifiable figures, as opposed to industry wide practice. Peer-reviewed academic literature on data center capital structure and securitizations is not readily available given the nascency of the asset class. This is disclosed as a limitation rather than treating all sources as equivalent.
Results
AI’s Energy Demand: The Scaling Problem
Global data center electricity use has grown about 12% a year since 2017, more than four times faster than electricity demand overall1. AI workloads make this harder to predict than regular computing, because energy use per task varies enormously depending on the model, the hardware, and how the system is set up. One comparison study found large differences in energy use between simple task-specific models and large general-purpose ones, which is part of why there is not a single clean energy-per-query number that means anything at scale32.
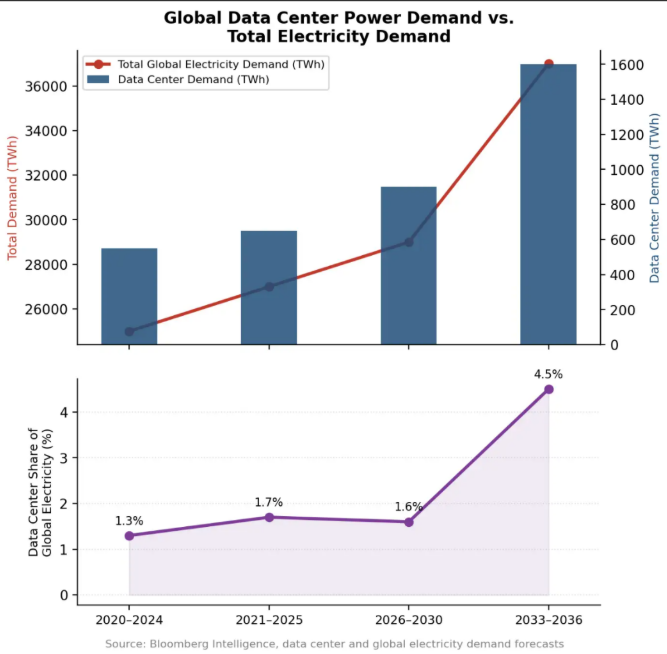
The chart above illustrates the growth trajectories between data center electricity consumption and total global electricity demand. Data center demand was up 17% in 2025 versus roughly 3% growth in overall global electricity use. Data center consumption is projected to double to approximately 950 terawatt-hours by 2030 and could represent over 5% of global electricity by 2035, compared to under 2% today.
A facility supporting a constant 100 MW IT load at a PUE of 1.5 requires 150 MW of total facility power. The same IT load at a PUE of 1.2 requires 120 MW. The 30 MW difference represents additional facility energy used for cooling, power distribution, and other support systems while delivering the same IT capacity. At large scale, even modest differences in facility overhead can therefore create substantial differences in electricity consumption and operating expense.
Computational and Facility Efficiency
Energy use can be reduced at two different levels. First, improvements in chips, model architecture, batching, compression, and workload management can reduce the amount of electricity the computing itself needs. The second is facility efficiency: cooling systems, power conversion, and electrical distribution determine how much additional energy is required to support the IT equipment.
PUE measures the second category, not the first. A model can become more energy-efficient without changing the facility’s PUE, and a facility can achieve a low PUE even if its servers use substantial energy per computation. Computational efficiency and facility efficiency are therefore complementary, but they should not be treated as interchangeable measures.
Among facility-level improvements, cooling has one of the largest direct effects on PUE. In conventional air-cooled facilities, it can account for 30% to 40% of total facility electricity use. Different cooling approaches are associated with different PUE ranges: . Conventional air-cooled facilities typically run at PUE of around 1.5 to 1.8. Air cooling with better containment runs at roughly 1.3 to 1.5. Direct-to-chip liquid cooling, which is becoming standard for AI-dense racks, gets to about 1.1 to 1.25. Full immersion cooling, the most advanced approach, can land as low as 1.02 to 1.0433. These figures should be read as a general, illustrative association. Vertiv and NVIDIA’s own analysis found that a shift from fully air-cooled to 75% direct-to-chip liquid cooling cut facility power by 10.2% but PUE by only 3.3% because liquid cooling changes both the numerator and denominator of the PUE ratio at the same time, and this source recommends Total Usage Effectiveness (TUE) as the better metric for comparing across cooling technologies34 A peer-reviewed measurement study of real operating facilities also found PUE varying between 1.4 and 3.0 withing a single cooling category depending upon airflow management. This underscores the fact that cooling technology labels may not be a good predictor of a facility’s actual PUE35 .A joint industry study on liquid cooling found it reduced total data center power by more than 10% in optimized deployments36.
These savings add up to real money. One industry estimate found that a 1-megawatt facility upgrading from a PUE of 1.8 to 1.5 saves around $262,000 a year in electricity37. How much this could scale to a larger facility depends heavily on the assumptions utilized, as discussed below.
These efficiency mechanisms do require upfront expenditures. Retrofitting an older building with liquid cooling is expensive and disruptive. Efficiency is therefore a capital decision as much as a technical one. Operators who already have strong cash flow and regular access to capital are the same ones who can afford to become more efficient in the first place.
How Data Center Debt Is Actually Structured
To see how any of this could connect to financing, it helps to understand roughly how a data center deal gets built and rated. Most large securitizations are structured as a master trust where the company pledges a group of data centers and their tenant leases to a trust, and the trust issues bonds backed by the cash flows those leases generate. When a new building is finished, it can be added to the trust as more collateral, and more debt can be issued against it without starting an entirely new deal from scratch.
This market has grown fast. KBRA reported $48.7 billion in U.S. data center securitization issuance across 88 deals through May 2025, with asset-backed securities making up about 71% of that and commercial mortgage-backed securities making up the rest38. These are mostly built, already-operating buildings with real tenants. It is important to understand what this type of debt finances. KBRA’s own market report states that ABS and CMBS are generally backed by built, stabilized, cash-flowing assets with little or no remaining construction or lease-up risk. Construction-stage assets are financed through project finance or construction debt38 The efficiency investment discussed in this review, including the choice of cooling technology is made during the construction period where the creditworthiness of the project is more a function of sponsor credit and construction budget, as opposed to a PUE measure that doesn’t yet exist. Rating agencies and their methodologies relate to the later, stabilized stage. This stage does often refinance the construction debt, as illustrated by DataBank’s 2025 issuance below, albeit public disclosure does not specifically address whether efficiency affected the transaction’s size or pricing.
Fitch’s criteria lay out the process clearly. The agency takes property revenue, subtracts operating expenses and capital spending, and arrives at what it calls sustainable net cash flow. That cash flow feeds into an assessed value for the property, which then gets tested against leverage limits for each rating category to determine how much debt the deal can support39. The amount of debt supported at each rating level depends on the agency’s assessment of sustainable cash flow, collateral value, tenant quality, and leverage. Stronger operating economics can therefore affect financing capacity even when they do not directly change the bond’s market spread40.
Where Efficiency Enters the Rating Decision
KBRA’s 2026 methodology includes Power Use Efficiency among the factors it considers in addition to cash flow, lease rollover risk, and residual value41. Fitch treats outdated technology, including power efficiency, as something that can cap how high a rating goes, and separately considers power access and how well an asset will hold up as technology changes39. Both agencies list power efficiency as one factor amongst several others including tenant credit, lease term, and market dynamics, but do not provide how much weight power efficiency carries relative to the others. This review could not source a transaction-level data set to establish the materiality of efficiency in the rating outcome. As such, the claim is more accurately that efficiency is an input into financing, but the overall sensitivity to that input is not publicly disclosed.
There are two separate financial paths here, and which one is operative depends upon the lease. If the operator, rather than the tenant, pays the power bill, a lower PUE means lower costs and stronger operating cash flow directly. However, most large, US data center securitizations are backed by facilities with long term leases to hyperscalers who typically bear their own power costs38, so the direct PUE pathway doesn’t apply. Instead, the PUE relevance involves a slower, secondary path, an inefficient building is comparatively worse deal to lease and harder to re-lease again when a lease expires. That risk shows up as lease renewal and refinancing risk, rather than near-term, cash-flow. This distinction is particularly prevalent in AI data centers since Fitch treats these facilities as more location flexible and therefore more volatile than ones that serve traditional enterprises, a consideration that is independent of PUE and could outweigh it in either direction42
A simple example illustrates the potential scale of the underlying cost mechanism, separate from the effect on the rating. Suppose two data centers each support a constant 100 MW IT load and pay $0.08 per kilowatt-hour for electricity running continuously with no downtime. One operates at a PUE of 1.2 and spends approximately $84 million per year on electricity. The other operates at a PUE of 1.5 and spends approximately $105 million. That represents a difference of roughly $21 million in annual electricity expense for facilities supporting the same IT load. This estimate is sensitive to several assumptions, electricity price, utilization, and load factor. A facility running at 80% utilization or with a lower contracted power price could show a smaller dollar difference. Where the operator bears the power cost, this difference could possibly strengthen cash flow available to support debt. It would not by itself determine a credit rating or debt amount, since those outcomes also depend on tenant quality, lease terms, collateral value, and transaction structure.
DataBank’s September 2025 issuance provides a useful market example43. The company raised $1.1 billion through the first data-center ABS to receive ratings from both S&P and Moody’s. The issuance was also marketed as a green bond. However, the publicly available transaction information does not isolate the effect of facility efficiency on either the ratings or the amount of debt issued. This should rather be read as an example of refinancing new construction into stabilized financing, and efficiency alone can’t be seen as in itself changing deal terms.
Cash-flow differences can translate into financing capacity. For example, if a rating agency allowed debt up to 12 times sustainable net cash flow per a given rating, then a $21mm cash flow increase could lead to $250mm more of debt, all else equal. This is illustrative only, as in reality, other factors such as stressed cash flow, residual values, or tenant default analysis would be incorporated as well.
From Rating Viability to Capital Formation
Bond spreads depend on a lot of things, including market conditions, liquidity, and how many other data center deals are in the market. Public data do not allow the independent effect of PUE on spreads to be isolated from these other variables.
The idea that better cash flow and better collateral quality allow a deal to support more debt at a given rating and therefore reduce the percentage of equity funding and result in a lower weighted average cost of capital is a well-established corporate finance concept44. There are other assumption to consider including whether the price of additional debt would also rise, the tax consequences of additional interest expense, effect on traditional equity returns, and ability to refinance the transaction. This review is not independently demonstrating its financing effect.
A fulsome analysis of other factors would examine tenant credit quality (well-rated credits can support debt independent of PUE), facility age (new facilities have better PUE generally), market and location characteristics (especially access to power), sponsor track record (experienced sponsors have access to better operators), interest rate levels (can make project harder to finance in high rate environments), and factors that affect lease terms including redundancy and uptime. Once transaction level data is available at scale, PUE- financing link would need to control for these factors, among others.
Strength of the Evidence
Returning to the four ideas in the Objective, the first A lower PUE reduces total facility electricity for the same IT load is just math, true by definition. The second, whether this reduction improves operator cash flow, is true if the operator bears the cost (and this is a minority of large securitizations). The third, whether rating agencies consider efficiency into debt ratings is supported by rating agency methodology papers, described as “considered”, however no data was available to assess the materiality of the metric. The fourth, that an ability to incur more debt with a more efficient facility and therefore incur a lower cost of capital, is possible but not conclusive because other factors need to be considered such as debt pricing and tax effects, and these items were not available from public sources. What isn’t supported at all is the idea that energy performance by itself produces tighter credit spreads; public evidence doesn’t go that far.
Discussion
Alternative Explanations and Limits
Tenant credit quality may actually be the most important factor of all. A long lease to a company like Microsoft provides steady, predictable revenue even if the building itself isn’t the most efficient one around, which weakens how much PUE matters for capital formation. The strength of the sponsor is highly correlated to other factors such as facility age, tenant credit, and could be one of the strongest factors as well.
Many leases pass electricity costs straight to the tenant, which mostly cancels out the immediate cash-flow argument, as discussed above. The effect likely still shows up later, at renewal, when an inefficient building becomes a worse deal for the tenant, but there isn’t solid public data on how much rating agencies discount for that specifically, so this part of the argument is weaker than the others. European office evidence is relevant to this point, as certified building generated operating income that was 12% higher than comparable non-certified buildings. That is evidence of a similar link, backed by a market where transaction data actually exists.
Becoming efficient costs money. Retrofits are expensive and disruptive, so the most efficient design on paper isn’t automatically the smartest financial decision, especially for an older building. As mentioned already, strong sponsors with experienced operators may already have strong cash-flow and have invested in systems that incur strong PUE.
There is also a circular issue. Efficiency gains don’t necessarily lower total energy use, since cheaper computing tends to get used more. This is sometimes called the rebound effect, or Jevons’ paradox45. This describes aggregate industry demand, as opposed to the demand of a singular facility, the focus of this review. As efficiency improves steadily, and total demand keeps climbing anyway because there’s more usage to absorb the gains1. This is particularly relevant to the financing argument where if there is an industry wide build-out, the power availability constraints may be the most binding constraint, as opposed to operating cash flow.
Implications
For operators, efficiency is a financing decision as much as a facilities one, though its direct effect on power costs applies only to operator-pays the lease arrangements, but it may also affect how much debt a stabilized building can eventually support. For lenders and investors, PUE shouldn’t replace full credit analysis, but it deserves to be tracked explicitly, along with the other factors noted above, rather than buried inside a general expense line, especially as older buildings start to look outdated next to newer, more efficient competitors. For policymakers, efficiency standards and better disclosure could affect more than emissions numbers; they could affect which projects are able to get financed and built at all in power-constrained markets.
Limitations
No public dataset connects individual buildings’ PUE directly to their actual advance rate or bond spread, so what’s offered here is illustrative and directional rather than a precise dollar-for-dollar relationship. This review is also a narrative rather than a systematic review, no formal log of sources that were identified, screened, excluded was kept and this should be weighed alongside the review’s conclusions. Peer-reviewed literature specific to data center capital formation is sparse for the reasons described in Methods and this review relied heavily on rating agency published criteria, which are not typically peer-reviewed. Different types of data centers — companies that own and run their own buildings versus those that lease space to other tenants — handle power costs differently, so results from one type shouldn’t be assumed to apply to the other. This is also still a fairly young corner of the bond market; data center deals and their underlying rating methodologies haven’t been tested across multiple market cycles yet. The closest available evidence sits in other asset classes, but not yet for data centers.
Conclusion
AI cannot scale on better algorithms alone. It needs electricity, physical buildings, and money, and energy efficiency touches all three. What this review can establish is narrower than what an earlier framing of the question might suggest. Lower PUE mechanically reduces a facility’s electricity consumption, and published rating agency criteria do consider it among other factors. It is plausible that improved operating cash flow would lead to lower cost of capital, all other factors (e.g. interest costs taxes) held constant, however this was not conclusive. A possible hypothesis for future research could be to determine the actual size of this effect, while controlling for other factors, once more data is available as the market matures.
References
- International Energy Agency. Energy and AI. IEA, 2025, https://www.iea.org/reports/energy-and-ai. [↩] [↩] [↩] [↩]
- A. Shehabi, A. Newkirk, S. J. Smith, A. Hubbard, N. Lei. 2024 United States data center energy usage report. Lawrence Berkeley National Laboratory, 2024, https://eta-publications.lbl.gov/publications/2024-lbnl-data-center-energy-usage-report. [↩]
- JLL. 2026 global data center outlook. JLL, 2026, https://jll.com/en-us/insights/market-outlook/data-center-outlook. [↩]
- International Organization for Standardization. ISO/IEC 30134-2:2026: power usage effectiveness (PUE). ISO, 2026, https://www.iso.org/standard/30134-2. [↩]
- Google Data Centers. Power usage effectiveness. Google, 2026, https://datacenters.google/efficiency/. [↩]
- Brookings Institution. Global energy demands within the AI regulatory landscape. Brookings Institution, 2026, https://www.brookings.edu/articles/global-energy-demands-within-the-ai-regulatory-landscape/. [↩]
- P. Eichholtz, N. Kok, J. M. Quigley. Doing well by doing good? Green office buildings. American Economic Review. Vol. 100, pg. 2492-2509, 2010, https://doi.org/10.1257/aer.100.5.2492. [↩]
- P. Eichholtz, N. Kok, J. M. Quigley. The economics of green building. The Review of Economics and Statistics. Vol. 95, pg. 50-63, 2013, https://doi.org/10.1162/REST_a_00291. [↩]
- F. Fuerst, P. McAllister. Green noise or green value? Measuring the effects of environmental certification on office values. Real Estate Economics. Vol. 39, pg. 45-69, 2011, https://doi.org/10.1111/j.1540-6229.2010.00286.x. [↩]
- Y. Deng, Z. Li, J. M. Quigley. Economic returns to energy-efficient investments in the housing market: evidence from Singapore. Regional Science and Urban Economics. Vol. 42, pg. 506-515, 2012, https://doi.org/10.1016/j.regsciurbeco.2011.04.004. [↩]
- G. Pivo, J. D. Fisher. Income, value, and returns in socially responsible office properties. Journal of Real Estate Research. Vol. 32, pg. 243-270, 2010, https://doi.org/10.1080/10835547.2010.12091281. [↩]
- S. A. Bond, A. Devine. Certification matters: is green talk cheap talk? The Journal of Real Estate Finance and Economics. Vol. 52, pg. 117-140, 2016, https://doi.org/10.1007/s11146-015-9499-y. [↩]
- S. Robinson, R. Simons, E. Lee, A. Kern. Demand for green buildings: office tenants’ stated willingness-to-pay for green features. Journal of Real Estate Research. Vol. 38, pg. 423-452, 2016, https://doi.org/10.1080/10835547.2016.12091450. [↩]
- A. Devine, A. Sanderford, C. Wang. Sustainability and private equity real estate returns. The Journal of Real Estate Finance and Economics. Vol. 68, pg. 161-187, 2024, https://doi.org/10.1007/s11146-022-09914-z. [↩]
- C. Ghosh, M. T. Petrova. Building sustainability, certification, and price premiums: evidence from Europe. Journal of Real Estate Research. Vol. 46, pg. 514-537, 2024, https://doi.org/10.1080/08965803.2023.2267717. [↩]
- R. Holtermans, N. Kok. On the value of environmental certification in the commercial real estate market. Real Estate Economics. Vol. 47, pg. 685-722, 2019, https://doi.org/10.1111/1540-6229.12223. [↩]
- N. Kaza, R. G. Quercia, C. Y. Tian. Home energy efficiency and mortgage risks. Cityscape. Vol. 16, pg. 279-298, 2014. [↩] [↩]
- M. Billio, M. Costola, L. Pelizzon, M. Riedel. Buildings’ energy efficiency and the probability of mortgage default: the Dutch case. The Journal of Real Estate Finance and Economics. Vol. 65, pg. 419-450, 2022, https://doi.org/10.1007/s11146-021-09838-0. [↩]
- X. An, G. Pivo. Green buildings in commercial mortgage-backed securities: the effects of LEED and Energy Star certification on default risk and loan terms. Real Estate Economics. Vol. 48, pg. 7-42, 2020, https://doi.org/10.1111/1540-6229.12228. [↩] [↩] [↩] [↩]
- G. Pivo. The effect of sustainability features on mortgage default prediction and risk in multifamily rental housing. Journal of Sustainable Real Estate. Vol. 5, pg. 149-170, 2013, https://doi.org/10.1080/10835547.2014.12091854. [↩]
- G. Pivo. Walk Score: the significance of 8 and 80 for mortgage default risk in multifamily properties. Journal of Sustainable Real Estate. Vol. 6, pg. 187-210, 2014, https://doi.org/10.1080/10835547.2014.12091859. [↩]
- G. Pivo, J. D. Fisher. The walkability premium in commercial real estate investments. Real Estate Economics. Vol. 39, pg. 185-219, 2011, https://doi.org/10.1111/j.1540-6229.2010.00296.x. [↩]
- X. An, Y. Deng, J. B. Nichols, A. B. Sanders. Local traits and securitized commercial mortgage default. The Journal of Real Estate Finance and Economics. Vol. 47, pg. 787-813, 2013, https://doi.org/10.1007/s11146-013-9431-2. [↩]
- P. Eichholtz, R. Holtermans, N. Kok, E. Yonder. Environmental performance and the cost of debt: evidence from commercial mortgages and REIT bonds. Journal of Banking & Finance. Vol. 102, pg. 19-32, 2019, https://doi.org/10.1016/j.jbankfin.2019.02.015. [↩]
- O. D. Zerbib. The effect of pro-environmental preferences on bond prices: evidence from green bonds. Journal of Banking & Finance. Vol. 98, pg. 39-60, 2019, https://doi.org/10.1016/j.jbankfin.2018.10.012. [↩]
- J. Caramichael, A. C. Rapp. The green corporate bond issuance premium. Journal of Banking & Finance. Vol. 162, art. 107126, 2024, https://doi.org/10.1016/j.jbankfin.2024.107126. [↩] [↩]
- C. Flammer. Corporate green bonds. Journal of Financial Economics. Vol. 142, pg. 499-516, 2021, https://doi.org/10.1016/j.jfineco.2021.01.010. [↩]
- D. Y. Tang, Y. Zhang. Do shareholders benefit from green bonds? Journal of Corporate Finance. Vol. 61, 2020, https://doi.org/10.1016/j.jcorpfin.2018.12.001. [↩]
- S. Fatica, R. Panzica. Green bonds as a tool against climate change? Business Strategy and the Environment. Vol. 30, pg. 2688-2701, 2021, https://doi.org/10.1002/bse.2771. [↩]
- D. Jaffee, R. Stanton, N. Wallace. Energy factors, leasing structure and the market price of office buildings in the U.S. The Journal of Real Estate Finance and Economics. Vol. 59, pg. 329-371, 2019, https://doi.org/10.1007/s11146-018-9676-x. [↩]
- J. Kim, D. U. Shin, H. Kim. Data center energy evaluation tool development and analysis of power usage effectiveness with different economizer types in various climate zones. Buildings. Vol. 14, art. 299, 2024, https://doi.org/10.3390/buildings14010299. [↩]
- A. S. Luccioni, Y. Jernite, E. Strubell. Power hungry processing: watts driving the cost of AI deployment? Proceedings of the 2024 ACM Conference on Fairness, Accountability, and Transparency. pg. 85-99, 2024, https://doi.org/10.1145/3630106.3658542. [↩]
- K. Haghshenas, B. Setz, Y. Blosch, M. Aiello. Enough hot air: the role of immersion cooling. Energy Informatics. Vol. 6, art. 14, 2023, https://doi.org/10.1186/s42162-023-00269-0. [↩]
- Vertiv. Understanding the limitations of PUE in evaluating liquid cooling efficiency. Vertiv, 2023, https://www.vertiv.com/en-us/about/news-and-events/articles/blog-posts/understanding-the-limitations-of-pue-in-evaluating-liquid-cooling-efficiency/. [↩]
- A. Abdilla, S. P. Borg, J. Licari. Relating measured PUE to the cooling strategy and operating conditions through a review of a number of Maltese data centres. Energy Reports. Vol. 13, pg. 2612-2623, 2025, https://doi.org/10.1016/j.egyr.2025.02.013. [↩]
- Vertiv, NVIDIA. Liquid and immersion cooling options for data centers. Vertiv and NVIDIA, 2021, https://www.vertiv.com/en-emea/solutions/learn-about/liquid-cooling-options-for-data-centers/. [↩]
- Avid Solutions. Data center modernization cuts energy costs by 40%. Avid Solutions, 2025, https://avidsolutionsinc.com/data-center-modernization-cuts-energy-costs-by-40/. [↩]
- Kroll Bond Rating Agency. Data centers: a comparison of ABS and CMBS structures. KBRA, 2025, https://www.kbra.com/publications/wtXJZSZt. [↩] [↩] [↩]
- Fitch Ratings. Fitch Ratings publishes data center securitizations rating criteria. Fitch Ratings, 2025, https://www.fitchratings.com/research/structured-finance/fitch-ratings-publishes-data-center-securitizations-rating-criteria-16-09-2025. [↩] [↩]
- RBC Capital Markets. The infrastructure revolution: understanding data center securitization. RBC Capital Markets, 2025, https://www.rbccm.com/en/insights/2025/12/the-infrastructure-revolution-understanding-data-center-securitisation. [↩]
- Kroll Bond Rating Agency. ABS: data center ABS global rating methodology. KBRA, 2026, https://www.kbra.com/publications/ywsVHsMw. [↩]
- T. Duarte-Silva, A. Balcárcel, K. Czerney. Data center ABS: risks, yields, and ratings. Charles River Associates, 2025, https://www.crai.com/insights-events/publications/data-center-abs-risks-yields-and-ratings/. [↩]
- DataBank. DataBank raises $1.1 billion in hyperscale asset securitization. Press release, 2025, https://www.databank.com/resources/press-releases/databank-raises-1-1-billion-in-hyperscale-asset-securitization/. [↩]
- A. Shleifer, R. W. Vishny. Liquidation values and debt capacity: a market equilibrium approach. The Journal of Finance. Vol. 47, pg. 1343-1366, 1992, https://doi.org/10.1111/j.1540-6261.1992.tb04661.x. [↩]
- A. S. Luccioni, E. Strubell, K. Crawford. From efficiency gains to rebound effects: the problem of Jevons’ paradox in AI’s polarized environmental debate. Proceedings of the 2025 ACM Conference on Fairness, Accountability, and Transparency. pg. 76-88, 2025, https://doi.org/10.1145/3715275.3732007. [↩]