
Abstract
Hospital-acquired infections (HAIs), specifically Methicillin-resistant Staphylococcus aureus (MRSA) and Clostridioides difficile (C. difficile), are a major challenge in U.S. healthcare due to high death rates, financial strains, and antibiotic resistance. Despite prevention measures such as hand hygiene, environmental cleaning, and antibiotic stewardship, the challenge of HAIs continues. This study examines national trends in MRSA and C. difficile, compares infection patterns across hospital types and regions, and evaluates whether state reporting mandates correlate with changes in HAI rates. CDC data from 2013 2022 were used. Average MRSA and C. difficile cases per reporting hospital were calculated and compared across states, U.S. regions, and hospital types to identify possible patterns. Analysis included trend assessments, geographic mapping, and comparisons of state mandates and infection rates. Results showed that MRSA prevalence remained relatively stable over the 10 year period, while C. difficile rates declined across many states. Both infections showed similar geographic patterns, with higher rates in eastern states and lower rates in western/central states. Differences by hospital type were observed, but no association was found between state reporting mandates and infection trends. These findings suggest that regional healthcare practices and variations in policy implementation may cause differences in HAI rates among states. Continued efforts are needed to address persistent MRSA rates while sustaining progress in reducing C. difficile.
Keywords: nosocomial infections, hospital-acquired infections, rates, MRSA, C. difficile, practices/policies, state mandates, and handwashing procedures.
Introduction
Hospital Acquired Infections
Hospital Acquired Infections(HAI’s) are one of the largest challenges faced in healthcare today, as about 99,000 deaths in the U.S are associated with them every year. Nosocomial Infections is another word used to describe HAI’s. These are infections that are developed by patients in hospital settings through contact with other patients, healthcare workers, or surfaces that are infected. There are multiple types of infections including bacterial, fungal, viral, and multidrug resistant. These contribute to the most common cases of HAIs1. In the U.S, many measures have been taken in hopes of reducing HAI’s, but they still pose a high threat. One study found that they are still quite prevalent and their high rates show that there is still much needed effort to reduce and control them2. Another major problem is that in not just the U.S, but many other countries, there is a large financial strain caused by high rates of HAI’s3. According to the CDC there are an estimated 2.8 million cases of anti-microbial resistant infections in hospitals yearly. About 35,000 people out of the infected pass away from the infection4. Due to these high infection rates, financial strains, and mortality rates nosocomial infections are thought to be one of the largest challenges in healthcare that needs to be overcome. They are also a problem because they put healthcare workers and hospital visitors at high risks5. MRSA and C. difficile are two predominant nosocomial infections in healthcare. They are both antimicrobial resistant infections and are the focus of this paper. The CDC is one database that tracks information on HAI’s yearly and reports them online. Specifically, the CDC reports on MRSA and C. difficile.
MRSA
According to the CDC MRSA(Methicillin-resistant Staphylococcus Aureus) is a type of staphylococcal bacteria that is resistant to multiple antibiotics. MRSA is considered to be a serious threat level antimicrobial resistant bacterium. It is most commonly associated with skin infections. Common symptoms of MRSA include skin that is red, swollen, painful, warm to touch, or full of pus. In addition it is usually spread by direct contact with people who are infected. This includes the hands of healthcare workers and shared personal items like towels or razors. MRSA comes with many serious complications including but not limited to pneumonia, bloodstream and surgical sight infections, sepsis, and even death if not properly treated. MRSA can affect anyone, but groups of people that are at a higher risk of getting infected include athletes, daycare students, military personnel in barracks, people who receive inpatient medical care, people with medical devices inserted in their body, and people who inject drugs. To diagnose if a person has MRSA a healthcare provider sends in a clinical specimen to determine if MRSA is the cause of the infection. To treat MRSA, healthcare providers often prescribe antibiotics and in some cases surgery could be needed to drain the infected area6. MRSA is a very predominant and serious antibiotic and it is important for research to be conducted in that area of research as it does not yet have many treatments that have high accuracy rates of treating all MRSA. According to the CDC MRSA has a high threat level as it had an estimated 323,700 cases in 2023, about 10,600 of which died from. It also costs healthcare about an estimated amount of 1.7 billion dollars to keep controlled6. Although MRSA colonization is often asymptomatic and does not cause invasive disease, MRSA infection can become invasive and lead to serious complications like death. There have been multiple reports of fatality amongst healthy patients with MRSA7. MRSA should be considered important because there are cases of fatality caused by MRSA and many U.S funds go towards MRSA yearly. This all puts MRSA at a high level of importance when concerning hospital acquired infections. Part of the reason the MRSA is a high threat is its resistance to many antibiotics. According to the CDC MRSA is resistant to many commonly used antibiotics including Vancomycin – resistant MRSA, Daptomycin – resistant MRSA, Fluoroquinolone resistant MRSA, and Linezolid – resistant MRSA6. This resistance develops through picking up resistance genes from other organisms. Antibiotic resistance also occurs during altered drug targets, enzymatic drug inactivation, and increased efflux of antimicrobial compounds8. These statistics show the extent of which MRSA can affect people because it causes resistance to many common antibiotics. This can cause many problems for people in need of these antibiotics for ongoing medical needs. MRSA resistance is important to be studied as it can tremendously affect the daily lives and medical intakes of patients.
C. difficile
According to the CDC C. difficile(Clostridioides difficile) is a nosocomial infection that causes diarrhea and colitis which is the inflammation of the colon. Symptoms of C. difficile include watery diarrhea, fever, appetite loss, nausea, and abdominal pain. C. difficile spreads through materials contaminated by faces including commodes, bathtubs, and electronic rectal thermometer. Complications caused by C. difficile include dehydration and colitis at a common level, but in rare cases patients may experience serious intestinal conditions like toxic megacolon, sepsis, and even death. People who are taking an antibiotic or are in the 3 months after taking, are 10 times more susceptible to getting C. difficile. Other groups in higher risk of C. difficile include people 65 and older, recent patients at a hospital or nursing home, people with a weakened immune system such as people with organ transplants, and previous patients who suffered from C. difficile. One of the main prevention techniques for spreading C. difficile is proper handwashing techniques9. Some other common current treatments for C. difficile are the use of medications like Fidaxomicin, Vancomycin, and Metronidazole. Another emerging treatment included Biotherapeutics10. C. difficile is a commonly acquired infection that can inhibit the daily lives of personas and hinder the recovery process of patients healing from other diseases. It hinders the healing process as it is resistant to many antibiotics including vancomycin, metronidazole, moxifloxacin, and clindamycin. C. difficile cases have a higher rate of being resistant to moxifloxacin and clindamycin10. These are all common antibiotics that are used to treat various infections. This makes C. difficile important because it can emerge after antibiotic use and lead to severe illnesses in the colon. In addition C. difficile is one of the most common HAI’s and affects many patients. According to the CDC C. difficile causes about half a million cases per year, out of which an estimated 29,300 people die from11. C. difficile costs many hospitals tons of money yearly. One study showed that in a hospital that tested a new theory CHG(chlorhexidine gluconate) wipes to reduce HAI’s similar to C. difficile, a 32% decrease of HAI’s saved that hospital about 815,000 dollars that year12. These statistics show that C. difficile is a high risk that affects healthcare through its high mortality rates and high cost rates. This makes C. difficile an important hospital acquired infection that needs to be addressed.
Current Precautions
Some of the current precautions in place to limit the spread of HAI’s include hand washing techniques, hospital policies and practices implemented, and changes in the hospital’s environment. According to the National Library of Medicine, one of the leading causes towards higher spreading rates of hospital acquired infection is hand washing hygiene. It is said that healthcare workers only follow the recommended hand hygiene procedures 40% of the time13. By following specific guidelines when using ABHR’s hospitals infection rates are affected positively as they decrease14. This can be shown in MRSA infection rates in hospitals. It is known that there is a direct correlation between the spread of MRSA in hospitals and usage of proper hand hygiene15. It does not just matter the amount of time healthcare workers perform hand hygiene for, it is also the technique they use. Using a specific technique when performing hand hygiene is important in order to kill as much bacteria as possible16. When using hand sanitizers instead of hand washing, it is good to use hand sanitizers with Ethanol in order to kill viruses and hand sanitizers with propanol to kill bacteria17. There is a specific study that showed the results of using AGT-1 which is a type of sanitizer. This sanitizer was found to be able to kill both bacteria and viruses which caused a reduction HAI’s in that hospital18. In addition to hand hygiene, one study found that there was a significant reduction in the spread of HAI’s when using long sleeved hospital gowns versus short sleeved hospital gowns with a hand washing technique. When healthcare workers used short sleeved gowns along with a specific hand washing technique, it was found that the spread of HAI’s was reduced19. In addition to handwashing practice implemented, many other policies started in hopes of reducing HAI’s. According to the CDC there are 7 core elements in hospital antibiotic stewardship that affect the spread of HAI’s. These elements include hospital leadership commitment, accountability, pharmacy expertise, action, tracking, reporting, and education. None of these 7 elements have a 100% performance rate in hospitals20. There is a direct correlation between higher implementation rates of antibiotic stewardship, and reduced HAI’s21. Alongside antibiotic stewardship, it is important for healthcare workers to be able to properly collaborate with each other. It was found that when professionals in hospitals collaborate to prevent transmissions, the spread of HAI’s reduces22. The compliance of healthcare professionals to MRSA guidelines was found to be very poor. It is important for these healthcare workers to follow the guidelines because it is stated that more compliance to policies decreases the rates of HAI’s like MRSA23. A different research implemented the usage of admission screening in both ICU and non ICUs. It was determined that the addition of admission screenings actually helped reduce the amount of MRSA in the hospitals24. When trying to reduce the amount of hospital acquired infections in a hospital, one important factor is the environment of the hospital. When a patient is diagnosed with C. difficile it is crucial that they are placed in private rooms and anyone who sees them should perform proper hand hygiene and washing of all surfaces touched afterwards25. A hospital’s environment and hygiene has a large effect on the spread of MRSA. It was determined through an experiment that 35% of the samples taken from the surfaces of hospitals contained MRSA26.
Types of Hospitals
There are many different types of hospital that each have a different environment. Some of the most important types that are focused on in this paper include Acute Care Hospitals, Long-Term Acute Care Hospitals, Critical Access Hospitals, and Inpatient Rehabilitation Facilities. Acute Care Hospitals are considered the normal type of hospital that a person would go to in the sign of an injury. Patients go to Acute Care hospitals for surgeries, acute illnesses, monitoring of medical devices, and more. An Acute Care hospital can be defined as the most time sensitive and individually oriented type of hospital that takes curative actions to improve health. It is also said that in these types of hospitals many sudden cases resulting in death can occur27. Long-term Acute Care hospitals are for patients that still have an illness that needs to be monitored with a high level of care, but they are in a stable enough position where they don’t need to be kept in an intensive care unit27. Critical Access hospitals are small healthcare facilities located in rural areas and receive special federal designation in order to be maintained. A Critical Access hospital must meet a certain criteria to be considered one officially. This includes being located in a rural area in a state that has a Flex Program, providing 24 hour emergency care, having no more than 25 inpatient beds, and maintaining an average patient stay of 96 hours or less28. An Inpatient Rehabilitation Facility is a hospital where patients go for intensive rehab if they are able to tolerate at least 3 hours of therapy a day. If the hospital is certified under Medicare or Medicaid then it is exempt from the standard Hospital Prospective Payment System and will instead receive reimbursement through the IRF Prospective Payment System which was implemented in 2002. These facilities are regularly checked to make sure they are complying with federal regulations and are using established protocols/guidelines to ensure quality care29.
Mandate
Another step taken by the U.S in hopes of reducing HAI’s was the implementation of state – level reporting mandates. When nosocomial infections became too much of a burden in the U.S some states were mandated to release a public report of these infections. These mandates are legal requirements that are established through state legislation or administrative regulations and require healthcare providers to report infections to state health departments. Rather than being uniform across the country, the reporting requirements vary by state in terms of which infections must be reported and under what circumstances.This new rule was put in place in hopes of reducing HAI’s. To release a public report on HAI’s means that whenever a case of an HAI is identified in the state they are mandated to report this information to the state health department. Then, this information will be released to the public yearly30.
Scope of Paper
Objectives
The objective of this paper is to analyze data about MRSA and C. difficile given by the CDC and compare the HAI’s to see what commonalities and differences they may have. In addition, this paper will explore the patterns that are possibly present when looking at these two anti-biotic resistant infections. These patterns could then give insights into how to reduce overall HAI rates in the U.S.
Limitations
This paper will mainly be limited to the study of MRSA and C. difficile. However, the findings in this paper can be applicable to many other types of HAI’s. This limitation is due to the large scope of HAI’s making it easier to go deeper when focusing on two specific types. MRSA and C. difficile were chosen because they are both predominant HAI’s seen in hospitals and are both specifically anti-biotic resistant infections making them better for connections. This paper will also be limited to the scope of the U.S although other countries may be mentioned in comparison. In addition, the CDC does not provide a data set on the year 2015 and does not give data sets after 2022 which further limits what patterns and changes may have occurred in the missing years. Many states also do not provide information or only give limited information. This restricts the scope that this paper can reach as the information given by some states is scarce. The CDC only provides information on reporting hospitals which is why the main metric of the paper is cases per reporting hospitals. Information in this paper may be biased because there is no information on non reporting hospitals.
Methods
In this research many databases were used, including Pubmed, and The National Library of Medicine. When searching through these databases keywords that are used include nosocomial infections, hospital acquired infections, rates, MRSA, C. difficile, practices/policies, state mandates, and hand washing procedures. These keywords helped find out lots of information on the topic of Hospital acquired infections. When looking for helpful articles some things that were searched for were a setting in the U.S, articles about changes from the last decade, and articles that show how a new factor/policy changed HAIs rates in hospitals. Then, information from The CDC was analyzed in order to find new insights on HAI’s specifically MRSA and C. difficile, over the years. The CDC has a report on HAIs for every year from 2013 to 2022. These reports can be found on their website under NHSN reports in a section named HAI Progress Reports. This study specifically used SIR data on Acute Care Hospitals from 2013 – 2022 and SIR data on Long-term Acute Care hospitals, Critical Access Hospitals, and Patient Rehabilitation Facilities from 2022. All said files were downloaded in July of 2025. An analysis on these data sets helped find the effect of mandates, number of hospitals, and types of hospitals on HAI’s. Alongside this the reports gave insights to differences between the evolution of MRSA vs C. difficile in hospitals. All of this data was derived from the CDC’s information by compiling information of excel charts to easily compare and create new charts/graphs that help show how HAI’s are changing. Rates that are presented in this paper were found through specific calculations that took place in the excel sheet. The formula to find the average cases per reporting hospital, which is the main metric used in this paper, the amount of observed cases per year in a state was divided by the amount of reporting hospitals in the state. These two pieces of information are given by the CDC. Also using spreadsheets, most of the graphs found in the paper were made on Excel. In addition data was extracted from the CDC’s data on MRSA and C. difficile over the years and formed different types of healthcare settings to make accurate comparisons that would reveal more about C. difficile and MRSA.
Results and Analysis
MRSA
Overall Trends
The overall trends from MRSA appear relatively stable over time (Supplementary figure 1), but a very slight decline can be observed. Through linear regression it was found that the trends over the last decade have a slope of -0.3896(95% CI of -0.7568 to -0.02) which shows the gradual decrease of MRSA rates over the last decade. In addition, the p-value is 0.0405 which makes the slight change statistically significant. It is important to keep in mind that regional variation does exist. For example, D.C (the darkest row), reduced from about 10.22 cases per reporting hospital in 2013 to about 5.5 cases per reporting hospitals in 2022 which is a large reduction in comparison to the overall slight decline. Despite statistical significance, the relatively small magnitude of the slope suggests that the decline may not be substantial in practical terms.
Top Ten highest vs lowest states
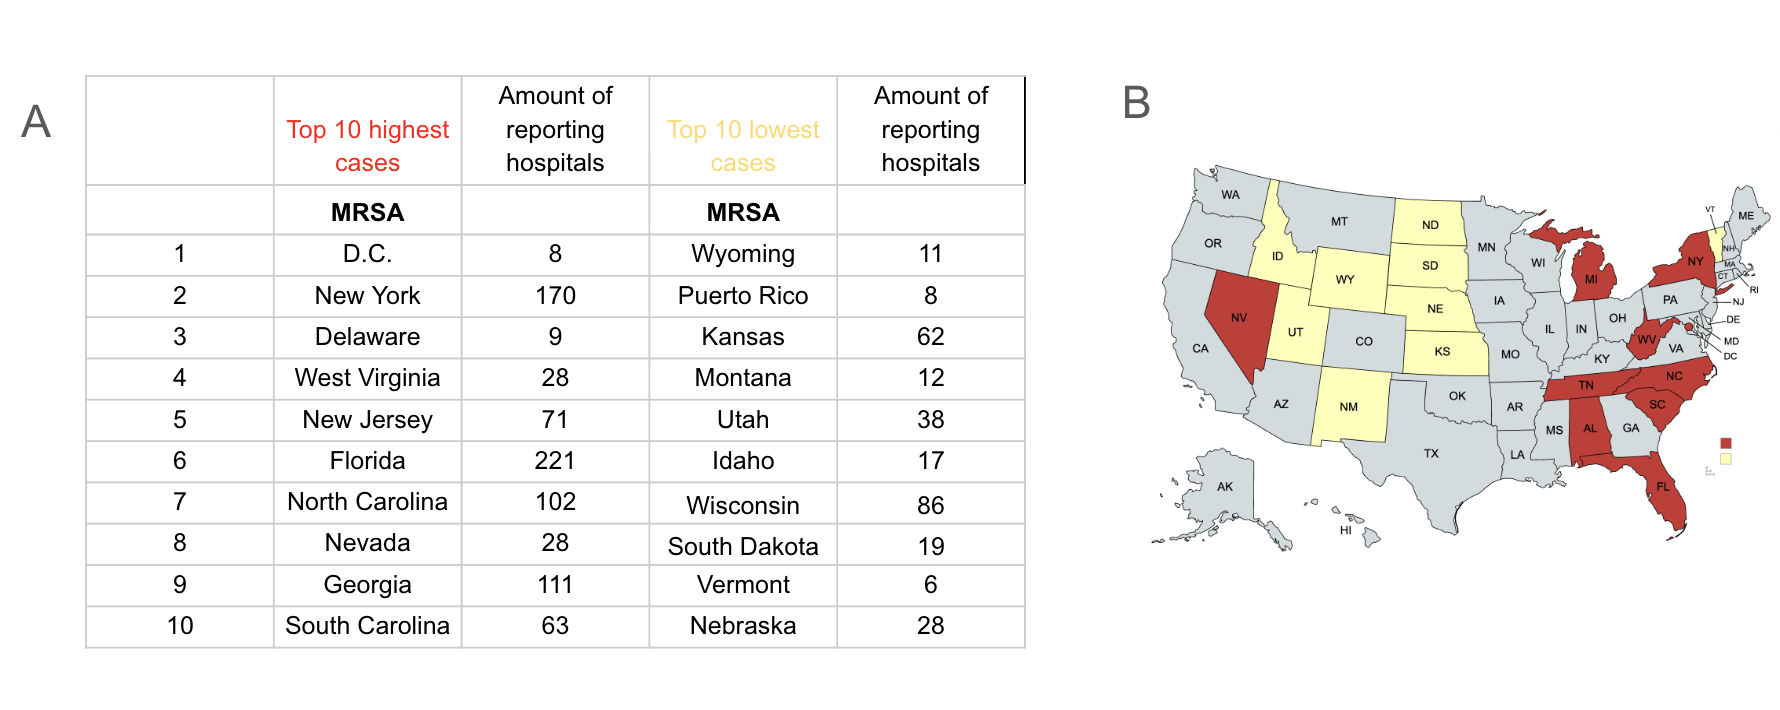
The states with the top 10 highest cases per reporting hospital in 2022 and the top 10 states with the lowest cases per reporting hospital in 2022 (Figure 1A) are represented in a table. They are also mapped out with the 10 highest being depicted in the color red while the 10 lowest are in yellow (Figure 1B). When looking at the map, it can be seen that with the exception of Nevada and Vermont, the states lower in MRSA are more in central/west America while most of the states higher in MRSA are located in east America. It is important to keep in mind that Puerto Rico, while in that chart, is not depicted in the map. The amount of reporting hospitals per state were depicted to show that they were not the reason as to which of those states have higher or lower number of cases.
C. difficile
Overall trends
When viewing the overall trends of C. difficile it can be seen that in most states C. difficile is usually decreasing (Supplementary figure 2). This is with the exception of some states like Massachusetts which increased from about 6.5 cases per reporting hospital in 2013 to about 20.6 cases per reporting hospital in 2022. Linear regression analysis shows that C.difficile trends over the last decade have a slope of −4.786 (95% CI of -7.237 to -2.33) which indicates a pronounced decrease over the last decade. In addition the p-value is 0.0.0024 making the decrease in C.diff statistically significant. In addition the relatively high R2 of 0.7528 shows that 75% of the variation of C.diff rates is shown by the model.
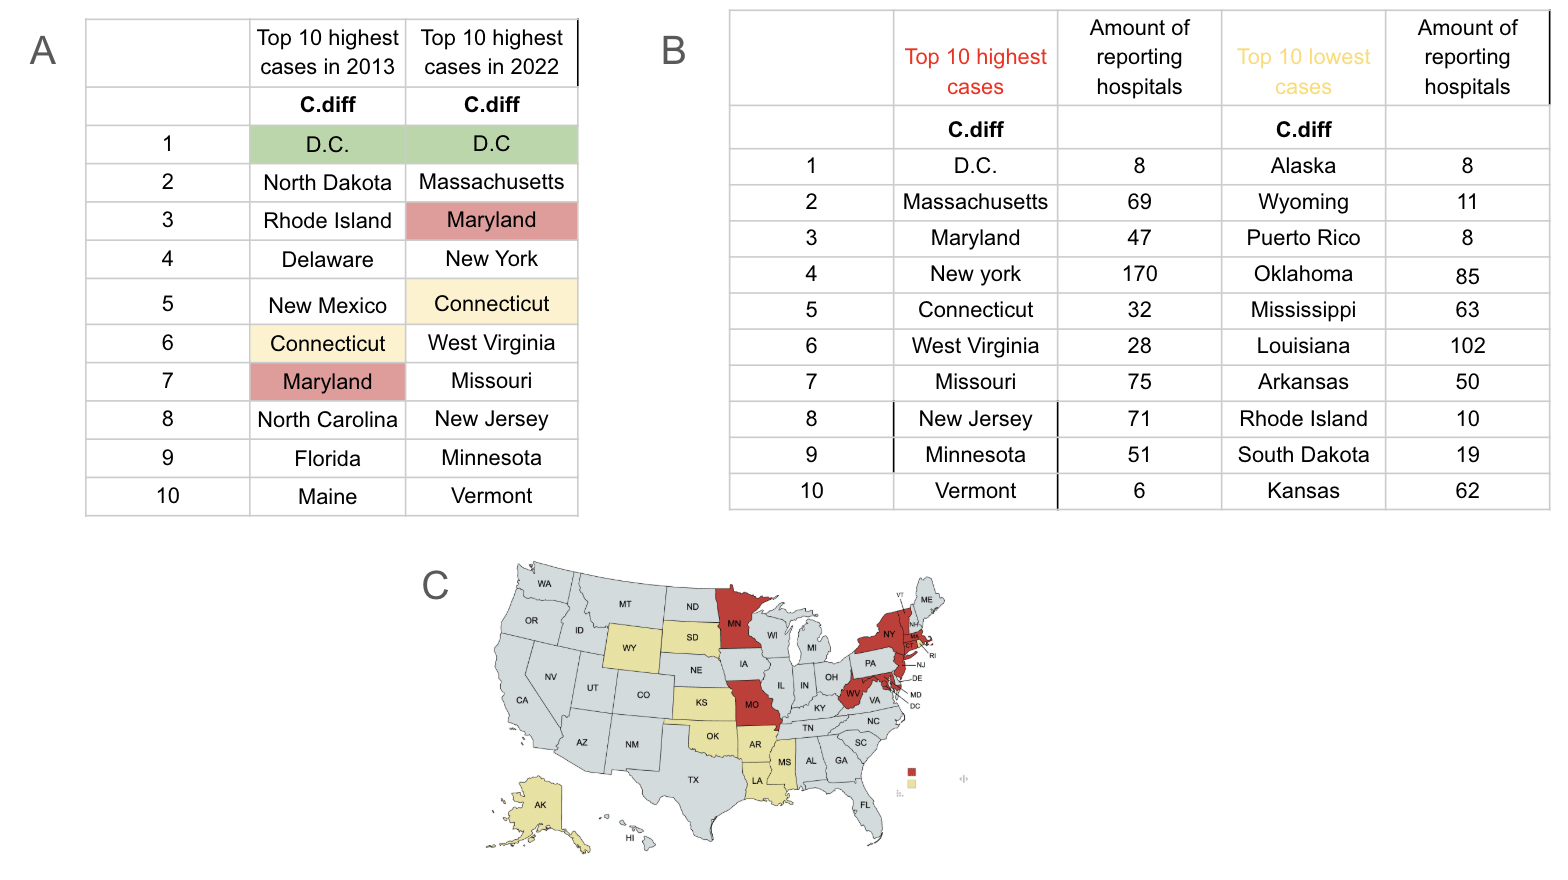
In the top 10 states with the highest cases of C. difficile per reporting hospital in 2013 vs 2022 (Figure 2A) it can be seen that D.C stayed the highest throughout the years, but this does not mean there have not been changes. D.C’s cases per reporting hospital has drastically decreased since 2013 by going from about 61.7 cases per reporting hospital to 29.25 cases per reporting hospital. Many of the other states seen as having high amounts of cases in 2013 have dropped largely to the amount that they were lower than Vermont in 2022. In 2022 Vermont had 15 cases per reporting hospital meaning that the states that are now lower than Vermont dropped to below 15 cases per reporting hospital.
Top ten highest vs lowest states
The top 10 highest states in amount of C. difficile cases and the top 10 lowest states in amounts of C. difficile in 2022 are represented in a chart (Figure 2C). On the map the 10 highest are depicted in red and the 10 lowest are in yellow (Figure 2D). When looking at the map it can be seen that all the states with lower cases of C. difficile are in central to west America while the states higher in C. difficile cases are located in east to central America. It can also be seen that Missouri, which has a high rate of C. difficile, is surrounded by states with low rates of C. difficile which is quite interesting. While Puerto Rico is on the chart it is not depicted on the map.
C. difficile vs MRSA
Overall Trends
Since MRSA and C. difficile are both common HAI’s and are antibiotic resistant, we compared the cases across the U.S to see if there were any difference or similarities in their prevalence. The Graphs seen before portrayed every state’s amount of MRSA and C. difficile per hospital over the years of 2013 to 2022 (Figures 1A and 2B). These graphs show that overall MRSA has stayed relatively the same over the years, but C. difficile has reduced with some state reductions being much more significant than others. It can also be seen that the orange line in both graphs which represents D.C is prominent and higher than the other states in both graphs.
Top Ten lowest and highest for MRSA vs C. difficile
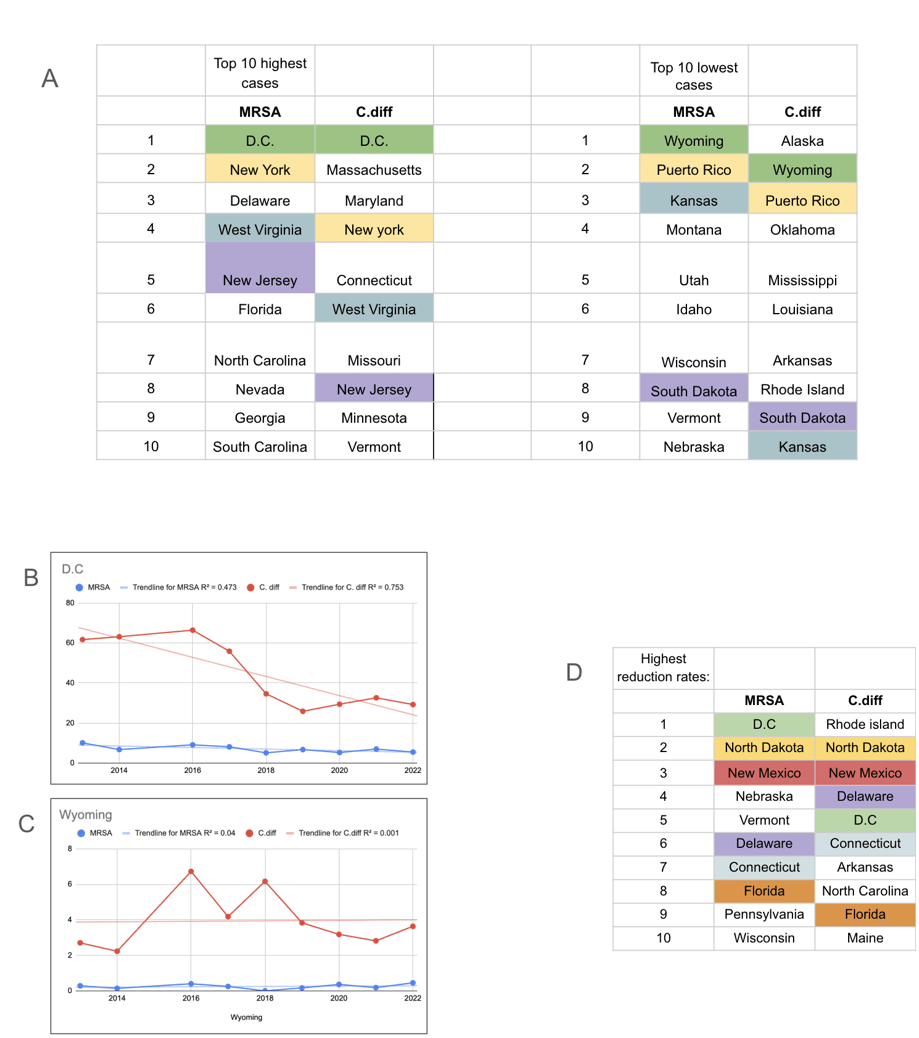
A comparison of the top 10 highest and lowest states for MRSA to the top 10 highest and lowest states for C. difficile are depicted in a chart (Figure 3A). There are many patterns seen when comparing these two charts including that D.C is the highest in both infections and Wyoming is the first lowest in MRSA and second lowest in C. difficile. New York is also seen as the second highest in MRSA and third highest in C. difficile. Some interesting differences are that Vermont is the 10th highest state in C. difficile, but the 7th lowest state in MRSA.
A specific comparison of MRSA and C. difficile rates in D.C from 2013 to 2022 can be viewed (Figure 3B). It can be seen that C. difficile decreased by a lot, but MRSA stayed the same throughout the years.
A specific comparison of MRSA and C. difficile rates in Wyoming from 2013 to 2022 can be viewed (Figure 3C). This graph is on a different scale than the D.C graph because Wyoming’s rates are much lower. Throughout the years it can be seen the C. difficile cases fluctuated showing changes, but MRSA cases stayed about the same.
MRSA vs C. difficile reduction rates
The states are ordered by their reduction rate from highest to lowest from 2013 – 2022 in a chart (Figure 3D). It shows the top 10 states for both MRSA and C. difficile in reduction over the years. The chart is color coded to show similar states for both infections. This includes states like D.C, North Dakota, New Mexico, Delaware, Connecticut, and Florida which have high rates of reduction in both diseases.
Mandates
MRSA
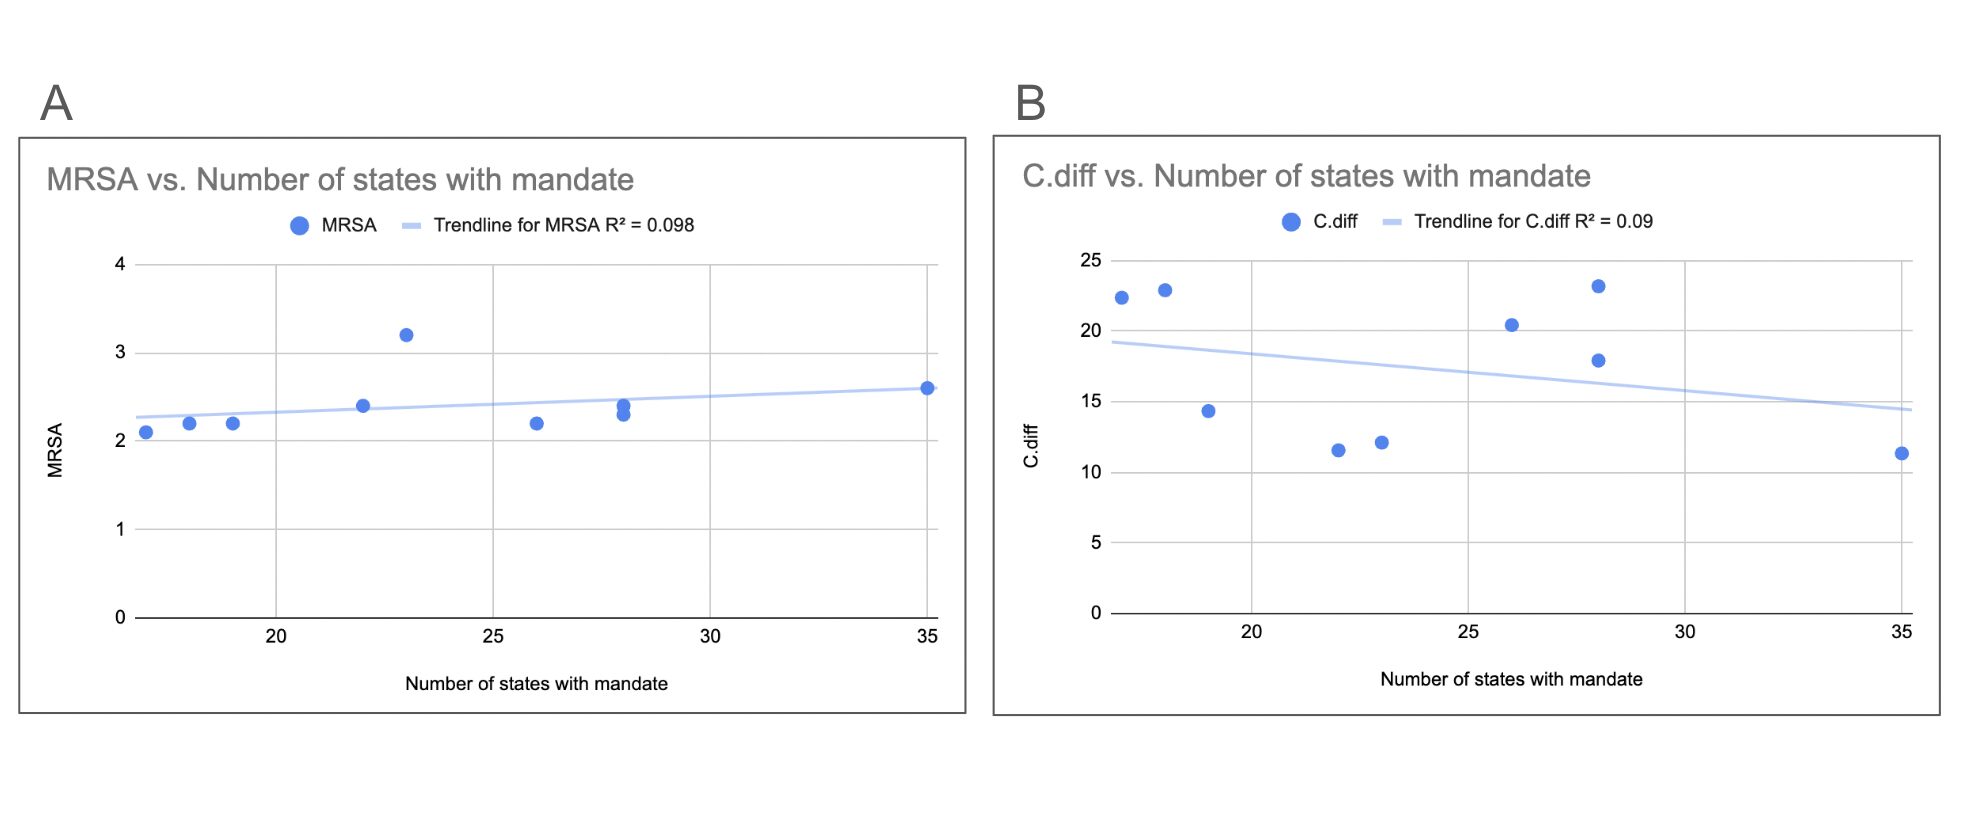
To investigate whether implementing a mandate would affect the amount of HAI’s we compared data on the presence of mandates to the rates of HAI’s. The amount of states per year that had a mandate on hospital reporting of MRSA can be viewed on the first graph (Figure 4A). When visually inspecting the data it can be seen that there is no clear relationship between the number of mandates and the MRSA rates. This is directly supported by linear regression analysis which shows a very small positive slope of 0.018(95% CI of -0.0308 to 0.0668) that is not statistically significant because the p-value is 0.4119. In addition this graph had an R2 of 0.098 meaning only 9.8% of the variance is due to mandates. When there are less mandates, sometimes the cases are higher and other times they are lower. An example of this is 2021 and 2019. In 2021 18 states were mandated to release MRSA data and in 2018 19 states were mandated to release MRSA data. However, when looking at the average number of cases per reporting hospital yearly, 2019 had less cases per reporting hospital compared to the average while 2021 had more cases per reporting hospital compared to the average, this shows that there is visually no relation between mandates and case amount.
C. difficile
The amount of states per year that were mandated to report their information on C. difficile can be viewed on the second graph (Figure 4B). These numbers are similar to the ones of MRSA, but there are acute differences with C. difficile having more hospitals that are reporting some years. Also, the average cases per reporting hospital for C. difficile yearly can be seen in the graph. When comparing the information on the average cases per year and the information on the presence of mandates, there is visually no relation once again seen between the two. While C. difficile is on a gradually steady decrease, the mandates fluctuate throughout the year showing that whether the mandates were there or not, it did not affect the amount of C. difficile cases. This can be backed up by linear regression analysis which shows a very small negative slope of 0.2607(95% CI of -1.003 to 0.4813) that is not statistically significant because the p-value is 0.4334. In addition this graph had an R2 value of 0.09 meaning only 9% of any variance would be due to the presence of mandates.
Other Hospital Types
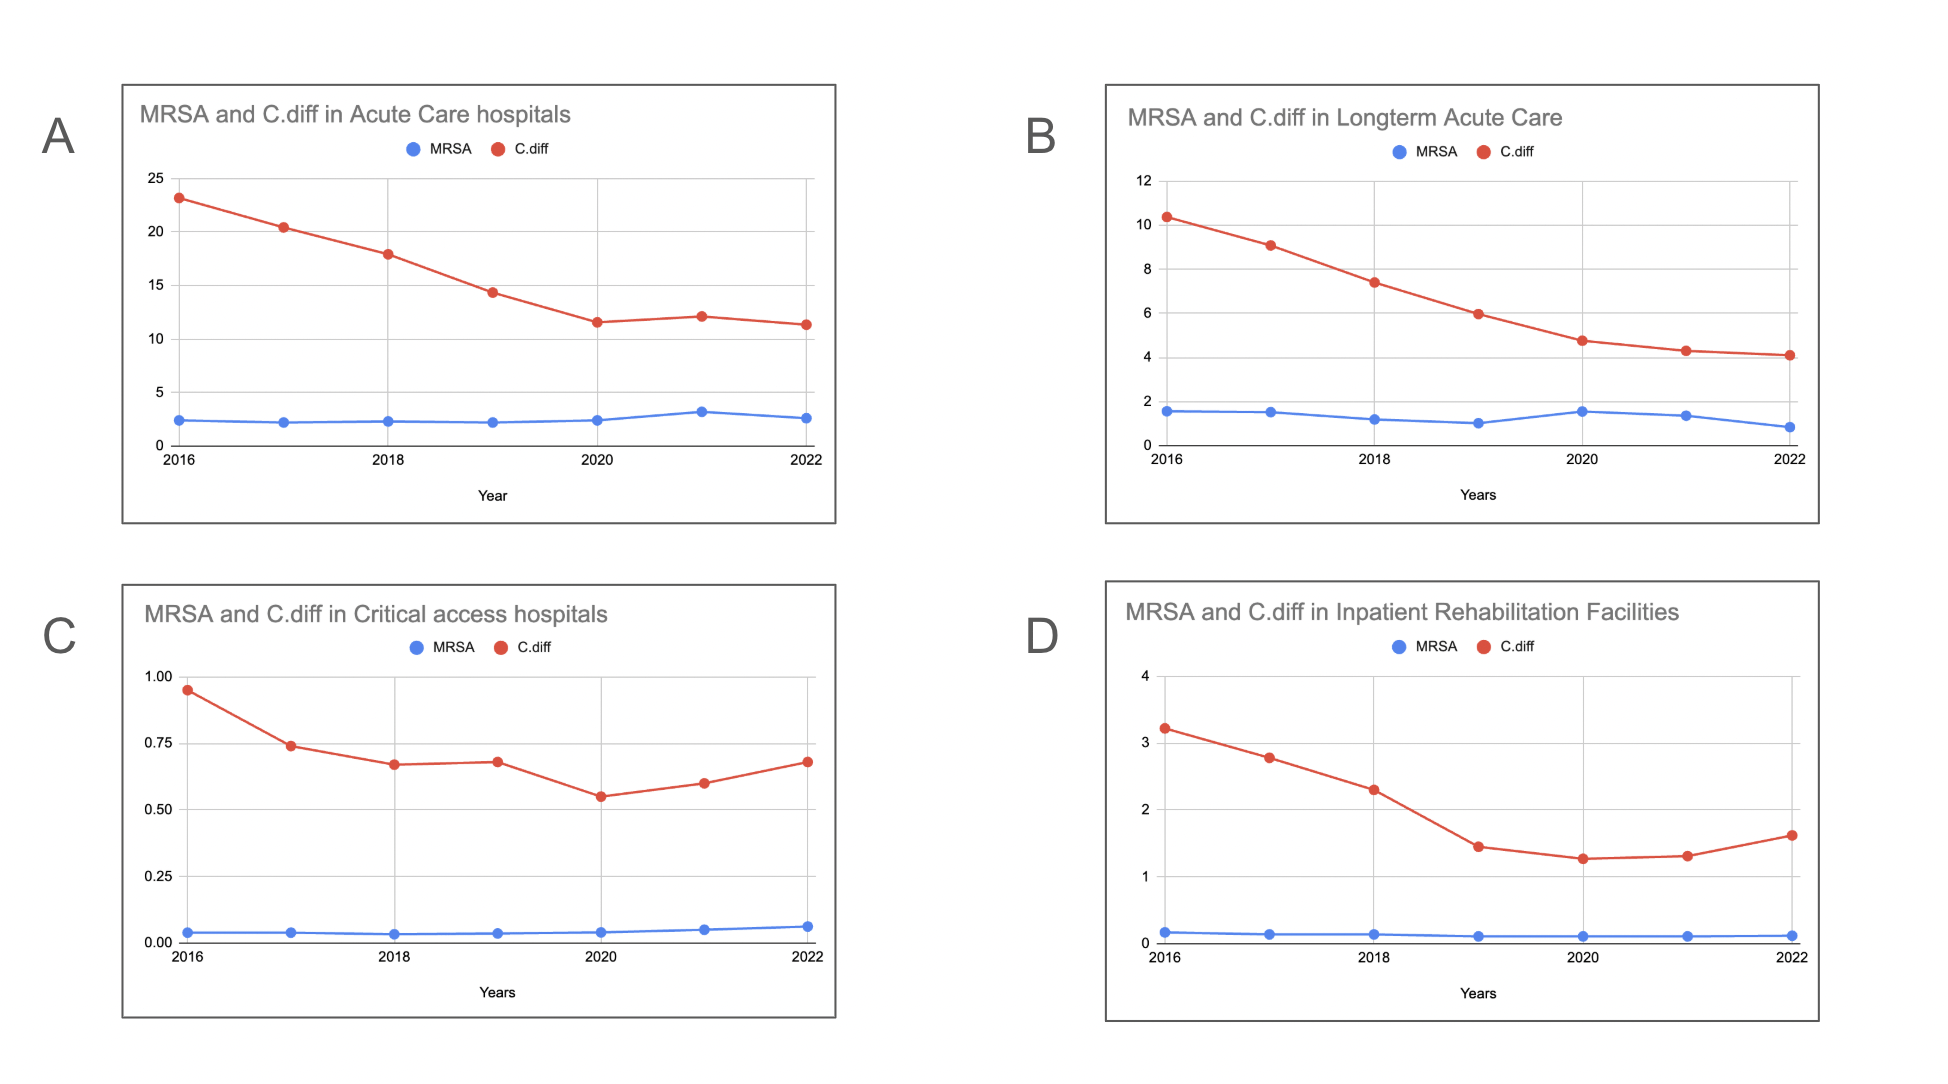
In order to find more insights on what may cause higher rates of HAI’s, we compared MRSA and C. difficile in different environments. Trends in MRSA and C. difficile over the years in different types of hospitals can be viewed (Figures 5A – 5D). The trends show that all types of hospitals seem to have been reducing the C. difficile cases. In Critical Access hospitals (Figure 5C) and Inpatient Rehabilitation Facilities (Figure 5D) the end of the graphs show that recently they have started to increase in cases of C. difficile. However, Long-term acute care hospitals are still reducing in C. difficile cases. Long-term acute care hospitals also had the highest rates of MRSA while Critical access and Inpatient Rehabilitation both had around less than one case per reporting hospital average. It is important to keep in mind that each of these graphs is on a different scale showing how drastic the difference between each actually is. The data shown here is from 4 different hospital types across all 50 states which leads to large variability between data sets. Therefore, direct comparisons between hospital types is impossible so only overall trends are visually analyzed.
Discussion
MRSA
The data provided on MRSA reveals information on geographical and numerical patterns. MRSA in general has always had lower infection rates when compared to other hospital acquired infections, but most reporting hospitals still have at least 1 case per year. The overall trends of MRSA, which can be seen as a very slight reduction over the last decade, shows that there has possibly not been many new developments in that field of research. This is with the exception of Washington D.C which was able to reduce by a total of about 5 cases per reporting hospital over the years 2013 – 2022. Although D.C had a significant reduction, when viewing its cases per reporting hospital throughout the years, there is not one year where the rates immediately lowered. The rates fluctuated throughout the years showing there was no singular development that helped in reducing the MRSA rates. Although the general amount of MRSA seems lower, MRSA management in hospitals can be challenging if it is to break out. In the case of MRSA it is important to identify it in a timely manner in order to implement the appropriate treatment. One further development that could help in early identification is molecular and immunochromatographic tests which could dramatically lessen the amount of days it takes to identify MRSA31. Some possible policies that should be enacted in order to help in the reduction of MRSA rate include: the screening of healthcare workers for dangerous pathogens, setting up a surveillance system for healthcare workers to see what possible pathogens like MRSA these workers may acquire in hospitals, establishment of a plan for economic safety for workers who are infected by pathogens, effectiveness of the policies and practices placed to prevent spread of pathogens like MRSA, and further research in the field of MRSA32.
There are also geographical patterns present when comparing the states with high MRSA rates and the states with low MRSA rates. The color coded map depicts that most states lower in MRSA (with the exception of Nevada and Vermont) are located in the west/central U.S. The states with higher rates of MRSA are located in the eastern U.S. This regional clustering shows that there may be differences in the healthcare practices/protocols and economic situations between regions. These differences could be what is impacting the rates of MRSA. One of these differences could be the varying integrity differences on the application of important policies in hospitals throughout the U.S. These hospitals will give excuses to cover up their poor following of healthcare guidelines. This is a primary cause for how some hospitals may have higher cases than others33. There is also additional evidence that even small breaks in basic infection control practices, especially hand hygiene, can lead to higher MRSA transmission and added healthcare costs. A study on hand hygiene noncompliance found that small failures in following these guidelines were directly linked to increased MRSA infections34.
C. difficile
The data provided in C. difficile reveals both numerical patterns and geographical patterns in the information. Generally, C. difficile’s overall pattern shows a large reduction in most states. This pattern has exceptions of some states like Massachusetts which rose in numbers throughout the years. However, the larger number of states that have the pattern of decrease provide evidence that there may have been many significant developments in the field of research on C. difficile that led to this reduction. Although no definitive conclusions can be drawn regarding causation, a recent significant development in C. difficile is the implementation of fecal microbiota transplantation, also known as FMTs. It was found that FMT’s are highly effective in reducing rates of C. difficile. There are still many challenges in the safety and standardization of them, but they are one significant start in reducing rates of C. difficile35. This study does not directly measure the impact of FMTs on C.difficile rates meaning FMTs should be treated as a possible contributor rather than a confirmed cause.
There are also geographical patterns present when comparing the states with high C. difficile rates and the states with low C. difficile rates. The states lower in C. difficile are located in central/west America while the states higher in C. difficile are located in central/east America. The regional differences of healthcare practices/policies and economic states, may be the reason for this large difference in rates of C. difficile geographically. One significant difference between hospitals is that the difference in organizations that assess hospital protocols affects the hospitals implementations of these protocols. This research is located in Canada and says how some hospitals use the Public Health Agency of Canada (PHAC) while others use the Canadian Agency of Drugs and technology CADTH which causes differences in implementation of healthcare guidelines36. This idea can also be used in the U.S considering there are multiple agencies including the U.S Department of Health and Human Services (HHS), the Centers for Medicare & Medicaid Services (CMS), the Health Resources and Services Administration (HRSA), the Department of Veterans Affairs (VA), and more. These contrasts in agencies do not just affect C. difficile but can affect all types of HAI case numbers and regulation.
MRSA vs C. difficile
When comparing the overall patterns of MRSA and C. difficile it can be seen that MRSA has shown relatively little change over time, while C. difficile has reduced largely over the years. This provides further evidence to the possible differences in amounts of developments between MRSA and C.difficle, but it cannot be fully said without further analysis of interventions and treatment changes. Although MRSA and C. difficile have differing overall patterns, they have similar geographical patterns. This includes a prominent feature of D.C being the highest in both MRSA and C. difficile. This could mean that D.C may have higher rates because it has different healthcare policies/practices or a different economic status. Additionally, in both maps showcasing where the states higher in MRSA or C. difficile are located and where the states lower are located, the states with higher rates are generally located in the east of America and the states with lower rates are generally located in the west/central of America. Possible explanations for the observed regional differences include population density, economic differences, hospital mix, patient case mix, and severity of illness. One research says that the west coast uses hospitals 40% less than the east coast. This article says this difference is partially because of population density differences and partially because of different characteristics in the healthcare system. When looking closely at differences in New York and Los Angeles, it was seen that New York had a large backlog of patients waiting to be placed in long-term healthcare facilities. This is believed to possibly be because New York has more medical specialists and advanced supplies causing more people to go to hospitals. However, having more specialists and more people going to hospitals does not necessarily mean better outcomes, and this example is not directly linked to the MRSA or C. difficile rates measured in this study37. Future research could focus on finding more explanations to these regional differences by using census data to check how population densities may affect the amount of cases in the east vs west coast.
Mandates
When looking at the data on state mandates compared to C. difficile and MRSA rates, they both show that there is no correlation present. According to one source, these mandates were implemented in the hopes of reducing the amount of HAIs in the U.S as they were becoming a high burden38. Another study had the same results as were discovered when looking at the data from the CDC. In this study they looked at the prevalence of MRSA in Illinois, Chicago when they had a mandate versus when they did not have a mandate. They came up with similar results as there was no pattern between an increase or decrease of cases with the presence of a mandate39. These results all show that although many may have thought that putting a mandate or taking away a mandate would change the number of cases, there seems to be no correlation or change.
Different types of hospitals
When looking at the data on how C. difficile and MRSA rates change in different healthcare settings, it can be seen that they are all on different scales. This means that while some graphs go up by 10s another may only go up by 1s. This contrast in scaling shows how drastic the difference in rates is. Specifically Acute Care Hospitals can be seen to have the highest rates out of the four different types investigated. There was one study that tested the prevalence of nosocomial infections in Acute Care hospitals and found that there was a higher infection rate found in Acute Care hospitals with an infection rate of 10.1% prevalence. This large infection rate is most probably from Acute Care hospitals large size and unfavorable mix of patients40.
Data Availability
Supplementary figures 1 and 2 can be found in the google sheets file above. Raw CDC data was found in the NHSN reports section labeled as HAI progress reports. Specifically only SIR data was used.
Conclusion
It is important to remember that this study also came with limitations. CDC infection data only extends to 2022, meaning recent changes cannot be fully evaluated. In addition, only reporting hospitals were included, so trends may differ due to lack of data from additional non reporting hospitals. Despite these restrictions, the CDC dataset still provides one of the most reliable and complete views of national HAI patterns and it helps in forming an understanding on how infections like MRSA and C. difficile differ across states and hospital systems.
This study highlighted several important patterns in MRSA and C. difficile infections across the United States. Using CDC data, which provided standardized national reporting from a wide range of hospitals and made it possible to compare states, regions, hospital types, and long-term trends on HAI’s from 2013 – 2022. These findings show that while C. difficile infections have decreased in most states, MRSA has remained relatively steady, with only a few areas showing noticeable improvements. The repeated pattern of higher infection rates in eastern states and lower rates in western/central states suggests that regional differences in healthcare practices, resources, and economic conditions may play an important role. Differences in how hospitals actually follow infection-control policies also appears to influence these infection rates.
Although progress has been made,especially with approaches like fecal microbiota transplantation for C. difficile, there is still room for development in both fields. MRSA would benefit from stronger screening programs, more consistent policy enforcement, and improved early-identification methods. For C. difficile, more research into the long-term safety and standardization of treatments such as FMTs could help support the continued decline in infection rates. Future research should also explore explanations as to why geographical patterns exist because understanding these regional differences could help states adopt more effective practices used in lower-rate areas. Additionally, since this study found no connection between mandates and infection rates, efforts spent on trying to find a use in mandates can instead be better spent focusing on ways to ensure policies are actually implemented. Overall, these findings suggest that continued research, stronger adherence to infection-control practices, and attention to regional differences could help reduce MRSA and C. difficile infections in the future.
Acknowledgements
I would like to thank Rachel Erickson for her mentorship and guidance during the writing of this paper.
Supplimentary Information
References
- Liu, J.-Y. & Dickter, J. K. Nosocomial Infections: A History of Hospital-Acquired Infections. Gastrointest. Endosc. Clin. N. Am. 30, 637–652 (2020) [↩]
- Lemiech-Mirowska, E., Kiersnowska, Z. M., Michałkiewicz, M., Depta, A. & Marczak, M. Nosocomial infections as one of the most important problems of healthcare system. Ann. Agric. Environ. Med. AAEM 28, 361–366 (2021) [↩]
- Rosenthal, V. D. et al. International Nosocomial Infection Control Consortium (INICC) report of health care associated infections, data summary of 45 countries for 2015 to 2020, adult and pediatric units, device-associated module. Am. J. Infect. Control 52, 1002–1011 (2024) [↩]
- CDC. Health Department HAI/AR Programs. Healthcare-Associated Infections (HAIs) https://www.cdc.gov/healthcare-associated-infections/programs/index.html (2024) [↩]
- Wang, L., Teng, Z., Huo, X., Wang, K. & Feng, X. A stochastic dynamical model for nosocomial infections with co-circulation of sensitive and resistant bacterial strains. J. Math. Biol. 87, 41 (2023) [↩]
- CDC. Methicillin-resistant Staphylococcus aureus (MRSA) Basics. Methicillin-resistant Staphylococcus aureus (MRSA) https://www.cdc.gov/mrsa/about/index.html (2025) [↩] [↩] [↩]
- Nair, R., Ammann, E., Rysavy, M. & Schweizer, M. L. Mortality among patients with methicillin-resistant Staphylococcus aureus USA300 versus non-USA300 invasive infections: a meta-analysis. Infect. Control Hosp. Epidemiol. 35, 31–41 (2014) [↩]
- Vestergaard, M., Frees, D. & Ingmer, H. Antibiotic Resistance and the MRSA Problem. Microbiol. Spectr. 7, 10.1128/microbiolspec.gpp3-0057–2018 [↩]
- CDC. C. diff: Facts for Clinicians. C. difficile (Clostridioides difficile) https://www.cdc.gov/c-diff/hcp/clinical-overview/index.html (2025) [↩]
- Boyanova, L., Dimitrov, G., Gergova, R., Hadzhiyski, P. & Markovska, R. Clostridioides difficile resistance to antibiotics, including post-COVID-19 data. Expert Rev. Clin. Pharmacol. 16, 925–938 (2023) [↩] [↩]
- CDC. C. diff: Facts for Clinicians. C. difficile (Clostridioides difficile</em>) https://www.cdc.gov/c-diff/hcp/clinical-overview/index.html (2025) [↩]
- Reagan, K. A. et al. You get back what you give: Decreased hospital infections with improvement in CHG bathing, a mathematical modeling and cost analysis. Am. J. Infect. Control 47, 1471–1473 (2019) [↩]
- Collins, A. S. Preventing Health Care–Associated Infections. in Patient Safety and Quality: An Evidence-Based Handbook for Nurses (ed. Hughes, R. G.) (Agency for Healthcare Research and Quality (US), Rockville (MD), 2008) [↩]
- Tartari, E. et al. Updates and future directions regarding hand hygiene in the healthcare setting: insights from the 3rd ICPIC alcohol-based handrub (ABHR) task force. Antimicrob. Resist. Infect. Control 13, 26 (2024) [↩]
- Marimuthu, K., Pittet, D. & Harbarth, S. The effect of improved hand hygiene on nosocomial MRSA control. Antimicrob. Resist. Infect. Control 3, 34 (2014) [↩]
- Collins, F. & Hampton, S. Hand-washing and methicillin-resistant Staphylococcus aureus. Br. J. Nurs. Mark Allen Publ. 14, 703–707 (2005) [↩]
- Gold, N. A., Mirza, T. M. & Avva, U. Alcohol Sanitizer. in StatPearls (StatPearls Publishing, Treasure Island (FL), 2025) [↩]
- Jindal, H. M., Chandramathi, S., Sekaran, S. D. & Suresh, K. Evaluation of bactericidal and virucidal activity of novel disinfectant Aaride AGT-1 compared to other commercially available disinfectants against hospital-acquired infections (HAIs). Trop. Biomed. 37, 626–636 (2020) [↩]
- Vincent, L. et al. Reduction in transfer of micro-organisms between patients and staff using short-sleeved gowns and hand/arm hygiene in intensive care during the COVID-19 pandemic: A simulation-based randomised trial. J. Intensive Care Soc. 24, 265–276 (2023) [↩]
- CDC. Core Elements of Antibiotic Stewardship for Health Departments. Antibiotic Prescribing and Use https://www.cdc.gov/antibiotic-use/php/core-elements/health-departments/index.html (2025) [↩]
- Baur, D. et al. Effect of antibiotic stewardship on the incidence of infection and colonisation with antibiotic-resistant bacteria and Clostridium difficile infection: a systematic review and meta-analysis. Lancet Infect. Dis. 17, 990–1001 (2017) [↩]
- Monegro, A. F., Muppidi, V. & Regunath, H. Hospital-Acquired Infections(Archived). in StatPearls (StatPearls Publishing, Treasure Island (FL), 2025) [↩]
- Zoabi, M., Keness, Y., Titler, N. & Bisharat, N. Compliance of hospital staff with guidelines for the active surveillance of methicillin-resistant Staphylococcus aureus (MRSA) and its impact on rates of nosocomial MRSA bacteremia. Isr. Med. Assoc. J. IMAJ 13, 740–744 (2011) [↩]
- Chaberny, I. F., Schwab, F., Ziesing, S., Suerbaum, S. & Gastmeier, P. Impact of routine surgical ward and intensive care unit admission surveillance cultures on hospital-wide nosocomial methicillin-resistant Staphylococcus aureus infections in a university hospital: an interrupted time-series analysis. J. Antimicrob. Chemother. 62, 1422–1429 (2008) [↩]
- Loo, V. G. Environmental interventions to control Clostridium difficile. Infect. Dis. Clin. North Am. 29, 83–91 (2015) [↩]
- Squeri, R., Grillo, O. C. & La Fauci, V. Surveillance and evidence of contamination in hospital environment from meticillin and vancomycin-resistant microbial agents. J. Prev. Med. Hyg. 53, 143–145 (2012) [↩]
- devdigitalsilk. Differences Between LTACHs, IRFs and SNFs. PAM Health https://pamhealth.com/resources/differences-between-ltachs-irfs-and-snfs/ (2024) [↩] [↩]
- Critical Access Hospitals (CAH) – Health Equity. https://www.vdh.virginia.gov/health-equity/critical-access-hospitals-cah/ [↩]
- Inpatient Rehabilitation Facilities | CMS. https://www.cms.gov/medicare/health-safety-standards/certification-compliance/inpatient-rehabilitation-facilities [↩]
- Pogorzelska-Maziarz, M., Carter, E. J., Manning, M. L. & Larson, E. L. State Health Department Requirements for Reporting of Antibiotic-Resistant Infections by Providers, United States, 2013 and 2015. Public Health Rep. 132, 32–36 (2016) [↩]
- Hassoun, A., Linden, P. K. & Friedman, B. Incidence, prevalence, and management of MRSA bacteremia across patient populations—a review of recent developments in MRSA management and treatment. Crit. Care 21, 211 (2017) [↩]
- Kavanagh, K. T., Abusalem, S. & Calderon, L. E. View point: gaps in the current guidelines for the prevention of Methicillin-resistant Staphylococcus aureus surgical site infections. Antimicrob. Resist. Infect. Control 7, 112 (2018) [↩]
- Kavanagh, K. T. Control of MSSA and MRSA in the United States: protocols, policies, risk adjustment and excuses. Antimicrob. Resist. Infect. Control 8, 103 (2019) [↩]
- Cummings, K. L., Anderson, D. J. & Kaye, K. S. Hand hygiene noncompliance and the cost of hospital-acquired methicillin-resistant Staphylococcus aureus infection. Infect. Control Hosp. Epidemiol. 31, 357–364 (2010) [↩]
- Elendu, C. et al. Fecal microbiota transplantation as a therapeutic modality for recurrent Clostridioides difficile infection: reviewing efficacy, safety, mechanisms of action, and outcomes. Ann. Med. Surg. 87, 5829–5850 (2025) [↩]
- Richardson, M., Daneman, N., Miller, F. A. & Sander, B. Moving from intervention management to disease management for Clostridioides difficile infection: an economic evaluation exploring the impact of a systems approach to health technology assessment. Vaccine 62, 127512 (2025) [↩]
- Knickman, J. R. & Foltz, A. M. A statistical analysis of reasons for East-West differences in hospital use. Inq. J. Med. Care Organ. Provis. Financ. 22, 45–58 (1985) [↩]
- Pogorzelska-Maziarz, M., Carter, E. J., Manning, M. L. & Larson, E. L. State Health Department Requirements for Reporting of Antibiotic-Resistant Infections by Providers, United States, 2013 and 2015. Public Health Rep. Wash. DC 1974 132, 32–36 (2017) [↩]
- Lin, M. Y. et al. Regional Epidemiology of Methicillin-Resistant Staphylococcus aureus Among Adult Intensive Care Unit Patients Following State-Mandated Active Surveillance. Clin. Infect. Dis. Off. Publ. Infect. Dis. Soc. Am. 66, 1535–1539 (2018) [↩]
- Sax, H., Pittet, D., & Swiss-NOSO Network. Interhospital differences in nosocomial infection rates: importance of case-mix adjustment. Arch. Intern. Med. 162, 2437–2442 (2002) [↩]