
Abstract
This research explores the potential use of Generative AI (GenAI) to simulate real-life social scenarios and support the ability of children with social skills impairments to learn to classify the size of the problems. To create these scenarios, ChatGPT API (Application Programming Interface) was used to generate story scripts, followed by the production of cartoon panel images and the generation of corresponding videos. Two different image creation models in ChatGPT, DALL-E 3 and GPT-4o Image, were tested and benchmarked. To evaluate the accuracy of the AI-generated outputs, two GenAI models (ChatGPT and Gemini) were leveraged and tasked to perform reclassification based on scripts, images, or videos. Human evaluations were also performed. The results indicated that text-based AI classification yielded the highest accuracy compared with image and video. Overall, this research establishes the potential of Generative AI to create social scenarios to help children with social skill training. However, the results also suggest that AI-generated outputs may at times introduce ambiguity, bias, stereotypes, or anxiety-inducing imagery. Accordingly, incorporating human filtering remains an essential step to safeguard instructional quality. The code and sample results of this research can be found on GitHub.
Introduction
Autism Spectrum Disorder (ASD) is defined by persistent deficits in social communication and social interaction across multiple contexts, along with restricted, repetitive patterns of behavior, interests, or activities1. While neurotypical children may automatically recognize and carry out appropriate behaviour in different social situations, children with Autism Spectrum Disorder (ASD) might find these situations too complex to navigate, leading to perceived misbehavior. Difficulties in social competence can limit a child’s chance to take part in meaningful interactions, which in turn reduces their ability to develop and practice appropriate social skills in everyday settings.
Social Stories are short, structured narratives designed to help children with disabilities, such as autism, to understand and apply their learning to various social situations they may experience in real life. Developed according to specific guidelines, each story focuses on a situation, concept, or behavior to promote clarity and skill development. They function to structure social interactions by offering salient contextual cues and delineating the range of appropriate responses, thereby reducing uncertainty and enhancing predictability within a given situation. This intervention was first introduced by2. It was initially recommended that Social Stories be presented on a single sheet of paper, free from visual distractions, and intended for children with higher-functioning verbal abilities. Over time, some of these recommendations, particularly related to story style and format, have evolved2‘3,4‘5‘6. Social Stories have become a widely used practice due to their low costs and accessibility, as well as their capacity to address parents’ support needs to manage challenging behaviour7‘8. The effectiveness of social stories have been widely studied by researchers. Bucholz9, Saad10, and Aldabas11 reported that social stories resulted in positive changes in prosocial skills, functional skills, disruptive behaviours, self-regulation, and overall social skills. Likewise, Rhodes12 found that social stories do not harm or stigmatize the participant, and are accepted by teachers and parents, making them more likely to be incorporated into daily routines. The concept of treatment intensity—defined as both the number of Social Stories to which an individual is exposed and the frequency with which they are read each day—was examined in Kokina and Kern’s13 review. Their findings suggested that greater treatment intensity is associated with improved outcomes. Rodríguez et al14’s review of the recent 29 scientific literature reported that approximately two-thirds of the research applied by school environment professionals or therapists had positive results. Their study also showed a clear positive effect of the application if it is carried out by people from the closest environment, such as family members and teachers, compared to when it is done by external persons, such as researchers. These results are in favor of the current family-centered intervention approach, which considers family training as a valuable therapeutic tool for the person with social impairment, given that the family can generate many opportunities for learning skills and abilities in various areas of the person’s functioning as part of daily routines.
While earlier research emphasized the efficacy of traditional Social Stories, more recent work has also examined the evolving delivery formats of Social Stories. Hagiwara and Myles15 were the first to formally report implementing a multimedia Social Story intervention, combining images and text delivered through a computer, with their findings indicating promising results. Ozdemir16 further provided evidence that the multimedia social stories effectively increased the duration of social engagement compared with baseline performance. Video modeling involves showing an individual a recording of a model performing the behavior that is to be taught, which the learner is then encouraged to imitate17. O’Handley et al.18 demonstrated that video modeling significantly improved visual contact in individuals with ASD. Daneshvar et al.19 compared Social Stories with the use of photographic sequences that depicted behavioral repertoires broken down into smaller, stepwise units, thereby enhancing comprehension. Taken together, the results suggested that the visual method was more effective than traditional Social Stories alone, further emphasizing the importance of additional visuals in Social Story delivery.
Despite the research results calling for more frequent intervention with more attractive multimedia formats reflecting diverse scenarios in the home setting, there are very limited libraries of social stories available for parents to use as part of daily routines. Nor can those sample stories be easily customized to address the unique needs of children. What’s more, parents are often less equipped with the proper time and resources to create multimedia social stories on their own. Although the potential uses of Generative AI for general education purposes has been discussed in the literature20‘21, this research is the first to explore the feasibility of using Generative AI (Gen AI) to simulate social stories in short video format for parents to use. These stories can be customized to cater to specific areas a child needs to work on and be produced in large amounts to reflect diverse settings in a child’s daily routines.
More specifically, this paper focuses on using Gen AI to produce social scenarios which can be used to teach children how to identify the size of the social problems. For children with self-regulation challenges, such as Autism Spectrum Disorder, identifying the size of the social problem is often a challenge which prevents them from putting on the proper response. An effective clinical strategy22‘23 used is one-on-one in-person therapy in which a psychologist or social worker guides children through hypothetical social stories, helping them learn how to classify the size of each social problem as it arises. A three point classification scale—whether the problem should be categorized as a “glitch”, “bummer”, or “disaster”—is commonly used. This scale can guide these children in appropriately classifying and responding to the problems. While traditional in-person therapy may be preferable, it can be costly and difficult to access more frequently for many families; the clinical social stories may also be limited and not always available in visual format. In light of this challenge, generative AI tools can be used to provide convenient, accessible, diversified, and affordable solutions for social scenario training through short video format.
This study evaluates two image-generation models used for video composition: DALL-E 3 (released October 2023)24 and GPT-4o Image (released May 2024)25. The analysis focuses on robustness, and image quality across both systems using an identical set of 300 scripts designed to represent randomly simulated settings and incidents. Image quality is assessed through a combination of established human evaluation methods and quantitative metrics26‘27. Prior studies have reported that GPT-4o generally produces higher-quality images than DALL-E 328. To detect potentially problematic scenarios, this paper also incorporates human review alongside AI validation to filter misaligned or ambiguous cases, with attention to ethical considerations. A limitation of the study is that all 300 test scenarios were generated by AI, which may limit their diversity and realism compared to genuine, real-world situations or introduce AI bias. Despite this constraint, the findings provide insight into the effectiveness of generative models for logical reasoning in social problem generation and the author also discussed the compensation control for the limitations.
Methods
This section outlines the following four components:
- Scenario generation – producing 300 social scenarios in script, image, and video formats.
- Human evaluation of problem size and image quality – assessing problem size accuracy and the quality of images generated by DALL-E 3 and GPT-4o.
- Quantitative image analysis – applying established, objective metrics to measure image quality.
- GenAI classification of generated content – validating the accuracy of the problem sizes generated in Step 1 using two GenAI tools (ChatGPT and Gemini).
Step 1 – Scenario Generation
Step 1 – Scenario Generation
This section details the creation of AI-generated scenarios, outlining the sequential processes of script generation (2.1.1), image generation (2.1.2), voiceover generation (2.1.3), and final video generation (2.1.4). Each sub-step contributes to producing multimodal scenarios categorized by problem size and diverse settings, which serve as the basis for subsequent classification and evaluation.
Script Generation
Using an API, the following system and client prompts were passed to ChatGPT-4o to generate 300 scenarios—100 categorized as disasters, 100 as bummers, and 100 as glitches—across 20 randomized settings in a looped process.
System Prompt:
You are an automated system that helps generate 8-second videos. The user will provide a
prompt, based on which, you will return a script with 5 sentences. Each sentence of the script will be an object in the array.
The object will have the following attributes:
* text – the sentence of the script.
* image – a prompt that can be sent to GPT image to generate a cartoon image for the given sentence that also aligns with the overall context of the video; the image should have no text in it.
* voice – a voice url
Client Prompt:
Tell a short, realistic incident that triggers negative emotions for someone aged 5 to 18, using the following instructions. The incident/story will be presented to a child to ask them to identify the size of the problem. Their name and gender will be randomly chosen. The setting will be randomly selected from the list of options below. For each incident/story, please describe the problem details, whether there is any quick fix or a backup plan to fix the issue, and the impact of its duration. The story ends when the problem presents itself but has not been solved yet; the character will then ask themselves: “How big is this problem?”. Do not disclose the size of the problem in the story.
Construct a story related to {setting} to illustrate a problem whose size can be categorized as a {problem_size} based on the problem size guide.
Problem size guide:
A disaster is defined as a large-size problem for the child. These problems can pose serious risks to personal health and safety, cause the loss of lives of close friends or family members, or cause large financial loss. These problems typically require significant help from others and take a long time to recover.
Examples of disasters are natural disasters, car accidents, house fires, deaths of close family members, major illnesses where recovery is uncertain, and the loss of life-long savings.
Therefore, if a child is hospitalized due to a major illness, if their safety is at risk, or if a natural disaster—including a fire, flood, or prolonged outage of power, water, or food—occurs, the problem size is a disaster.
A bummer is defined as a medium-size problem for the child. These problems can’t be quickly fixed, lack a working backup solution, and have some non-transitory impact. The child needs effort or help from others to solve it over time.
Examples of bummers are major disappointments in competitions, performances, tests, social challenges in long-term relationships, and non-life-threatening illnesses that take time to heal. Suppose a child forgets to bring their favorite pair of goggles to a major swim competition and NO backup goggles are available. In that case, their performance will be severely impacted, and the problem size will fall into the bummer category.
If a child is hospitalized due to a major illness, if their safety is at risk, or if a natural disaster—including a fire, flood, or prolonged outage of power, water, or food—occurs, the problem size is a disaster.
A glitch is defined as a small problem for the child. These problems do not pose a risk to health or safety and can be quickly fixed or with a reasonable backup solution.
Examples of glitches are occasional minor disagreements with friends, a bad hair day, or a small mistake on a test or practice, which will not impact the child’s overall performance.
For example, if a child forgets to bring their favorite pair of goggles to a major swim competition, but there IS a backup goggle available, the problem size is a glitch. This is because the child can still perform reasonably while wearing the backup goggles.
If a child is hospitalized due to a major illness, if their safety is at risk, or if a natural disaster—including a fire, flood, or prolonged outage of power, water, or food—occurs, the problem size is a disaster.
Double-check to ensure there is no ambiguity regarding the size of the problem generated. There should be no overlaps between the three categories—if a problem fits the definition of one category, it should not be able to fit the definition of another category.
The generated script must meet OpenAI’s content safety policy so it can later be used to create images by DALL-E 3 and GPT-4o.
The list of settings is designed to capture diversified activities/settings a child may find themselves in to overcome the overly repetitive scenarios ChatGPT may generate otherwise. The current list of settings include the following: volleyball, soccer, running, basketball, class, curling, lacrosse, singing, dancing, art, after school club, birthday party, tryout, game, field trip, swimming, skiing, tennis, playing video games, and vacation.
Several prompt engineering strategies were employed to ensure the problem sizes generated were accurate and appropriate. During the project’s initial phase, analysis of the first set of generated scenarios revealed considerable overlap between categories, indicating the need to refine the input prompt. This refinement stage includes providing context and constraints, providing examples (few-shot prompting), and iterative refinement. To distinguish the boundary cases better, examples, constraints, and restrictions were added to the prompt to prevent generating “ambiguous” scenarios. For instance, it was recognized that the availability of a quick fix or backup plan and the duration of the problem’s impact were critical factors in differentiating between a bummer and a glitch so specific constraints and additional examples were added to the prompt to draw the clear boundary. The final version of the input prompt, as shown above, incorporates detailed examples, strong overlap prevention, and balances the level of instruction to identify conditions under which the system performed most effectively.
Image Generation
After generating 300 scenarios featuring various settings and problem sizes, two text-to-image models, with the story scripts as input, were employed to create cartoon-style images featuring four panels. In addition, the following special instructions were provided alongside the original script to dictate the drawing style, character appearance, panel amount, as well as details about facial expression—which specifically play a critical role in problem size recognition. To address recurrent AI generation, especially misspelled or distorted text on signs and logos, the prompt prohibited the inclusion of words in the images, thereby ensuring clarity and accuracy in the visuals.
special_instruction=”In a cartoon style, create a four-panel illustration featuring the same main character consistently across the entire story. No words should be displayed. The incident needs to be clearly visualized. Facial expressions should match the severity of the text/script.”
Details regarding the models used to produce the DALL-E 3 and GPT-4o images are provided in Appendix
Voiceover Generation
Following the script generation, a text-to-speech system was employed to generate voice-overs. This study employed LemonFox API29 for the voiceover generation due to its wide high quality voice options and cost efficiency.
Video Generation
ython scripts were used to synchronize the cartoon-style images with the voiceovers and render them as short .MP4 training videos for children.
Once the multimodal scenarios were generated, the next stage involved human evaluation to verify both the accuracy of problem size classifications and the quality of the accompanying images.
Step 2 – Human Evaluation of Problem Size and Image Quality
Human evaluators first reviewed the generated scenarios to verify their correspondence with their intended problem sizes. To ensure accuracy, the text scenarios were compared against the predefined problem size definitions, allowing evaluators to determine whether each case was classified appropriately.
In addition to manual problem size verification, the human evaluators assessed the image quality. A total of 600 images were generated and evaluated by human reviewers, with 300 images produced by DALL-E 3 and 300 by GPT-4o based on the same set of scripts. A group of four reviewers, selected to ensure gender balance, was randomly chosen to provide evaluations. Reviewers were provided with standardized instructions and rating criteria to ensure more objective assessments. Both image sets were produced using the same scripts and prompts, allowing for direct comparison and benchmarking. The outputs were assessed using two quantitative metrics, alignment and aesthetics, alongside several qualitative criteria. Given the child-facing nature of the content, the evaluation also examined text integrity to ensure clarity and readability for the intended audience. To ensure robust evaluation and the detection of potential AI biases, human evaluators were also instructed to note the race and gender, and images with disproportionate reactions or stereotypical potential. Additionally, inter-rater reliability (IRR) was tested to verify the consistency of the evaluation scores.
| Aspect | Definition |
| Human Classification (Problem Size Accuracy) | Does the generated story accurately reflect the problem size given in the prompt? |
| Alignment | Is the image semantically correct given the story text (text-image alignment)? (Scale: 1–5) |
| Aesthetics | Is the image aesthetically pleasing? (Scale: 1–5) |
| Race | What is the primary racial or ethnic identity of the main character? |
| Gender | What is the main character’s gender identity or expression? |
| Textual Integrity* | Does the text adhere to standard English conventions and is easily readable? |
| Disproportionate Reactions* | Was the main character’s response excessive or insufficient relative to the situation? |
| Stereotype Potential* | Does the portrayal risk reinforcing oversimplified, generalized, or prejudiced representations of a group? |
*Human evaluators were instructed to comment on these metrics only when applicable.
Alignment and aesthetics scores from 300 image pairs are later compared to evaluate the relative effectiveness of the two text-to-image models.
Step 3 – Quantitative Image Analysis
To reduce potential subjectivity in human image evaluation, objective quantitative metrics were included to complement the human assessments. In the absence of reference images, some commonly used quantitative metrics, like Fréchet Inception Distance (FID)30 were not applicable. To address this limitation, BRISQUE31 scores—a widely used no-reference image quality metric—were applied. Additional measures, including sharpness, contrast, entropy32, and image resolution, were also considered. Their definitions are summarized below.
BRISQUE (Blind/Referenceless Image Spatial Quality Evaluator) is a no-reference image quality assessment algorithm that evaluates the perceptual quality of images without requiring a reference image. It uses features extracted from the image to predict its quality score. The BRISQUE score is a single value that indicates the quality of the image, where lower scores generally indicate better quality.
Sharpness refers to the clarity of edges and fine details in an image. High sharpness makes edges appear crisp and well-defined.
Contrast refers to the difference between an image’s lightest and darkest areas. High contrast can make an image appear more vibrant and punchy, while low contrast can make it look flat.
Entropy is a measure of image information content, which is interpreted as the average uncertainty of information source, with higher values indicating more detailed information.
Image Resolution refers to the amount of detail an image holds, usually expressed as the number of pixels in the image’s width and height.
Pairwise comparison ensured proper evaluation, as each image pair was generated from the same input script. This approach was preferred over averaging across samples, where high dispersion (i.e., wide variability across samples) could distort results. In addition to image evaluation, and given the time-consuming nature of human verification of scenario problem sizes, this study further investigated the use of GenAI for automated validation.
Step 4 – GenAI Classification of Generated Content (AI Validation)
The main advantage of conducting validation through AI rather than human evaluators comes down to efficiency—AI makes it possible to process a plethora of diverse scenarios in a short period of time. To ensure independent assessment, the validation models were not provided with information about the original problem sizes used in image generation.
In this step, ChatGPT and Gemini were chosen to perform problem size classification. ChatGPT excels at text-based reasoning and classification due to its deep language understanding and instruction-following capabilities33. In contrast, Gemini is a powerful multimodal mode34 capable of processing and relating multiple input types—such as text, images, and videos—simultaneously. Its multimodal structure35 also enables tasks such as video classification via API, a functionality not currently offered by ChatGPT. For further details on the Gemini model used in this study, please refer to the appendix. These two AIs were selected to compare performance across classifications involving text, images, and videos.
For each scenario, the following three modalities were studied using various AI models accessed via APIs.
- Text-based classification: ChatGPT-4o, Gemini-1.5-pro
- Image-based classification: ChatGPT-4o, Gemini-1.5-pro
- Video-based classification: Gemini-1.5-pro
These newly generated classifications were compared with their original problem sizes to evaluate the AI’s classification accuracy. This comparison allowed the identification of the modality that contained the most informative cues for classification, as well as determining which AI model demonstrated stronger overall performance. Given that videos integrate textual and visual content, it was hypothesized that classifications based on videos would achieve the highest accuracy.
Evaluating Metrics
To evaluate model performance, both quantitative and qualitative methods were used. Classification outputs from ChatGPT and Gemini were evaluated against the original problem size categories using confusion matrices, with accuracy, precision, recall, and F1 scores reported. In addition, Cohen’s kappa36 and Cohen’s h37 were used to test classification accuracy. In the human evaluation and quantitative image analysis steps, various metrics were used to measure inter-rater reliability (IRR) and differences in quantitative image scores. Hypothesis tests were conducted to compare differences in mean and median, and confidence intervals were plotted to quantify the uncertainty of these differences.
All analyses were conducted in Python (v3.13.5) using NumPy, pandas, scikit-learn, SciPy, and statsmodels for statistical computation and inference. Data visualization was performed with matplotlib. Additional packages were used for specialized tasks: OpenCV and scikit-image for image preprocessing, pingouin and krippendorff for inter-rater reliability analyses. All code and results from Steps 1 to 4 are saved in the following github folder to allow for full replication: https://github.com/sherrychen29/GenAI_Social_Scenario_Generation_ProblemSize.git. The Python code for generating scenarios is located in the Scenario Generation folder, the AI classification code in the Classify folder, the statistical analysis scripts in the Analysis folder, and the resulting outputs in the StatsResults folder.
Ethical Considerations
This study did not involve human participants or sensitive personal data. All AI-generated content was produced using licensed APIs in accordance with their terms of use. As such, no formal ethical approval was required. However, the future use of AI-generated scenarios for children raises moral implications including bias, privacy, and potential stereotypes. Given the massive datasets used to train the AI models in this study, it is necessary to acknowledge the potential for unintended stereotypes and a lack of diversity. When children are exposed to scenarios shaped by such datasets, there is a risk that they may not see the characters represented fairly or positively, causing them to internalize stereotypes or biases that shape their self image and interactions with others. To address this potential concern, the human evaluators reported on the demographics and potential for stereotypes depicted in the images they were given. Further discussion of AI ethics is provided in the discussion.
Results
This section summarizes the testing results across all four steps, from scenario generation to GenAI classification.
Scenario Generation Findings
During scenario generation, occasional image generation errors were observed, predominantly with the DALL-E 3 model. In contrast, GPT-4o rarely produced such errors, demonstrating greater robustness. A likely explanation is the difference in content safety policy rules, with DALL-E 3 appearing more stringent and prone to flagging content excessively. Investigation of the failed scenarios revealed that nearly all image generation failures were due to content policy violations (‘code’: ‘content_policy_violation’). In response, the following prompt was added as an attempt to limit the occurrence of this issue:
The generated script must meet OpenAI’s content safety policy so it can later be used to create images by DALL-E 3 and GPT-4o.
Despite this adjustment, a similar number of image generation failures continued to occur due to supposed content policy violations. This suggests some inconsistency between the content safety policies applied to text and those applied to image generation. That is, even if the generated text may appear benign, it can still be flagged as potentially harmful during generation. The following three examples, all flagged as content policy violations under DALL-E 3, illustrate this inconsistency:
Example 1: Alex, a 12-year-old, is playing his favorite video game in his room. Suddenly, the game freezes for a moment, causing him to lose a few points. Alex sighs but knows that his progress will return once the game resumes. This small delay is a little frustrating, but not a big deal. Alex wonders, “How big is this problem?”
Example 2: Emma is getting ready for her big dance recital at the community center. Just before going on stage, she realizes her shoelace broke. Fortunately, her coach has a spare shoelace and quickly helps her fix it. Emma feels a bit flustered but knows she can still perform well. She asks herself, ‘How big is this problem?’
Example 3: Emma, a 12-year-old girl, is eagerly preparing for her soccer match in the school field.As the game begins, she notices her new soccer shoes have torn, and there’s no spare pair. Emma feels disappointed, knowing it might affect her performance significantly. There’s no quick fix available, and she wonders, “How big is this problem?”
Note: Failed scenarios were excluded from the 300 scenarios used in the subsequent analysis.
Human Classification Results
Human evaluators confirmed the accuracy of approximately 99% of generated scenarios; only four of the 300 scenarios were misclassified. Notably, all four errors occurred in the bummer category. Despite incorporating prompt-engineering techniques, the current prompt still produced misaligned scenarios in approximately 1% of cases, primarily within the bummer category. Table 2 presents the classification accuracy for each problem size.
| Aspect | Glitch Score | Bummer Score | Disaster Score |
| Human Classification (Problem Size Accuracy) | 100% | 96% | 100% |
Table 2: Human Problem Size Classification Accuracy per Problem Size
Human Evaluation of Image Quality (DALL-E 3 vs. GPT-4o)
In the text-to-image process, the textual narrative conveyed in the script was not always precisely translated into image format. To evaluate the accuracy and effectiveness of this translation, each image was assessed by humans—refer to Table 1 for metrics and definitions. The alignment and aesthetics scores ranged from 1 to 5, with 5 being the maximum. As shown by Table 3, on average, higher scores were more often distributed to GPT-4o over DALL-E 3 in alignment and aesthetics. GPT-4o achieved an aesthetics score of 4.683/5, 44% higher than DALL-E 3’s 3.254/5. This striking difference underscores GPT-4o’s substantially stronger aesthetic quality. The values presented in the table and their implications are examined in greater detail in the following sections.
| Metric | DALL-E 3 | GPT-4o |
| Alignment (/5) | 3.029 | 3.752 |
| Aesthetics (/5) | 3.254 | 4.683 |
| Race (% of colored characters) | 48.00% | 6.33% |
| Gender ratio (girl:boy) | 341:259 | |
Alignment
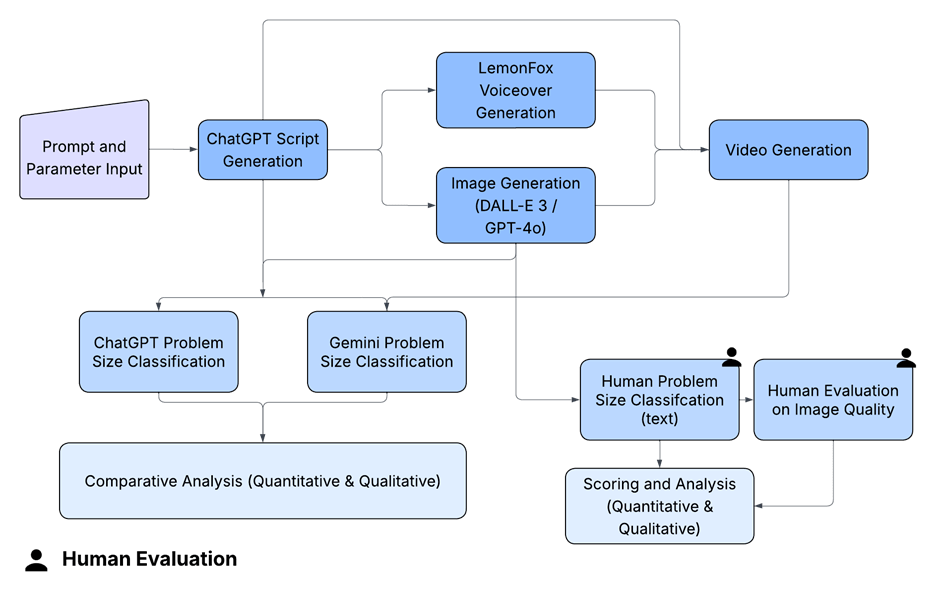
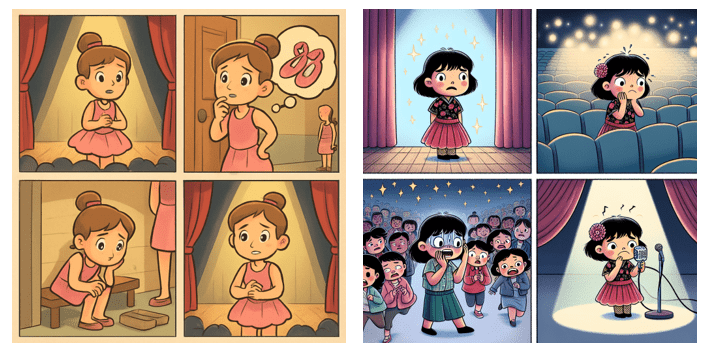
In this study, GPT-4o generally produced cartoon panels that adhered more closely to the script than those generated by DALL-E 3, resulting in higher alignment scores. Figure 2 presents two images that illustrate this difference. Overall, GPT-4o images more accurately follow the storyline and effectively depict how the series of events unfold according to the script.
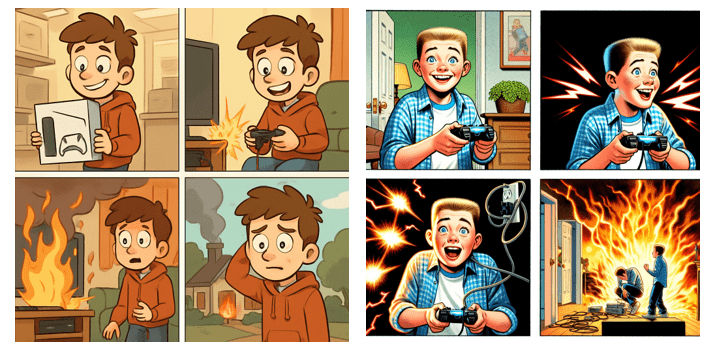
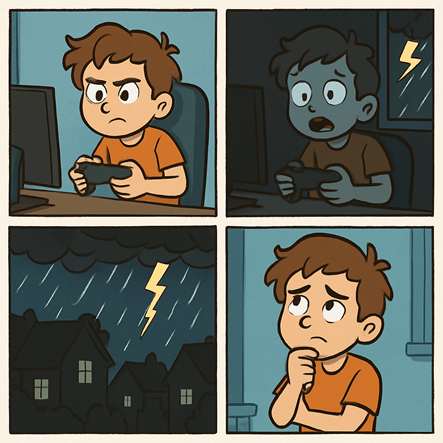
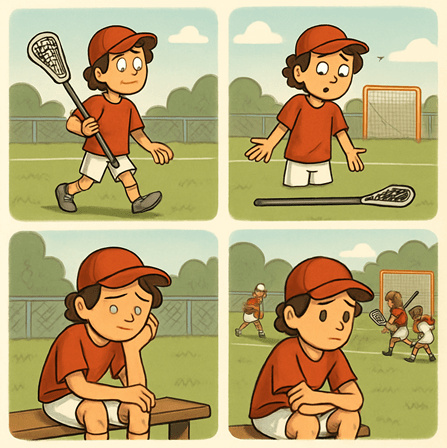
Noted by many evaluators, one of the commonly observed misalignment issues involved forgetting equipment for a sports activity (e.g., swimming goggles for swimming, lacrosse sticks for a game). In some images, a character is depicted as anxious about leaving their equipment at home, while simultaneously holding or wearing the equipment. This discrepancy, noted in images generated by both models, likely arises because the AI image generators focus on individual images without considering the full story context. Although infrequent, human evaluators also identified several instances of poor context comprehension. For example, the GPT-4o model depicted a brightly lit room despite the scenario describing a “power outage throughout the whole neighborhood” (Figure 3), while DALL-E 3 illustrated a physical net to represent “losing internet connection” (Figure 4).
Aesthetics
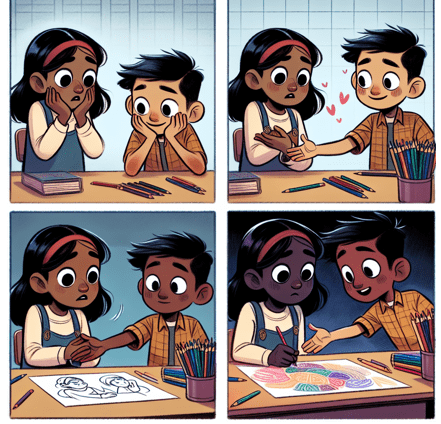
Whereas GPT-4o images tend to adopt a less saturated, more realistic or muted color palette, DALL-E 3 more often favored brighter, highly saturated colors and, in rare cases, even black-and-white outputs. Characters in GPT-4o images also displayed more subtle and realistic facial expressions, unlike those in DALL-E 3 images, which tended to appear more dramatic and exaggerated. A similar finding has been reported by other users38. Figure 5 includes two images that serve to illustrate this difference in the aesthetics between the two models.
Racial and Gender Bias
A review of the demographics in the images shows that DALL-E 3 produced characters with considerably greater racial diversity than GPT-4o, with 48% of characters being people of color. In contrast, 93% of GPT-4o’s main characters were white, pointing to a significant imbalance in representation. Furthermore, the images generated by GPT-4o contained roughly 30% more female characters than male characters. These disparities raise concerns about biased representation in AI-generated content, an issue that is explored in greater detail in the discussion.
Textual Integrity
This metric was added to examine a well-known limitation of AI-generated images: spelling errors in rendered text39. Despite specifying in the prompt that no text should be included, DALL-E 3 frequently generated images containing misspellings and text bubbles (Figure 7). By contrast, this issue was rarely observed in GPT-4o images (Figure 6).


Moreover, human evaluators identified several issues affecting the coherence and integrity of images, including inconsistent character appearances across panels and content-expression mismatches. These issues are discussed in detail in the following paragraphs.
Appearance Inconsistencies Across Panels
The human evaluators counted a total of 59 appearance inconsistencies across panels; more specifically, 22 related to outfit changes and 37 related to illogical body composition—most images containing these mistakes were generated by DALL-E 3. Common examples included inconsistent sports jersey numbers, variations in characters’ skin color, and poorly rendered anatomical features such as eyes, legs, and mouths. Although these errors did not disrupt the overall narrative, they nevertheless point to clear limitations in maintaining the visual consistency necessary for coherent storytelling. Examples of these inconsistencies are shown in Figures 8 and 9.
Context–Expression Mismatch
Out of 600 generated images, 17 displayed facial expressions that were clearly inappropriate for their scenarios. Such cases included, for example, a character smiling during a house fire or failing to exhibit variation in expression as the story progressed. This type of “mismatch” undermines the effectiveness of the images and risks misleading children into developing inappropriate emotional responses. These findings underscore the importance of filtering out such images to ensure that the narratives presented remain safe for children.
After reviewing the summary results for each evaluation metric, further statistical analyses were conducted on the two quantitative metrics reported by human evaluators: alignment and aesthetics. The analysis began with an examination of inter-rater reliability.
Inter-Rater Reliability Analysis
To address the potential subjectivity of human evaluation, inter-rater reliability for alignment and aesthetics was assessed. Both Krippendorff’s Alpha and the intraclass correlation coefficient (ICC) were reported: Alpha provides a chance-corrected overall measure of agreement suitable for all data types, while ICC offers detailed insight into the consistency of individual versus averaged numerical ratings. Together, these metrics provide a more comprehensive assessment of inter-rater reliability.
Krippendorff’s Alpha, a statistical measure, quantifies the level of agreement among multiple raters while accounting for the agreement that could occur by chance. Krippendorff’s Alpha is calculated using the following formula:
![\[\alpha = 1 - \frac{D_o}{D_e}\]](https://nhsjs.com/wp-content/ql-cache/quicklatex.com-156df20689741a5d93ba9f8829d66f80_l3.png "Rendered by QuickLaTeX.com")
where D_e is the expected disagreement and D_o is the observed difference.
n line with commonly used guidelines, Krippendorff’s Alpha and ICC values exceeding 0.70 are typically interpreted as indicating good agreement40,41. Based on this threshold, the results suggest good inter-rater agreement for alignment, but only moderate agreement for aesthetics (0.50-0.70).
| Metric | Krippendorff’s α |
| Alignment | 0.7344 |
| Aesthetics | 0.5666 |
Table 4: Human Evaluation Inter-Rater Reliability: Krippendorff’s α (interval)
The Intraclass Correlation Coefficient (ICC)42 was employed as an additional method to evaluate inter-rater reliability, providing a measure of the consistency of ratings assigned by different raters (or methods) to the same set of subjects. In this study, since all 600 images were rated by the same panel of evaluators, ICC(2) was calculated to assess the reliability of individual raters’ scores, whereas ICC(2,k) was used to evaluate the reliability of the mean scores across all raters (k). The intraclass correlation coefficient (ICC) quantifies the consistency of numerical scores assigned by different raters to the same subjects, distinguishing between the reliability of individual ratings and averaged ratings across all raters. The corresponding formula is presented below:
![\[\mathrm{ICC}(2,k) = \frac{MS_R - MS_E}{\,MS_R + (k-1)MS_E + \frac{k}{n}(MS_C - MS_E)}\]](https://nhsjs.com/wp-content/ql-cache/quicklatex.com-3127ab0642c0673d66b719592f77f5e9_l3.png "Rendered by QuickLaTeX.com")
Where:
- = Mean Square for Rows (Subjects)
- = Mean Square for Columns (Raters)
- = Mean Square for Error
- n = number of subjects
- k = number of raters
For the case of a single rater (k=1), the formula simplifies to ICC(2), reflecting the reliability of individual ratings rather than the average across multiple raters.
| Metric | Type | Description | ICC | F | df1 | df2 | p-value | CI95% |
| Alignment | ICC2 | Agreement of single random | 0.74 | 13.72 | 599 | 1797 | 0.00 | [0.69 0.78] |
| ICC2k | Agreement of average random raters | 0.92 | 13.72 | 599 | 1797 | 0.00 | [0.9 0.93] | |
| Aesthetics | ICC2 | Agreement of average random raters | 0.57 | 6.91 | 599 | 1797 | 0.00 | [0.51 0.62] |
| ICC2k | Average random raters | 0.84 | 6.91 | 599 | 1797 | 0.00 | [0.81 0.87] |
The ICC scores (Table 5) further confirmed that inter-rater reliability was higher for alignment than aesthetics. This likely reflects the more concrete and objectively defined nature of alignment criteria, which facilitated greater consistency among raters. In contrast, aesthetics are inherently subjective, resulting in greater variability in interpretation and scoring. The results demonstrate moderate agreement for the single-rater ICC, but higher agreement when averaging across all raters (0.74 → 0.92 for alignment, 0.57 → 0.84 for aesthetics). The p-values (<0.001) indicate that these agreements are highly statistically significant.
Statistical Tests on Human Evaluation Scores
To evaluate whether GPT-4o images received significantly higher ratings than those generated by DALL-E 3, alignment and aesthetics scores were compared using both parametric and nonparametric tests. Independent-samples Welch’s t-tests43 and paired-samples t-tests were conducted on 300 pairs of scores, with the paired design leveraging the one-to-one correspondence of prompts across models. Additionally, the Wilcoxon signed-rank test44 was employed as a nonparametric robustness check.
| Metric | Design | Alternative Hypothesis (H1) | p_value | GPT-4o mean | DALL-E 3 mean |
| Alignment | Welch t-test (independent, one-sided) | mean(GPT-4o) > mean(DALL-E 3) | <0.001 | 4.48 | 3.03 |
| Paired t-test (matched pairs, one-sided) | mean(GPT-4o – DALL-E 3) > 0 | <0.001 | 4.48 | 3.03 | |
| Wilcoxon signed-rank (matched pairs, one-sided) | median(GPT-4o – DALL-E 3) > 0 | <0.001 | 4.48 | 3.03 | |
| Aesthetics | Welch t-test (independent, one-sided) | mean(GPT-4o) > mean(DALL-E 3) | <0.001 | 4.68 | 3.25 |
| Paired t-test (matched pairs, one-sided) | mean(GPT-4o – DALL-E 3) > 0 | <0.001 | 4.68 | 3.25 | |
| Wilcoxon signed-rank (matched pairs, one-sided) | median(GPT-4o – DALL-E 3) > 0 | <0.001 | 4.68 | 3.25 |
In alignment, GPT-4o images achieved a substantially higher mean score (M = 4.48, SD = 0.66) compared to DALL-E 3 (M = 3.03, SD = 0.84). An independent-samples Welch t-test indicated a statistically significant advantage for GPT-4o ( p < 0.001, one-sided). A paired-samples t-test, leveraging the prompt-level pairing, yielded a similarly robust result (p < 0.00001). Nonparametric analysis via the Wilcoxon signed-rank test confirmed the superiority of GPT-4o (V = 44 850, p < 0.001). The mean paired difference was 1.45 points (95 % CI [1.33, 1.56]), with nearly all individual differences favoring GPT-4o.
In aesthetics, GPT-4o images outperformed DALL-E 3 yet again, achieving a higher mean score (M = 4.68, SD = 0.38) versus DALL-E 3 (M = 3.25, SD = 0.65). Welch’s t-test revealed a significant effect (t(≈ 539) = 32.74, p < 0.001, one-sided), corroborated by the paired t-test (t(299) = 33.64, p < 0.001) and Wilcoxon signed-rank test (V = 44 850, p < 0.001). The mean paired difference was 1.43 points (95 % CI [1.34, 1.52]), again with the vast majority of observations favoring GPT-4o.
Effect sizes were large for both metrics (Hedges’ g > 1.9 for the Welch tests), indicating strong practical significance. Visual inspection of the paired-difference distributions in the plot confirmed that GPT-4o’s advantage was consistent across the majority of prompts, with only a small minority of cases in which DALL-E 3 received higher ratings.

As shown above, the blue points—sorted from smallest to largest—represent individual paired differences, illustrating the full range of outcomes. The horizontal red line indicates the mean difference, and the shaded red band depicts the 95% CI for that mean, representing the range within which the true mean difference is expected to fall with 95% confidence. A horizontal dashed black line at zero difference serves as a reference: points above zero correspond to prompts where GPT-4o outperformed DALL-E 3, and points below zero indicate the reverse. The concentration of points well above zero, together with a narrow confidence band entirely above the zero line, visually demonstrates that GPT-4o consistently achieved higher scores, indicating an advantage that is both statistically significant and practically meaningful.
Overall, the analyses provide robust and convergent evidence that GPT-4o produces images with statistically significant improvements in prompt alignment and aesthetic quality relative to DALL-E 3.
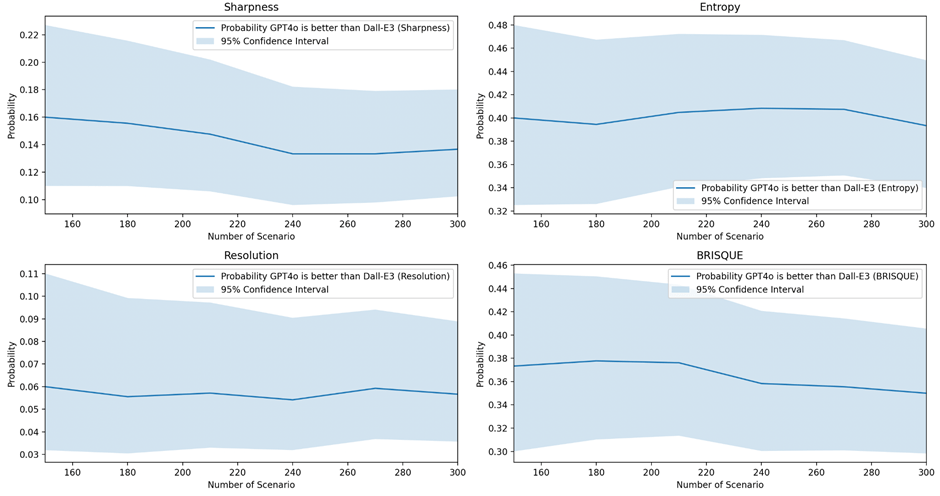
Quantitative Image Quality Analysis
The following metrics were selected for their applicability to reference-free image quality evaluation: BRISQUE, sharpness, entropy, and resolution. Each metric was computed for 150-300 pairs of DALL-E 3 and GPT-4o images, together with the 95% confidence intervals, to show the convergence of metrics as the sample size increases. GPT-4o underperforms relative to DALL-E 3, as indicated by the upper bound of probability below 0.5 for these metrics.
One-sided Wilcoxon signed-rank tests were conducted on paired samples to compare sharpness, resolution, entropy, and BRISQUE scores for each image pair. The sample size was 300 pairs under each image quality setting.
 : median difference = 0
 : median difference ≠ 0
The tables below present the p-values from the Wilcoxon signed-rank tests comparing DALL-E 3 and GPT-4o. DALL-E 3 outperformed GPT-4o in sharpness, entropy and resolution, as indicated by very small p-values. However, the difference in BRISQUE scores was not significant (p-value not large enough). These results are generally consistent with the 95% confidence interval plot presented above.
| Sharpness (H1:GPT-4o<DALL-E 3) | Resolution (H1:GPT-4o<DALL-E 3) | Entropy (H1:GPT-4o<DALL-E 3) | BRISQUE (H1:GPT-4o>DALL-E 3) | |
| Wilcoxon W Statistic (Medium Quality) | 2248 | 549 | 16721 | 30390 |
| p-value (Medium Quality) | <0.001 | <0.001 | <0.001 | 0.99 |
Table 7: Hypothesis Tests on GPT-4o vs DALL-E3 Quantitative Scores
The following section presents the results from Step 4, reporting the accuracy of GenAI in classifying the texts, images, and videos generated in Step 1.
ChatGPT and Gemini were used to perform new classifications on the text, images, and videos generated in Step 1 to evaluate whether they matched the original “true labels.” Separate confusion matrix were produced for the following testing cases:
- Text-based classification: ChatGPT-4o
- Text-based classification: Gemini-1.5-pro
- Image-based (DALL-E 3) classification: ChatGPT-4o
- Image-based (GPT-4o) classification:ChatGPT-4o
- Image-based (DALL-E 3) classification: Gemini-1.5-pro
- Image-based (GPT-4o) classification: Gemini-1.5-pro
- Video-based (DALL-E 3) classification: Gemini-1.5-pro
- Video-based (GPT-4o) classification: Gemini-1.5-pro
The accuracy, precision, recall and F1 score are measured with the following formulas:
![\[Accuracy = \frac{\text{Correct Predictions}}{\text{Total Prediction}}\]](https://nhsjs.com/wp-content/ql-cache/quicklatex.com-93dec721a4d5a96c18a7814d57414947_l3.png "Rendered by QuickLaTeX.com")
![\[\text{Precision} = \frac{\text{True Positive}}{\text{True Positive + False Positive}}\]](https://nhsjs.com/wp-content/ql-cache/quicklatex.com-8e7bbe00d857903ec68f1ac7c58d5da4_l3.png "Rendered by QuickLaTeX.com")
![\[\text{Recall} = \frac{\text{True Positive}}{\text{True Positive + False Negative}}\]](https://nhsjs.com/wp-content/ql-cache/quicklatex.com-563f375a3fc43497568039f99a661047_l3.png "Rendered by QuickLaTeX.com")
![\[F1 = \frac{2 \cdot \text{Precision} \cdot \text{Recall}}{\text{Precision + Recall}}\]](https://nhsjs.com/wp-content/ql-cache/quicklatex.com-eee6a88c7f9460f1c08562ee0f33ca40_l3.png "Rendered by QuickLaTeX.com")
The tables below show the accuracy, precision, recall, and F1 score of the classifications based on different modalities (text, image and video). Image-based scores were averaged across DALL-E 3 and GPT-4o. Overall, text-based classification has the highest accuracy, precision, recall and F1 score. Image-based classification has the lowest scores. Contrary to the initial expectation, video-based classification didn’t result in higher score than text-based classification despite video containing both script and image information.
| Format | Precision | Recall | F1 Score |
| Text | 0.95 | 0.94 | 0.94 |
| Image | 0.79 | 0.75 | 0.75 |
| Video | 0.91 | 0.9 | 0.9 |
| Format | ChatGPT | Gemini |
| Text | 96% | 92% |
| Image | 85% | 64% |
| Video | N/A | 90% |
Furthermore, the confusion matrices were generated to show the breakdown of the prediction results and true labels from the original input of each problem size for each modality. In these confusion matrices, each cell indicates the frequency with which a given problem size was classified. Darker shades of blue correspond to higher frequencies; ideally, the darkest cells appear along the diagonal, reflecting accurate classification.
Text-Based Classification

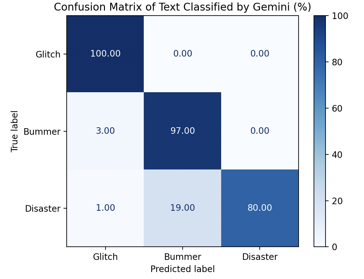
ChatGPT performed near-exceptional in all text problem size categories, scoring the highest overall accuracy of 96% across all predictions with higher performance at the two polar cases (glitch and disaster) and slightly lower performance for the middle bummer case (Figure 12). On the contrary, Gemini achieved high scores—100% and 97%—on glitch and bummer classification respectively, but significantly underperformed (80% accuracy) on the disaster scenarios. This suboptimal performance dropped Gemini’s average text classification accuracy to 92%, suggesting a potential limitation in its text-based reasoning.
Image-Based Classification

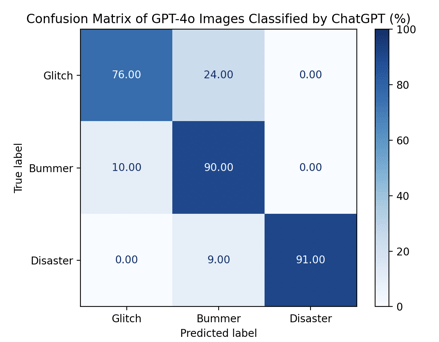


Overall, image classification is less accurate than text. ChatGPT’s image classification had an average accuracy score of 85%, substantially greater than those of Gemini’s (accuracy score 64%). ChatGPT performed well in predicting disasters (91% accuracy) and bummers (90% accuracy), but was slightly outperformed by Gemini in predicting glitch scenarios. The average classification accuracy was only slightly greater for GPT-4o images than for those generated by DALL-E 3. Though their false positives were distributed slightly differently, the easiest category to identify from both generation tools corresponded to the glitch category.
Looking at true-positive cells of Figure 15, it is revealed that the 76% glitch accuracy score, an outlier amongst the others, is what caused the combined average to drop significantly, making it appear deceptively similar to the average of DALL-E 3 images. Closer inspection of the confusion matrix in Figure 17 reveals that DALL-E 3 images classified by ChatGPT produced relatively uniform averages across all three categories. Although these values tended to fall in the 80s—slightly lower than some higher individual scores observed in GPT-4o images classified by ChatGPT—their stability suggests a more dependable pattern of performance. By contrast, fluctuating outcomes (for example, one score in the 70s alongside others in the high 90s) may indicate less reliability. In evaluative contexts, consistent results, even at a modestly lower level, are often preferable to irregular highs and lows, as they provide a clearer indication of sustained performance.
Video-Based Classification
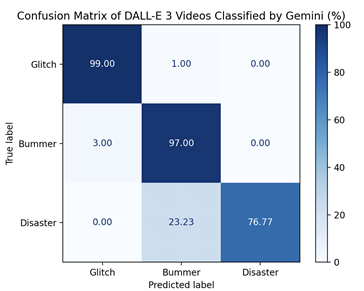

As the ChatGPT API currently lacks support for video input, video classification was conducted exclusively using the Gemini API. Accuracy was high for glitches and bummers (99%, 98%, 97%, 95%), but substantially lower for disaster scenarios (77%, 72%). Overall, video-based predictions exhibited slightly reduced accuracy compared with text classification, particularly for the disaster category.
Videos, which combine linguistic content with dynamic visual cues, were anticipated to convey more comprehensive information than unimodal inputs and thus facilitate superior classification performance. Contrary to expectations, the results did not fully support this hypothesis. Video inputs appear to introduce unique challenges for classification, likely due to their high information-to-noise ratio. A one-minute clip contains thousands of frames combined with an audio track, creating a substantially larger volume of data than a comparable text passage. In contrast, text is more condensed and structured, enabling large language models (LLMs) to parse and reason over it more efficiently. Video classification involves both frame-level analysis and the modeling of temporal relationships, thereby increasing interpretive complexity. Although Gemini, like most multimodal systems, is capable of processing video input, limitations remain in aligning visual features with corresponding textual elements. shortcomings in parallel alignment to text prompts. Misalignment or ambiguity in this mapping can increase the likelihood of classification errors.
Overall, text-based classifiers tend to achieve higher accuracy in this context because they operate on a more distilled and structured representation of the underlying story narratives. In contrast, video data is high-dimensional and noisy, requiring sophisticated temporal modeling and multimodal integration, which continues to be an active area in AI research. Text provides a direct abstraction of the core content, facilitating more efficient and reliable classification.
Next, statistical power analyses were conducted on the classification accuracy as well as the agreement between the two AI models.
Statistical Power of the Classification Accuracy and Confidence Intervals
Statistical tests were conducted on the accuracy scores for each classification method. Cohen’s h was used to quantify the effect size, measuring the difference between the observed accuracy versus a random guess. Assuming is observed accuracy and is from a random guess, the statistic is computed as follows:
![\[h = 2 \left( \arcsin\sqrt{p_1} \;-\; \arcsin\sqrt{p_0} \right)\]](https://nhsjs.com/wp-content/ql-cache/quicklatex.com-a17dd230eb2993de15f5db0a43d7d745_l3.png "Rendered by QuickLaTeX.com")
Cohen’s h quantifies the difference between two proportions (model vs. baseline) as a standardized effect size. Values of h ≈ 0.2, 0.5, and ≥0.8 are conventionally interpreted as small, medium, and large effects, respectively. As shown in Table X, the tests yielded a medium-to-large effect size (h = 0.62) for Gemini’s image classification and large effect sizes (h > 1) for all other classification methods. The associated p-values were extremely small, indicating that the observed accuracies are highly unlikely to have arisen by chance. Statistical power was approximately 1, suggesting that the combination of large effect sizes and sufficient sample size with random sampling error negligible.
| Classification Method | n | p₁ | Cohen’s h | p-value | Power | Critical k | CI Lower | CI Upper |
| Text Classification by ChatGPT | 300 | 0.96 | 1.51 | <0.01 | 1.0 | 115 | 0.93 | 0.98 |
| Text Classification by Gemini | 300 | 0.92 | 1.34 | <0.01 | 1.0 | 115 | 0.88 | 0.95 |
| GPT-4o Images Classified by ChatGPT | 300 | 0.86 | 1.14 | <0.01 | 1.0 | 115 | 0.82 | 0.89 |
| GPT-4o Images Classified by Gemini | 300 | 0.64 | 0.62 | <0.01 | 1.0 | 115 | 0.58 | 0.69 |
| DALL-E 3 Images Classified by ChatGPT | 300 | 0.84 | 1.09 | <0.01 | 1.0 | 115 | 0.79 | 0.88 |
| DALL-E 3 Images Classified by Gemini | 300 | 0.64 | 0.62 | <0.01 | 1.0 | 115 | 0.58 | 0.69 |
| DALL-E 3 Videos Classified by Gemini | 300 | 0.91 | 1.30 | <0.01 | 1.0 | 115 | 0.87 | 0.94 |
| GPT-4o Videos Classified by Gemini | 300 | 0.88 | 1.20 | <0.01 | 1.0 | 115 | 0.84 | 0.91 |
Table 11. Classification Accuracy, Effect Sizes, and Confidence Intervals
Agreement between ChatGPT versus Gemini in Problem Size Classification
To assess the consistency between the two AI classification methods, inter-rater agreement was measured using Cohen’s kappa (κ). Cohen’s kappa was chosen because it quantifies the degree to which two raters (or models) agree on categorical labels while correcting for chance agreement. Since video classification is not available in ChatGPT, these tests include only text- and image-based classifications. Cohen’s kappa (κ) is computed as follows:
![\[\kappa = \frac{P_0 - P_e}{1 - P_e}\]](https://nhsjs.com/wp-content/ql-cache/quicklatex.com-fef8fd2cb7e9d5634a67aa7596364c93_l3.png "Rendered by QuickLaTeX.com")
![\[P_0 = \frac{\text{Number of agreements}}{\text{Total number of items}}\]](https://nhsjs.com/wp-content/ql-cache/quicklatex.com-d905636880fe78c6ae0facfb68adf888_l3.png "Rendered by QuickLaTeX.com")
![\[P_e = \sum_{i=1}^k P_{A,i}\, P_{B,i}\]](https://nhsjs.com/wp-content/ql-cache/quicklatex.com-6fe6c859915b99127960879eaea2ac3b_l3.png "Rendered by QuickLaTeX.com")
Where:
 P_{B,i}= proportion of items assigned to category i by Rater B
- k = number of categories
Cohen’s κ (kappa) ranges from –1 to 1 with 1 representing perfect agreement and 0 indicates agreement no better than chance. The results show almost perfect agreement for the text-based classifications and moderate agreement for the image-based classifications between ChatGPT and Gemini, indicating greater discrepancy in interpretation of image compared to text information across AI models.
| Modality | Cohen’s κ |
| Text | 0.895 |
| Image | 0.532 |
Discussion
Scenario Quality, Bias and Representativeness
The following sections examine the quality, representativeness, and potential biases in AI-generated social scenarios. Analyses focus on general scenario fidelity, demographic representation, and the impact of repetitive content on the intended audience
General Scenario Quality Check
To assess the quality of AI-generated scenarios, reclassification based on textual information proved to be a useful tool for identifying cases with potential ambiguity. Nonetheless, human evaluation remains indispensable for detecting issues such as textual integrity, appearance inconsistencies across panels, and context expression mismatch. Moreover, human review is essential for filtering out scenarios that may introduce bias, reinforce stereotypes, or pose risk of triggering anxiety or inappropriate responses.
Selecting the appropriate image creation tool is a critical step in scenario video generation. DALL-E 3 exhibited limitations in realistically representing the severity of social scenarios, particularly in disaster contexts. Human evaluators identified 34 of the 200 disaster images as exaggerated to a degree that could induce anxiety in children. For example, several images depicted fires with excessive scale and dramatic effects rather than realistic portrayals. The most striking example occurred when the system generated an image of a zombie apocalypse, despite the accompanying text describing only a neighborhood-wide power outage. In contrast, GPT-4o images more often presented more realistic settings and characters with natural facial expressions, reducing the likelihood of causing anxiety compared with DALL-E 3. Coupled with stronger alignment to the story script and superior aesthetic quality, GPT-4o is generally preferred over DALL-E 3 for social scenario generation.
Bias and Representativeness
The study also identified evidence of racial and gender bias in AI-generated content. Only 7% of characters generated by GPT-4o were people of color, markedly underrepresenting real-world demographics. Such underrepresentation may negatively impact self-esteem, diminish confidence, and reduce the sense of belonging. In educational contexts, this lack of representation can be particularly detrimental: when children rarely encounter characters who resemble themselves, their ability to connect with the material and engage fully with the scenarios may be compromised. This diminished relatability may undermine the overall learning experience and hinder inclusivity. This could be addressed by manually rebalancing the ratio when performing human filtering.
Gender patterns were also observed: girls more frequently appeared in performing and visual arts scenarios, while boys were more often shown in sports or video games. Although only a small portion of scenarios may be perceived as “stereotypical,” these trends could reinforce traditional gender roles in educational contexts.
Racial patterns were additionally evident in certain images. For instance, a DALL-E 3 depiction of a basketball game included exclusively Black players and a Black coach. While this may reflect reality in some contexts, repeated association of Black individuals with athleticism—particularly basketball—risk reinforcing narrow racial stereotypes. In educational settings, such representations could unintentionally teach children narrow or limiting views of race and ability.
These observations underscore the need to examine and manually rebalance demographic representation during human evaluation.
Repetitive Scenario Exposure
Repetitive scenarios, particularly for disasters, represent another concern. Fires breaking out in schools accounted for a large proportion of disaster scenarios. Frequent exposure to similar scenarios may lead children to overestimate the likelihood of dangerous events, causing undue apprehension and anxiety. To mitigate this risk, the frequency of glitch, bummer, and disaster scenarios should be calibrated to reflect realistic probabilities when delivering training content.
Additional Ethical Considerations
In addition to evaluating scenario fidelity and representativeness, it is critical to consider the ethical implications of AI-generated content. Issues such as privacy, consent, and content safety must be addressed to ensure that these scenarios are both responsible and appropriate for deployment.
Privacy and Informed Consent
Privacy is a recurring topic in the discussion of AI ethics, though perspectives vary across contexts. China’s White Paper on Artificial Intelligence Standardization (2018 Edition)45 argues that AI can rightly collect information without explicit consent. By contrast, the National Strategy for Artificial Intelligence Discussion Paper (NITI)46 stresses comprehensive public awareness and Data Privacy Impact Assessments to ensure consented data collection. They encourage AI developers to maintain self-regulation in using population data, even beyond consented limits, while claiming not to undermine privacy. These differing views frame the core concern of this research: ensuring scenario-generation datasets respect privacy and informed consent.
In practice, some datasets employed for scenario generation may include content from sources where informed consent was not obtained, raising significant ethical concerns. Accordingly, all scenarios should be screened prior to deployment and real-world integration to ensure compliance with privacy and consent standards.
Content Safety, Model Limitations, and Representativeness
The study revealed differences in content safety policies between text and image generation, and across different image-generation models (DALL-E 3 vs GPT-4o). Since the models are not open-source, the precise differences are not publicly available. GPT-4o appeared more robust generating images with few errors, potentially due to less stringent content safety policies compared with DALL-E 3. Regardless of model, all generated images and videos should be screened by humans to identify content safety concerns.
While AI offers powerful capabilities for scenario generation, the 300 scenarios derived from 20 random incident settings cannot represent the full spectrum of real-world situations encountered by children with special needs. These AI-generated scenarios will inevitably differ from the exact problems a child may face in daily life. This limitation can potentially be addressed through further customization of the scenarios and settings according to the age, interests, and special needs of a particular child to mimic the real environment.
Conclusion
This study examines the feasibility of employing Generative AI to produce social scenarios for teaching children problem size classification. The findings indicate that GenAI can be a powerful tool to generate a large amount of diverse, scenario-based training materials, offering a scalable approach to social skills education that is easily accessible to families. Scenarios can be produced in text, image, and video formats, supporting online dissemination and flexible instructional use. Although this approach is not a substitute for in-person therapy with a psychologist, the methodology is a great supplemental tool for families and practitioners. Traditional therapeutic approaches typically rely on a limited set of standardized examples for teaching. Conversely, GenAI-based scenario generation can produce a large number of tailored scenarios to address individual children’s specific needs, enabling more frequent and personalized training to enhance intervention effectiveness. Once generated, such scenario libraries can be disseminated online, providing parents and practitioners with accessible training resources.
To ensure the quality of AI-generated scenarios, reclassification based on textual information proved to be a useful tool for identifying cases with potential ambiguity. Images should also be screened for potential misalignment, harm and bias. Although AI-validation based on text can be an efficient tool to perform preliminary screening on ambiguous scenarios, human evaluation remains instrumental for detecting image issues such as textual integrity, appearance inconsistencies across panels, and context expression mismatch. More importantly, human review is essential for filtering out scenarios that may introduce bias, reinforce stereotypes, or pose risk of triggering anxiety or inappropriate responses.
Helping children identify the problem size is only the first step toward truly effective problem solving. Future research should explore how Gen-AI can be harnessed to cultivate deeper, transferable problem-solving abilities in children with social impairments, ultimately fostering more equitable, enduring, and transformative developmental outcomes.
Appendix
Model #1, DALL-E 3, contains the following parameters:
Model #2, GPT-4o Image, contains the following parameters. Note: Unlike DALL-E 3, GPT-4o returns images in base64 encoded format rather than a direct URL.

The example below illustrates the Gemini model used in this study.

References
- B. Hodis, S. Mughal, A. Saadabadi. Autism Spectrum Disorder. StatPearls Publishing. ncbi.nlm.nih.gov/books/NBK525976/ (2025). [↩]
- C. Gray, J . D. Garand. Social stories: Social Stories: Improving Responses of Students with Autism with Accurate Social Information. Focus on Autistic Behavior. 8(1), 1–10 (1993). [↩] [↩]
- Schopler, G. Mesibov, L. Kunce (Eds.). Asperger Syndrome or High-Functioning Autism? Springer US. 167–198 (1998). [↩]
- C. Gary. Social Stories™ 10.0: The new defining criteria and guidelines. Jenison Autism Journal. 15(4), 2–21 (2004). [↩]
- C. Gary. The new Social Story™ book: Revised and expanded 10th anniversary edition. Texas: Future Horizons Inc. (2010). [↩]
- C. Gary. The new Social StoryTM book revised and expanded 15th anniversary edition. Texas: Future Horizons Inc. (2015). [↩]
- C. Derguy, G. Michel, K. M’Bailara, S. Roux, M. Bouvard. Assessing needs in parents of children with autism spectrum disorder: A crucial preliminary step to target relevant issues for support programs. Journal of Intellectual and Developmental Disability. 40(2), 156–166 (2015). [↩]
- C. L. Wahman, J. E. Pustejovsky, M. M. Ostrosky, R. M. Santos. Examining the Effects of Social Stories™ on Challenging Behavior and Prosocial Skills in Young Children: A Systematic Review and Meta-Analysis. Topics in Early Childhood Special Education. (2019). [↩]
- J. L. Bucholz. Social Stories™ for Children With Autism: A Review of the Literature. Journal of Research in Education. 22(2), 48–73 (2012). [↩]
- M. A. E. Saad. The Effectiveness of Social Stories among Children and Adolescents with Autism Spectrum Disorders: Meta- Analysis. International Journal of Psycho-Educational Sciences. 5(2), 51–60 (2016). [↩]
- R. Aldabas. Effectiveness of Social Stories for Children With Autism: A Comprehensive Review. Technology and Disability. 31(1–2), 1–13 (2019). [↩]
- C. Rhodes. Do Social Stories help to decrease disruptive behaviour in children with autistic spectrum disorders? A review of the published literature. Journal of Intellectual Disabilities. 18(1), 35–50 (2014). [↩]
- A. Kokina, L. Kern. Social Story interventions for students with autism spectrum disorders: A meta-analysis. Journal of Autism & Developmental Disorders. 40(7), 812–826 (2010). [↩]
- M.G. Rodríguez, G. Pastor-Cerezuela, A. Tijeras-Iborra, M.I. Fernandez-Andres. Effectiveness of social stories in intervention in autistic spectrum disorder: A review. Papeles del Psicólogo. 40(3), 217–225 (2019). [↩]
- T. Hagiwara, B. S. Myles. A multimedia social story intervention: Teaching skills to children with autism. Focus on Autism and Other Developmental Disabilities. 14(2), 82–95 (1999). [↩]
- S. Ozdemir. Using multimedia social stories to increase appropriate social engagement in young children with autism. Turkish Online Journal of Education Technology. 7(3), 80–88 (2008). [↩]
- C. K. Nikopoulos, M. Keenan. Effects of video modeling on social initiations by children with autism. Journal of Applied Behavior Analysis. 37, 93–96, doi.org/10.1901/jaba.2004.37-93 (2004). [↩]
- R. D. O’Handley, K. C. Radley, H. M. Whipple. The relative effects of social stories and video modeling toward increasing eye contact of adolescents with Autism Spectrum Disorder. Research in Autism Spectrum Disorders. 11, 101–111, doi.org/10.1016/j.rasd.2014.12.009 (2015). [↩]
- S. D. Daneshvar, M. H. Charlop, D. B. Malmberg. A treatment comparison study of a photo activity schedule and Social Stories for teaching social skills to children with Autism Spectrum Disorder: Brief report. Developmental Neurorehabilitation. 1–6, doi.org/10.1080/17518423.2018.1461947 (2018). [↩]
- M. Imran, N. Almusharraf. Google Gemini as a next generation AI educational tool: a review of emerging educational technology. Smart Learning Environments. 11(22) (2024). [↩]
- D. Singh, N. Ahmad, K. Raza, C. Uddagiri, B. V. Isunuri. Generative AI: Current Trends and Applications. Studies in Computational Intelligence. 1177, 214–244, doi.org/10.1007/978-981-97-8460-8_11 (2024). [↩]
- L. Kuypers. The Zones of Regulation. A Curriculum Designed to Foster Self-Regulation and Emotional Control. Think Social Publishing (2011). [↩]
- K. D. Buron, M. Curtis. The Incredible 5-Point Scale: Assisting Students in Understanding Social Interactions and Managing their Emotion Responses (2024). [↩]
- E. David. OpenAI releases third version of DALL-E. theverge.com/2023/9/20/23881241/openai-dalle-third-version-generative-ai (2023). [↩]
- OpenAI. ChatGPT — Release Notes. help.openai.com/en/articles/6825453-chatgpt-release-notes (2024). [↩]
- T. Lee, M. Yasunaga, C. Meng, Y. Mai, J. S. Park, A. Gupta, Y. Zhang, D. Narayanan, H. B. Teufel, M. Bellagente, M. Kang, T. Park, J. Leskovec, J. Y. Zhu, F. F. Li, J. Wu, S. Ermon, P. Liang. Holistic Evaluation of Text-to-Image Models. 37th Conference on Neural Information Processing Systems doi.org/10.48550/arXiv.2311.04287 (2023). [↩]
- M. Otani, R. Togashi, Y. Sawai, R. Ishigami, Y. Nakashima, E. Rahtu, J. Heikkilä, S. Satoh. Toward Verifiable and Reproducible Human Evaluation for Text-to-Image Generation.
doi.org/10.48550/arXiv.2304.01816 (2023). [↩]
- Opace Digital Agency. ChatGPT Image Generation: GPT-4o vs Dall-E 3 & Other Models – Can it do Text in AI Images? Hands? Reflections? opace.agency/blog/chatgpt-image-generation-gpt-4o-vs-dall-e-3-and-others (2025). [↩]
- Lemonfox.ai. Easy-to-Use Text-To-Speech API. lemonfox.ai/text-to-speech-api (2025). [↩]
- M. Heusel, H. Ramsauer, T. Unterthiner, B. Nessler, S. Hochreiter. GANs Trained by a Two Time-Scale Update Rule Converge to a Local Nash Equilibrium. Advances in Neural Information Processing Systems. 30, doi.org/10.48550/arXiv.1706.08500 (2017). [↩]
- A. Mittal, A. K. Moorthy, A. C. Bovik. No-Reference Image Quality Assessment in the Spatial Domain. IEEE Transactions on Image Processing. 21(12), 4695–4708 doi.org/10.1109/TIP.2012.2214050 (2012). [↩]
- P. Gao, Z. Li, H. Zhang. Thermodynamics-Based Evaluation of Various Improved Shannon Entropies for Configurational Information of Gray-Level Images. Entropy. 20(1), Article 19, doi.org/10.3390/e20010019 (2018). [↩]
- Data Studios. The Most Used AI Chatbots in 2025: Global Usage, Trends, and Platform Comparisons of ChatGPT, Gemini, Copilot, and Claude datastudios.org/post/the-most-used-ai-chatbots-in-2025-global-usage-trends-and-platform-comparisons-of-chatgpt-gemini (2025). [↩]
- A. Pande, R. Patil, R. Mukkemwar, R. Panchal, and S. Bhoite. Comprehensive Study of Google Gemini and Text Generating Models: Understanding Capabilities and Performance. Grenze International Journal of Engineering and Technology, June Issue (2024). [↩]
- P. Mehta. Google Gemini AI: The Largest and Most Powerful AI Model. zealousys.com/blog/google-ai-model-gemini/ (2023). [↩]
- J. Cohen. A Coefficient of Agreement for Nominal Scales. Educational and Psychological Measurement. 20(1), 37–46 doi.org/10.1177/001316446002000104 (1960). [↩]
- J. Cohen. Statistical Power Analysis for the Behavioral Sciences (2nd ed.). Hillsdale, NJ: Lawrence Erlbaum Associate. scirp.org/reference/ReferencesPapers?ReferenceID=2041144 (1988). [↩]
- Opace Digital Agency. ChatGPT Image Generation: GPT-4o vs Dall-E 3 & Other Models – Can it do Text in AI Images? Hands? Reflections? opace.agency/blog/chatgpt-image-generation-gpt-4o-vs-dall-e-3-and-others (2025). [↩]
- Opace Digital Agency. ChatGPT Image Generation: GPT-4o vs Dall-E 3 & Other Models – Can it do Text in AI Images? Hands? Reflections? opace.agency/blog/chatgpt-image-generation-gpt-4o-vs-dall-e-3-and-others (2025). [↩]
- K. Krippendorff. Content Analysis: An Introduction to Its Methodology (4th ed.). Sage Publications (2018). [↩]
- T. K. Koo, M. Y. Li. A Guideline of Selecting and Reporting Intraclass Correlation Coefficients for Reliability Research. Journal of Chiropractic Medicine. 15(2), 155–163 doi.org/10.1016/j.jcm.2016.02.012 (2016). [↩]
- P. E. Shrout, J. L. Fleis. Intraclass correlations: Uses in assessing rater reliability. Psychological Bulletin. 86(2), 420–428, doi.org/10.1037/0033-2909.86.2.420 (1979). [↩]
- B. L. Welch. The generalization of Student’s problem when several different population variances are involved. Biometrika. 34(1–2), 28–35, doi.org/10.1093/biomet/34.1-2.28 (1947). [↩]
- F. Wilcoxon. Individual Comparisons by Ranking Methods. Biometrics Bulletin. 1(6), 80–83 doi.org/10.2307/3001968 (1945). [↩]
- China Electronics Standardization Institute, The 2nd Industrial Department of Standardization Administration of China. Artificial Intelligence Standardization White Paper (2018 Edition). CSET: Center for Security and Emerging Technology. https://cset.georgetown.edu/publication/artificial-intelligence-standardization-white-paper/ (2020). [↩]
- NITI Aayog. Discussion paper: National Strategy for Artificial Intelligence. 87–88, niti.gov.in/sites/default/files/2023-03/National-Strategy-for-Artificial-Intelligence.pdf (2018) [↩]


