
Abstract
Over the last twenty years, China’s economic and diplomatic ties with African countries have surged. These growing relations, exemplified by China being the foremost investor in and the largest trade partner to African countries, have led many scholars to question whether China’s presence in Africa threatens U.S. global hegemony. This threat is heightened when coupled with the value that Africa presents: the largest workforce by 2050 and rapidly developing economies. It is paramount to see who is truly leading in ideological influence in the neo-colonial scramble throughout the continent and to examine how they have done so. This study investigates whether China’s influence in Africa has eclipsed that of the United States and other foreign entities, and which mechanisms underlie this transition. Synthesizing data from the United Nations, the African Development Bank Group, and the World Bank, a bespoke binary scoring system covering China, U.S., France, U.K., Germany, and Japan over three decades plots trade dependence, private participation in infrastructure, and diplomatic engagement against UN voting alignment—a recognized proxy for influence—to identify the most impactful variables. Findings suggest China’s relentless trade and diplomatic push strongly correlates with heightened UN vote alignment, while the United States and other powers score lower across all categories. By translating foreign engagement into three quantifiable elements linked to a recognized geopolitical measure, this study offers a glimpse into Sino-American competition in Africa. Understanding these dynamics is essential for shaping policies. Further research could examine military variables and extend this methodology to South America.
Keywords: China; Africa; United States; Global Hegemony; Trade Dependence; Diplomatic Engagement; UN Voting Alignment; Infrastructure Investment; Sino-American Competition; Neo-colonialism; Thucydides’ Trap
Introduction
Background and Context
Africa has become a hotspot for global engagement, and one often-cited emblem of this shift is the Addis Ababa–Djibouti Railway1 . Constructed with extensive Chinese financing, it not only links key trade corridors in East Africa but also symbolizes a broader wave of infrastructure deals transforming the continent. On the flip side, the United States—long regarded as the leading global hegemon—now grapples with how far its traditional influence extends in an era of heightened Sino-African ties. Scholars clash on the broader implications of this relationship: some argue that Beijing’s “no-strings-attached” investments boost Africa’s development, while others warn about China’s potential stranglehold on critical resources and governance norms2.
An extensive body of scholarship has analyzed the trajectories of China, the U.S., and various African nations, with much of this work focusing on China’s rapid economic rise and the challenge it poses to the U.S. global hegemony, while fewer studies have examined the ascent of African economies in depth3. Although prior research explores infrastructure projects, trade dependency, and foreign direct investment (FDI) in isolation, it does not investigate how China and the U.S. collectively leverage these mechanisms to compete for influence. This gap leaves an incomplete understanding of how economic and diplomatic investments translate into geopolitical sway in Africa.
Furthermore, current literature emphasizes that both economic actions and soft power are central to establishing influence. For example, a study by the British Council found that a state’s soft power has a statistically significant impact on FDI, overseas student recruitment, tourism, and international influence4. This perspective is bolstered by historical developments such as China’s One Belt One Road (OBOR) initiative—strategically designed to amplify trade profits and position China at the center of a global trade network through agreements with up to 149 countries, including 52 in Africa5. Despite these insights, a comprehensive, integrated framework that explains how these multifaceted investments shape influence in Africa remains absent.
It is crucial to note that the following research does not intend to imply that Africa is solely at the whims of foreign powers, nor does it intend to classify Africa as a singular entity.
Problem Statement and Rationale
Against this backdrop emerges our central puzzle: whether China’s influence has definitively outpaced that of the United States (and other major powers) across Africa, and if so, through which diplomatic or economic levers this shift has occurred. Although recent debates often spotlight China’s ambitious infrastructure spending and the United States’ soft-power overtures, there remains a significant gap in comprehensively understanding which of these strategies resonates most effectively across Africa’s five principal regions. Earlier work tends to isolate single factors, such as foreign direct investment or soft power, whereas my approach integrates these elements into a unified framework6. This study investigates the relative effectiveness of diplomatic summits versus economic engagements in shaping political alignment, thereby addressing a critical gap in the literature and offering a more comprehensive understanding of how foreign engagement influences geopolitical outcomes on the continent.
Significance and Purpose
This framework clarifies which levers prove most influential and provides policymakers with a replicable model for tracking power rivalries in similarly dynamic regions. Ultimately, grasping these dimensions of Sino-American competition is central to understanding Africa’s evolving geopolitical landscape; and, more broadly, the shifting contours of global power in the twenty-first century.
Objectives
To probe these issues, this research employs a comparative framework built around three core indicators of geopolitical engagement: Diplomatic/Soft Power, Trade Dependency Ratio (TDR), and Private Participation in Infrastructure (PPI). Over a thirty-year period, this paper tracks how China, the U.S., France, Germany, Japan, and the U.K. fare in each category across North, South, Central, West, and East Africa, then compares those efforts to UN Voting Alignment (UVA)—a recognized gauge of how nations align in international forums6.
The guiding question is: do these foreign actors’ trade deals, infrastructure projects, or diplomatic summits measurably tilt voting patterns?
Scope and Limitations
This study covers six countries: China, the United States, France, Germany, Japan, and the United Kingdom. It examines their engagement across North, South, Central, West, and East Africa over a thirty-year period. If analysis were done on just the U.S. and China, key information about other countries’ dynamics would be omitted. Also, though the focus of this study is China vs U.S. in Africa, neglecting other major powers’ roles in the global battle for influence would provide a false and uncontextualized narrative. A temporal scope of the 1990s, 2000s, and 2010s was chosen to see how the narrative has changed over time and to understand what has led to the developments of the modern day. Potential limitations of this study include the size of the testing group and the omission of global powers such as Russia or India; though, they were intentionally left out due to the speculation that their involvement in Africa was negligible. Another possible constraint is the regional grouping of African countries. Though it is a reasonable delineation to make, it could potentially lead to skewed conclusions; for example, if seven out of ten countries in a region had low TDR ratios, but the other three had extremely high ones, it could make it seem that the TDR for all the regions in the area was moderate (average of the ten).
Theoretical Framework
This study employs a multitude of theoretical frameworks, namely: power transition theory (PTT), soft power theory (SPT), and dependency theory (DT). By employing these theories, deeper insight into the unique geopolitical, cultural, and economic facets of this rivalry can be explored, framing the interactions between African nations and foreign powers.
Power Transition Theory (PTT)
PTT posits that when a challenging nation’s power becomes comparable to a dominant power, the probability of conflict increases drastically, especially if the challenging nation is unhappy with the current status quo7. This is similar to the idea of Thucydides’ Trap, a deadly pattern that has repeated itself throughout history, causing war between a rising power and a ruling one to become inevitable8. In the context of this study, through trade dependence ratios and expenditures on infrastructure, PTT will be tested to see if African countries are aligning more with the ascending power, China, or the preexistent one, the U.S. With this theory in mind, I expect that as China’s economic strength has surged, more African countries have displayed alignment with Beijing in the UN, reflecting the paradigm of PTT.
Soft Power Theory (SPT)
During a meeting with President John F. Kennedy, senior statesman John J. McCloy exploded in anger at the very idea of “world opinion”: “World opinion? I don’t believe in world opinion. The only thing that matters is power.”Yet, as Arthur Schlesinger observed, “Like Woodrow Wilson and Franklin Roosevelt, Kennedy understood that the ability to attract others and move opinion was an element of power.”9. Soft power is the ability to obtain the outcomes one wants through attraction rather than coercion or payment. When wielded effectively, it transcends mere polite discourse and becomes a strategic instrument for nations to extend their spheres of influence. This theory is a linchpin in examining influence and power in Africa. It will be especially important when analyzing the diplomacy ratings between China and the U.S and seeing whether China’s “non-interference” strategy and more assertive foreign policy is more successful than the U.S.’ passive initiatives in garnering influence. If SPT is indeed a key factor for geopolitical influence, I expect that China is leading comfortably due to its less onerous strategies.
Dependency theory (DT)
“It is asymmetries in dependence that are most likely to provide sources of influence for actors in their dealings with one another. Less dependent actors can often use the interdependent relationship as a source of power in bargaining over an issue and perhaps to affect other issues10.” Unfortunately, Africa, a region that has endured malevolent foreign entanglement for the past six centuries, seems poised once again to fall into the hands of foreign powers with ignoble motives. With the West accusing China of deliberately imposing a debt overhang on African countries and Western powers themselves competing for influence on the continent, this theory becomes crucial to understanding the dynamics at play11. This study applies this lens to examine how trade dependency and infrastructure investments reveal the mechanisms through which these powers assert influence, ultimately shaping Africa’s geopolitical trajectory. If Dependency Theory holds true, it is expected that the regions more reliant on foreign funding, be it Chinese or Western, will be more likely to fall in line geopolitically.
These theories provide valuable insights into the geopolitical landscape of Africa and foreign powers: PTT characterizes the Sino-American relationship as a whole and is essential in understanding what the backing of African countries for major powers means on a global scale. SPT is key in understanding why intangible power is just as valuable as material power, and explains how things such as cultural influence and diplomatic engagement can sway African regions. DT is crucial to understanding how asymmetrical dependence leads to political leverage.
It is the intricate relationship that exists between these different theories that lends itself to the research–– Power Transition Theory explains why major powers, specifically the US and China, vie for power in the first place; furthermore, it elucidates why Africa has become a key battleground for dominance: securing a dominant position in a developing Africa could be the impetus for ensuring global hegemony. Dependency Theory is a direct result of PTT as it explains how major powers utilize certain levers like trade dependence and infrastructure development to solidify power. By leveraging these tools, major powers are able to compete with one another while simultaneously making alignment more likely. DT is both the stem for and by-product of Soft Power Theory. When a major power has significant influence over a country or region, soft power naturally follows. Dependency creates the conditions for soft power to either reinforce that influence by making it appear beneficial and voluntary, or undermine it if it is perceived as exploitative; to put it simply, not only does Dependency Theory cause soft power to naturally occur through subtle influence, but this soft power can also further increase dependency by making it seem beneficial and innocuous. Together, these mechanisms play out in measurable ways on the world stage. PTT drives powers to vie for Africa as a gateway to global dominance. Dependency deepens through trade and infrastructure, and soft power then casts those ties in a positive light—culminating in shifts in UN Voting Alignment.
Methodology Overview
This paper utilizes a bespoke binary scoring system investigating three main indicators: Trade Dependency Ratio (TDR), Private Participation in Infrastructure (PPI), and diplomatic engagement to get a nuanced understanding of how influence is achieved in Africa. Data are compiled over a thirty-year period, the 1990s, 2000s, and 2010s. This data spans six countries, China, the United States, France, Germany, Japan, and the United Kingdom across five African regions. Each of these indicators is rated using a binary system—success or failure—then combined into a composite score between 0 and 3. This final score is matched against UN Voting Alignment (UVA), a strong surrogate for a country’s geopolitical support, to see what variable impacts the most. The simplicity of a binary approach guarantees precisely defined impact of every variable. The following methodology section offers a more thorough explanation of the analytical techniques, threshold criteria, and data sources.
Results:
Before proceeding to the figures, it is important to revisit the fundamental inquiry of this investigation: which foreign actor, the U.S. or China, holds a larger share of Africa and through what means? The three main metrics —Trade Dependence Ratio (TDR), private involvement in infrastructure (PPI), and my custom diplomacy/soft power rating— will be plotted against UN voting alignment (UVA); monitoring the changes in each indicator over three decades and across the five African countries helps us to clearly identify which policies have really changed alignment.
I will first examine TDR trends to show how deeply African areas have become enmeshed in various foreign trade networks, then highlight who’s taken the lead in private infrastructure commitments through PPI, and lastly consider how differently approaching diplomacy (summits, pledges, binding agreements) seems to resonate. Once all of that is laid out, we determine whether one strategy—or one major power—has turned these variables into tangible influence.
TDR:
TDR Findings:
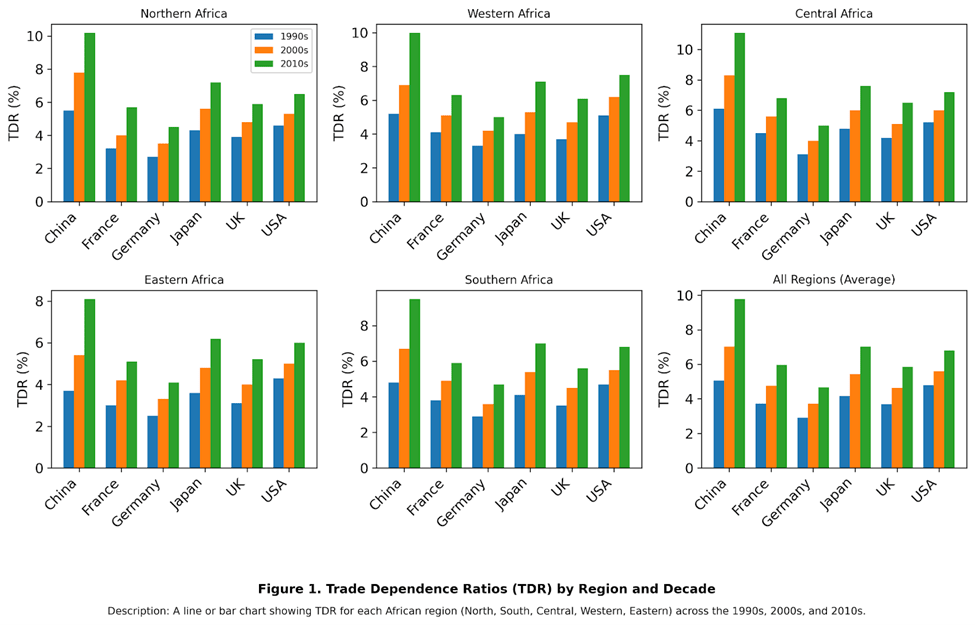
As a whole, trade dependence has gone up steadily for every power. This data marks an upward trend in reliance on foreign powers as Africa has developed. There is, however, one salient feature of every one of these graphs is the same: though every countries’ TDR has increased, China’s clearly has experienced the largest increase. As seen in Figure 1, for instance, China’s TDR in Northern Africa jumped from 5.5% in the 1990s to 10.2% by the 2010s, illustrating precisely where this upward trend is most pronounced. In fact, China’s percent change from all regions from the 90s to the 2010s was +93.3%, as compared to Japan’s +68.8%, Germany’s +60.7%, France’s +60.2%, the U.K.’s +59.2%, and the U.S.’ meager +42.3%. However, even given their moderately sized percentages of change, Germany and the U.K. failed to score a single success. On the other side of the spectrum, China only failed twice – both were in Eastern Africa, 2000 and 2010. France succeeded only once in 2000’s Central Africa. Japan scored 5 successes total, once in the 1990s in Central Africa, twice in the 2000s in Central and Northern, and once in the 2010s in Central. Finally, the U.S. has had seven successes, three in the 1990s in the Central, Western, and Southern regions; two in the 2000s in Central and Western Africa; and two in the 2010s in Central and Western Africa as well. These regional details confirm that while trade reliance has broadly increased, China’s growth in TDR stands out as especially prominent.
Diplomacy:

Diplomacy Findings:
Diplomacy gains heft each decade, and only nations topping a score of three count as successful. China dominates: silent in the 1990s, it leaps to 4.35 in the 2000s and a perfect 5.00 in the 2010s, propelled by seven summits and near-total delivery on vast pledges. Japan follows its well-funded TICAD rounds raising scores to 3.46 and 3.90 after a dialogue-heavy 1990s start of 1.00. France sits comfortably in the effective range throughout, three Africa summits per decade lifting it from 3.15 to 3.90. The United States posts zeros in the first two decades, then edges to 2.47 after the 2014 Leaders Summit. Germany lags; the 2017 Compact with Africa nudges its 2010s mark only to 0.99 while earlier decades remain at zero. Figure 2 traces these trajectories: China’s sharp ascent, the steady climbs of Japan and France, the U.S. late uptick, and Germany flat near the baseline. The United Kingdom stays off the chart, having hosted no comparable Africa summits.
PPI:

| Country | Transport | Energy | Water & Sanitation | Telecom/IT | Other | Total | Strategic Projects | Strategic Share (0/o) |
| France | 60 | 40 | 20 | 20 | 16 | 156 | 100 | 64.1 |
| UK | 20 | 10 | 5 | 5 | 7 | 47 | 30 | 63.8 |
| USA | 18 | 8 | 7 | 6 | 6 | 45 | 26 | 57.8 |
| China | 15 | 10 | 5 | 6 | 3 | 39 | 25 | 64.1 |
| Germany | 10 | 6 | 3 | 1 | 1 | 21 | 16 | 76.2 |
| Japan | 5 | 7 | 4 | 3 | 1 | 20 | 12 | 60.0 |
Counts of PPI projects by sector (1990-2019); Transport + Energy are classed as strategic, with their totals and shares shown in the last two columns.
PPI Findings:
PPI findings. France dominates Africa’s private-infrastructure league table with 156 projects between 1990 and 2019—more than double the U.K.’s 57, the next-highest total. The United States follows on 45 projects, then China 39, Germany 21, and Japan 20. France, the U.K. and the U.S. convert every decade into a “PPI win” under the 75-percentile rule; China wins in the 1990s and 2000s but slips below the line in the 2010s, Japan wins only in the 1990s, and Germany never crosses the bar.
A closer look at sector mix underscores why France’s footprint matters: Transport and Energy—treated here as strategic sectors—account for 64 % of France’s projects, 64 % of China’s, and fully 76 % of Germany’s (Table X). These are ports, rail corridors, roads, and power plants—the asset classes most likely to confer geopolitical leverage through long-term operating contracts and technical lock-in. Figure 3 visualises this dominance: France’s sponsorship bars in Western and Northern Africa tower over any other power across all three decades.
Note: project counts are un-weighted by dollar value; a $500 million deep-water port and a $5 million water upgrade each register as one.
UN Voting Alignment:

UVA Findings:
China has consistently led African UN voting alignment. Reflecting China’s success through aggressive trade, private infrastructure investments, and non-interference policies but perhaps also a possible shift in African alliances. Influence from Western powers like France, Germany, and the U.K. is stable and moderate; France is at about 70% in Northern Africa. Meanwhile, the U.S., having been below 50%, has shown very little gain, underlining the limits of a governance-heavy U.S. approach against the pragmatic approach of China. Based on the thresholds that were defined earlier, France, the U.K., and the U.S. have had no successes over the three decades; Germany has only had successes in Central and Eastern Africa; Japan was also only successful in Central and Eastern Africa for all three decades. As shown in Figure 4, China’s alignment rate often surpasses 70% across most African regions, underscoring the effectiveness of its long-term strategy.
Recalling our overarching question, which foreign power, specifically China or the U.S., exerts the most influence in Africa and through which levers, these UVA results indicate that despite various degrees of engagement by multiple nations, China’s strategy of deepening trade ties and robust diplomatic outreach correlates most strongly with sustained voting alignment at the UN while the U.S. has steadily fallen behind.
Overall findings:
To obtain a comprehensive view of the findings, we must analyze what contributed to success in countries that met or exceeded the threshold in UVA. Below are all the countries that succeeded in UVA; also included are the regions and decades in which they did so.

A table showing the scores of each section of all countries that had a successful UVA score.
Interestingly enough, Germany, a country that scored no success in any category was successful 3 times as compared to France, the U.S., and the U.K., which all were successful in categories like PPI. Nevertheless, when focusing on the countries that had a successful UVA, the breakdown is as follows; of the successful UVAs, 66.7% had a TDR of 1, 50% had a successful diplomacy, and 50% had a successful PPI.
I examined if our decade-level patterns persist when accounting for a country’s regime type and African Union status by doing an ordinary least squares regression on eighteen data (six powers × three decades). The dependent variable was the average UN-voting alignment for each power-decade, whereas the primary predictors comprised the proportion of trade dependency, diplomacy score, and total infrastructure projects; additionally, the Polity2 democracy index and an AU-membership dummy were incorporated. The regression analysis indicates that elevated diplomacy scores are significantly correlated with increased alignment (p < 0.05), while trade dependence exhibits a weaker yet indicative positive influence (p ≈ 0.07). Project counts do not demonstrate a significant effect; moreover, more democratic regimes tend to align marginally less, and AU membership is accounted for by the constant term. The findings bolster the assertion that summit diplomacy, and to a lesser degree trade dependence, propel UN-vote coherence, irrespective of a government’s democratic nature or formal AU affiliations. (appendix A-1)
Summary of Charts and Tables:
The following is a collection of descriptions for each figure:
Figure 1 (TDR) shows China’s Trade Dependence Ratio increased by 93 percent (5.5 → 10.2 percent) versus the U.S.’s 42 percent, demonstrating China’s more rapid economic integration and its link to higher UN alignment.
Figure 2 (Diplomacy) shows only China in 2000 and 2010—and Japan in 2010—surpassed the diplomacy threshold of 3.0, with China’s summit frequency and pledge levels clearly outpacing all other powers and underscoring the importance of sustained diplomatic engagement.
Figure 3 (PPI) illustrates France’s dominance in private infrastructure projects with 156 in the 2010s—more than twice the U.K.’s total—yet this did not translate into superior UN alignment, highlighting that infrastructure alone is insufficient.
Figure 4 (UVA) depicts China’s UN Voting Alignment climbing above 70 percent in most regions by the 2010s while the U.S. remains under 50 percent, underscoring the effectiveness of China’s combined economic and diplomatic strategy.
Figure 5 (Composite Scores) confirms that two-thirds of successful UVAs coincided with high trade dependence, making TDR the most common driver of alignment.
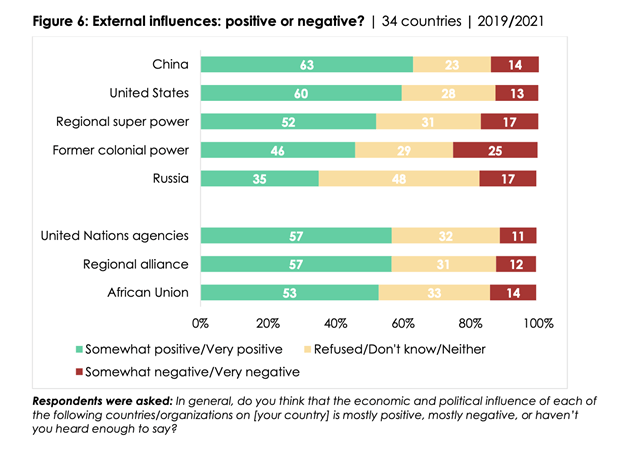
Figure 6 (Public Perception) shows African public approval ratings for major global and regional powers based on perceived positive influence.
Discussion and Conclusion:
a. Restatement of Key Findings
The research illuminates the importance of TDR and diplomacy and resoundingly answers the original question: which nation, the United States or China, has been more successful in exerting influence in Africa, and which variables contribute most to their dominance? By examining the direct correlation between TDR, PPI, and diplomacy and UVA, the analysis was able to directly answer which country is winning in Africa and by what means. The answer is perspicuous: China has rapidly gained dominance on the continent, completely overshadowing U.S. influence in Africa through its ability to make Africa economically dependent on it (TDR) while fostering a diplomatic relationship (diplomacy score). Furthermore, though not the main objective of the study, the research has revealed which African regions have the most foreign entanglement/influence: Central and Western Africa had the highest overall engagement, all categories considered. This work has answered what was unclear before, describing how China attained its influence in Africa.
b. Cultural and Ideological Dimensions
Although this study does not primarily focus on the cultural and ideological dimensions of foreign engagement in Africa, their implications are relevant to the broader discussion. In this section, I briefly explore how the previously outlined frameworks, along with the new findings on PPI, diplomacy, and TDR, have shaped Africa’s geopolitical landscape. Before delving into how Africans perceive foreign powers, however, it is crucial to unpack the stance of each major power discussed. Deeper currents of attraction exist under the figures. China’s allure lies in its pragmatic, non-interference story and visible investments, which provide a model of fast infrastructure-led growth that speaks to nations eager for development. Even where its economic impact is smaller, the United States uses its soft-power legacy—democratic values, pop-culture exports, and educational exchanges—to foster elite networks and popular respect. While Japan’s reputation for technical excellence and stable partnership through TICAD earns it respect, even if it lacks the mass-market appeal of English-language media or large-scale projects, Europe’s former colonial powers use language, cultural institutions, and long-standing security ties to maintain a familiar, if sometimes disputed, presence.
These different cultural and ideological approaches by major powers have manifested in many ways other than just the aforementioned diplomacy score––though an important facet of overall soft power, the score fails to account for the effect of each major power’s Africa-policy; it merely zeros in on the intensity of it. With that in mind, here is an overview of perception of each major power in Africa:
A table showing African public approval ratings for major global and regional powers based on perceived positive influence.
This public‐opinion data adds important context to our diplomacy scores, showing the real impact of soft power in Africa. When comparing the previously calculated diplomacy scores to public perception, China’s diplomatic push clearly pays off on the ground: its score jumps from zero in the 1990s to almost 4.0 in the 2000s and remains above 3.3 in the 2010s—and 63 percent of Africans rate China’s influence positively. The United States tells a different story: its summit count barely clears 2.4 in the 2010s—well below our “success” cutoff—yet it still earns a 60 percent approval rating. This incongruence between diplomacy score and public perception shows the U.S.’ enduring soft-power cachet, where fewer high-level meetings are offset by long-standing educational exchanges and an overall reverence as the global superpower. Former colonial powers (France and Britain) sit squarely in the middle: their diplomacy scores hover just under the 3.0 mark, and only 46 percent of respondents view their influence positively, suggesting that historical ties alone no longer guarantee popular support. Germany, also a former colonial power, suggests something similar: Germany’s steady diplomacy score of about 1.75—well below our success threshold—matches its muted approval (just under the former-colonial average), underscoring that reliable technical aid alone doesn’t translate into strong soft-power resonance. However, given what we know about successful UVA, public perception only adds to the anomaly. Despite Germany’s low diplomacy score (never exceeding 2.5) and below-average public approval, it still notched three UVA successes. This likely reflects its influence through multilateral channels (e.g., EU partnerships, UN programs) and security or technical collaborations beyond our TDR, PPI, and diplomacy metrics.
It is of utmost importance to recognize the impact that this perception has on transnational relations. Perceptions directly shape our TDR, PPI and diplomacy outcomes—positive cultural appeal can amplify trade ties and summit uptake, while negative views can blunt their effect on UN alignment.
c. Implications and Significance
In unpacking the findings, it is central to determine which variables played the most significant roles in shaping influence. This study has analyzed three key factors—Trade Dependence Ratio (TDR), diplomacy, and private participation in infrastructure (PPI)—to determine which mechanisms have most effectively influenced African nations’ geopolitical alignments.
Overall, the results show that there has been a steady increase in every facet of geopolitics, other than UVA. The study shows the importance of high engagement in each category but especially TDR and diplomacy. These results contribute to the field’s understanding of foreign influence in Africa in three main ways: quantifying influence, allowing a logical, numeric system; analyzing six major powers’ implementation and execution of this influence; and providing a clear causation and correlation between variables and influence.
This newfound knowledge allows scholars, diplomats, corporations, and governments to better strategize ways to garner influence by demonstrating what has worked in the past. While prior research examines infrastructure projects, trade dependency, and foreign direct investment (FDI) in isolation, it rarely investigates how China and the U.S. leverage these mechanisms collectively to compete for influence in Africa. Put differently, there was no integrated analysis of how economic and diplomatic investments translate into geopolitical sway in Africa. Without a comprehensive framework, determining which lever drives alignment in Africa is obscure and inaccurate. This research not only alleviates this problem but also serves as a valuable model for how foreign influence can be gauged in other areas of the world. It is now clear that the U.S. is severely behind not only China but many other countries. Also, how China gained this herculean lead is elucidated: making Africa economically reliant on them (TDR) and fostering good diplomatic relations with them (diplomacy score). Now, what is of utmost importance is how the U.S. will gain momentum in the tricky waters of African influence?
d. Recommendations
If further research were to be conducted on this topic, variables such as FDI and military engagement should be included to cover even more factors of geopolitics. Additionally, applying this same type of scoring system to other regions of the world such as South America would allow for even greater geopolitically understanding
e. Limitations and Anomalies
Though all methods were meticulously thought out and thoroughly tested, the study was not without limitations. For instance, using PPI was not the first choice for international infrastructure. Originally foreign direct investment (FDI)/government-funded infrastructure projects were considered; however, after vigorous research, no dataset or information on the topic covered all 30 years of data that was required, and many treated FDI to Africa as a whole region rather than country to country. Additionally, though effective, the binary-scoring system may not be the best way to quantify scores. The binary scheme simplifies the data interpretation. Having a larger scale with a broader scoring system would highlight nuances that a binary scoring system would not be able to achieve. Third, having only one outcome variable may not give as accurate answers as possible. Though UN voting alignment gives an accurate picture of political influence, it is certainly not perfect. UN alignment is a good proxy for how countries want to position themselves in accordance with more powerful nations; however, including another proxy, perhaps the Soft Power Index or public opinion, might have given the results a multifaceted quality that the study currently lacks.
Germany’s three UVA wins, despite scoring below 2.5 on trade, PPI, and summit diplomacy, likely trace to channels our model does not count—most notably Berlin’s heavy contributions to the EU’s Trust Fund for Africa and its frequent leadership of UN peace-support rotations. These multilateral levers sit outside the summit-based index yet still sway alignment. The United Kingdom’s absence follows the same logic: it hosted no Africa-specific summits during the window, so its bilateral programmes and Commonwealth outreach never enter the scorecard. Such gaps remind us that informal or coalition diplomacy can shape UN votes even when the headline metrics read zero.
As aforementioned, the PPI projects counts are unaffected by the size of each project. This means that a five million dollar and a five hundred million dollar project both count as one. Also, because pledges often disburse three-to-five years after signature, decade boundaries may under- or over-state implementation in edge years.
f. Closing Thought
It is clear that the U.S. is being outpaced in every aspect – China has had unbridled growth in every facet of Africa’s fabric while the U.S. has struggled to match its progress over the last 30 years. Ultimately, as Africa’s global presence and power increases, the need for the U.S. to remedy its current deficiency in Africa is crucial if it wants to contain Beijing’s power. Only time will tell whether it will.
g. Methodology
The process of synthesizing the information into the proper form was arduous. For the Trade Dependence Ratio (TDR), data was gathered from the UN Comtrade Database and categorized by African region and decade13
After compiling the data, percentage-based calculations were made for each region in order to determine economic reliance (further explanation of the calculation is mentioned below)
For private participation in infrastructure (PPI), data came from the World Bank’s Private Participation dataset14. After setting the modules to Africa in the eighties, 1990s, and 2000s, I manually sorted the sponsors of projects by which country they are associated with. Once I did so, aggregate scores for how many times each country’s companies were represented in each decade were compiled.
For Diplomacy, primary diplomatic records from TICAD, FOCAC, the White House, and G20 communiques were cited15 these were supplemented by data from the AU, UNDP, and UNECA16. These data sets were then synthesized to assess for categories (explained in further detail below). Then, after calculating scores on a one to five scale (poor to excellent) for each category, each variable was plugged in the custom formula that I created, then multiplied by frequency. This formula is unique as it allows for a multifaceted analysis on diplomacy which is oftentimes qualitative. Furthermore, by including a frequency multiplier, all other aspects are kept in check. For example, if a country were to score fours in each category (excellent score), but only hold conferences/committees once every decade, they would be punished for their infrequency. On the other hand, if a country were to score poorly in most categories, averaging around a two, but held three to four committees per decade, they would be rewarded for the persistence of their diplomatic efforts. Overall, the bespoke formula is a comprehensive overview allowing for rarely-seen quantitative analysis of diplomacy (explained further down below).
Finally, for the outcome variable United Nations Voting alignment (UVA), data from Erik Voeten’s “UN General Assembly Dataset” was utilized 17.
The methodology adapts prior studies that use UVA as a proxy for influence such as Dreher et al. (2022) and Kim & Russett (2022) )18. Its specific factors are explained in more depth later on.
Determining a quantitative method to analyze influence in different African regions is challenging. The study focuses on whether the United States or China has been more successful in exerting influence in Africa and which strategies have contributed most to their dominance. Geographic and temporal scopes are defined as North, South, Central, Western, and Eastern Africa, and three decades, respectively; Africa is analyzed under its five regions as to both not undermine the cultural and geographic differences of each region, but to also obtain a more nuanced regional understanding of how each region differs. To determine overall foreign actor success, three binary-weighted variables correlated to influence were chosen: diplomacy/soft power, PPI/infrastructure, and trade dependence ratio (TDR).
After analyzing these categories for France, Germany, the U.K., Japan, China, and the U.S. over different time periods, the results will be superimposed with UN voting alignment data. Statistical methods and trend analysis will reveal which variables have been most effective in promoting influence on the continent, providing a nuanced understanding of the current geopolitical landscape.
Before getting into the mechanisms of each variable, it is first beneficial to quickly analyze the reasoning behind each threshold. For TDR, the 75th percentile barrier was set as the mark between success and failure because of its clear delineation; by using it as a cut-off, moderate (50th) and exceptional (90th +) data are separated. This allows for a good idea of what is upper-echelon. This same reasoning is applied to UVA. For diplomacy, the reasoning was also quite simple: on a 1-5 (poor to exceptional) scale, the threshold of 3 represents the difference between terrible and brilliant scores.
Finally, for PPI, the thresholds that were chosen represented what meaningful engagement meant in each decade respectively – PPI drastically increased in each decade, the expectation for what qualified as a success increased as well. Throughout the study the success line is set at the 75ᵗʰ percentile of the decade’s distribution; this upper-quartile cut-off cleanly distinguishes exceptional performers, and sensitivity checks (± 3 pp, ± 5 pp) confirm that modest shifts scarcely change the winners list (Appendix C-1).
Categories of Analysis:
Trade Dependence Ratio (TDR): Tied directly to dependence theory itself, the trade
dependence ratio is an important indicator of how reliant a certain country or region is on a foreign power; trade dependence is directly related to how vulnerable a state is. States that have high reliance on other actors are in the hands of the other actors’ wills. Here is how it is calculated:
TDR = (z /x) * 100
z: the total trade of x region with the target country i.e China with West Africa
x: the total GDP of the region
Threshold: If a country has a TDR with an African region that is over the 75th percentile of that decade, then it is considered a success (1).
| Decade | Threshold (75th percentile) |
| 1990 | 4.7% |
| 2000 | 5.6% |
| 2010 | 7.2% |
Displays the percentile cutoffs (e.g., 4.7%, 5.6%, 7.2%) used to determine success or failure for the Trade Dependence Ratio (TDR) across the 1990s, 2000s, and 2010s.
Diplomacy: based on the same principles as what was covered in the theory section of soft power, diplomacy is crucial to influence and power in a region, as it allows a country to tacitly expand its sphere of influence. Drawing from a myriad of datasets, I created a bespoke formula that gives a numeric value to diplomacy. The threshold that will quantifies a country as having a successful diplomacy score, is based on this formula:
Final Score = ( 0.20 A + 0.15 B + 0.15 C + 0.50 D ) × ( 1 + 0.2 × (Summits – 1) )
This is the scale for each variable and its respective meaning:
(A) Participation 1: < 50 % attendance, 2: 50–69 %, 3: 70–89 %, 4: 90–99 %, 5: 100 %
Based on what percentage of African countries were present at the summit.
(B) Commitments 1: < $1 B, 2: $1–5 B, 3: $5–10 B, 4: $10–20 B, 5: > $20 B
Captures the size of financial pledges, emphasising tangible investments.
(C) Agreements 1: Minimal communiqué → 5: Multiple binding treaties
Scores the substance of summit outcomes.
(D) Implementation 1: Little follow-through → 5: Fully realised
Assesses how well pledges were actually delivered. Implementation ratings draw on FOCAC follow-up audits (Brautigam 2020) and TICAD progress reports (MOFA 2019), which quantify how much of each pledge was actually delivered.20
Frequency Multiplier = 1 + 0.2 × (Summits – 1)
Adds 20 % for each additional summit in the decade, rewarding consistent engagement.
Threshold: Success if Final Score ≥ 3.0
Components (A, B, C, D):
- A (Participation) – fewer than half the African states (1) to full attendance (5).
- B (Commitments) – under $1 B (1) up to over $20 B (5).
- C (Agreements) – simple communiqué (1) to multiple binding treaties (5).
- D (Implementation) – little real action (1) to fully realized (5).
Frequency Multiplier:
Each decade’s total summits is factored in by multiplying the base average (A + B + C + D)/4 by (1 + 0.2 × (Number of Summits – 1)). This bump incentivizes holding more than one summit in a decade (i.e., two summits increase the baseline by 20%, three summits by 40%, etc.), on the logic that regular engagement suggests stronger diplomatic intent.
†Varying the implementation weight from 0.40 — 0.60 and the summit multiplier from 0.15 — 0.25 does not alter country rank order (Appendix B-1).
Interpretation:
A Final Score above 3.0 indicates a robust diplomatic footprint in a given decade (successful “diplomacy”), while a score below 3.0 suggests less impactful engagement. By standardizing these ratings, comparisons can be made across different powers, regions, and time periods.
Though simple, the formula provides a multifaceted analysis of a country’s participation and willingness to engage with African countries. Using this data, an accurate representation of a country’s diplomacy can be quantified to a simple number.
PPI/Infrastructure: The influence of private participation infrastructure (PPI) is rooted in dependency theory. With job creation and economic development being directly correlated to PPI, and specifically infrastructure, African countries are going to continue being reliant on foreign investments to facilitate their growth. This is exacerbated by Africa’s rapid growth; new markets and sectors will open, allowing foreign countries to have even more opportunities to invest and fund in African ventures. Furthermore, the OECD states that FDI increases the efficacy and productivity of an economy, “Like trade, foreign direct investment acts as a powerful spur to competition and innovation, encouraging domestic firms to reduce costs and enhance their competitiveness21.” To achieve an accurate snapshot of each country’s level of PPI to separate African regions, the World Bank’s Private Participation Infrastructure (PPI) dataset is being used. This will prove whether the OECD statements about FDI apply to Africa as well, and whether or not FDI is an important factor to influence in the continent. The method behind calculating PPI will be straightforward. Each time a company shows up as a sponsor on the dataset, their country of origin will gain a point. After calculating all of that, the points will be distributed in terms of region of Africa and decade. While PPI and FDI are not identical, they are closely related, as
Infrastructure investment is a key component of FDI. In this study, PPI serves as a proxy for broader foreign investment trends, though the terms are not entirely interchangeable. Due to limited data on FDI and government-funded projects, PPI was selected as the most viable alternative, despite its limitations as a perfect substitute.
Threshold:
| Decade | Threshold |
| 1990 | 3 |
| 2000 | 10 |
| 2010 | 20 |
Lists the required number of infrastructure projects (e.g., 3, 10, 20) for a country to be deemed successful in Private Participation in Infrastructure (PPI) each decade
UN Voting Alignment (UVA): Acting as the outcome variable in this research, measuring the effectiveness of external stimuli, UVA is fundamental to determining which variables hold the most amount of impact. UVA acts as a proxy for overall geopolitical alignment, being an “exceptionally good set of evidence for observing issues and alignments of states in international politics19.” By setting it as the outcome variable, the ramifications of the other variables over time will become apparent. The data used to determine the percentage of alignment throughout the past 3 decades was the voting records from the United Nations General Assembly, spanning from 1946 to the end of the 78th session in 2024. This dataset provides a robust longitudinal perspective on geopolitical alignments and serves as a critical source for analyzing shifts in international relations and state behavior20.
The method quantifies voting alignment by calculating the percentage of countries in a region that vote identically to a target country on UN resolutions. Using the formula that follows, percentages are averaged across all resolutions within each decade, producing a precise measure of regional voting alignment with the target country over time:
A = (1 / R) * Σ (ni / N) * 100
A: The average UN Voting Alignment percentage.
R: Total number of resolutions considered.
ni: Number of countries that voted in alignment with the target country on resolution iii.
N: Total number of countries voting on resolution iii.
Threshold for success: If a country surpasses the 75th percentile for the decade, then they are considered successful.
| Decade | Threshold (75th percentile) |
| 1990s | 76.1% |
| 2000s | 79.6% |
| 2010s | 75.8% |
Description: Outlines the 75th percentile alignment values (e.g., 76.1%, 79.6%, 75.8%) needed per decade to constitute a “success.”
(75th-percentile line; ± 3 pp and ± 5 pp shifts leave rankings unchanged — see Appendix C-1).
Due to the fact that this study did not examine human specimens, not many ethical concerns arose. The only qualms that needed to be addressed was the qualification of Africa as a diverse continent, not a singular place with complete uniformity. Acknowledgements: The author would like to thank Christina Walker, a Ph.D. Student at Purdue University studying Comparative Politics and Advanced Methodology, and Dilyara Agisheva, a historian of law and empire with expertise in Middle Eastern and Russian history, for their mentorship and guidance in the research process.
Data availability
Regional-level datasets for TDR, PPI, pledge-implementation, Polity2, and AU membership are available from the author upon reasonable request (email: ryanhjtd@gmail.com).
Appendix A-1:

OLS coefficients show that Diplomacy has a strong, statistically significant positive effect on UN-voting alignment (p = 0.02), while Trade Dependence is marginally significant (p = 0.07). PPI and AU membership are not significant, and Polity displays a significant negative association (p < 0.01), reinforcing that summit diplomacy—and to a lesser extent trade reliance—drive alignment.
Appendix B-2
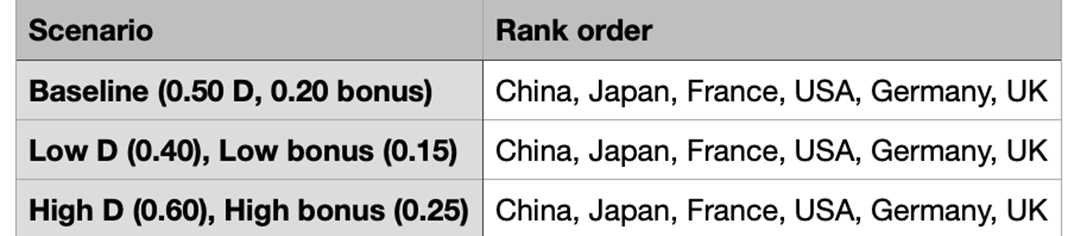
Shifting the diplomacy formula (implementation weight 0.40 – 0.60; summit bonus 0.15 – 0.25) never alters the rank order: China > Japan > France > USA > Germany > UK.

Total region-decade wins under strict, − 3 pp and − 5 pp UVA thresholds: China keeps a perfect 15 / 15; Japan and Germany gain a few wins as the bar drops; only at − 5 pp does France appear, leaving the overall hierarchy intact. Reducing the bar by 3 percentage points, or an even greater 5 percentage points, approximately a complete standard deviation of the alignment data, results in only a few additional victories (Japan, Germany, France), while maintaining China’s flawless 15 out of 15; thus, the 75th percentile cut-off serves as a robust and statistically significant success threshold.
References
- BBC News. “Ethiopia and Djibouti launch first fully electric cross-border railway in Africa.” https://www.bbc.com/news/world-africa-37562177 (2016). [↩]
- H. Campbell. “China in Africa: challenging us global hegemony.”Third World Quarterly 29(1): 89–105 (2007). https://doi.org/10.1080/01436590701726517. [↩]
- F. Obeng-Odoom. “Africa: on the rise, but to where?” Forum for Social Economics 44(3): 234–250 (2014). https://doi.org/10.1080/07360932.2014.955040. [↩]
- A. MacDonald. “Soft power today: measuring the effects.” British Council. https://www.britishcouncil.org/research-insight/soft-power-today-measuring-effects (2017). [↩]
- M. Napang, S. Nurhasanah, and S. Rohman. “One belt one road (obor) and the increase of China’s global influence.” PEOPLE: International Journal of Social Sciences 5(2): 53–69 (2019). https://doi.org/10.20319/pijss.2019.52.5369. [↩]
- S. Y. Kim and B. Russett. “The new politics of voting alignments in the UN general assembly.” International Organization 50(4): 629–652 (1996). [↩]
- R. L. Tammen, et al. “Power transition theory.” Oxford Bibliographies. https://www.oxfordbibliographies.com/display/document/obo-9780199743292/obo-9780199743292-0038.xml (2017). [↩]
- G. Allison. Destined for war: can America and China escape Thucydides’s trap?
(Boston: Houghton Mifflin Harcourt, 2017). [↩] - J. S. Nye. “Public diplomacy and soft power.” The Annals of the American Acade my of Political and Social Science 616: 94–109 (2008). http://www.jstor.org/stable/25097996. [↩]
- R. O. Keohane, Jr. and J. S. Nye, Jr. Power and Interdependence, 4th ed. (New York: Longman, 2012). Accessed April 10, 2023. https://pages.ucsd.edu/~bslantchev/courses/ps240/05%20Cooperation%20with%20States%20as%20Unitary%20Actors/Keohane%20&%20Nye%20-%20Power%20and%20interdependence%20[Ch%201-3].pdf. [↩]
- D. Brautigam. The Dragon’s Gift: The Real Story of China in Africa (Oxford: Oxford University Press, 2009); D. C. Murphy. China’s Rise in the Global South: The Middle East, Africa, and Beijing’s Alternative World Order (Stanford: Stanford University Press, 2022). [↩]
- Afrobarometer. Africans Welcome China’s Influence but Maintain Democratic Aspirations. Afrobarometer Dispatch No. 489, November 15, 2021. https://www.afrobarometer.org/wp-content/uploads/2022/02/ad489-pap3-africans_welcome_chinas_influence_maintain_democratic_aspirations-afrobarometer_dispatch-15nov21.pdf [↩]
- United Nations. “UN Comtrade Database.” https://comtrade.un.org (2025). [↩]
- World Bank. “Private participation in infrastructure (ppi) dataset.” https://databank.worldbank.org/source/private-participation-in-infrastructure (2025) [↩]
- TICAD Diplomatic Records; FOCAC Communiqués; White House Press Briefings; G20 Communiqués. (Accessed March 5, 2025). http://www.mofa.go.jp/region/africa/ticad/; http://www.focac.org; https://www.whitehouse.gov/briefing-room/; https://www.g20.org. [↩]
- African Union Official Records; UNDP Reports and Publications; UNECA Publications. (Accessed March 5, 2025). [↩]
- E. Voeten. Data and Analyses of Voting in the United Nations General Assembly (Washington, DC: Brookings Institution Press, 2021) [↩]
- A. Dreher, V. Lang, B. P. Rosendorff, and J. R. Vreeland. “Bilateral or multilateral? international financial flows and the dirty-work hypothesis.”Journal of Politics 84(4): 1932–46 (2022); S. Y. Kim and B. Russett. “The new politics of voting alignments in the UN general assembly.” [↩]
- S. Y. Kim and B. Russett. “The new politics of voting alignments in the un general assembly” (1996). [↩]
- E. Voeten. Data and Analyses of Voting in the United Nations General Assembly (Washington, DC: Brookings Institution Press, 2021). [↩]


