
Abstract
Ground-based follow-up observations were conducted on an exoplanet candidate, TOI-3726.01, originally identified by the Transiting Exoplanet Survey Satellite (TESS). In addition to confirming its transit events, a significant and increasing drift between the actual transit time and the predicted transit time by Swarthmore Transit Finder was also discovered. Analysis revealed that the transit timing discrepancy was caused by the limited precision of the previously reported TESS period due to its short, 27-day observation window. By combining both the TESS data and the ground observation data, the study proposed a refined transit period, which is an order of magnitude more precise. The study also highlighted the limitations of relying on a single TESS sector for predicting transit events and recommended using multi-sector data whenever possible.
Keywords: Exoplanet, Transit, Light Curve, TESS
Introduction
Objectives and Motivation
TOI-3726.01 is an exoplanet candidate identified by the Transiting Exoplanet Survey Satellite (TESS). In the process of exoplanet confirmation, according to NASA Exoplanet Archive, one of the adoption criteria is “sufficient follow-up observations and validation have been undertaken to deem the possibility of the object being a false positive as unlikely”1.
The initial objective of this study was to verify the transit events of TOI-3726.01 through ground-based observations and contribute to the body of exoplanet-supporting evidence. However, the research pivoted upon uncovering inconsistencies between the predicted and observed transit times. These discrepancies pointed to inaccuracies in the orbital period reported by space-based observations. As a result, it led to the revised objectives: identify the source of the discrepancies, investigate the possibility of Transit Timing Variations (TTVs), and refine the transit ephemerides.
TESS and the Period Inaccuracy Challenge
TESS, a NASA mission launched in 2018, detects exoplanets using the transit method, which involves observing periodic dips in a star’s brightness as a planet passes in front of it2. TESS divides the sky into sectors of about 24° × 96°, scanning each for approximately 27.4 days before moving to the next. Thousands of exoplanet candidates, labeled as TESS Objects of Interest (TOIs), have been identified3. Hundreds of them have since been confirmed as real exoplanetary systems.
Due to the limited observational window per sector, the orbital periods derived from TESS data can carry small inaccuracies. While these inaccuracies may be minor over a short baseline, they accumulate over time, leading to increasingly incorrect predictions for future transit events.
Ground-Based Follow-Up
Ground-based follow-up observations play an important role in exoplanet research. By allowing transit observations years after the initial detection with often larger apertures and higher image resolution, ground-based observations are invaluable for ruling out false positives and refining orbital ephemerides4,5,6.
Ground-based observations do come with challenges. They are affected by weather and atmospheric seeing conditions. Consecutive transits for long-period exoplanets are difficult to capture. The observable targets are limited by the observatory locations.
This study provides an example of the synergy between the space- and ground-based observations. By combining the data from both sources, a more accurate ephemeris of TOI-3726.01 is achieved.
Methods
Selecting the Observation Target
The observation target was selected based on three key criteria. First, the host star of the exoplanet candidate had to be observable from Mt. Lemmon Observatory for at least six months, beginning from September 2024. Second, it is preferred that the host star’s apparent magnitude (V-mag) be less than 13.5 to ensure sufficient signal quality considering the capability of the observation equipment. Lastly, candidates with little to no previously reported data were preferred. Most TESS Objects of Interest (TOIs) are followed up soon after each data release, so the selection pool was limited.
TOI-3726 (TIC 122695048) was selected as the target star at the end of August 2024. The star is located approximately 1,600 light years (491.62 parsecs) away from Earth, with a radius of 1.05 R☉ and a mass of 1.08 M☉7. The transit of the candidate exoplanet TOI-3726.01 was first detected in TESS Sector 59 (2022/11/29, Epoch 2459912.8314 BJD) and re-observed in Sector 73 (2023/12/11, Epoch 2460290.4324 BJD).
At the time of the target selection, ExoMast listed one ground-based observation attempt of TOI-3726.01 without any observation data. However, when ExoMast was visited again in Jan 2025, it was found that transit data had been retroactively uploaded, dating back to December 20238. At this point, this study had made three independent transit observations.
Compared with the retroactively uploaded ExoFOP data, the observations in this study have several advantages: a larger 24-inch telescope was used (instead of 12-inch); multiple transit events were observed; and the data were collected more distant away from the TESS Sector 73 (~12 months apart vs ~1 month apart). The lengthened observation baseline helps to achieve a more precise transit period, which will be discussed in the Results section.
Equipment and Data Collection
Transit observations were carried out using the remotely operated Phillips 24-inch RCOS telescope at Mt. Lemmon Observatory. A CMOS camera (QHY600PH-M SBFL) with an R-band filter imaged a field-of-view of 32×21 arcmin with a focal plane scale of 0.79 arcsec/pixel. On each occasion, auto-guided images were obtained in a continuous sequence. A fixed exposure time of 40-60 sec was determined by the atmospheric seeing at the start of observations. Image sequences were obtained on four local dates: 2024/09/26, 2024/10/25, 2024/12/27, and 2025/02/05. The MaxIm DL software package (v. 6.40) controlled the imaging camera and the PHD2 software (v. 2.6.13) controlled the autoguider.
Swarthmore Transit Finder (STF) was utilized to determine the transit event windows of TOI-3726.019.
Software and Data Fitting
AstroImageJ (AIJ) version 5.5.1 was utilized for the FITS data processing.
Preprocessing
The FITS images were preprocessed with the AIJ CCD Data Processor. Using the captured calibration data, the FITS files were treated with dark subtraction and flat division. The images were platesolved using astrometry.net10. The multi-aperture radius and the inner/outer background annulus radius were determined based on the AIJ seeing profile analysis.
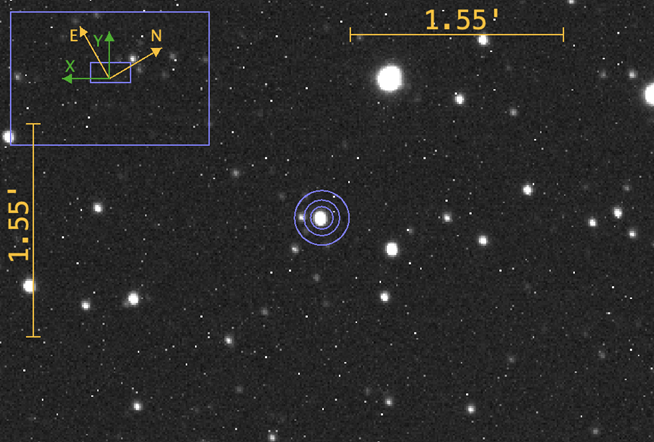
The blue concentric circles represent the photometric aperture (the inner circle) and the background annulus (between the middle and the outer circle) where the horizon/vertical scale shows 1.55 arcminutes.
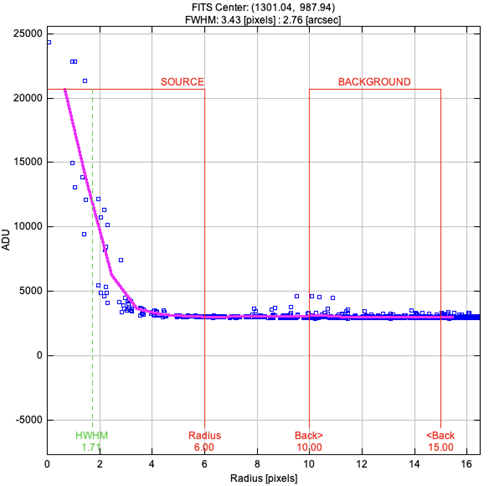
The profile shows the brightness change with respect to the distance from the center of the star. The brightness reduces to the baseline level when the radius reaches six pixels (4.7 arcsec). The small hump at around 10 pixels (7.9 arcsec) was from the nearby entity to the left of TOI-3726 as shown in Figure 1. The brightness of this entity remained constant and was treated as a stable background.
Light Curve Fitting and Optimization
The light curves were fitted with the built-in transit fitting algorithm in AIJ11,12.
The initial host star radius was set to 1.05 R☉13.
The limb darkening linear (u1) and quadratic (u2) coefficients were fixed to 0.4784704 and 0.2584829 by following the AIJ recommendation – “for ground-based observations, it may be necessary to lock one or both coefficients to theoretical values”.
The determination of the u1 and u2 followed the steps below:
- The input parameters are: Teff (5925 K), [Fe/H] (-0.377), log(g) (4.4313 cgs)7.
- Determine the UBV spectral type of TOI-3726 using the Wien’s Displacement Law. The resulting wavelength of 489 nm is between the effective wavelength midpoints of the B (445 nm) and V (551 nm) bands.
𝜆 = 2.9e6 / Teff = 2.9e6 / 5925 = 489 nm
Using the “EXOFAST – Quadratic Limb Darkening” tool14, the u1 and u2 coefficients of the B and V band were determined (Table 1):
| u1 | u2 | |
| B-Band | 0.56372454 | 0.22126283 |
| V-Band | 0.39321627 | 0.29570297 |
| Average | 0.4784704 | 0.2584829 |
- As TOI-3726 falls in between the B and V band categories, the average of the two sets of coefficients was used as a first approximation in the model fitting.
The fitting optimization was conducted using the AIJ built-in “Fit Optimization” mechanism. It involves iterative applications of the “Outlier Removal”, “Comparison Stars Selection”, and “Detrend Parameter Selection”. The goal is to get “χ2/dof” close to 1 as suggested by Collins et al. (2017) – “the best fit model is found by minimizing χ2 of the model residuals”12.
In the “Outlier Removal” step, the “Model vs RMS” mode was used with $N \geq 6.7$ for all fittings. In the “Detrend Parameter Selection” step, the “Max Pars” was set to 1 and the “BIC Thres” was set to 2”.
Data Convention
BJD Offset: All reported timings are offset by 2457000 to be consistent with the TESS convention15.
The n-th Period: As discussed in subsequent sections, TOI-3726.01 has an orbital period of approximately 4.84 days. The transit observed by TESS Sector 59 (Epoch = 2912.8314) is designated as transit number zero. Following this convention, the initial transit in TESS Sector 73 and each ground-based observation are assigned an n-th transit number based on the number of orbital cycles elapsed since the zeroth transit.
Target Metric
Transit timing is typically characterized by five key parameters: T_1, T_2, T_3, T_4, and T_C. T_1 and T_4 correspond to the ingress and egress times of the transit event. T_2 and T_3 denote the start and end of the phase during which the exoplanet is fully superimposed on the stellar disk. T_C represents the center of the transit event.
In this study, T_C was adopted as the primary metric when comparing transit event timings.
Results
The Late and Incomplete First Transit Observation
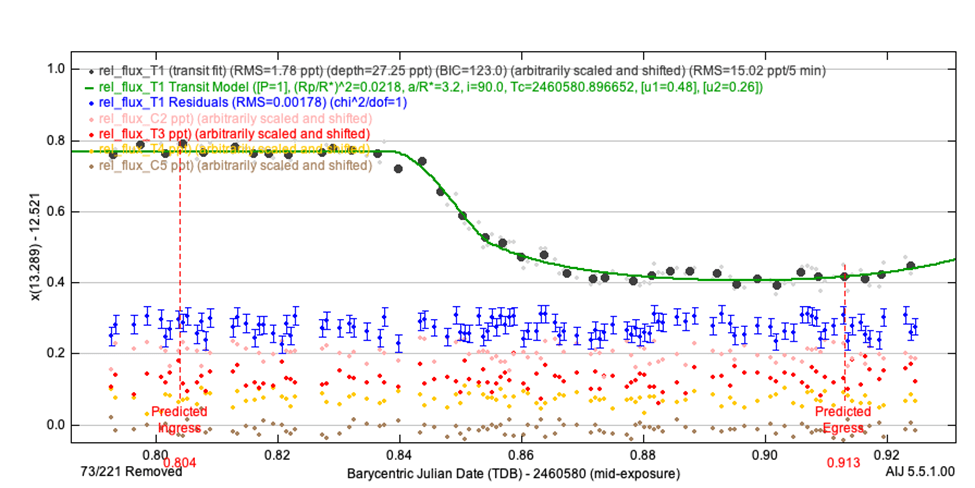
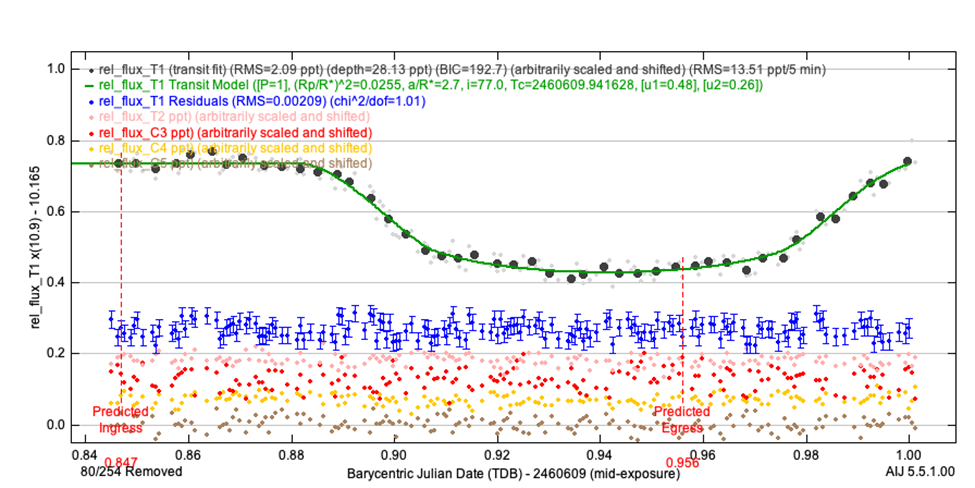
The vertical red dashed lines indicate the ingress and egress transit time predicted by STF. The blue dots with error bars represent the fitting residuals. The rel_flux_C2-5 correspond to the reference stars from the same observation images. The lack of fluctuations in the reference stars indicates the absence of transit events.
The first observation was conducted on 2024/09/26. The observation window was chosen based on the STF ingress/egress prediction. Unexpectedly, only a partial transit was observed with the egress phase being cut off (Figure 3). When compared with the predicted STF ingress and egress window (between the red dashed vertical lines), the actual transit timing exhibited a significant shift toward a later time. AIJ light curve fitting analysis determined this delay being 54.2 minutes (Table 2).
| Obs Date | Swarthmore Predicted T_C (BJD) | Observed T_C (BJD) | Observed T_C_Delay (min) |
| 2024/09/26 | 3580.8590 | 3580.8967 | 54.2 |
| 2024/10/25 | 3609.9016 | 3609.9416 | 57.6 |
| 2024/12/27 | 3672.8274 | 3672.8747 | 68.1 |
| 2025/02/05 | 3711.5509 | 3711.6075 | 81.5 |
Note the T_C_Delay became progressively longer as shown in the last column.
In order to investigate the transit delay on 2024/09/26, additional observations were conducted on 2024/10/25, 2024/12/27, and 2025/02/05. In all of these observations, progressively longer delays were recorded (Table 2).
Hypotheses of the Delayed Transits
To determine the cause of the observed transit delays, three hypotheses were examined. Firstly, the clock of the ground-based telescope could have had a significant drift. As a result, the observation window would be misaligned with the predicted transit window. Secondly, the prediction of the STF may not have been accurate. Thirdly, the inaccuracy could have been affected by TTVs.
Hypothesis 1: Ground Telescope Clock Drift
The ground-based telescope clock was examined first and a small 0.5 second drift was identified. This minor drift, however, stayed stable and did not increase significantly over time. The observed transit delay on September 26, 2024 was 54.2 minutes. The clock drift alone could not have accounted for such a big discrepancy. As additional observations were conducted, the observed delay kept increasing (Table 2). However, no corresponding pattern of clock drift was identified. Based on these findings, this hypothesis was rejected.
Hypothesis 2: Inaccurate STF Predictions
The Strong Correlation between Swarthmore Transit Finder and TESS Sector 73
To assess the accuracy of the STF predictions, a comparison was made between its transit timing predictions and those derived from TESS Sector 59 and 73 data. As shown in Table 3, STF exhibits a strong agreement with the predictions from Sector 73. In other words, from September 2024 to February 2025, STF was effectively indistinguishable from the TESS Sector 73 model in terms of transit timing prediction. Based on this finding, subsequent discussions will only refer to the Sector 73 predictions and leave out STF for convenience.
| Obs Date | The n-th Transit | Swarthmore T_C (BJD) | Sec 59 T_C (BJD)* | Sec 73 T_C (BJD)* | Sec 59 Diff (min) | Sec 73 Diff (min) |
| 2024/09/26 | 138 | 3580.859 | 3580.98462 | 3580.85880 | 180.9 | -0.3 |
| 2024/10/25 | 144 | 3609.9016 | 3610.03476 | 3609.90144 | 191.8 | -0.2 |
| 2024/12/27 | 157 | 3672.8274 | 3672.97673 | 3672.82716 | 215.0 | -0.3 |
| 2025/02/05 | 165 | 3711.5509 | 3711.71025 | 3711.55068 | 229.5 | -0.3 |
* T_C = (the_nth_transit – sector_offset)
Table 3 also shows that the Sector 59 difference column exhibits increasingly larger deviations as the time passes. This trend suggests that even a minor inaccuracy in the calculated transit period can accumulate over time, leading to significant discrepancies in transit timing predictions.
The Inaccurate Transit Periods of TESS Sector 59 and 73
The accuracy of the transit periods obtained from the TESS Sector 59 and 73 was evaluated with the process below:
- Select a TESS sector from either 59 or 73 as the base Sector S.
- Let the transit center of the very first transit in Sector S be T_Cs.
- Let the ordinal of the very first transit in Sector S be Ns.
- Let the period reported by TESS Sector S be Ps.
- Then the predicted n-th transit center T_Cn can be calculated as:
T_Cn = (n – Ns) ![]() Ps + T_Cs
Ps + T_Cs
- The n-th drift Dn between the observed and predicted transit center time is:
Dn = T_C_Obsn − T_Cn
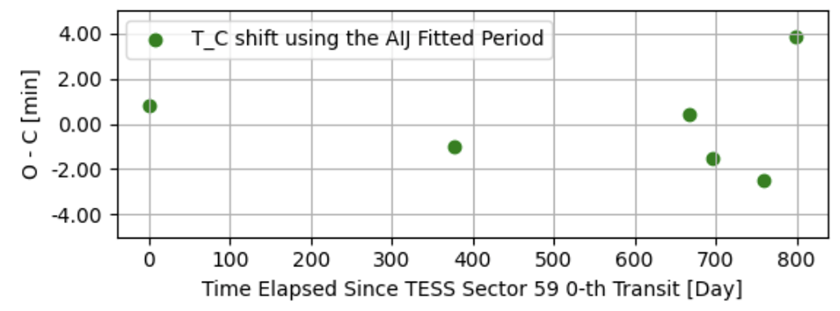
The drifts were plotted against the elapsed time in Figure 4. The downward (Sector 59) and upward (Sector 73) linear trends indicate that the transit period of neither sector is accurate. Sector 59 overestimates the real transit period. As a result, the actual transits would appear earlier than its predicted time. On the other hand, Sector 73 underestimates the real transit period, and therefore it has the opposite effect. Note, as the STF predictions are considered identical to the Sector 73, its drifts (black) overlap perfectly with the Sector 73’s data points (orange).
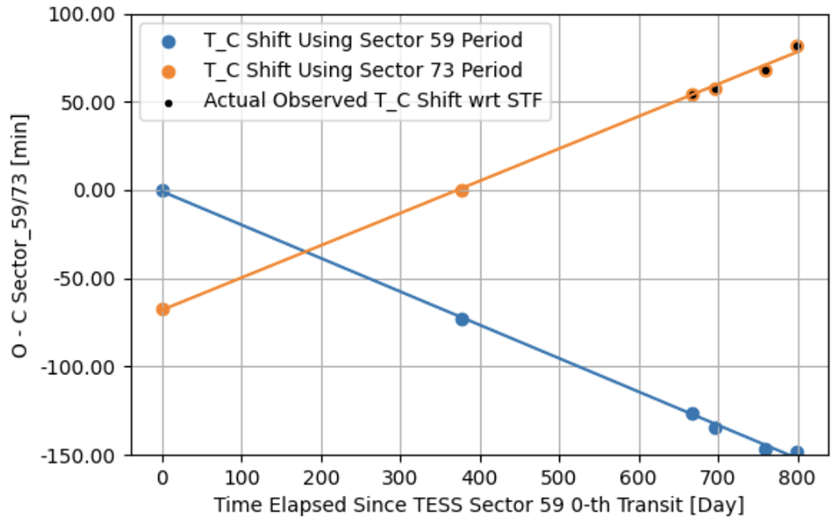
A complete transit event of TOI-3726.01 from the ingress to the egress lasts approximately 157 minutes. Fourteen months after the TESS Sector 73 (2023/11), the accumulated drift reached 81.5 minutes. As this trend continues, the actual transit will no longer overlap with the predicted transit window in about another fourteen months. It will become a significant challenge for future studies to locate the actual transit events if the current prediction model continues to be used.
From the above analysis, the delayed transits observed by the ground-based study can be attributed to the inaccurate period reported by TESS 73. Therefore, Hypothesis 2 is confirmed.
The Refined Transit Period
The inaccuracy of the single-sector periods of Sector 59 and 73 can come from the short ~27-day TESS observation window. By combining the TESS data with the ground-based observations, the observation window is effectively extended to ~26 months, which greatly reduces the impact of the error of individual observations. The ground-based observations also provide higher image resolutions (0.79 arcsec/pixel, Figure 1), which leads to sharper ingress/egress profiles, more accurate transit depths from less blend-in of the light-emitting neighbor sources, and better Signal-to-Noise Ratio (SNR). All of the factors help improve the model fitting accuracy.
As a result, the transit period was refined significantly (Table 4). The new period RSE (Residual Standard Error) is 1.2e-5 days which is a one order of magnitude improvement from the 4e-4 days RSE reported by Sector 59 and 73. A transit time drift plot similar to Figure 4 was also created to show the significantly reduced discrepancy (Figure 5).
| Source | Sector 59 | Sector 73 | Refined |
| Period | 4.8417 ± 4.4e-4 days | 4.8404 ± 4.1e-4 days | 4.84105 ± 1.2e-5 days |
According to the n-th transit convention of the study, there are 87 periods between Sector 73 (the 78th) and the last observation on 2025/02/05 (the 165th). The one-sigma error of period (35 sec) of Sector 73 amounts to 51 min accumulated error during this interval, which matches the actual delay of 81.5 min by the order of magnitude. In other words, TESS results were not incorrect.
Hypothesis 3: Transit Timing Variations
Hypothesis 2 explained the observed transit timing delay well. No confident evidence was found to support the claim of TTVs. As a result, this hypothesis was rejected. However, Hypothesis 2 does set a more restrictive upper bound of ±1.2e-5 days per period for potential TTVs in future observations.
Additional Fitting Results
| Date | Depth (ppt) | R_p (R_jup) |
| 2024/09/26 | 27.3 | 1.51 |
| 2024/10/25 | 28.1 | 1.63 |
| 2024/12/27 | 29.4 | 1.59 |
| 2025/02/05 | 26.3 | 1.61 |
| Mean ± Error | 27 ± 1 | 1.59 ± 0.05 |
| TESS Sector 59 | 27.94 | 1.63 |
| TESS Sector 73 | 27.04 | 1.61 |
This study primarily focused on refining the transit center time (T_C). However, the AIJ fitted transit model also yielded additional parameters, including the transit depth and the exoplanet radius (Table 5). These two parameters appeared to be consistent with the values reported in the ExoMast Vetting Summary7.
Discussion
Partially Captured Transit Events
A key challenge in this study was being able to obtain complete and high-quality transit observations. As with all ground-based telescopes, observational conditions are influenced by atmospheric seeing, weather variability, and transit event timing.
Two complete transit events were successfully obtained on 2024/10/25 (Figure A-1) and 2024/12/27 (Figure A-2). However, the other two observations only captured partial transits. Specifically, ingress was observed on 2024/09/26 (Figure 3), while egress was observed on 2025/02/05 (Figure A-3). In both partial observations, more than 50% of the transit duration was recorded. Despite the incomplete data, the AIJ model produced results with a χ2/dof of 1.0 (Figure 3, Figure A-3).
Better Transit Period Estimation Using Multiple TESS Sectors
The inaccuracy of the TOI-3726.01 transit period predicted by TESS Sector 59 and Sector 73 was reflected not only by the observed transit drifts, but also by the discrepancies between the two sectors themselves as shown in Figure 4. Such cross-sector discrepancy is not unique. Using the Lightkurve Python library16, a preliminary analysis of other TOIs (TOI-3706.01, TOI-3721.01, TOI-3725.01, TOI-3733.01) observed in the same two sectors as TOI-3726.01 revealed cross-sector discrepancies to a similar scale (Table A-1, Figure A-4).
For TOI-3726.01, a simple average of the Sector 59’s and 73’s periods yields a value of 4.8411 days ± 3e-4 days, which is merely 4 sec longer than the refined period of this study. As the TESS extended mission progresses, many TOIs get to be observed more than once. With the available multi-sector data and the extended timescale, it is advisable to refine the transit ephemerides even in the absence of the ground-based follow-up observations.
Refine Transit Ephemerides with Space- and Ground-based Observational Data
Previous work has been done at refining the transit ephemerides with combined space- and ground-based observation data. In the Klagyivik et al. 2021 study, the periods of 37 transiting planets were refined using epochs from CoRoT, ground-based follow-ups, and TESS. The study achieved one to two orders of magnitude improvements in the transit periods reaching 1e-6 to 1e-7 days errors with a time baseline of approximately 5000 days5. In another study, the periods of 21 hot Jupiter exoplanets were refined with amateur and professional observations with a range of telescopes of 0.3 m–2.2 m6. With the exception of WASP-117b, the remaining exoplanets had observations covering 300+ periods and achieved 1e-6 to 1e-7 errors in the refined periods. This study has a shorter time baseline of approximately 800 days or 165 periods compared to the above studies. The period error was 1.2e-5 days which is higher than the above studies.
Consequences of Out-of-date Transit Ephemeris
A recent report revealed that a 2025 James Webb Space Telescope (JWST) observation of the super-Earth GJ 357 b missed “the first ∼40% of the transit due to using an out-of-date ephemeris”17. In this case, the ephemeris was based on a 2019 study. It was fortunate that the partial transit still yielded valuable information about the super-Earth. The incident, nonetheless, underscores the criticality of having accurate and continuely-updated transit ephemerides. It is important not only for high-profile projects like JWST observations, but also for the broader astronomical community, including amateur observers.
Conclusion
Through the ground-based follow-up observations of the study, the transit events of TOI-3726.01 were successfully confirmed. By combining the newly acquired ground-based data and the existing TESS data, one order of magnitude improvement in precision was achieved on the transit orbital period (4.84105 days ± 1.2e-5 days), when compared with the average period (4.8411 days ± 3e-4 days) from TESS Sector 59 and 73. The new estimated ten-year transit center drift is 13 min which is well within the transit duration of 157 min8. The refined transit period significantly enhances the reliability of transit predictions and facilitates future observational studies over the next decade. In addition, this study highlighted the limitations of using a single TESS sector’s data for predicting transit timings. The study recommended to leverage both ground-based observations and TESS multi-sector data to achieve more accurate transit ephemerides.
Acknowledgements
The author sincerely thanks Dr. Don McCarthy of The University of Arizona for his invaluable mentorship and guidance. His expertise, encouragement, and insightful advice were indispensable to the completion of this study.
Observations reported here were obtained at the Mt. Lemmon SkyCenter with the Phillips telescope, a joint facility of The University of Arizona and the Edward Beshore and Amy Phillips Trust. The Astronomy Camp program, directed by Dr. McCarthy, funded operation of the telescope. The author thanks Travis Deyoe. Steven Bland, and Chipper Beiner for operational maintenance of the observatory equipment and Dr. Eric Jensen for discussions about the Transit Finder software.
The author also gratefully acknowledges Dr. Nora Eisner, Dr. Cole Johnston, and Kassie Perlongo, whose YouTube channel “Planet Hunters” provided valuable technical insight into the analysis of TESS data (https://www.youtube.com/c/planethunterscoffee).
Appendix
The Refined Transit Center Time
The refined transit center time of TOI-3726.01 can be calculated with the formula below, where n is the n-th transit after the TESS Sector 59.
T_Cn = (4.84105 ± 1.2e-5) n + (2459912.8309 ± 1.5e-3) (BJD)
Additional AIJ Light Curves
The fitted light curves of all other observations are listed below. Each figure shows the flux of both the target TOI-3726 and four reference stars, and the residuals of the model fitting. The STF ingress/egress are shown as the vertical red dashed lines to show the original STF predicted transit timing. In addition, the limb darkening coefficients (u1, u2) and the fitting statistics (RMS, χ2/dof) are also displayed.


Cross-sector Discrepancies between TESS Sector 59 and 73
A number of TOIs appearing in both TESS Sector 59 and 73 were selected based on the flux data quality and TIO numbering closeness to TOI-3726.01. Their phase-folded light curves were constructed using the Lightkurve library18. The flux data were outlier-removed (sigma=5), flattened (polyorder=1), normalized, and binned at 0.01 day interval. The folding periods and transit center epochs are shown in Table A-119,20,21,22,23,24,7,25.
| Candidate | Sector 73 Period (Days) | Sector 73 Transit Center Epoch (BJD) |
| TOI-3703 | 3.8901335 | 3286.8176 |
| TOI-3705 | 1.9023129 | 3286.1709 |
| TOI-3706 | 4.3701795 | 3286.7700 |
| TOI-3709 | 3.2509846 | 3288.7293 |
| TOI-3721 | 3.5411235 | 3287.5229 |
| TOI-3725 | 4.7262208 | 3287.8584 |
| TOI-3726 | 4.8404430 | 3290.4324 |
| TOI-3733 | 2.1263167 | 3286.3620 |
Figure A-4 shows the phase-folded light curves of Sector 59 and 73 using the periods and the epochs in Table A-1. The light curves of TOIs are shown in both the complete-period view and the zoomed-in view (± 0.2 days around the Sector 73 transit center).
If the periods and transit center epochs of Sector 73 were exact and accurate, the transit dips of Sector 59 would overlap with those of Sector 73. However, there are various degrees of shifts between the two sectors in both directions. This randomness of the shifts suggests a lack of systematic bias between the two sectors. The shift of TOI-3726.01 is approximately -0.05 days (or -72 min) which is consistent with Figure 4 (the orange line at time = 0). TOI-3706.01, TOI-3721.01, TOI-3725.01, TOI-3733.01 displayed shifts at a similar extent to TOI-3726.01.
This study does not aim to explore this cross-sector discrepancies exhaustively, but merely points out that TOI-3726.01 is not unique in this respect.
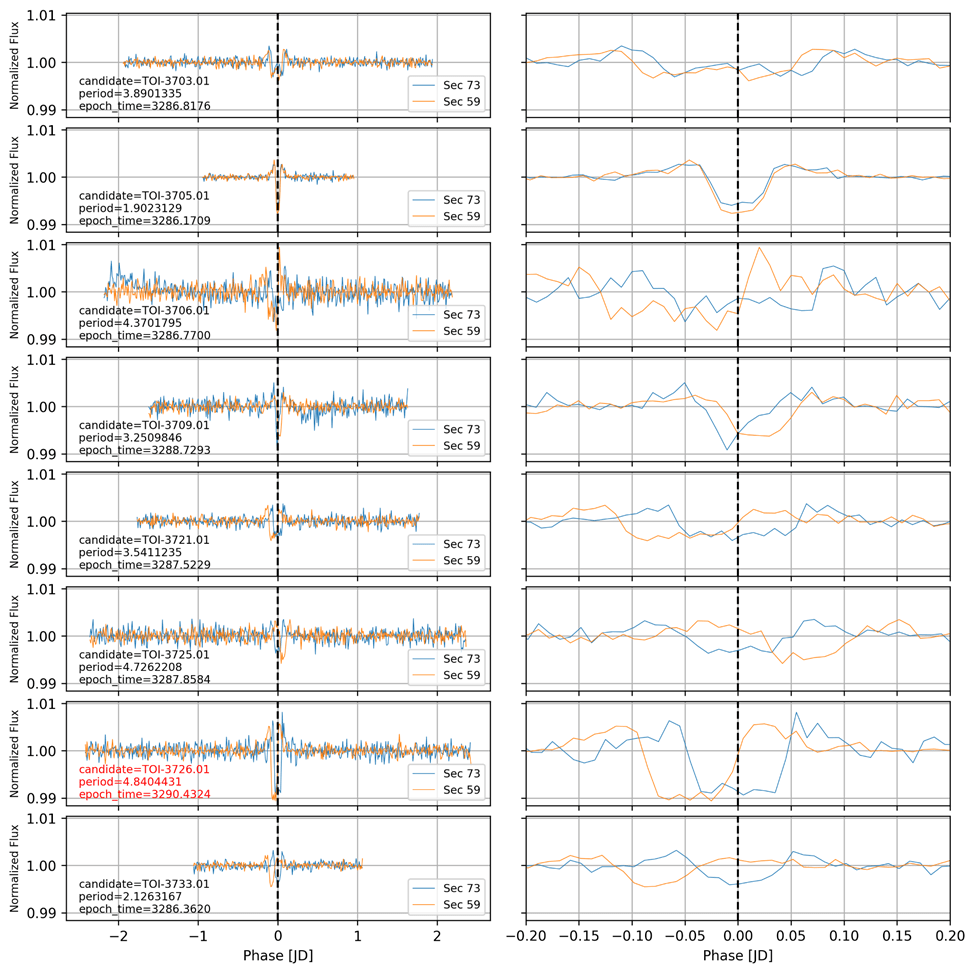
The left column shows the complete-period views of the phase-folded light curves. The right column shows the zoomed-in views of the same phase-folded light curves for better comparison.
References
- NASA Exoplanet Archive. Exoplanet criteria for inclusion in the archive. https://exoplanetarchive.ipac.caltech.edu/docs/exoplanet_criteria.html (2024). [↩]
- TESS Mission. Sector info. https://tess.mit.edu/science/observations/ (2025). [↩]
- N. M. Guerrero, S. Seager, C. X. Huang, A. Vanderburg, A. G. Soto, I. Mireles, K. Hesse, W. Fong, A. Glidden, A. Shporer, D. W. Latham, K. A. Collins, S. N. Quinn, J. Burt, D. Dragomir, I. Crossfield, R. Vanderspek, M. Fausnaugh, C. J. Burke, G. Ricker, T. Daylan, Z. Essack, M. N. Günther, H. P. Osborn, J. Pepper, P. Rowden, L. Sha, S. Villanueva Jr., D. A. Yahalomi, L. Yu, S. Ballard, N. M. Batalha, D. Berardo, A. Chontos, J. A. Dittmann, G. A. Esquerdo, T. Mikal-Evans, R. Jayaraman, A. Krishnamurthy, D. R. Louie, N. Mehrle, P. Niraula, B. V. Rackham, J. E. Rodriguez, S. J. L. Rowden, C. Sousa-Silva, D. Watanabe, I. Wong, Z. Zhan, G. Zivanovic, J. L. Christiansen, D. R. Ciardi, M. A. Swain, M. B. Lund, S. E. Mullally, S. W. Fleming, D. R. Rodriguez, P. T. Boyd, E. V. Quintana, T. Barclay, K. D. Colón, S. A. Rinehart, J. E. Schlieder, M. Clampin, J. M. Jenkins, J. D. Twicken, D. A. Caldwell, J. L. Coughlin, C. Henze, J. J. Lissauer, R. L. Morris, M. E. Rose, J. C. Smith, P. Tenenbaum, E. B. Ting, B. Wohler, G. Á. Bakos, J. L. Bean, Z. K. Berta-Thompson, A. Bieryla, L. G. Bouma, L. A. Buchhave, N. Butler, D. Charbonneau, J. P. Doty, J. Ge, M. J. Holman, A. W. Howard, L. Kaltenegger, S. R. Kane, H. Kjeldsen, L. Kreidberg, D. N. C. Lin, C. Minsky, N. Narita, M. Paegert, A. Pál, E. Palle, D. D. Sasselov, A. Spencer, A. Sozzetti, K. G. Stassun, G. Torres, S. Udry, J. N. Winn. The TESS objects of interest catalog from the TESS prime mission. The Astrophysical Journal Supplement Series 254.2 39 (2021). [↩]
- ExoClock. https://www.exoclock.space/ (2019). [↩]
- P. Klagyivik, H. J. Deeg, S. Csizmadia, J. Cabrera, G. Nowak. Orbital period refinement of CoRoT planets with TESS observations. Frontiers in Astronomy and Space Sciences 8 (2021). [↩] [↩]
- M. Mallonn, C. von Essen, E. Herrero, X. Alexoudi, T. Granzer, M. Sosa, K. G. Strassmeier, G. Bakos, D. Bayliss, R. Brahm, M. Bretton, F. Campos, L. Carone, K. D. Colón, H. A. Dale, D. Dragomir, N. Espinoza, P. Evans, F. Garcia, S.-H. Gu, P. Guerra, Y. Jongen, A. Jordán, W. Kang, E. Keles, T. Kim, M. Lendl, D. Molina, M. Salisbury, F. Scaggiante, A. Shporer, R. Siverd, E. Sokov, I. Sokova, A. Wünsche. Ephemeris refinement of 21 hot Jupiter exoplanets with high timing uncertainties. Astronomy & Astrophysics 622 (2019). [↩] [↩]
- ExoMast. TOI-3726.01 vetting report. https://exo.mast.stsci.edu/exomast_planet.html?planet=TOI-3726.01 (2024). [↩] [↩] [↩] [↩]
- ExoFOP. TOI-3726 info. https://exofop.ipac.caltech.edu/tess/target.php?id=122695048 (2024). [↩] [↩]
- Swarthmore Transit Finder. https://astro.swarthmore.edu/transits/ (2024). [↩]
- D. Lang, D. W. Hogg, K. Mierle, M. Blanton, S. Roweis. Astrometry.net: Blind astrometric calibration of arbitrary astronomical images. The Astronomical Journal 139 (2010). [↩]
- K. Mandel, E. Agol. Analytic light curves for planetary transit searches. The Astrophysical Journal 580 (2002). [↩]
- K. A. Collins, J. F. Kielkopf, K. G. Stassun, F. V. Hessman. AstroImageJ: Image processing and photometric extraction for ultra-precise astronomical light curves. The Astronomical Journal 153 (2017). [↩] [↩]
- ExoFOP. TOI-3726 info. https://exofop.ipac.caltech.edu/tess/target.php?id=122695048 (2024). [↩]
- EXOFAST – Quadratic Limb Darkening. https://astroutils.astronomy.osu.edu/exofast/limbdark.shtml (2025). [↩]
- M. M. Fausnaugh, P. J. Vallely, M. A. Tucker, C. S. Kochanek , B. J. Shappee, K. Z. Stanek, G. R. Ricker, R. Vanderspek, M. Agarwal, T. Daylan, R. Jayaraman, R. Hounsell, D. Muthukrishna. Four years of type Ia supernovae observed by TESS: early-time light-curve shapes and constraints on companion interaction models. The Astrophysical Journal 956:108 (2023). [↩]
- Lightkurve Collaboration, J. V. d. M. Cardoso, C. Hedges, M. Gully-Santiago, N. Saunders, A. M. Cody, T. Barclay, O. Hall, S. Sagear, E. Turtelboom, J. Zhang, A. Tzanidakis, K. Mighell, J. Coughlin, K. Bell, Z. Berta-Thompson, P. Williams, J. Dotson, G. Barentsen. Lightkurve: Kepler and TESS time series analysis in python. Astrophysics Source Code Library (2018). [↩]
- J. Taylor, M. Radica, R. D. Chatterjee, M. Hammond, T. Meier, S. Aigrain, R. J. MacDonald, L. Albert, B. Benneke, L.-P. Coulombe, N. B. Cowan, L. Dang, R. Doyon, L. Flagg, D. Johnstone, L. Kaltenegger, D. Lafrenière, S. Pelletier, C. Piaulet-Ghorayeb, J. F. Rowe, P.-A. Roy. JWST NIRISS transmission spectroscopy of the super-Earth GJ 357b, a favourable target for atmospheric retention. Monthly Notices of the Royal Astronomical Society 540:4 (2025). [↩]
- Lightkurve Collaboration, J. V. d. M. Cardoso, C. Hedges, M. Gully-Santiago, N. Saunders, A. M. Cody, T. Barclay, O. Hall, S. Sagear, E. Turtelboom, J. Zhang, A. Tzanidakis, K. Mighell, J. Coughlin, K. Bell, Z. Berta-Thompson, P. Williams, J. Dotson, G. Barentsen. Lightkurve: Kepler and TESS time series analysis in python. Astrophysics Source Code Library (2018). [↩]
- ExoMast. TOI-3703.01 vetting report. https://exo.mast.stsci.edu/exomast_planet.html?planet=TOI-3703.01 (2024). [↩]
- ExoMast. TOI-3705.01 vetting report. https://exo.mast.stsci.edu/exomast_planet.html?planet=TOI-3705.01 (2024). [↩]
- ExoMast. TOI-3706.01 vetting report. https://exo.mast.stsci.edu/exomast_planet.html?planet=TOI-3706.01 (2024). [↩]
- ExoMast. TOI-3709.01 vetting report. https://exo.mast.stsci.edu/exomast_planet.html?planet=TOI-3709.01 (2024). [↩]
- ExoMast. TOI-3721.01 vetting report. https://exo.mast.stsci.edu/exomast_planet.html?planet=TOI-3721.01 (2024). [↩]
- ExoMast. TOI-3725.01 vetting report. https://exo.mast.stsci.edu/exomast_planet.html?planet=TOI-3725.01 (2024). [↩]
- ExoMast. TOI-3733.01 vetting report. https://exo.mast.stsci.edu/exomast_planet.html?planet=TOI-3733.01 (2024). [↩]


