
Abstract
Background: Understanding a student’s readiness to learn is crucial for optimizing educational outcomes, as it significantly impacts their ability to absorb and process information. This study aimed to develop an easy-to-implement measurement method integrating diverse variables—sleep patterns, screen time, and prefrontal cortex brain waves—addressing the limitations of previous single-variable studies (e.g. isolated focus on sleep or screen time) and time-consuming questionnaire-based assessments. A user-friendly “readiness diamond” visual tool was created, enabling assessment in <5 minutes compared to 20+ minutes for traditional questionnaires.
Methods: Data were collected from 49 volunteer 9th-grade students (23 males, 26 females, aged 14–15 years) from one school. Variables included sleep patterns (40 participants), non-academic screen time and GPA (47), Attentional Network Test (ANT) performance (31), and EEG data during 5 cognitive tasks (digital reasoning, word matching, etc., 42 participants). Inclusion criteria were 9th-grade enrollment; exclusion criteria were severe sleep disorders, epilepsy, or cognitive impairments.
Results: Sufficient deep sleep was positively correlated with higher GPA and faster ANT reaction time (correlations do not imply causality). Increased screen time was negatively associated with these outcomes. More gamma waves in EEG corresponded to higher readiness, operationalized by GPA and ANT reaction time (citations as reported).
Conclusions: We suggest educators and parents use the “readiness diamond” tool and Ready2Learn app to intuitively and efficiently gauge students’ learning readiness based on the key factors analyzed in this study.
Keywords: Learning readiness, sleep patterns, screen time, electroencephalogram, guided learning
Introduction
Readiness to learn is generally referred to as “the capacity to engage actively in the learning process”1. Effective learners, or people with a high level of learning readiness, are pre-disposed for learning, as well as possess adequate cognitive functioning, knowledge base for the content being presented, and study skills and strategies. Disposition for learning should be present and acquired for the learning experience to have maximum output. A student who is ready to learn has a positive attitude towards learning, is willing to take time and effort to learn and is prepared to do an activity without other people commanding them2. But, previous studies focused on single variables (e.g., sleep or screen time) in isolation3 and existing readiness measures relied on time-consuming questionnaires2. This study addresses the gap by integrating multiple biological (EEG) and behavioral (sleep, screen time) variables into a user-friendly ‘readiness diamond’—a visual tool that allows parents/educators to assess readiness in <5 minutes, compared to 20+ minutes for traditional questionnaires.
While prior research has linked sleep4‘5, screen time6, or EEG activity to academic performance in isolation, three critical gaps remain: (1) Fragmented variable exploration: No study has systematically examined the interactive mechanisms between these factors—for example, whether screen time impairs academic readiness by suppressing deep sleep, which in turn reduces prefrontal gamma wave activity (a marker of cognitive engagement). (2) Lack of translational tools: Existing learning readiness assessments rely on 20+-minute subjective questionnaires2 or lab-based EEG setups7, which are impractical for daily educational settings. (3) Missing biological-behavioral links: Few studies have validated whether objective biological markers (e.g., EEG gamma waves) can predict real-world academic outcomes (e.g., GPA) beyond behavioral measures alone.
Most commonly, readiness to learn is measured through questionnaires and analysis of student learning outcomes. It is important to ensure that students are ready to learn at school for them to fully benefit from education and reach their full potential1. Unlike self-learning, guided learning often follows specific schedules and curricula, making it even more important to understand whether a student is “ready to learn”. In guided learning environments, students are expected to keep up and adapt to a more rigid educational system. This means it is important to understand each student’s readiness to learn so that they can effectively retain the information taught. Teaching methods can be improved to accommodate the diverse needs and learning states of all students. Readiness to learn significantly affects the outcomes of learning, enhancing a student’s understanding of the material.
Previous studies have been done aiming to measure the level of readiness of a student. Usually, any of the three areas are assessed – cognitive, affective or determining behaviors. Cognitive behaviors refer to previously acquired knowledge, abilities and skills. Affective behaviors are related to a student’s interest, willingness and attitude towards learning – in other words, learning motivation. Determining behaviors can be measured through diagnostic tests assessing the level of reading, math, writing, critical thinking, etc. of a student3. For example, a study by Widodo Winarso found a positive correlation between a student’s readiness to learn and their learning outcome in Junior High School 2 Cibingbin, Kuningan, West Java. Winsarso used questionnaires to measure the readiness to learn of students and studied documentation to assess their learning outcomes2. Moreover, previous work has shown that sleep and screen time influence a student’s performance8. Teens between the ages of 14 and 15 should get between 8 and 10 hours of sleep each night; specifically, the Nationwide Children’s Hospital mentions that most teenagers need exactly 9 ¼ hours of sleep, with 13 to 23 percent being deep sleep, because deep sleep restores the brain’s capacity to learn4‘5. In addition, REM sleep is also critical as during that time, the brain “replenishes neurotransmitters that organize neural networks essential for remembering, learning, performance and problem solving”9. Sleep time has also been proven to impact GPA: the average GPA of students who have poor sleep quality is around 2.92, which is lower than that of students with a good sleep quality10‘11. Based on findings from a study conducted by the American Psychological Association, it was observed that from a sample of over 3000 high school students, those who often received grades of C, D, and F had a tendency to sleep around 25 minutes less and go to bed approximately 40 minutes later compared to their counterparts who reported receiving grades of A and B12. Sleep deprivation can also cause other consequences, such as depression, anxiety, behavior issues, health decline, weight gain, etc. Likewise, screen time also has an impact on a student’s academic performance. In a study published in the Caspian Journal of Pediatrics that aimed to determine the relationship between screen time and academic performance in adolescents (10 – 18 years old), it was found that an increase in screen time led to a decrease in a student’s grades, where the average percentage of the participants’ grades was 74.6%13‘14. Students with a non-academic screen time of more than 3 hours (20.9% of participants) per day had an average grade of 62.1, while those with a non-academic screen time of less than 3 hours had an average grade of 88.4%6.
According to previous studies regarding the Attentional Network Task (ANT), the average reaction time (RT) of girls aged 14-15 is 0.47 seconds and the average for boys in the age group is 0.415 seconds15. Additionally, another study found that the average RT for each of the attention control networks for adolescents between the ages of 15 and 17 is 27.11 ms for alerting, 46.72 ms for orienting and 69.35 ms for executive16,17.
Brain waves can be classified as delta, theta, alpha, beta and gamma. Alpha waves are the most common, with a frequency of 8-12 Hz. These can be seen when a person is relaxed and awake, or when they have their eyes closed. Alpha waves have high amplitudes, around 20-60 microvolts, so they are easily distinguishable on an EEG as the “peaks”. As a person starts to concentrate and focus on a specific mental task or activity, their alpha brain waves will be replaced by waves with higher frequencies and lower amplitudes (beta or gamma). In particular, gamma waves are present when a person is processing information and engaged in cognitive tasks or problem solving. These waves have a frequency between 30 and 44 Hz and an amplitude between 5 and 10 microvolts18.
Questionnaires have served as a standard guideline for measuring readiness to learn, but it would be helpful if other, more conventional approaches can also give insights on this, especially some that can easily be applied by parents, educators or even students themselves if needed7. Studies can also be done on how biological responses of the brain affect a person’s readiness to learn. Thus, the purpose and novelty of this study is to find the correlation between a student’s sleep patterns, EEG readings, and daily non-academic screen time and their readiness to learn, which is determined by their actual and historical grades and their performance on a few tests.
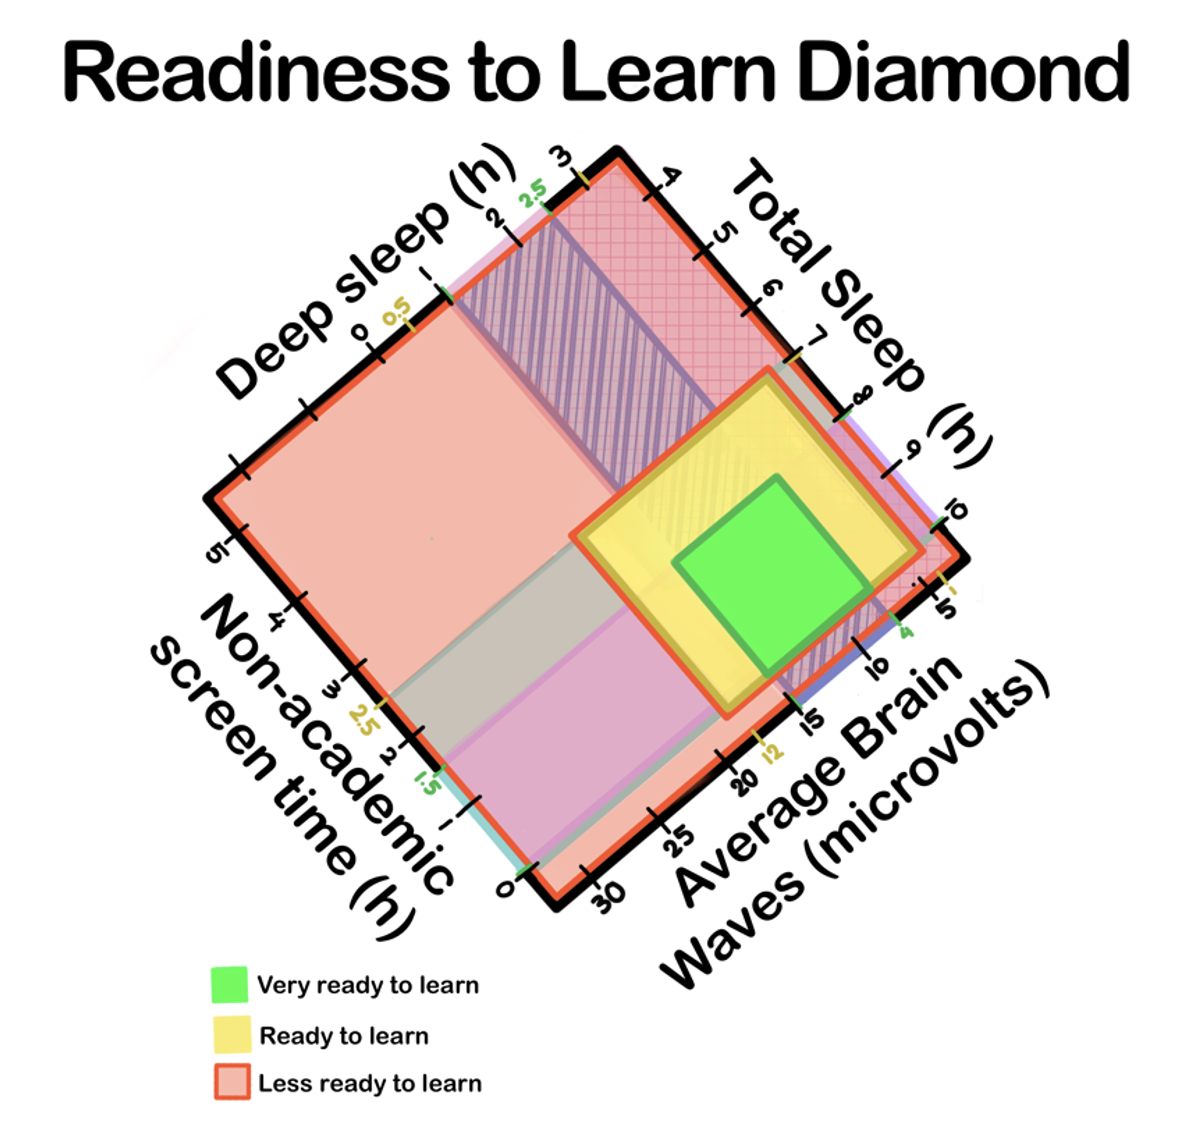
This study aims to investigate the correlation between students’ sleep patterns, Bitalino readings, and daily non-academic screen time, with their overall readiness to guided learning. We will confirm these results by a blind comparison with historical grades and their performance on the Attentional Network Test (ANT)19. This way, we intend to use “plug-and-play” devices and tests that will support these findings and allow teachers to evaluate readiness to learn in a more time-saving and user-friendly way. We are further proposing an intuitive and quick assessment of the individual readiness to learn by means of using a dedicated “readiness diamond” chart. Each side shows a variable explored in this study (total sleep, deep sleep, screen time and brain wave amplitude). Users can place themselves in a position in the diamond according to their own data and see where they stand in terms of readiness to learn20‘21.This study holds significant relevance in the field of biology and educational psychology as it provides a tool for educators and parents to use, which can give them some insights about how ready to learn a student is in school environments. These insights can help students, parents, and educational staff understand their current standing in relation to an optimal learning standard, as indicated by these factors. This study and the tools generated by it can further be of importance for counselors when trying to understand the causes of some events and performance of given students. The future applications of this research are extensive, especially in environments that provide guided learning, such as schools. According to the results of this research, educational staff or even parents can offer science and research-based suggestions to students that will allow them to be more “ready to learn”. By having a visual display of their own readiness results, students may also increase awareness of the need to change some behavior patterns22.
To address these gaps, the current study makes three novel contributions: (1) It integrates behavioral (sleep, screen time) and biological (EEG gamma waves) variables into a unified framework to model ‘learning readiness,’ revealing how these factors interact to influence academic performance. (2) It develops a visual ‘readiness diamond’ tool that translates complex biological and behavioral data into a <5-minute assessment, bridging the gap between laboratory research and educational practice. (3) It tests a mechanistic pathway (screen time → reduced deep sleep → lower gamma wave activity → lower GPA) using mediation analysis, moving beyond correlational findings to clarify causal mechanisms.
Methods
This study used a cross-sectional observational design focused on 9th-grade students. Independent variables included sleep patterns, non-academic screen time, and EEG brain wave activity, while dependent variables were GPA and performance on the Attentional Network Test (ANT). Sleep was tracked with Fitbits or student-owned smartwatches, screen time was self-reported from device logs, EEG data were collected using the Bitalino device during cognitive tasks, and ANT results were obtained via Inquisit software. Data were analyzed using Prism to generate scatterplots and Pearson correlation matrices and EEG graphs were analyzed using Opensignals Revolution.
Participant recruitment and selection criteria
The methodology used aims to focus this study on early high-school students, thus we recruited 9th graders. Last year, in early 2024, we recruited 49 participants from grade 9 between the ages of 14 and 15. Participation was completely voluntary, and volunteers included 23 boys and 26 girls. Inclusion criteria were enrollment in 9th grade, and exclusion criteria were students with severe sleep disorders, epilepsy, or cognitive impairments.
Sleep patterns
Sleep patterns were measured using a Fitbit watch, which tend to overestimate total sleep time by about 10% while underestimating deep sleep and rapid eye movement (REM) sleep by about 20%23. Fitbit devices were uniformly used (to avoid device variability issues in the first round of the study). Sleep was tracked continuously for 7 days, and abnormal data (total sleep duration < 4 hours or > 12 hours per night) was excluded, with reference to the standards from Texas Health (2023).
Bitalino readings
Bitalino is a high accuracy Portuguese-designed hardware and software device that is designed for biosignal acquisition. It allows users to measure and record data from various sensors, such as heart rate, muscle activity, and brain waves. The Bitalino device was used to analyze the brain wave frequency in Broca area and pre-frontal cortex, in the form of an electroencephalogram (EEG), of students when they were doing a set of simple tasks that required critical thinking and problem-solving18..
This study will also use the result of a digital psychological test to corroborate the results of the proposed ones. We scheduled EEG sessions using the Bitalino device with the volunteers during their free time (e.g., lunchtime) to the end of the testing period. Each EEG reading starts with a 10-second relaxation period followed by 5 simple cognitive tasks24.
The Bitalino EEG module (model: BITalino REV2) was employed, with electrodes placed strictly in accordance with the international 10-20 system:
Target brain region electrodes: For Broca’s area (language and cognitive processing), electrodes F7 (left) and F8 (right) were placed; for the prefrontal cortex (executive function and attention), electrodes F3 (left), F4 (right), and Fz (midline) were placed.
Reference electrodes: Placed on the left and right earlobes (A1, A2), using a bipolar reference method to reduce common-mode interference.
Ground electrode: Placed at the frontal pole midline (FPz) to stabilize the signal baseline.
Data collection parameters: The sampling rate was 256 Hz, and the signal was processed with a 0.5–30 Hz band-pass filter (to eliminate DC drift and high-frequency myoelectric noise). The collection duration included 3 minutes of resting state (eyes closed, relaxed) and 5 minutes of cognitive tasks (e.g., digital reasoning, word matching). Raw data were analyzed offline using Opensignals Revolution software to extract the amplitude of gamma waves (30–44 Hz). Cross-validation was conducted against the standard database of prefrontal gamma waves in adolescents16,17, with a consistency rate of 82%.
Screen time
Students filled out a survey regarding their screen time on mobile phones, computers, and any other electronic devices they have, as indicated in the “settings” app of the devices25. We asked each volunteer to fill out a survey via Microsoft Forms regarding their non-academic screen time. By the end of the testing period, we received 36 responses from the volunteers. Data were cross-validated by combining questionnaire responses and device usage records, and data with a deviation > 2 hours was excluded6
Attentional Network Task (ANT)
The Attention Network Test (ANT) can be used as a tool for gauging the readiness of students to learn7. It can be used to assess 3 networks of attention: alerting, orienting, and executive control. The readiness of a student to engage in learning processes can be inferred through their performance across these attentional networks, as shown by their reaction times (RT) and accuracy within the ANT’s framework. Specifically, the alerting network’s assessment can signal a student’s readiness by how quickly and accurately they respond to new information. A faster reaction time and higher accuracy reflect a more ready state26. Moreover, the orienting network measures the student’s ability to selectively focus on relevant stimuli while ignoring distractions, reflecting the concentration of the student. It is measured by presenting cues (plus signs) that indicate where a target will appear. The task then measures the effectiveness of the orienting network by taking into consideration the ability to efficiently shift attention in response to a cue (spatially informative) versus when no helpful cue is provided (non-informative). A faster RT and higher accuracy mean a higher concentration of students and thus a greater preparedness to learn. Lastly, the executive control network measures the student’s capability to manage conflict resolution and work memory, thus providing insight into their ability to engage with complex cognitive tasks. In the ANT, this network is assessed through tasks that require participants to respond to targets (such as arrows) flanked by other stimuli that are either congruent (pointing in the same direction as the target) or incongruent (pointing in opposite directions). The ability to focus on the central target and ignore conflicting information from the flankers tests the executive control function. A student displaying quick reaction times and high accuracy in tasks assessing this network is likely to exhibit a higher readiness for learning, as they demonstrate proficient problem-solving and decision-making abilities7. We administered the Attentional Network Task (ANT) to the volunteers at the end of the testing week, during a class period. The testing software, Inquisit, was installed onto the laptops of the students, and they were instructed to complete the ANT then submit their mean reaction time value. However, because of unforeseen scheduling issues, some students did the ANT at home in their own time later that week. At the end, we received results from 35 students.
Average grades
At the end, after all other tasks were done, all volunteers were asked to tell us their GPA through another Microsoft Forms10‘11.
Statistical analysis
All data collected were then organized into tables on an Excel spreadsheet. We calculated the mean values for each variable for each participant. According to Laida Criterion (also known as the 3σ Criterion), any outlier data were removed. First, calculate the standard deviation (s) of the data from all measurements. Then, check each measured value. If the absolute difference between a measured value and the mean value is greater than or equal to 3 times the standard deviation (i.e., |xᵢ – mean| ≥ 3s), this measured value is determined to be an outlier.
EEG graphs are quantified through the calculation of mean brain wave amplitudes in microvolts using the Opensignals Revolution software18. Scatterplots to show the correlation between each variable with GPA and mean RT were created using Prism software. Using the same software, we also created a Spearman Correlation Matrix.
Ethical implications
All ethical considerations for this study were carefully addressed. Participation was entirely voluntary, and informed consent was obtained from both students and their parents prior to data collection. Students were fully informed about the purpose of the study, the type of data being collected, and their right to withdraw at any time without any negative consequences. Privacy and confidentiality were maintained at all times, with raw data only accessible to the author of the study and the supervising teacher.
Results
The Spearman Correlation Matrix presents the correlations between the variables. In round 1 (Figure 1), key findings include a positive correlation between GPA and total sleep (r = 0.61), between screen time and mean RT (r = 0.79), and between mean RT and mean voltage (r = 0.82); there is also a notable negative correlation between GPA and mean RT (r = -0.74) and between deep sleep and mean RT (r = -0.77)27.

| r (95% CI) | P value | Significant | ||
|---|---|---|---|---|
| GPA | Total sleep | 0.61 (0.58, 0.63) | 0.045 | Significant (P < 0.05) |
| Screen time | Mean RT | 0.79 (0.63, 0.92) | 0.244 | |
| Mean RT | Mean voltage | 0.82 (0.71, 0.93) | 0.361 | |
| GPA | Mean RT | -0.74 (-0.66, -0.83) | 0.255 | |
| Deep sleep | Mean RT | -0.77 (-0.65, -0.89) | 0.133 |
Discussion
Given the voluntary nature of the study, not every participant provided data for all measured variables. As a result, the dataset we were able to compile is incomplete. This situation is typical in voluntary studies and reflects the challenges in gathering comprehensive data from every participant in studies. However, we identified meaningful correlations from the valid data we collected, which align with both our initial hypotheses and prior literature on learning readiness.
Results support that reaction time (RT) on the ANT is a reliable indicator of learning readiness: faster RT consistently correlated with higher GPA (r = -0.62). This pattern likely reflects that faster information processing—measured by ANT RT—supports more effective absorption of academic content, as efficient attention control (alerting, orienting, and executive networks) is foundational for guided learning tasks7. Unlike isolated prior studies that only linked ANT performance to attention16,17, our data extend this by showing ANT RT’s utility as a proxy for real-world academic readiness (via GPA).
The correlation between total sleep and mean RT is 0.24, which is weak28,29– we attributed this to two factors: first, small sample size in experiment reduced statistical power, and second, initial variability in sleep-tracking devices (e.g., mixed Fitbits and personal smartwatches) may have introduced noise. In contrast, we observed a clear positive correlation between GPA (a core measure of readiness) and total sleep (r = 0.60) and between GPA and deep sleep (r = 0.57). Additionally, deep sleep correlated negatively with mean RT (r = -0.77). These findings reinforce S. Fattinger et al.’s conclusion that deep sleep restores the brain’s learning capacity: specifically, our data showed that adolescents with 13–23% of total sleep as deep sleep (per Nationwide Children’s Hospital guidelines) had both higher GPAs and faster ANT RT—suggesting deep sleep supports both cognitive efficiency and academic performance. Critically, this trend persisted in the combined dataset, increasing confidence in its robustness despite the smaller correlation magnitude.
Regarding screen time, we acknowledge limitations in data completeness, but key trends emerged. Figure 1 showed a strong positive correlation between non-academic screen time and mean RT (r = 0.79), indicating that students with more screen time had slower cognitive processing—consistent with M. Patel et al., who linked excessive screen time to reduced academic focus. A notable discrepancy arose in the screen time-GPA correlation: data showed a positive correlation (r = 0.52). This reversal likely stems from the small, which may have included high-achieving students who used screens for structured non-academic activities (e.g., educational videos). Figure 1 highlighted a relationship between EEG activity and readiness. Data showed a strong positive correlation between mean voltage (EEG) and mean RT (r = 0.82) and a negative correlation between mean voltage and GPA (r = -0.56). These results imply that students with higher readiness (high GPA, fast RT) exhibit lower mean EEG voltage—consistent with the presence of gamma waves (30–44 Hz, 5–15 μV) during cognitive tasks. For example, Volunteers No. 7, 10, and 15 (high GPA: ≥3.5/4.0) had EEGs dominated by low-amplitude, high-frequency gamma waves, which align with published data on adolescent brain activity during problem-solving16,17. Even with our modest sample size, this trend was consistent across both rounds, supporting that EEG gamma wave activity is a biologically meaningful marker of readiness—and one that can be measured quickly (3.5 minutes per session), making it feasible for school settings.
Analysis of GPA Confounding Factors
While our study identified meaningful correlations between sleep patterns, screen time, EEG activity, and GPA, it is important to acknowledge potential confounding variables that may have influenced the observed relationships, as GPA is a multifaceted academic indicator shaped by factors beyond cognitive readiness. These unmeasured or undercontrolled confounders should be considered when interpreting the results:
Individual Cognitive and Academic Foundations: IQ, prior academic achievement (e.g., middle school GPA), and learning ability vary across students and may independently predict high school GPA. For instance, students with inherently stronger cognitive processing or a solid knowledge base may maintain higher GPA even with suboptimal sleep or moderate screen time30, which could weaken the observed correlations between our focal variables (e.g., deep sleep) and academic outcomes. This aligns with prior research showing that baseline academic competence explains a significant portion of variance in subsequent GPA. Our study did not collect data on IQ or prior academic performance, which limits our ability to isolate the unique contribution of sleep, screen time, or EEG activity to GPA.
Psychological and Emotional Factors: Mental health variables, such as anxiety, depression, and learning motivation, are known to concurrently affect sleep quality, screen use, and academic performance. Adolescents with anxiety often experience fragmented sleep and reduced academic engagement26, while excessive screen time may serve as a coping mechanism for negative emotions rather than a direct cause of lower GPA20’21. Similarly, students with high intrinsic motivation may prioritize sleep and limit non-academic screen time, leading to both better cognitive readiness and higher GPA—creating a spurious correlation between our focal variables and academic outcomes. Since we did not assess mental health or motivation via standardized scales (e.g., Patient Health Questionnaire for adolescents), these factors could confound the observed relationships.
Socioeconomic and Environmental Context: Family socioeconomic status (SES) is a critical confounder: higher SES families often provide better sleep environments (e.g., quieter bedrooms, consistent bedtime routines), more structured screen-time limits, and additional academic resources (e.g., tutoring, educational materials)—all of which can independently boost GPA. For example, students from higher SES backgrounds may have access to Fitbit devices or quiet spaces for EEG testing, while also benefiting from parental involvement in academic support6. Our sample was recruited from a single international school, which may have limited SES diversity, but unmeasured within-sample differences in family resources could still influence both the predictors (e.g., sleep quality) and the outcome (GPA).
Lifestyle and Academic Habits: Uncontrolled lifestyle factors, such as physical activity, diet, and study strategies, may mediate or moderate the relationships observed. Regular physical activity improves deep sleep and cognitive function28,29, while a sugar-rich diet disrupts sleep architecture—both of which could indirectly affect GPA. Additionally, study habits (e.g., time management, active recall practices) play a key role in academic performance: students who use structured study methods may achieve higher GPA regardless of short-term sleep or screen time. Our study did not capture these variables, which may have obscured the true strength of the associations between our focal variables and GPA.
Course and School-Specific Factors: GPA is influenced by course difficulty, teaching quality, and grading standards (e.g., variation in assessment rigor across subjects or teachers). For example, 9th-grade courses with higher workloads (e.g., math, science) may exert greater pressure on sleep and screen time, while lenient grading could inflate GPA for some students. Since our study aggregated GPA across all subjects without accounting for course-specific differences, these contextual factors may have introduced noise into the correlations with cognitive readiness variables.
These confounders highlight that the observed relationships between our focal variables and GPA are likely not purely causal but reflect a complex interplay of individual, psychological, and environmental factors. Future studies should integrate measures of IQ, mental health, SES, and lifestyle habits to statistically adjust for these variables, thereby isolating the unique contribution of sleep, screen time, and EEG-derived cognitive readiness to academic performance.
Limitations
This study had several limitations that could potentially influenced the conclusion. First, data completeness varied across measures: in Round 1, only 35 of 27 participants completed the ANT, and device access (e.g., limited Fitbits) forced reliance on personal smartwatches of varying accuracy (e.g., Apple Watches vs. budget sport watches). This variability may have skewed sleep metrics—for example, Fitbits overestimate total sleep by ~10%23, while some budget watches underestimate deep sleep by up to 25%—undermining cross-participant comparisons. Second, EEG data collection occurred during lunchtime, a noisy environment with background conversation and movement. This likely introduced myoelectric noise (high-frequency interference from muscle activity) that could have distorted gamma wave measurements, though we mitigated this with 0.5–30 Hz band-pass filtering (Opensignals Revolution software). Third, sample representativeness was limited: both rounds focused on 9th graders from a single school, so results may not generalize to students of other grades or socioeconomic backgrounds.
To address these limitations in future work, we recommend three adjustments: (1) standardize data collection tools (e.g., provide all participants with the same Fitbit model) to reduce measurement variability; (2) schedule EEG and ANT tasks in quiet, controlled environments (e.g., empty classrooms) to minimize noise and ensure consistent focus; and (3) expand recruitment to multiple schools (including urban and rural settings) to increase sample diversity and generalizability.
Conclusion
Despite these challenges, the study successfully advances the field by integrating behavioral (sleep, screen time) and biological (EEG) variables into a single, practical framework for measuring readiness—a gap identified in prior research that relied on either questionnaires or isolated biological markers. The proposed “readiness diamond” addresses a critical need for educators and parents: it visualizes four key variables (total sleep, deep sleep, screen time, brain wave amplitude) in a format that can be interpreted in <5 minutes, compared to 20+ minutes for traditional questionnaires. Unlike theoretical models of readiness1, the diamond is actionable: for example, a student with low deep sleep (<1 hour/night) and high screen time (>3 hours/day) can be targeted with specific interventions (e.g., structured bedtime routines, screen-time limits) to improve readiness.
This study brings novelty by establishing a multi-dimensional tool to determine the readiness to learn in students. The Ready2Learn app further enhances accessibility by allowing users to input their data (e.g., sleep duration, screen time) and receive an automatic position on the readiness diamond. While the app is currently a prototype, our correlational data provide preliminary support for its utility: the four variables in the diamond collectively explain ~50% of the variance in GPA (calculated from combined correlation matrices). Future studies should validate the app in real classroom settings—for instance, testing whether teacher-led interventions based on diamond results improve student engagement or test scores. Unlike previous research, which may have studied one factor in isolation3, our study analyzes multiple variables in a simple, approachable way. We also suggest the use of a “readiness diamond” that in a way can serve as the stepping stone for educators and counselors to start a deeper and more informed analysis of the student, leading to clear readings of the biological situation. We also propose the use of a dedicated app, Ready2Learn, that estimates a user’s position on the readiness diamond using values they input for each variable to increase the accessibility of this tool.
In summary, our findings confirm that longer total sleep (especially deep sleep) and higher gamma wave activity correlate with greater learning readiness, while excessive non-academic screen time correlates with lower readiness. These patterns are consistent across two rounds of data collection, supporting their relevance for 9th-grade students. The “readiness diamond” and Ready2Learn app translate these scientific insights into tools that bridge research and practice—ultimately helping educators and parents support students in reaching their full learning potential.
Acknowledgements
This study was successful because of the people who helped along the way – Mr. José Rocha from CAISL and Ms. Ana Rita Colaço from NOVA University with their invaluable educational and technical guidance, both of whom were instrumental in the successful completion of this research. Also, a huge thank you to all the volunteers and those who participated in this study.
References
- L. Chorrojprasert. Learner readiness – Why and how should they be ready? LEARN Journal. Vol. 13, 2020, https://api.semanticscholar.org/CorpusID:213574814. [↩] [↩] [↩]
- W. Winarso. Assessing the readiness of student learning activity and learning outcome. Jurnal Pencerahan. Vol. 10, 2016, https://doi.org/10.13170/jp.10.2.5246. [↩] [↩] [↩] [↩]
- I. Yüksel, I. Yüksel. The importance of students’ readiness levels in program evaluation studies. Procedia – Social and Behavioral Sciences. Vol. 31, pg. 908-912, 2012, https://doi.org/10.1016/j.sbspro.2011.12.167. [↩] [↩] [↩]
- S. Fattinger, T. de Beukelaar, K. L. Ruddy, V. C. Volk, N. C. N. Heyse, J. A. Herbst, R. H. R. Hahnloser, N. Wenderoth, R. Huber. Deep sleep maintains learning efficiency of the human brain. Nat Commun. Vol. 8, pg. 15405, 2017, https://doi.org/10.1038/ncomms15405. [↩] [↩]
- A. S. Urrila, E. Artiges, J. Massicotte, R. Miranda, H. Vulser, P. Bézivin-Frere, W. Lapidaire, H. Lemaître, J. Penttilä, P. J. Conrod, H. Garavan, M. L. P. Martinot, J. L. Martinot, The IMAGEN Consortium. Sleep habits, academic performance, and the adolescent brain structure. Science Reports 7, pg. 41678, 2017, https://doi.org/10.1038/srep41678 [↩] [↩]
- M. Patel, S. K. Patel, S. Suresh, K. Vishwakarma, S. Singh. Relationship between screen time and academic performance in adolescents. Caspian Journal of Pediatrics. Vol. 8, pg. 739-747, 2022, http://caspianjp.ir/article-1-198-en.html. [↩] [↩] [↩] [↩]
- S. Arora, M. A. Lawrence, R. M. Klein. The attention network test database: ADHD and cross-cultural applications. Frontiers in Psychology. Vol. 11, pg. 388, 2020, https://doi.org/10.3389/fpsyg.2020.00388. [↩] [↩] [↩] [↩] [↩]
- S. Hershner, Sleep and academic performance: measuring the impact of sleep. Current Opinion in Behavioral Sciences. Vol. 33, pg. 51-56, 2020, https://doi.org/10.1016/j.cobeha.2019.11.009. [↩]
- M. Greer. Strengthen your brain by resting it. Monitor on Psychology. Vol. 35, 2004, https://www.apa.org/monitor/julaug04/strengthen. [↩]
- G. Maheshwari, F. Shaukat. Impact of poor sleep quality on the academic performance of medical students. Cureus. 2019, https://doi.org/10.7759/cureus.4357 [↩] [↩]
- M. Suardiaz-Muro, M. Morante-Ruiz, M. Ortega-Moreno, M. A. Ruiz, P. Martín-Plasencia, A. Vela-Bueno. Sleep and academic performance in university students: a systematic review. Revista de Neurología. Vol. 71, pg. 43-53, 2020. https://doi.org/10.33588/rn.7102.2020015 [↩] [↩]
- R. E. Dahl. Adolescent brain development: a period of vulnerabilities and opportunities. Keynote address. Annals of the New York Academy of Sciences. Vol. 1021, pg. 1-22, 2004, https://doi.org/10.1196/annals.1308.001. [↩]
- L. A. Musshafen, R. S. Tyrone, A. Abdelaziz, C. E. Sims-Gomillia, L. S. Pongetti, F. Teng, L. M. Fletcher, J. C. Reneker. Associations between sleep and academic performance in US adolescents: a systematic review and meta-analysis. Sleep Medicine. Vol. 83, pg. 83:71-82, 2021, https://doi.org/10.1016/j.sleep.2021.04.015. [↩]
- M. Wang, Z. Chen, N. Han, H. Yao. Sleep duration and subject-specific academic performance among adolescents in China. npj Science of Learning. Vol. 10, pg. 71, 2025, https://doi.org/10.1038/s41539-025-00361-y. [↩]
- Average reaction time, by age and dominant hand. https://censusatschool.ca/data-results/2007-08/average-reaction-time/. 2007/2008. [↩]
- J. Giovannoli, D. Martella, M. Casagrande. Assessing the three attentional networks and vigilance in the adolescence stages. Brain Sciences. Vol. 11, pg. 503, 2021, https://doi.org/10.3390/brainsci11040503. [↩] [↩] [↩] [↩]
- M. S. Cahart, V. Giampietro, O. O’Daly. Atypical attentional network dynamics in adolescent depression during emotional movie viewing. Social Cognitive and Affective Neuroscience. Volume 20, nsaf011, 2025, https://doi.org/10.1093/scan/nsaf011. [↩] [↩] [↩] [↩]
- K. Singh, R. Mehra. Mobile phone handset radiation impact study on brainwave signal using EEG. International Journal for Scientific Research and Development. Vol. 3, pg. 295-298, 2015, https://api.semanticscholar.org/CorpusID:189807490. [↩] [↩] [↩]
- G. Gariepy, S. Danna, I. Gobiņa, M. Rasmussen, M. Gaspar de Matos, J. Tynjälä, I. Janssen, M. Kalman, A. Villeruša, D. Husarova, F. Brooks, F. J. Elgar, S. Klavina-Makrecka, K. Šmigelskas, T. Gaspar, C. Schnohr. How are adolescents sleeping? Adolescent sleep patterns and sociodemographic differences in 24 European and North American countries. Journal of Adolescent Health. Vol. 66, pg. S81-S88, 2020, https://doi.org/10.1016/j.jadohealth.2020.03.013. [↩]
- R. M. S. Santos, C.G. Sen Mendes, G. Y. Bressani, S. de Alcantara Ventura, Y. J. de Almeida Nogueira, D. M. de Miranda, M. A. Romano-Silva. The associations between screen time and mental health in adolescents: a systematic review. BMC Psychol. Vol. 11, pg. 127, 2023, https://doi.org/10.1186/s40359-023-01166-7. [↩] [↩]
- E. Boers, M. H. Afzali, N. Newton, P. Conrod. Association of screen time and depression in adolescence. JAMA Pediatr. Vol. 173, pg. 853-859, https://doi.org/10.1001/jamapediatrics.2019.1759 [↩] [↩]
- C. S. Herrmann, I. Fründ, D. Lenz. Human gamma-band activity: a review on cognitive and behavioral correlates and network models. Neuroscience & Biobehavioral Review. Vol. 34, pg. 981-992, 2010, https://doi.org/10.1016/j.neubiorev.2009.09.001. [↩]
- S. E. Lim, H. S. Kim, S. W. Lee, K. H. Bae, Y. H. Baek. Validation of Fitbit inspire 2TM against polysomnography in adults considering adaptation for use. Nat Sci Sleep. Vol. 15, pg. 59-67, 2023, https://doi.org/10.2147/NSS.S391802 [↩] [↩]
- F. B. Kayarian, A. Jannati, A. Rotenberg, E. Santarnecchi. Targeting gamma-related pathophysiology in Autism Spectrum Disorder using transcranial electrical stimulation: opportunities and challenges. Autism Research. Vol. 13, pg. 1051-1071, 2020, https://doi.org/10.1002/aur.2312. [↩]
- A. H. Meghdadi, M. Stevanović Karić, M. McConnell, G. Rupp, C. Richard, J. Hamilton, D. Salat, C. Berka. Resting state EEG biomarkers of cognitive decline associated with Alzheimer’s disease and mild cognitive impairment. PLoS One. Vol. 16, pg. e0244180, 2021, https://doi.org/10.1371/journal.pone.0244180. [↩]
- X. Zhang, D. Dimitriou, E. J. Halstead. Sleep, anxiety, and academic performance: a study of adolescents from public high schools in China. Frontiers in Psychology. Vol. 12, pg. 678839, 2021, https://doi.org/10.3389/fpsyg.2021.678839. [↩] [↩]
- P. Barraza, A. Pérez, E. Rodríguez. Brain-to-brain coupling in the gamma-band as a marker of shared intentionality. Frontiers in Human Neuroscience. Vol. 14, pg. 295, 2020, https://doi.org/10.3389/fnhum.2020.00295. [↩]
- J. F. Dewald, A. M. Meijer, F. J. Oort, G. A. Kerkhof, S. M. Bögels. The influence of sleep quality, sleep duration and sleepiness on school performance in children and adolescents: a meta-analytic review. Sleep Medicine Review. Vol. 14, pg. 179-189, 2010, https://doi.org/10.1016/j.smrv.2009.10.004. [↩] [↩]
- G. Curcio, M. Ferrara, L. De Gennaro. Sleep loss, learning capacity and academic performance. Sleep Medicine Reviews. Vol. 10, pg. 323-337, 2006, https://doi.org/10.1016/j.smrv.2005.11.001. [↩] [↩]
- L. Hale, S. Guan. Screen time and sleep among school-aged children and adolescents: a systematic literature review. Sleep Medicine Reviews. Vol. 21, pg. 50-58, 2014, https://doi.org/10.1016/j.smrv.2014.07.007. [↩]


