
Abstract
Developing a more efficient solar panel is essential to accelerate the deployment of solar photovoltaics. A way to maximize energy output is to reduce the amount of sunlight reflected off the solar panel via geometric anti-reflection coatings (ARCs). These microstructures prevent light from escaping the solar panel by redirecting light that is reflected off the surface inwards, allowing more light to pass through to the solar cell, enhancing light transmission and absorption. Utilizing the ray-tracing software, pvtrace, the microstructure shape and dimensions were optimized to maximize the amount of light that passes through to the solar cell. Numerous pyramids, cylinders, cones, and mounds of the material silicon dioxide (SiO2), a common ARC material, were simulated. For normal angles, the optimized pyramid texture has the greatest light transmission of 0.93. This geometric ARC would be most relevant for solar panels with dual-axis tracking that ensures sunlight approaches the panel at a normal angle, increasing light transmission by 0.71%. At non-normal incidence angles, different geometries were optimal, with no clear superior geometry. However, taking an average weighted by solar insolation and the daily solar cycle, which is relevant for fixed solar panels, the most optimal geometry is a mound structure with an average transmission of 0.90 and an increase in light transmission by 0.63%. This research identifies the optimal shape and dimensions to consider when developing geometric ARCs to maximize light transmission for fixed and dual-axis tracking solar panels, expanding solar power generation capabilities.
Keywords: Optimal, anti-reflective, geometry, panel, simulation
Introduction
Combating climate change and fossil fuel dependency will require the use of renewable energy sources, like solar power. There are many techniques to optimize the efficiency of solar cells to increase energy output; a prominent one is antireflection coatings (ARCs), which enhance the amount of light available for photovoltaic (PV) conversion, improving solar cell performance1. The ARCs raise the level of light absorption by minimizing the amount of light reflected. Particularly, this can be accomplished at the air/glass substrate interface2.
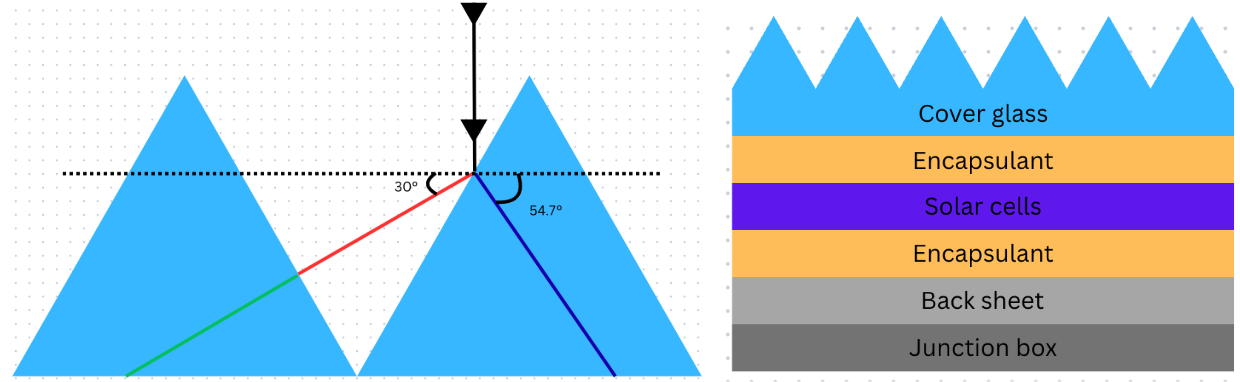
This research focuses specifically on geometric ARCs, which enhance performance by increasing the number of times light bounces off the solar panel’s internal layers and structures2. Increasing the number of bounces with an angled surface creates more opportunities for light to pass through (Figure 1). The main advantage of geometric ARCs is that they work for all wavelengths of light, preserving spectral independence, provided that the features of the textured geometric ARC are much larger than the wavelengths of interest2. Thus, while both microstructures and nanostructures have been proposed, microstructures are of interest to maintain the anti-reflective effect for light in the visible and infrared light range2‘3. We aim to discover the optimal shape and dimensions of these microstructures to maximize potential increases in light transmission.
Implementing geometric ARCs can be done at different layers within a solar panel. For example, light-trapping microstructures and nanostructures can be embedded within the absorber layer of solar cells. However, microstructures can be impractical at the absorber layer for thin-film solar cells, as micron-scale features, which typically range from 3 to 10 microns, would be difficult to incorporate on a thin substrate with much larger thicknesses ranging from several hundred nanometers up to a few microns4. In contrast, due to the thicker cover glass and encapsulant layers, either microstructures or nanostructures can be used here. Some research has been done on textured patterns placed on the cover glass of thin-film solar panels as well, marking significant increases in conversion efficiency and photocurrent, although the amount of research is minimal5. Countless materials, such as magnesium fluoride (MgF2), titanium dioxide (TiO2), zirconium dioxide (ZrO2), zinc oxide (ZnO), aluminum oxide (Al2O3), and polymethyl methacrylate (PMMA), paired with countless geometries like rods, pyramids, pillars, cones, and tips, have been tested for ARCs with placement surrounding the cover glass in prior research1‘6. Several of these materials have self-cleaning and other unique properties6. Embedding these structures in the cover glass of solar panels in outer space has also been studied7. Physical development and experimentation of the textured patterns were conducted previously, marking increases in photocurrent and power, but identifying the optimal shape and dimensions has not been extensively explored. Ray-tracing, which models the interactions between light rays and structures with simulations, can be utilized to measure the impact of implementing ARCs. The process of ray-tracing can prove to be advantageous since computing the full electromagnetic wave calculation could be expensive and time-consuming, whereas ray-tracing is much faster and still has practical relevance for micron-scale features. Namely, if the texturization period, or the gap between the individual structures of the geometric ARCs, is much longer than the wavelength of light being analyzed, ray-tracing methods are suitable to determine optical properties8. This study uses ray-tracing simulations to optimize the shape and dimensions of microstructures placed on the cover glass of the solar cell along the air/glass interface to maximize light absorption.
Methods
Processes
To simulate the movement of light rays, a ray-tracing method was employed. In ray-tracing, light rays are initialized at different locations above a designated surface at a specific angle, and their path traversals are modeled. For example, a singular light ray that hits a boundary between two mediums may be reflected or refracted through the object based on its wavelength and the refractive indices and geometries of the involved objects and mediums. Ray-tracing is a technique to model many of these rays at once to observe the overall transmission and reflection proportions of the designated surface.
There are specific parametric inputs required for a ray-tracing simulation: the number of light rays, the range of light wavelengths, the waveguide background absorption number (parasitic absorption), and the surface’s refractive index. An assumption that any light that is transmitted is absorbed by the solar cell was made as well, as we aimed to focus on maximizing light transmission through the cover glass rather than considering the internal absorbance of the solar cell.
The material of the geometric ARCs that was selected for this simulation was SiO , a common material for anti-reflective coatings in prior implementations and experiments. Advantages of SiO are speedy production methods, relatively low costs, and great precision9. Mainly, the cover glass itself is typically either completely SiO or a composite in which the majority compound is SiO, so integrating the geometric ARC textures into the cover glass would be simplified. Moreover, the results of the ray-tracing simulations for all geometries would apply to all types of solar cells, as no modifications were conducted to the solar cell itself.
Simulation
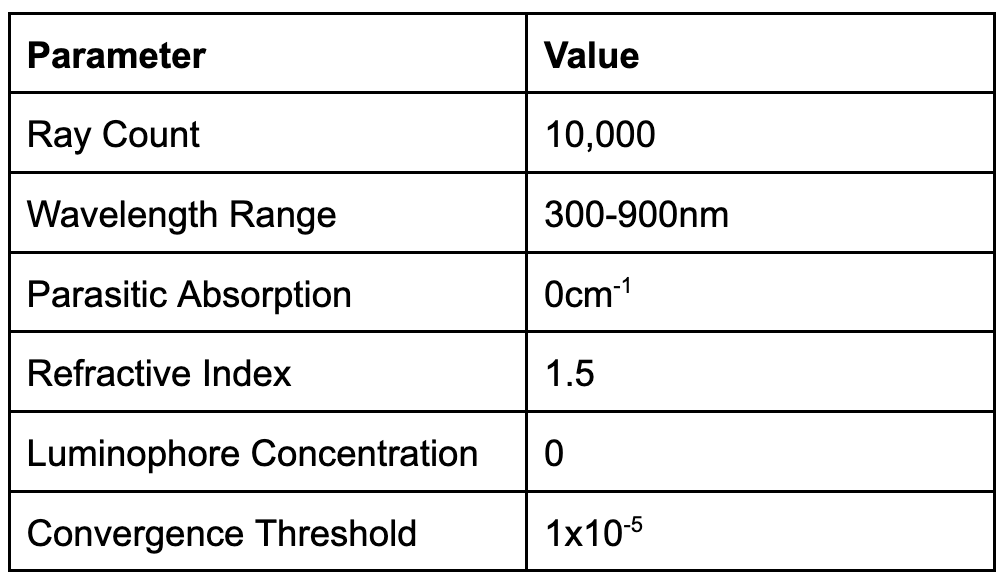
The simulation software used for the ray-tracing was pvtrace10‘11‘12. 10,000 light rays were simulated from a wavelength range of 300nm to 900nm. These wavelengths were chosen because they are between the start of the solar spectrum and the maximum wavelength at which a silicon solar cell would absorb light. The waveguide background absorption number, or the parasitic absorption, was set to 0, as at such small scales, it is negligible; SiO‘s absorption coefficient is minuscule, especially in the visible range, around 10-5cm-1 at a wavelength of 1 micron13. The refractive index was set to be 1.5, which is approximately equivalent to the true refractive index of SiO, ranging from 1.55 to 1.4 in its transparent range of 160nm to 3000nm13‘14‘15. Then, the luminophore concentration was set to 0 since no luminescent concentrators are present and SiO is refractive and non-fluorescent. These parameters are summarized below (Table 1).

A 10 10 grid of individual, identical geometric ARC structures were developed on a square base (Figure 2). The structures were packed together, meaning that adjacent cylinders, cones, and mounds touch each other at one point on the base, whereas adjacent pyramids share a side at the base. The base, which was kept the same size throughout the simulations, had dimensions of 1 unit x 1 unit x 0.05 units. Each texturization ARC pattern contained exactly 100 structures, as each structure’s width was set to 0.1 units, allowing a 10×10 grid to be created on the base. Only the ratios, relative lengths, and sizes are required to track ray movement; thus, values are presented as ‘units.’ In real applications, we envision the scale of the ARCs to be tens of microns. Also, the base, which appears in the following results as an aspect ratio (height divided by diameter or side length) of 0, served as a control group. The heights of the shapes were scaled and simulated until a clear, identifiable, optimal shape was discovered with a wide range of heights.
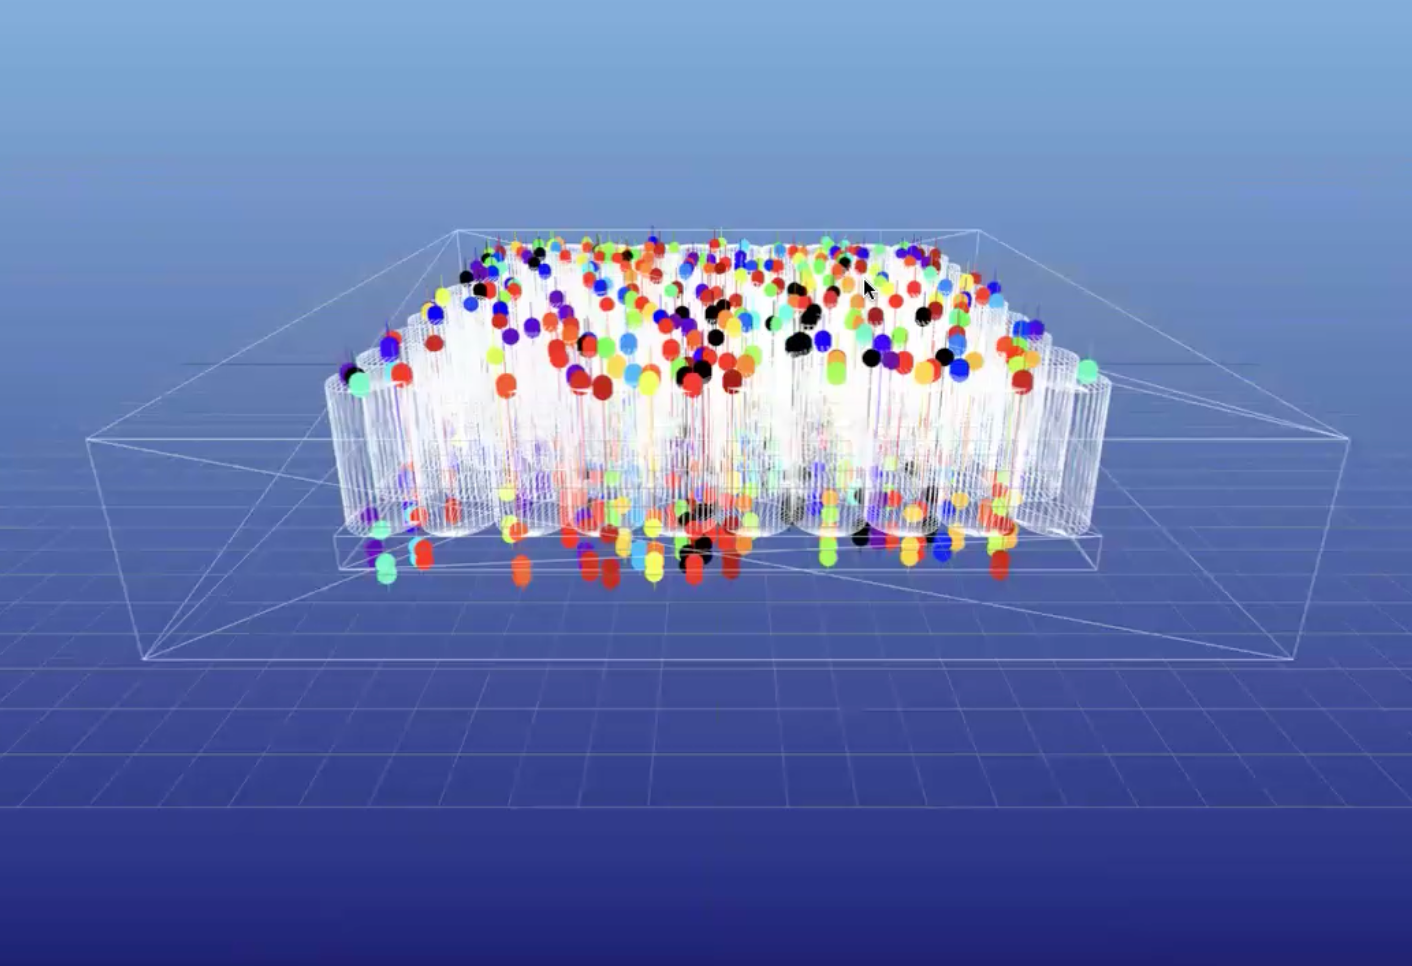
During the simulations, an enclosing box surrounding the entire structure (Figure 3) was included to allow simpler identification of the position of individual rays when exiting the structure. This also enabled the implementation of periodic boundary conditions, where rays that exited from the edge of the solar cell were passed on to another identical set of geometric ARCs until the ray exited from the top or bottom of the solar panel due to refraction, mimicking macro-scale solar panels. Implementing periodic boundary conditions is a potential case for future research. By selecting to maximize transmission, all the light emitted from the edges of the structure, which would typically be passed on to additional geometric ARCs, was assumed to be reflected off the solar panel. Because this worst-case scenario is held to be true, it is logical to maximize transmission rather than solely minimize top reflection, as minimizing top reflection would ignore the proportion of edge emission light that is reflected, resulting in an inadequate optimization.
Additionally, the transmission, defined as the proportion of rays that exit the structure from the bottom, was the main performance metric. For light rays with a non-zero angle of incidence, the simulation halted either once all 10,000 light rays are traced or once the simulation results converged. When the difference between the current transmission (which includes the current ray being simulated) and the transmission of all other simulated rays (meaning that adding a new ray does not change this transmission) was less than the convergence threshold of 1×10⁻⁵, the simulation converged and stopped running. This convergence process sped up simulation times. On a laptop with 8GB of RAM and an Apple M2 processing chip, some of the mound structures took roughly 30 minutes to simulate, compared to the other structures, which only took a few minutes, likely due to the many triangular surfaces needed to replicate the hemispherical geometry in a mesh file.
Results and Discussion

 for a simulation that converged slightly before 10,000 rays. The transmission, noted as optical efficiency, reaches a value between 0.6 and 0.8 (a). The simulation reaches the threshold of 1×10⁻⁵, converging shortly before tracing all 10,000 rays (b). There is a histogram of the frequency of initiated rays that fall into each wavelength interval, closely resembling visible light’s intensity properties as well (c). The example also shows the position of all light rays (d).
For each geometry and angle considered, the transmission properties and the simulation information were recorded (Figure 4). Next, we created plots of transmission versus aspect ratio for every geometry’s performance for each incident angle. The left-hand side of the plots contains the entire dataset, whereas the right-hand side contains a zoomed-in version of the graph in the optimal transmission region (Figure 5-8).


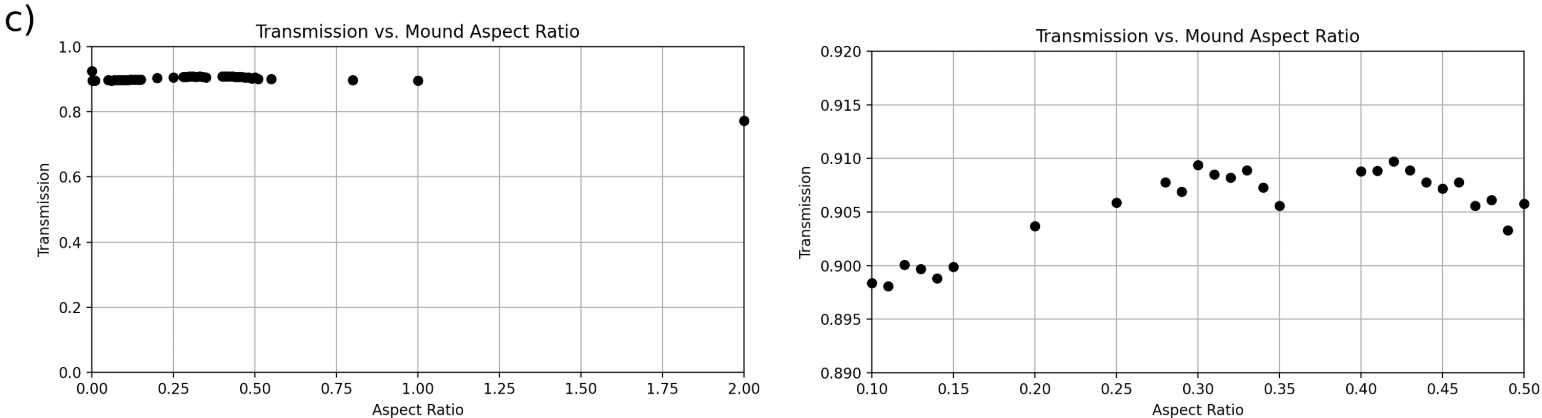
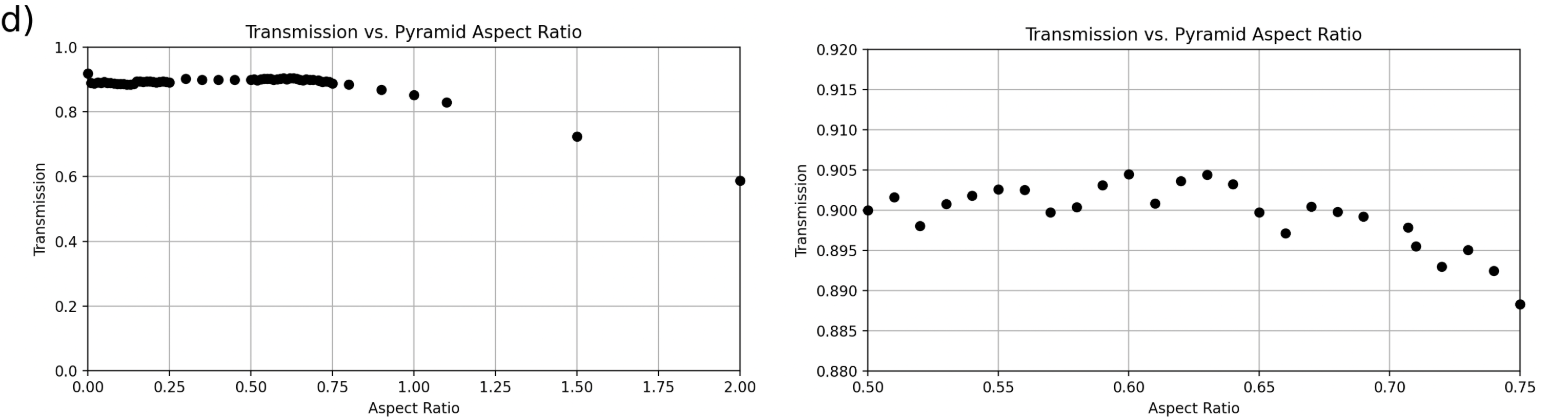
 ) for each geometry, with a zoom-in on the region containing the optimal transmission range. Over the broad range of aspect ratios, the four geometries tend to follow a similar trend. Once zoomed-in, it is observable that the most optimal cone (b) and pyramid textures (d) occur at aspect ratios that are near each other, unlike the mound geometry (c). The optimal range of mound geometries (c) has another local maximum that is very close to the optimal mound geometry’s transmission. On the other hand, the cylinder geometry (d) completely fails to outperform the control group.
For light rays normal to the surface, the best-performing geometry was a pyramid pattern with an aspect ratio of 0.52, producing a transmission of 0.9317 (Figure 5(d)). This is the highest transmission recorded throughout the experiment as well. The maximum transmissions of 0.9251 occurred at an aspect ratio of 0 in 2 of the plots, which demonstrated how a flat base serving as the control outperforms mound and cylinder geometries for incident angles of 0 (Figure 5(a), Figure 5(c)).


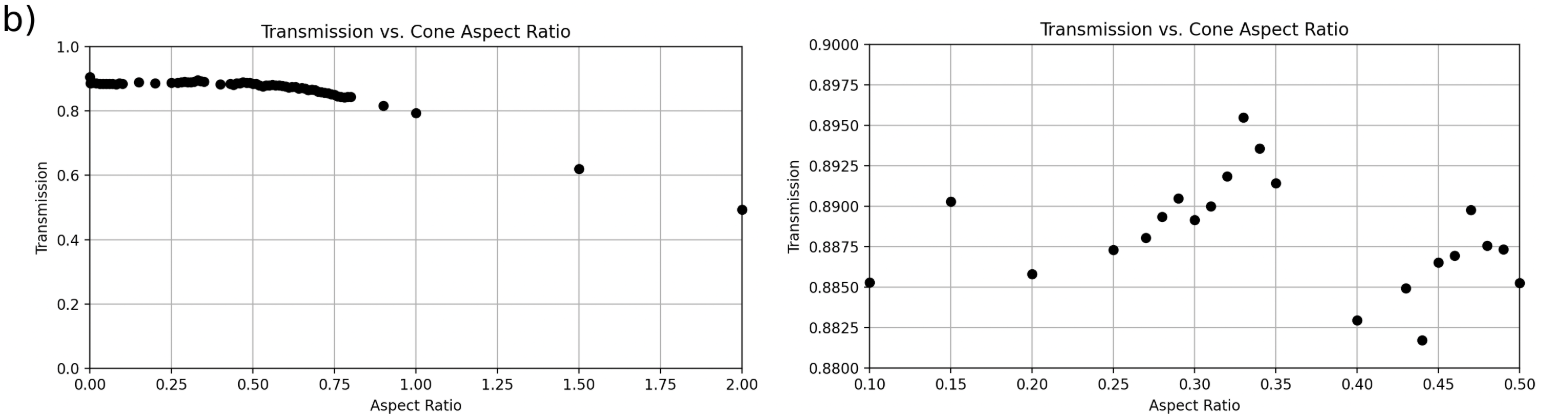
 for each geometry, with a zoom-in on the region containing the optimal transmission range. Although it appears that the cylinder geometry (a) follows a vastly different trend than the other geometries, this is not the case, as the cylinder geometries were tested up to an aspect ratio of 20, so the graph is distorted when compared to the other graphs. All graphs displaying the broader range of aspect ratios follow a similar trend, and all geometries fail to outperform the flat control texture. After zooming-in, the patterns become very different in the optimal range of aspect ratios
For an angle of incidence of 30, each of the four geometries was outperformed by the flat control group with an aspect ratio of 0, outputting a transmission of 0.9181 (Figure 6). The next best-performing geometry was the cone texture with an aspect ratio of 0.43, which produced a transmission of 0.9089 (Figure 6(b)).


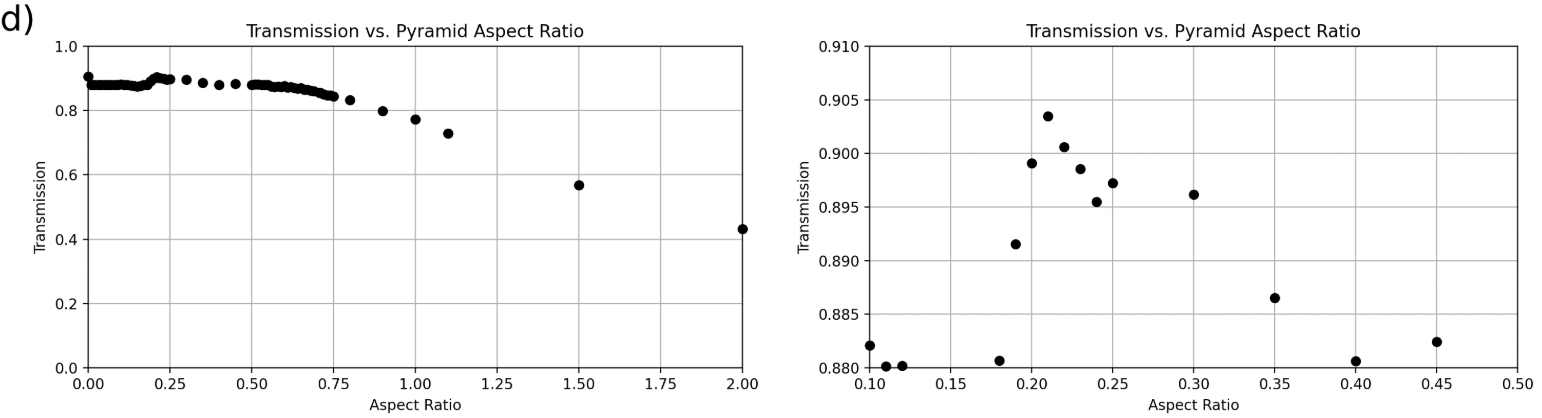 for each geometry, with a zoom-in on the region containing the optimal transmission range. All graphs displaying the broad range of aspect ratios follow identical trends, as the cylinder graph (a) looks different due to a differing x-axis scale. Additionally, all the geometries fail to enhance light transmission at this specific incident angle.
For an angle of incidence of 45, each of the four geometries was outperformed by the flat control group with an aspect ratio of 0, outputting a transmission of 0.9052 (Figure 7). The next best-performing geometry was the pyramid texture with an aspect ratio of 0.21, which produced a transmission of 0.9035 (Figure 7(d)).


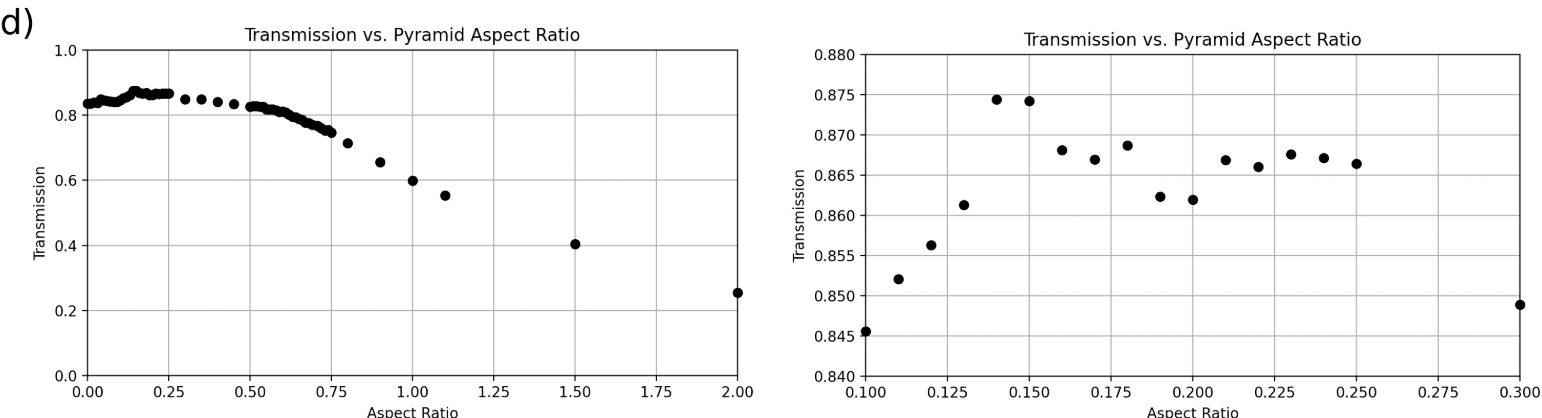 for each geometry, with a zoom-in on the region containing the optimal transmission range. Like the other figures that exhibit the simulation data for a particular incident angle, in the graphs displaying the broad range of aspect ratios, the trend in transmission is similar across all geometries. Notably, all geometries succeeded in enhancing light transmission at this incident angle, including the cylinder geometry, which did not do so for shallower angles of incidence.
For an angle of incidence of 60, the flat control group recorded an alarmingly low transmission of 0.8362 (Figure 8). Each of the four geometries had aspect ratios that exceeded the flat control group’s transmission (Figure 8). The best-performing geometry was a mound pattern with an aspect ratio of 0.29, outputting a transmission of 0.8768 (Figure 8(c))).
Discussion
Overall, the cylinders had the poorest-performing geometric ARC pattern, consistently failing to attain a transmission of 0.9 or higher across all but one incident angle. This may be since the cylinder texture has vertical sidewalls, promoting outward light reflection rather than internal light redirection. Notably, the cylinder texture’s transmission dramatically reduced as the height-to-diameter ratio increased for non-zero incident angles. For light normal to the surface, having an incidence angle of 0, the cylinder texture maintained a nearly constant transmission no matter the height. Once we consider parasitic absorption, we expect a greater drop-off in transmission with increasing cylinder height.
All structures performed worse at greater incident angles, which is in conformance with previous research that has found that an increase in angle of incidence corresponded to a reduction in transmittance16. Additionally, as the incident angle increased, the best-performing mound-shaped geometry experienced a lesser relative transmission decrease in comparison to the other geometries, such as cones and pyramids, which experienced a greater fall in transmission. This may be because of the steep surfaces of cones and pyramids that reflect light away at larger incident angles, contrasting with the smooth, gentle curvature of mounds. For moderate angles, geometries may perform worse because light escapes the geometry rather than getting trapped in the different shape’s crevasses and being absorbed. On the other hand, for more extreme angles like 60 degrees, this was not the case for the mound structures. While the exact cause is not known, their curvature may have played a significant role in light transmission. These results indicate that mound structures are the most resistant geometry to incident angle fluctuations.
As the incident angle increased, the most optimal cone geometry occurred at smaller aspect ratios, meaning the geometry had shallower slopes. Interestingly, the mound and pyramid geometries followed a similar pattern, although this trend was not as consistent as it is for cones. As the incident angle increased, the maximum light transmission occurred at smaller aspect ratios for all three geometries. However, this trend did not apply to the cylinder geometry, which did not have any discernible trend in aspect ratio in relation to incidence angle.
In summary, for normal incidence, the pyramid structure with a height-to-side ratio of 0.52 was the best-performing, producing a transmission of 0.93. This aligns with previous research, which identified the pyramid texturization to be the most optimal for nanostructures at a differing solar cell anatomical location17. This superior performance can be attributed to the geometry of sloped surfaces, which redirect light deeper into the ARC and solar panel, as previously demonstrated (Figure 1). For both 30 and 45, the flat control produced the greatest transmission of 0.92 and 0.91, respectively. Finally, for 60, the mound geometry with a height-to-diameter ratio of 0.29 produced the greatest transmission of 0.88.
To generalize results across different incident angles in order to find the true optimal geometry, we ran a calculation regarding the sun’s intensity at specific times and time spent at certain incident angles. We obtained the approximate solar insolation and angle of incidence at every hour of active solar time at a latitude of 32.28 and a longitude of 106.75 on November 14th18. Then, to perform a weighted average of transmission across incident angles, we assigned the angles’ weights equivalent to the solar insolation at that angle’s hour mark divided by the sum of the solar insolation values across the active solar times presented. Next, to predict a geometry’s transmission for the data’s given incident angles, we built a quartic regression model (y-axis – transmission, x-axis – incident angle) off the simulation data for each geometry. Finally, we calculated a weighted average transmission value by multiplying the weights by the predicted transmission at the given incident angle and summing these values up for a specific geometry.Discussion
Overall, the cylinders had the poorest-performing geometric ARC pattern, consistently failing to attain a transmission of 0.9 or higher across all but one incident angle. This may be since the cylinder texture has vertical sidewalls, promoting outward light reflection rather than internal light redirection. Notably, the cylinder texture’s transmission dramatically reduced as the height-to-diameter ratio increased for non-zero incident angles. For light normal to the surface, having an incidence angle of 0, the cylinder texture maintained a nearly constant transmission no matter the height. Once we consider parasitic absorption, we expect a greater drop-off in transmission with increasing cylinder height.
All structures performed worse at greater incident angles, which is in conformance with previous research that has found that an increase in angle of incidence corresponded to a reduction in transmittance16. Additionally, as the incident angle increased, the best-performing mound-shaped geometry experienced a lesser relative transmission decrease in comparison to the other geometries, such as cones and pyramids, which experienced a greater fall in transmission. This may be because of the steep surfaces of cones and pyramids that reflect light away at larger incident angles, contrasting with the smooth, gentle curvature of mounds. For moderate angles, geometries may perform worse because light escapes the geometry rather than getting trapped in the different shape’s crevasses and being absorbed. On the other hand, for more extreme angles like 60 degrees, this was not the case for the mound structures. While the exact cause is not known, their curvature may have played a significant role in light transmission. These results indicate that mound structures are the most resistant geometry to incident angle fluctuations.
As the incident angle increased, the most optimal cone geometry occurred at smaller aspect ratios, meaning the geometry had shallower slopes. Interestingly, the mound and pyramid geometries followed a similar pattern, although this trend was not as consistent as it is for cones. As the incident angle increased, the maximum light transmission occurred at smaller aspect ratios for all three geometries. However, this trend did not apply to the cylinder geometry, which did not have any discernible trend in aspect ratio in relation to incidence angle.
In summary, for normal incidence, the pyramid structure with a height-to-side ratio of 0.52 was the best-performing, producing a transmission of 0.93. This aligns with previous research, which identified the pyramid texturization to be the most optimal for nanostructures at a differing solar cell anatomical location17. This superior performance can be attributed to the geometry of sloped surfaces, which redirect light deeper into the ARC and solar panel, as previously demonstrated (Figure 1). For both 30 and 45, the flat control produced the greatest transmission of 0.92 and 0.91, respectively. Finally, for 60, the mound geometry with a height-to-diameter ratio of 0.29 produced the greatest transmission of 0.88.
To generalize results across different incident angles in order to find the true optimal geometry, we ran a calculation regarding the sun’s intensity at specific times and time spent at certain incident angles. We obtained the approximate solar insolation and angle of incidence at every hour of active solar time at a latitude of 32.28 and a longitude of 106.75 on November 14th18. Then, to perform a weighted average of transmission across incident angles, we assigned the angles’ weights equivalent to the solar insolation at that angle’s hour mark divided by the sum of the solar insolation values across the active solar times presented. Next, to predict a geometry’s transmission for the data’s given incident angles, we built a quartic regression model (y-axis – transmission, x-axis – incident angle) off the simulation data for each geometry. Finally, we calculated a weighted average transmission value by multiplying the weights by the predicted transmission at the given incident angle and summing these values up for a specific geometry.
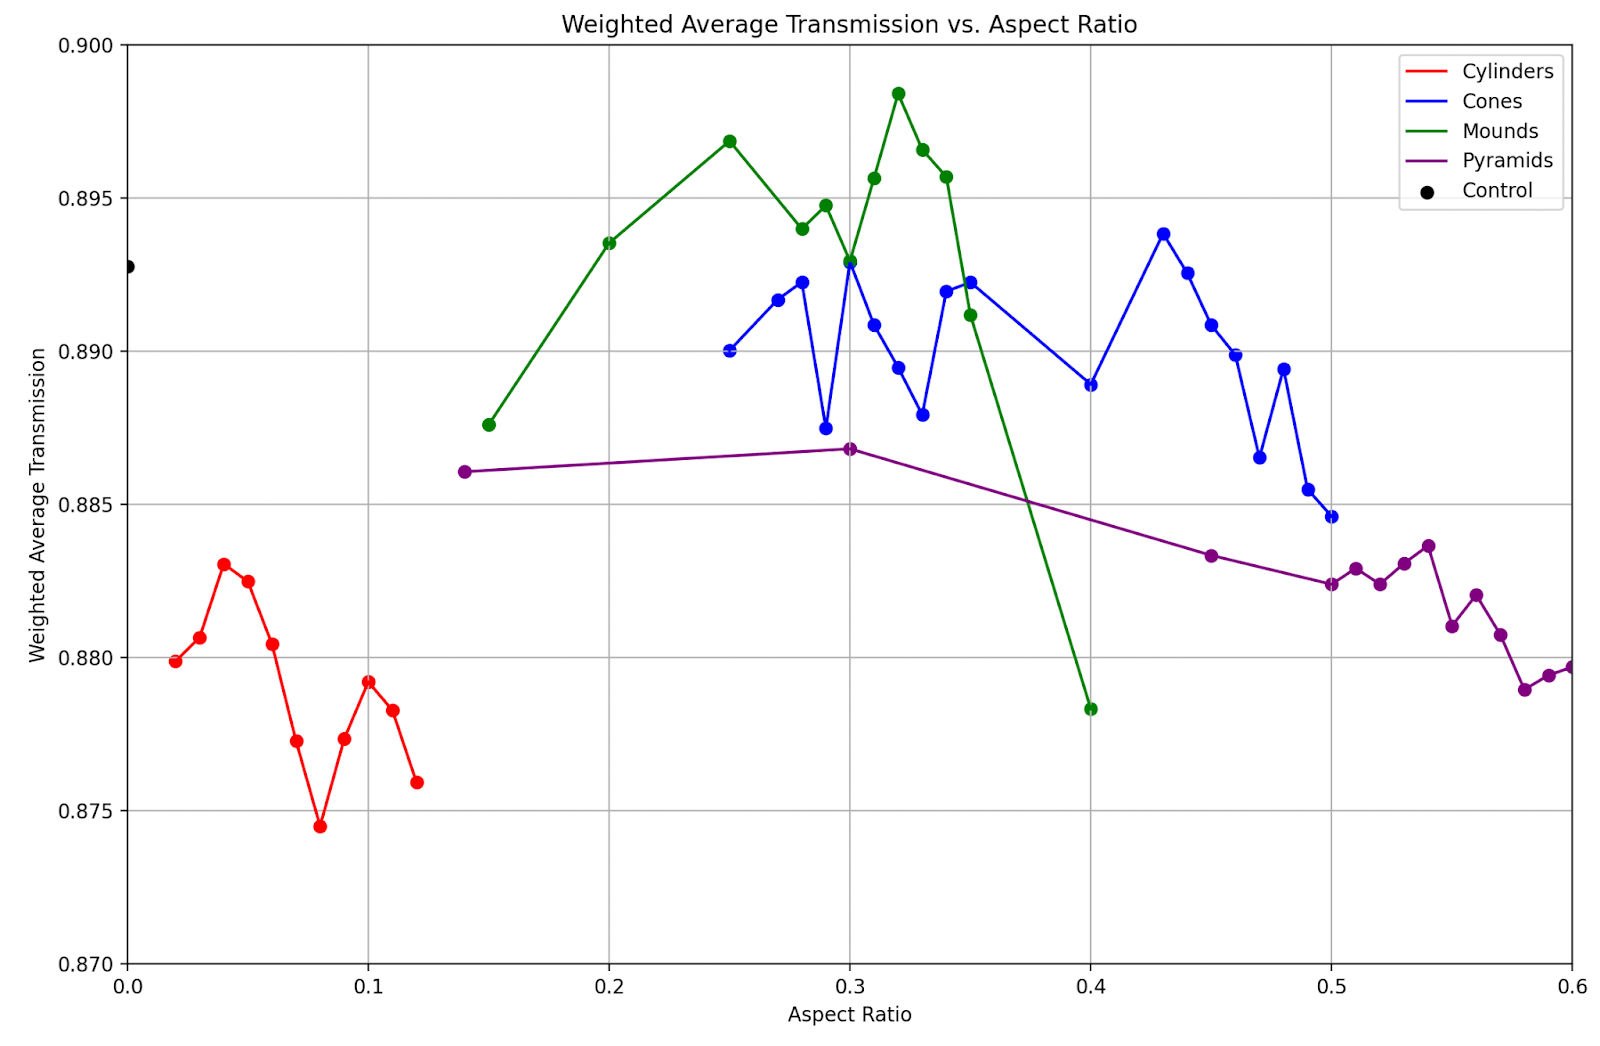
Considering varying solar insolation at differing incident angles, the most optimal geometry was a mound-shaped geometric ARC with a height-to-diameter ratio of 0.32, which produced a weighted average light transmission of 0.8984 (Figure 10). This performance can be attributed to its high light transmittance at large incident angles and its reasonable, albeit not the greatest, light transmittance at small incident angles. Both the cylinder and pyramid geometries failed to register a weighted average light transmission that outperforms the flat control group, which records a weighted average light transmission of 0.8928 (Figure 10). The reason for these results is still being researched.
It is important to note that for any individual shape, the transmission is accurate for any equivalent aspect ratio of differing dimensions, assuming no parasitic absorbance. When larger dimensions are used, parasitic absorption must be considered, and the transmission would decrease. This effect exacerbates the performance of larger height structures, meaning the solar cell would absorb even less than what the low transmission proportions shown by the simulations already indicate for larger aspect ratios. Thus, when implementing these geometric ARCs, it is ideal to fabricate the structures with the appropriate aspect ratios to the smallest possible scale to mitigate the impact of parasitic absorption.
Regarding the material, SiO has disadvantages that include difficulty in implementation on large-scale areas and the need for additional thermal treatments when utilizing sol-gel mechanisms for fabrication9. This can be avoided by utilizing another approach, such as some sort of imprint lithography, to improve scaling capabilities. During and after production, numerous processing methods can be utilized to enhance SiO’s light transmission and reduce its glare9. There are a multitude of potential manufacturing processes for these textures, including various types of sol-gel mechanisms and imprint lithographies9‘19.
Ultimately, this study highlights the value of optimizing geometric ARCs’ shape and dimensions to increase the light absorption of a solar cell by displaying results that solar panel manufacturers and researchers can utilize. Immediately, with these results, modifications to existing solar panels to match the shape and dimension that worked best across different incident light angles can be made to expand electricity generation capabilities based on the main takeaway that the optimized geometric ARC shape differs for varying angles of incidence. For solar panels with dual-axis tracking capabilities, the surface of the solar panel remains facing the sunlight, meaning light rays approach the solar panel at an incident angle of 0. The pyramid ARC texture with a height-to-side ratio of 0.52 would maximize light absorption for such solar panels, increasing light transmission by 0.71%. On the other hand, for fixed solar panels, the mound ARC texture with an aspect ratio of 0.32 would be best suited to maximizing light absorption, increasing light transmission by roughly 0.63%.
Avenues for further research include algorithmically optimizing shapes’ dimensions to determine the most efficient geometric ARC. Furthermore, more shapes and patterns are needed, including texturizing more layers and texturizing the glass underside. For example, adding more structures within the gaps between the shapes could be a potential pattern to examine. Random texturizations must be considered too. Also, embedding ARC textures along the encapsulant ethylene-vinyl acetate (EVA) layer on top of the solar cell is an option, and implementing printing methods with a polymer substance would be straightforward. Using more oval-like shapes should be tested as well, as the base of the mound patterns in this simulation was not modified, remaining circular. Another idea is to modify the curvature of the mound shape itself. Increasing the gaps between the structures could be explored, though it is not recommended, as previous studies have found that increasing the texturization period reduces the anti-reflection effect20. Alternative materials to SiO should be studied as well, especially those that have self-cleaning properties to combat surface contamination, which could also be accounted for in future simulations6. Moreover, unmodeled factors such as polarization effects may impact the applicability of the
results; they should be studied as well. Finally, modifying the ways in which the light rays approach the structures to more accurately resemble the changing direction of sunlight throughout the day with a more elaborate optimization process would improve the simulation’s practicality and applicability.
In general, reducing losses due to light reflection would increase power output, making monumental progress in helping abate fossil fuel dependency and strengthening the environment. Furthermore, as the globe struggles to transition to renewable energy sources, constructing a more optimal solar panel would draw the public and corporations to adopt solar power, diverting focus from nonrenewable energy sources.
Code and Data Availability
Here is the link to the GitHub repository used for the simulations, along with the data: https://github.com/aj24by7/pvtrace-aj
Acknowledgements
Ramesh Munamarty offered numerous revisions and much formatting advice. He provided his expertise through the research process.
- N. Shanmugam, R. Pugazhendhi, R. Madurai Elavarasan, P. Kasiviswanathan, and N. Das, “Anti-Reflective Coating Materials: A Holistic Review from PV Perspective,” Energies, vol. 13, no. 10, p. 2631, May 2020, doi: 10.3390/en13102631. [↩] [↩]
- J. Escarré et al., “Geometric light trapping for high efficiency thin film silicon solar cells,” Sol. Energy Mater. Sol. Cells, vol. 98, pp. 185-190, Mar. 2012, doi: 10.1016/j.solmat.2011.10.031. [↩] [↩] [↩] [↩]
- C. Ji et al., “Recent Applications of Antireflection Coatings in Solar Cells,” Photonics, vol. 9, no. 12, p. 906, Nov. 2022, doi: 10.3390/photonics9120906. [↩]
- A. Peter Amalathas and M. Alkaisi, “Nanostructures for Light Trapping in Thin Film Solar Cells,” Micromachines, vol. 10, no. 9, p. 619, Sep. 2019, doi: 10.3390/mi10090619. [↩]
- S. Bong et al., “Effective Light Trapping in Thin Film Silicon Solar Cells with Nano- and Microscale Structures on Glass Substrate.,” J. Nanosci. Nanotechnol., vol. 16, no. 5, pp. 4978-4983, May 2016, doi: 10.1166/jnn.2016.12179. [↩]
- A. M. Law, L. O. Jones, and J. M. Walls, “The performance and durability of Anti-reflection coatings for solar module cover glass – a review,” Sol. Energy, vol. 261, pp. 85-95, Sep. 2023, doi: 10.1016/j.solener.2023.06.009. [↩] [↩] [↩]
- B. G. Priyadarshini and A. K. Sharma, “Design of multi-layer anti-reflection coating for terrestrial solar panel glass,” Bull. Mater. Sci., vol. 39, no. 3, pp. 683-689, Jun. 2016, doi: 10.1007/s12034-016-1195-x. [↩]
- A. Deinega, I. Valuev, B. Potapkin, and Y. Lozovik, “Minimizing light reflection from dielectric textured surfaces,” J. Opt. Soc. Am. A, vol. 28, no. 5, p. 770, May 2011, doi: 10.1364/JOSAA.28.000770. [↩]
- Z. Han, Z. Jiao, S. Niu, and L. Ren, “Ascendant bioinspired antireflective materials: Opportunities and challenges coexist,” Prog. Mater. Sci., vol. 103, pp. 1–68, Jun. 2019, doi: 10.1016/j.pmatsci.2019.01.004. [↩] [↩] [↩] [↩]
- danieljfarrell, “pvtrace/pvtrace at master – danieljfarrell/pvtrace,” GitHub. Accessed: Jul. 11, 2025. [Online]. Available: https://github.com/danieljfarrell/pvtrace/tree/master/pvtrace [↩]
- S. Verma, shomikverma/pvtrace-sv. (Jan. 30, 2025). Python. Accessed: Jul. 11, 2025. [Online]. Available: https://github.com/shomikverma/pvtrace-sv [↩]
- S. Verma, D. J. Farrell, and R. C. Evans, “Ray-Trace Modeling to Characterize Efficiency of Unconventional Luminescent Solar Concentrator Geometries,” ACS Appl. Opt. Mater., vol. 1, no. 5, pp. 1012-1025, May 2023, doi: 10.1021/acsaom.3c00074. [↩]
- “Fused Silica SiO2 Optical Material | Crystran.” Accessed: Jul. 11, 2025. [Online]. Available: https://www.crystran.com/optical-materials/fused-silica-sio2 [↩] [↩]
- W. D. Putri and G. W.P. Adhyaksa, “Nano Pyramid Anti-reflective Coating Design for Improved Thin-Silicon Photovoltaics,” in Proceedings of the International Conference on Sustainable Engineering, Infrastructure and Development, ICO-SEID 2022, 23-24 November 2022, Jakarta, Indonesia, Jakarta, Indonesia: EAI, 2023. doi: 10.4108/eai.23-11-2022.2339154. [↩]
- I. H. Malitson, “Interspecimen Comparison of the Refractive Index of Fused Silica*,
 ,” JOSA Vol 55 Issue 10 Pp 1205-1209, Oct. 1965, doi: 10.1364/JOSA.55.001205. [↩]
 - A. A. Fashina, M. G. Zebaze Kana, and W. O. Soboyejo, “Optical reflectance of alkali-textured silicon wafers with pyramidal facets: 2D analytical model,” J. Mater. Res., vol. 30, no. 7, pp. 904–913, Apr. 2015, doi: 10.1557/jmr.2015.70. [↩] [↩]
- Y. Li, M.-Y. Lee, H.-W. Cheng, and Z.-L. Lu, “3D simulation of morphological effect on reflectance of Si3N4 sub-wavelength structures for silicon solar cells,” Nanoscale Res. Lett., vol. 7, no. 1, p. 196, Dec. 2012, doi: 10.1186/1556-276X-7-196. [↩] [↩]
- “Solar Time, Angles, and Irradiance Calculator – User Manual | New Mexico State University – BE BOLD. Shape the Future.” Accessed: Jul. 10, 2025. [Online]. Available: https://pubs.nmsu.edu/_circulars/CR674/index.html [↩] [↩]
- M. Modaresialam, Z. Chehadi, T. Bottein, M. Abbarchi, and D. Grosso, “Nanoimprint Lithography Processing of Inorganic-Based Materials,” Chem. Mater., vol. 33, no. 14, pp. 5464–5482, Jul. 2021, doi: 10.1021/acs.chemmater.1c00693. [↩]
- Y. F. Makableh, M. Al-Fandi, M. Khasawneh, and C. J. Tavares, “Comprehensive design analysis of ZnO anti-reflection nanostructures for Si solar cells,” Superlattices Microstruct., vol. 124, pp. 1–9, Dec. 2018, doi: 10.1016/j.spmi.2018.10.003. [↩]


