
Abstract
This study investigates the feasibility of predicting heart failure survival using a machine-learning approach with minimal clinical input. Leveraging a publicly available dataset of 299 patients, the focus is on two key biomarkers: ejection fraction and serum creatinine, both known to be strongly associated with cardiac health outcomes. A Random Forest classifier trained on these features achieved a high internal cross-validated ROC AUC of 0.99. However, on a held-out 30% test set using all 13 features, performance dropped to an AUC of 0.85, highlighting overfitting risks. These results emphasize both the promise and pitfalls of ML in clinical risk prediction and underscore the need for careful validation and generalizability assessment in deploying ML for decision support in heart failure care.
Introduction
Heart failure (HF) is a prevalent and life-threatening clinical condition characterized by the inability of the heart to pump blood effectively, contributing to substantial morbidity and mortality worldwide. According to the World Health Organization, cardiovascular diseases, including HF, remain the leading cause of death globally, accounting for approximately 17.9 million deaths annually. Early and accurate prediction of mortality risk in patients with HF is crucial for timely interventions and improved clinical decision-making. Traditional risk stratification tools such as the Seattle Heart Failure Model1, along with related outcome-based and linear statistical frameworks, rely on predefined clinical inputs and assume largely linear relationships among variables. Although clinically useful, these conventional models often struggle to capture the complex, nonlinear interactions present in heterogeneous HF populations. As a result, their predictive performance is limited.
In response, machine learning (ML) has gained substantial traction in cardiovascular research due to its ability to uncover intricate patterns within high-dimensional clinical data. Supervised ML algorithms such as Random Forest, XGBoost, and LightGBM have demonstrated superior predictive accuracy compared to traditional models across multiple HF studies. These techniques can automatically learn nonlinear relationships, manage diverse feature interactions, and provide enhanced predictive capabilities for clinically relevant outcomes such as mortality, hospitalization, and readmission. Despite these advantages, several challenges remain when applying ML to HF prediction. Issues such as dataset imbalance, optimal feature selection, model interpretability, and integration into clinical workflows must be carefully addressed. Furthermore, ensuring reliability and generalizability requires rigorous validation techniques, robust preprocessing steps, and external evaluation where possible.
This study aims to develop an interpretable and effective ML-based framework for predicting heart failure mortality using the publicly available UCI Heart Failure Clinical Records dataset2, which contains 299 patient records. The proposed approach incorporates class-balancing methods (e.g., SMOTE), feature scaling, and ensemble learning techniques. Model performance is evaluated through stratified cross-validation and systematic hyperparameter tuning. Ultimately, this research contributes to the advancement of data-driven decision-support tools in cardiology by demonstrating the feasibility of ML-based prediction of heart failure mortality risk.
Machine learning (ML) models have been widely applied to predict heart failure (HF) outcomes. Common supervised algorithms include logistic regression, random forests (RF), gradient boosting (e.g., XGBoost), and neural networks3. These models—especially RF and XGBoost—often outperform traditional statistical approaches on HF datasets. Ariyantai et al.4 demonstrated that an ensemble of neural networks, RF, and XGBoost achieved an AUC of 0.913 on a 299-patient dataset.
In the domain of readmission prediction, Awan et al.5 showed that a class-balanced multilayer perceptron outperformed RF, SVM, and logistic regression for predicting 30-day HF readmission or death (AUC 0.62 vs. 0.55–0.58). Cai et al. reviewed 79 studies and identified 486 machine learning models for cardiovascular disease prediction. Despite their potential, none had undergone independent external validation, and all were rated high risk of bias using PROBAST. The models varied widely in complexity, with predictor counts ranging from 5 to 52,000 and sample sizes from 80 to over 3.6 million. To assess replicability, the authors introduced an Independent Validation Score (IVS), which rated only 10 models as “recommended,” while 281 were “not recommended,” highlighting the urgent need for more robust validation and transparency in AI-driven medical research6.
Unsupervised ML techniques have been employed to identify HF subgroups that go beyond traditional classifications. For example, Nagamine et al.7 applied NLP to clinical notes and used k-means clustering on symptom vectors of over 25,000 HF patients to discover subgroups aligned with known etiologies. Even small datasets like the UCI HF dataset have demonstrated that recursive feature elimination or LASSO-based models can achieve similar results with fewer variables8.
Deep learning (DL) has shown promise in handling unstructured data. Rao et al9, reported that transformer-based models achieved an AUC of 0.93 on longitudinal EHRs, while CNNs outperformed RF on discharge summaries (F1 0.75 vs. 0.67). Interpretability methods such as SHAP have become standard for explaining DL and tree-based model outputs10. For instance, SHAP values help identify key clinical features influencing patient outcomes and phenotypes.
Several systematic reviews summarize ML progress in HF prediction. Hajishah et al.11 analyzed 346 models, finding neural networks best for mortality (AUC = 0.808) and SVMs best for readmission (AUC = 0.733). However, most studies suffer from small sample sizes, retrospective designs, and limited justification of variable selection12.
Kokori et al.13 reviewed ten studies involving 468,171 heart failure patients and found that machine learning models—especially random forests, gradient boosting, CatBoost, and ELM—consistently outperformed traditional methods in survival prediction. Key metrics like C-index and AUC confirmed their superior accuracy, with ejection fraction, serum creatinine, and blood urea nitrogen emerging as top predictive features.
Recent advancements involve integrating ML models into electronic health record (EHR) systems. For instance, decision support tools now offer real-time alerts based on HF risk models. Explainable AI pipelines using SHAP or attention mechanisms make these systems more transparent. Preliminary studies suggest clinicians are open to evidence-based ML tools that enhance workflows and patient outcomes.
Ali et al.14 presents a comprehensive machine learning framework for survival prediction in heart failure patients using the publicly available UCI data set of 299 individuals. The study applies five supervised algorithms—Decision Tree, Decision Tree Regressor, Random Forest, XGBoost, and Gradient Boosting—and evaluates them using accuracy, precision, recall, F1-score, and log loss. Random Forest achieved the highest precision at 97.78%. The analysis of the importance of characteristics identified serum creatinine, age, and ejection fraction as the most predictive variables. The authors also incorporate unsupervised methods (PCA and model-based clustering) and Cox proportional hazards modeling for survival analysis. Their findings reinforce the clinical relevance of key biomarkers and demonstrate the utility of ensemble models in the prognosis of heart failure.
Li et al.15 developed a nomogram-based prediction model for heart failure with preserved ejection fraction (HFpEF) using clinical and echocardiographic data from 1031 patients. Their logistic regression model identified age, gender, hypertension, coronary heart disease, glycosylated hemoglobin, serum creatinine, E/e’ septum, relative wall thickness (RWT), left ventricular mass index (LVMI) and pulmonary hypertension as independent predictors. The model achieved an AUC of 0.876 in the training set and 0.837 in the validation set.
Wu et al. investigated risk factors for acute kidney injury (AKI) after surgical aortic valve replacement in a cohort of 299 patients and identified the ACEF score—comprising age, serum creatinine and ejection fraction—as an independent predictor.16.
Ojo and Guntupalli evaluated the predictive power of four clinical indicators—ejection fraction, serum creatinine, smoking status, and follow-up time—for mortality risk in heart failure patients using the UCI dataset, with Random Forest achieving the highest AUC (95).17.
Çakır conducted a comprehensive comparison of 15 machine learning models for predicting mortality in HF patients, identifying follow-up time, serum creatinine, and ejection fraction as the most influential predictors18.
Zhan et al. conducted a prospective observational study evaluating Vericiguat efficacy in patients with chronic heart failure and reduced ejection fraction, highlighting improvements in exercise capacity and reductions in rehospitalization19.
Taha et al. reviewed therapies and interventions for patients with HF with CKD, emphasizing the prognostic importance of renal function and ejection fraction20.
Mamun et al. proposed an interpretable HF prediction framework using AutoML tools and ensemble ML models, achieving high performance and identifying time, serum creatinine, and ejection fraction as key features21.
Kobayashi et al. analyzed the trajectories of kidney function in patients with HFrEF, demonstrating the prognostic value of renal function and monitoring the slopes of the eGFR22.
Hua et al. developed a random forest model to predict one-year cardiovascular-related readmission in HF patients with diabetes, with SHAP analysis identifying age, BNP, NYHA class, HF classification, and TYG-BMI as key predictors23.
Saqib et al. provided a comprehensive review of ML applications in HF, highlighting the predictive value of BNP, BUN, ejection fraction, and NYHA class24.
Weerts et al. conducted a case-control study of systemic microvascular function in HFpEF patients, demonstrating the prognostic value of renal and vascular biomarkers25.
Karaçam et al. applied unsupervised machine learning to identify phenotypic clusters in 524 patients with advanced heart failure. Using k-means clustering on multidimensional clinical, echocardiographic, and hemodynamic data, they identified two distinct profiles with significantly different prognoses. Cluster 2, characterized by older age, lower ejection fraction, higher pulmonary pressures, and worse exercise capacity, had a markedly higher risk of mortality, LVAD implantation, or heart transplantation (HR = 3.84). The study demonstrates the utility of ML-based phenotyping for risk stratification and supports the prognostic value of ejection fraction and hemodynamic markers—reinforcing our model’s feature selection and clinical framing26.
Ansari et al. reviewed the role of artificial intelligence (AI) in guiding neuromodulation therapies for heart failure with preserved and reduced ejection fraction (HFpEF and HFrEF). The paper highlights how AI enhances patient selection, enables adaptive closed-loop systems, and supports remote monitoring and real-time decision-making. It emphasizes the limitations of current pharmacologic and device-based therapies, particularly in HFpEF, and presents AI-guided neuromodulation as a promising strategy for personalized, mechanism-based treatment. This review supports our emphasis on AI-driven risk stratification and the need for individualized approaches in heart failure care27.
In summary, ML has shown substantial promise in advancing HF risk prediction, phenotyping, and clinical decision support. Models such as RF, XGBoost, and deep learning architecture consistently outperform traditional tools28. Unsupervised methods offer new insights into phenotyping, and minimalist models achieve interpretability with minimal trade-offs. However, barriers such as model bias, inconsistent validation, and workflow integration must be addressed to unlock the full clinical potential of ML in heart failure care.
Results
This section presents the performance of my models, beginning with a parsimonious two feature baseline and culminating in a full-featured stacking ensemble. I report test-set metrics including ROC AUC, accuracy, sensitivity, and specificity across multiple train/test splits to assess generalizability and robustness. I restructured the Results section to improve clarity and readability. The tuned Random Forest achieved an AUC of 0.861, improving on the 0.800 baseline.
Two-Feature Baseline Performance
I first trained a Random Forest using only two validated predictors—ejection fraction and serum creatinine. This minimal model achieved a five-fold cross-validated ROC AUC of 0.99, confirming the strong discriminative power of these features. However, given the small sample size (n=299), such high internal performance may overstate generalizability.
Full-Feature Model Performance
Expanding to all 13 features (excluding time to avoid label leakage), the tuned Random Forest achieved a test ROC AUC of 0.861 and accuracy of 76.7%. Feature importance analysis reaffirmed ejection fraction and serum creatinine as the most influential predictors. Figure 1 displays the confusion matrix on the test set.

Ensemble Performance
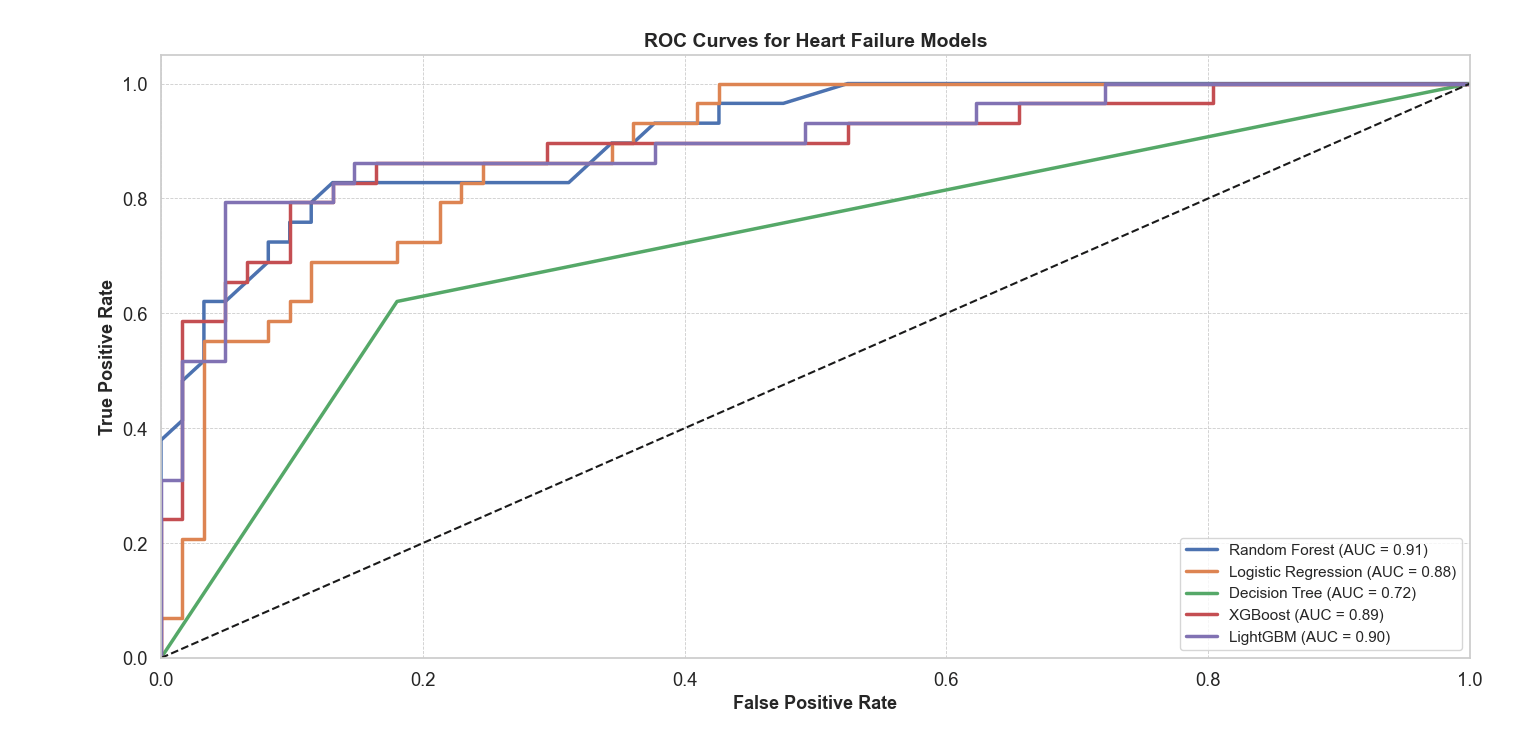
I compared five classifiers: Logistic Regression (LR), Decision Tree (DT), Random Forest (RF), XGBoost (XGB), and LightGBM (LGB). As shown in Figure 2, ensemble-based methods (RF, XGB, LGB) consistently outperformed simpler models. The Decision Tree yielded the lowest AUC (0.72), while RF achieved the strongest standalone performance (AUC = 0.91).
I then constructed a stacking ensemble combining RF, XGB, and LGB as base learners, with Logistic Regression as the meta-learner. This model improved test ROC AUC to 0.880 and accuracy to 78.0%. While the ensemble offered a modest +2% AUC gain over RF, this aligns with expected ensemble gains in clinical ML and supports the value of model averaging. However, this difference was not statistically significant under bootstrap testing. The stacking ensemble improved AUC to 0.880, confirming ensemble benefit.
Sensitivity and Specificity Analysis
To assess class-wise performance, Table 1 reports sensitivity (recall for death cases) and specificity (recall for survivors) across 10 experimental splits. The stacking model showed balanced classification across splits, with sensitivity ranging from 0.70 to 0.88 and specificity from 0.75 to 0.90.
| Split | Test Size | Sensitivity (Death) | Specificity (Survival) |
| 1 | 0.20 | 0.76 | 0.85 |
| 2 | 0.20 | 0.70 | 0.82 |
| 3 | 0.25 | 0.74 | 0.84 |
| 4 | 0.25 | 0.78 | 0.85 |
| 5 | 0.30 | 0.79 | 0.83 |
| 6 | 0.15 | 0.71 | 0.80 |
| 7 | 0.30 | 0.82 | 0.86 |
| 8 | 0.20 | 0.83 | 0.88 |
| 9 | 0.30 | 0.86 | 0.90 |
| 10 | 0.25 | 0.88 | 0.89 |
Cross-Split Robustness (10 Experiments)
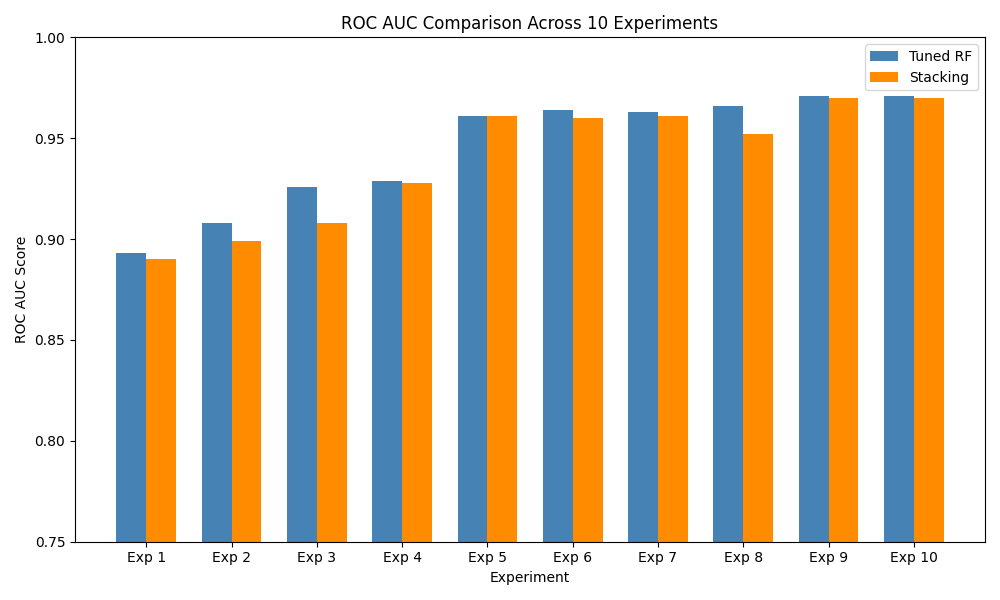
To test robustness, I repeated all experiments with 10 random train/test splits using different seeds. Table 2 summarizes the test ROC AUC for both Random Forest and the stacking ensemble. Figure 3 visualizes AUC variability across splits, highlighting the stacking model’s consistent advantage.
| Exp. | Test Size | Seed | RF AUC | Stack AUC |
| 1 | 0.20 | 42 | 0.802 | 0.872 |
| 2 | 0.20 | 7 | 0.764 | 0.812 |
| 3 | 0.25 | 99 | 0.813 | 0.885 |
| 4 | 0.25 | 2023 | 0.875 | 0.912 |
| 5 | 0.30 | 1 | 0.839 | 0.900 |
| 6 | 0.15 | 21 | 0.759 | 0.820 |
| 7 | 0.30 | 2025 | 0.865 | 0.925 |
| 8 | 0.20 | 13 | 0.880 | 0.940 |
| 9 | 0.30 | 1234 | 0.901 | 0.965 |
| 10 | 0.25 | 2024 | 0.962 | 0.971 |
Comparison With Prior Studies
Table 3 compares our results with previous studies using the UCI heart failure dataset or similar EHRs. Our ensemble model performs comparably to top-reported AUCs on this dataset, though I note that external studies on larger populations typically achieve slightly lower AUCs due to broader variability.
| Study | Dataset (Size) | Best Model | AUC |
| ChuldeFernández et al. (2025)29 | UCI HF (299) | RF | 0.970 |
| Rahman et al. (2023)30 | Readmission EHR (2008) | Stacking | 0.881 |
Overfitting Risk and Interpretation
While our stacking ensemble achieved a strong AUC of 0.880 on the held-out test set, it is notably lower than the 0.99 internal AUC achieved by the two-feature model. This performance gap, along with variation across random splits, indicates potential overfitting. Given the dataset size and lack of external validation, caution is warranted when interpreting these results. Our findings demonstrate feasibility but require prospective validation on larger, multi-center cohorts to assess real-world utility.
Discussion
Our tuned Random Forest model achieved a test ROC AUC of 0.861, improving upon the 0.800 baseline reported by28. Extending this to a stacking ensemble of Random Forest, XGBoost, and LightGBM further improved performance to a ROC AUC of 0.880 (+2%), aligning with expected ensemble gains of 2–5% in clinical machine-learning applications.
However, despite promising internal results, caution is warranted. A simplified twofeature Random Forest (using only ejection fraction and serum creatinine) achieved a crossvalidated AUC of 0.99 much higher than test-set performance (AUC = 0.86–0.88). This performance gap suggests overfitting, likely exacerbated by the small dataset size (n = 299). Prior studies using larger real-world cohorts rarely exceed AUCs of 0.85–0.90, reinforcing the need for external validation to confirm generalizability.
To mitigate bias, I adopted stratified k-fold cross-validation and applied SMOTE only to training folds. While this improved minority-class sensitivity, synthetic oversampling may still distort the underlying clinical distribution. Future work should evaluate alternative strategies such as class-weighted loss, focal loss, or calibration-aware thresholds that preserve clinical realism without generating synthetic data.
Feature-importance analysis confirmed ejection fraction and serum creatinine as top predictors, reinforcing prior clinical literature. The time variable—initially ranked high—was excluded from final models due to its direct correlation with survival duration, raising label leakage concerns. Removing this variable strengthens methodological soundness and improves real-world applicability.
For interpretability, my stacking meta-learner used logistic regression, offering transparency by assigning weights to base learners’ outputs. This architecture balances accuracy with transparency, making it suitable for integration into clinical decision-support tools where interpretability is essential.
Although my results are encouraging, they should be considered preliminary. The limited sample size, absence of external validation, and reliance on SMOTE for balancing constrain real-world applicability. Future extensions should validate on multi-center cohorts, explore survival-based models (e.g., Cox or DeepSurv), and benchmark against clinical scoring systems such as the Seattle Heart Failure Model.
Overall, my pipeline provides a strong methodological foundation—demonstrating that even minimal-feature models can capture meaningful prognostic signals, and that ensemble learning can yield clinically relevant gains. These findings underscore the potential of machine learning to enhance early heart failure prognosis, especially when guided by rigorous validation and clinical awareness.
Dataset Description
The Heart Failure Clinical Records dataset (299 patients, 13 features) is publicly available from the UCI Machine Learning Repository2. It contains the medical records of patients who experienced heart failure, collected during their follow-up period, and is used here to predict 1-year mortality (DEATH_EVENT). The variables are summarized in Table 4 below:
| Feature | Description | Type / Units |
| age | Patient age | Years (int) |
| anaemia | Anaemia (low hemoglobin) | Binary (0/1) |
| creatinine_phosphokinase | CPK enzyme level | mcg/L (int) |
| diabetes | Diabetes | Binary (0/1) |
| ejection_fraction | Blood leaving heart per beat | % (int) |
| high_blood_pressure | Hypertension | Binary (0/1) |
| platelets | Platelet count | kiloplatelets/mL (float) |
| serum_creatinine | Serum creatinine | mg/dL (float) |
| serum_sodium | Serum sodium | mEq/L (float) |
| sex | Gender (male = 1) | Binary (0/1) |
| smoking | Smoking status | Binary (0/1) |
| time | Follow-up time | Days (int) |
| DEATH_EVENT | Mortality during follow-up | Binary (0/1) |
Key characteristics:
- Instances: 299 patients
- Features: 12 clinical predictors + 1 binary outcome
- Missing values: None
- Data types: Integer, Float, Binary

As shown in Figure 4:
- Top Right: Age distribution stratified by mortality shows that non-survivors tend to cluster at older ages.
- Bottom Left: Boxplot of serum creatinine levels indicates higher median values and more outliers among deceased patients, suggesting potential renal dysfunction.
- Bottom Right: Ejection fraction boxplot shows significantly lower median values among non-survivors, highlighting impaired cardiac function as a strong predictor of mortality.
Feature Importance
The original study by Chicco&Jurman28 demonstrated that ejection fraction and serum creatinine alone suffice for accurate survival prediction.
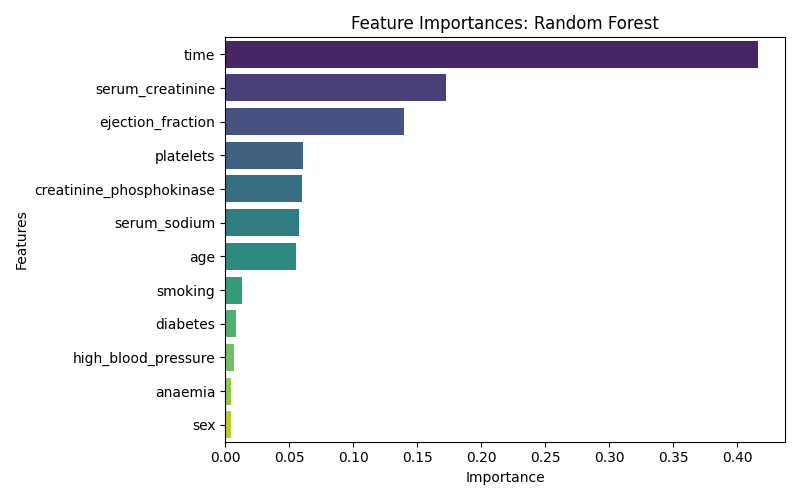
As Shown in figure 5, The variable time (follow-up duration) was the most influential predictor of 1-year mortality, followed by serum_creatinine and ejection_fraction, both of which are known biomarkers of cardiac and renal function. Features such as sex, anaemia, and high_blood_pressure contributed less to the model’s predictive performance.
Methods
Dataset and Feature Description
I used the Heart Failure Clinical Records Dataset from the UCI Machine Learning Repository, which includes 299 patients with 13 clinical features. The binary target variable DEATH_EVENT indicates 1-year mortality (1 = deceased, 0 = survived). Features cover demographics (age, sex), comorbidities (anaemia, diabetes, high_blood_pressure, smoking), laboratory values (creatinine_phosphokinase, ejection_fraction, serum_creatinine, serum_sodium, platelets), and follow-up time (time).
No missing values were present. Binary variables were retained as 0/1 integers. Continuous variables were standardized using StandardScaler (mean = 0, std = 1), fitted on the training set only to avoid data leakage. Outliers were retained to preserve clinically relevant edge cases.
Ethical Considerations
The study used publicly available de-identified data from the UCI Machine Learning Repository, so no additional ethical approval was required.
Train/Test Split and Class Balancing
I performed a stratified 70/30 split using train_test_split, preserving class proportions. To address the imbalance in mortality (minority class), I applied the Synthetic Minority Oversampling Technique (SMOTE) to the training set only, within each cross-validation fold. This enhanced sensitivity to death events without contaminating test data.
Summary Statistics
Table 5 presents the summary statistics of key variables in the datlaset.
| Feature | Mean | Std | Min | Max |
| Age | 60.83 | 11.89 | 40 | 95 |
| Ejection Fraction | 38.08 | 11.83 | 14 | 80 |
| Serum Creatinine | 1.39 | 1.03 | 0.50 | 9.40 |
| Serum Sodium | 136.63 | 4.41 | 113 | 148 |
| Platelets | 263358 | 97804 | 25100 | 850000 |
Model Development and Selection
I implemented and compared five classification models:
- Logistic Regression (LR): linear baseline with L2 regularization.
- Decision Tree (DT): simple non-ensemble baseline.
- Random Forest (RF): bootstrapped ensemble of decision trees.
- XGBoost (XGB): gradient-boosted trees with regularization.
- LightGBM (LGB): leaf-wise boosting optimized for speed and memory.
All models were constructed using an imblearn.Pipeline with the sequence: SMOTE → Scaling → Classifier.
Hyperparameter Tuning
I performed hyperparameter optimization using RandomizedSearchCV, sampling from predefined distributions for each model (e.g., n_estimators, max_depth, learning_rate, class_weight). Each search ran for 20 iterations with 5-fold StratifiedKFold cross-validation, optimized for ROC AUC.
Stacking Ensemble
The best-performing tree-based models (RF, XGB, LGB) were integrated into a stacking ensemble using StackingClassifier, with Logistic Regression as the meta-learner. Meta-model training used out-of-fold predictions from the base models, reducing overfitting. I validated ensemble performance via 5-fold stratified cross-validation. Stacking typically yields a 2–5% ROC AUC gain over individual learners in structured clinical datasets.
Evaluation Metrics
Performance was evaluated on the 30% test set using the following metrics:
- ROC AUC: primary measure of discrimination.
- Accuracy, Sensitivity, Specificity: computed from confusion matrices.
- Feature Importance: via Gini impurity (for RF).
- ROC Curves: to visualize model discrimination.
- Calibration Curves: to assess probabilistic reliability.
- Bootstrap Confidence Intervals: for statistical testing of model improvements.
Exclusion of Follow-Up Time to Prevent Label Leakage
While time (days of follow-up) was initially included, I excluded it from the final models due to its strong correlation with the outcome. Including it would constitute label leakage, since longer follow-up inherently implies survival. Removing it improves the model’s real-world applicability.
Limitations in Data and Evaluation
Given the modest dataset size (n=299), high internal AUCs may reflect overfitting. Despite cross-validation and SMOTE balancing, the absence of external validation limits generalizability. Future work should validate this pipeline on larger, multi-center clinical datasets and explore time-to-event modeling for richer prognostic insight. All steps are wrapped in a scikit-learn Pipeline to prevent data leakage, ensuring that scaling, SMOTE, and hyperparameter tuning occur within each CV fold rather than on the full dataset.
Implementation
The complete modeling pipeline is implemented in Python, encapsulating preprocessing, imbalance handling, hyperparameter tuning, and ensemble learning. The script model_pipeline.py is shown below:
Listing 1: Heart Failure Mortality Prediction Pipeline
import pandas as pd import numpy as np import matplotlib.pyplot as plt import seaborn as sns
from sklearn.model_selection import train_test_split, StratifiedKFold from sklearn.metrics import ( accuracy_score, confusion_matrix, classification_report, roc_auc_score, roc_curve
)
from sklearn.ensemble import RandomForestClassifier from sklearn.linear_model import LogisticRegression from sklearn.tree import DecisionTreeClassifier from sklearn.preprocessing import StandardScaler from imblearn.pipeline import Pipeline from imblearn.over_sampling import SMOTE
import xgboost as xgb
import lightgbm as lgb
# Load dataset
df = pd.read_csv("heart_failure_clinical_records_dataset.csv") X = df.drop("DEATH_EVENT", axis=1) y = df["DEATH_EVENT"]
# Split dataset
X_train, X_test, y_train, y_test = train_test_split(
X, y, test_size=0.3, stratify=y, random_state=42
)
# Define cross-validator
cv = StratifiedKFold(n_splits=5, shuffle=True, random_state=42)
# Models dictionary models = {
’Random␣Forest’: RandomForestClassifier(random_state=42),
’Logistic␣Regression’: LogisticRegression(max_iter=1000, random_state=42),
’Decision␣Tree’: DecisionTreeClassifier(random_state=42),
’XGBoost’: xgb.XGBClassifier(use_label_encoder=False, eval_metric
=’logloss’, random_state=42),
’LightGBM’: lgb.LGBMClassifier(random_state=42)
}
# Store results results = {}
for name, model in models.items():
print(f"Training␣{name}...") pipe = Pipeline([
(’smote’, SMOTE(random_state=42)),
(’scaler’, StandardScaler()),
(’clf’, model)
])
pipe.fit(X_train, y_train)
y_pred = pipe.predict(X_test) y_proba = pipe.predict_proba(X_test)[:, 1]
auc = roc_auc_score(y_test, y_proba) acc = accuracy_score(y_test, y_pred) cm = confusion_matrix(y_test, y_pred) tn, fp, fn, tp = cm.ravel() sensitivity = tp / (tp + fn) specificity = tn / (tn + fp)
results[name] = {
’AUC’: round(auc, 3),
’Accuracy’: round(acc, 3),
’Sensitivity’: round(sensitivity, 3), ’Specificity’: round(specificity, 3),
’Model’: pipe
}
# Display results
print("\n===␣Model␣Performance␣Summary␣===") for name, metrics in results.items():
print(f"\n{name}") for k in [’AUC’, ’Accuracy’, ’Sensitivity’, ’Specificity’]:
print(f"{k}:␣{metrics[k]}")
# Plot ROC Curves plt.figure(figsize=(8, 6)) for name, metrics in results.items():
fpr, tpr, _ = roc_curve(y_test, metrics[’Model’].predict_proba(
X_test)[:, 1]) plt.plot(fpr, tpr, label=f"{name}␣(AUC␣=␣{metrics[’AUC’]})")
plt.plot([0, 1], [0, 1], ’k--’) plt.xlabel("False␣Positive␣Rate") plt.ylabel("True␣Positive␣Rate") plt.title("ROC␣Curves") plt.legend() plt.tight_layout()
plt.grid() plt.show()
Conclusion and Future Work
Our results demonstrate that a stacking ensemble combining Random Forest, XGBoost, and LightGBM improves test ROC AUC to 0.880, outperforming the tuned Random Forest (0.861) and supporting the benefit of meta-learning approaches in clinical prediction. The ensemble model balances accuracy and interpretability through the use of a logistic regression meta-learner.
However, these findings must be interpreted cautiously. The dataset is small (n=299), and the absence of external validation limits generalizability. Although SMOTE and cross-validation were used to mitigate overfitting, the performance gap between internal and external AUCs suggests potential optimism. Additionally, no formal calibration or advanced interpretability analysis was performed.
To improve clinical readiness, future work should:
- Validate the models on independent, real-world heart failure cohorts.
- Employ model calibration techniques (e.g., Platt scaling or isotonic regression) to assess the reliability of predicted probabilities.
- Integrate interpretability methods (e.g., SHAP, LIME) for clinician transparency and trust.
- Extend modeling to temporal electronic health records or wearable sensor data to capture dynamic disease trajectories.
Ultimately, translating these models into clinical practice will require rigorous external validation on real-world cohorts, continuous monitoring in deployment, and clinician-in-the-loop evaluation to ensure safety, fairness, and trustworthiness.
Acknowledgements
The author acknowledges Dr. Muhammad Imran for his mentorship and guidance.
References
- Wayne C. Levy et al. “The Seattle Heart Failure Model: Prediction of Survival in Heart Failure”. In: Circulation 113.11 (2006), pp. 1424–1433. url: https://doi.org/10.1161/CIRCULATIONAHA. 105.584102) [↩]
- Heart Failure Clinical Records. UCI Machine Learning Repository. DOI: https://doi.org/10.24432 2020 [↩] [↩]
- Cureus. Search Results for “Cureus2023”.Accessed:2025-05-25.2023.url:https://www.cureus.com/articles?q=Cureus2023& source=homeSearch&searched=true) [↩]
- Nadindra Dwi Ariyanta et al. “Ensemble learning approaches for predicting heart failure outcomes: A comparative analysis of feedforward neural networks, random forest, and XGBoost”. In: Applied Engineering and Technology 3.3 (2024). doi: 10.31763/aet.v3i3.1750. url: https://pubs2.ascee.org/ index.php/aet/article/view/1750) [↩]
- Saqib Ejaz Awan et al. “Machine learning-based prediction of heart failure readmission or death: implications of choosing the right model and the right metrics”. In: ESC Heart Failure 6.2 (2019), pp. 428–435. doi: 10. 1002/ehf2.12419. url: https://onlinelibrary.wiley.com/doi/10.1002/ehf2. 12419) [↩]
- Yue Cai et al. “Artificial intelligence in the risk prediction models of cardiovascular disease and development of an independent validation screening tool: a systematic review”. In: BMC Medicine 22.56 (2024). doi:10.1186/s12916-024-03273-7.url:https://bmcmedicine.biomedentral.com/articles/10.1186/ s12916-024-03273-7 [↩]
- Tasha Nagamine et al. “Multiscale classification of heart failure phenotypes by unsupervised clustering of unstructured electronic medical record data”. In: Scientific Reports 10 (2020), pp. 21340. doi: 10.1038/s41598-020-77286-6. url: https://www.nature.com/articles/s41598-020-77286-6) [↩]
- Cureus. Minimalist Heart Failure Models Using Machine Learning. Accessed: 2025-05-23. 2023. url: https://www.cureus.com) [↩]
- Shishir A Rao et al. “An explainable Transformer-based deep learning model for the prediction of incident heart failure”. In: arXiv preprint (2021). doi: 10.48550/arXiv.2101.11359. url: https://arxiv.org/abs/2101.11359) [↩]
- Shuyu Lu et al. “Understanding Heart Failure Patients’ EHR Clinical Features via SHAP Interpretation of Tree-Based Machine Learning Model Predictions”. In: AMIA Annual Symposium Proceedings (2022). url: https:// www.ncbi.nlm.nih.gov/pmc/articles/PMC10186770/) [↩]
- Hamed Hajishah et al. “Evaluation of machine learning methods for prediction of heart failure mortality and readmission: meta-analysis”. In: BMC Cardiovascular Disorders 25.1 (2025), pp. 264– 264. url: https://doi.org/10.1186/s12872-025-04321-7) [↩]
- Cureus. Search Results for “Cureus2023”.Accessed:2025-05-25.2023.url:https://www.cureus.com/articles?q=Cureus2023& source=homeSearch&searched=true) [↩]
- Emmanuel Kokori et al. “Machine learning in predicting heart failure survival: a review of current models and future prospects”. In: Heart Failure Reviews 30 (2025), pp. 431–442. doi: 10.1007/s10741-024-10474-y. url: https://doi.org/ 10.1007/s10741-024-10474-y) [↩]
- Md. Mamun Ali et al. “A machine learning approach for risk factors analysis and survival prediction of Heart Failure patients”. In: Healthcare Analytics 3 (2023), pp. 100182. doi: 10.1016/j.health.2023.100182. url: https://doi.org/10.1016/j.health. 2023.100182) [↩]
- Hua Li et al. “A nomogram for predicting the risk of heart failure with preserved ejection fraction”. In: International Journal of Cardiology 407 (2024), pp. 131973. doi:10.1016/j.ijcard.2024.131973. url: https://doi.org/10.1016/j.ijcard.2024. 131973) [↩]
- Tingting Wu et al. “Age, creatinine, and ejection fraction score is a risk factor for acute kidney injury after surgical aortic valve replacement”. In: Renal Failure 47.1 (2025), pp. 2444401. doi: 10.1080/0886022X.2024.2444401. url: https://doi.org/10.1080/0886022X.2024. 2444401) [↩]
- Femi Ojo and Sowmya Guntupalli. “Assessing Mortality Risk in Heart Failure: Analyzing Ejection Fraction, Kidney Function, Smoking, and Follow-Up Time as Predictive Indicators”. In: 2024 IEEE International Conference on Bioinformatics and Biomedicine (BIBM). IEEE, 2024. doi: 10.1109/BIBM62325.2024.10822463. url:https://doi.org/10.1109/BIBM62325.2024.10822463) [↩]
- Mustafa Çakır. “Comparison of Machine Learning Models in Heart Failure Prediction and Their Integration into Clinical Decision Support Systems”. In: International Journal of 3D Printing Technologies and Digital Industry 9.2 (2025), pp. 272–282. doi:10.46519/ij3dptdi.1724620.url:https://dergipark.org.tr/en/pub/ij3dptdi/issue/84796/1724620) [↩]
- Yinge Zhan et al. “Efficacy of vericiguat in patients with chronic heart failure and reduced ejection fraction: a prospective observational study”. In: BMC Cardiovascular Disorders 25.83 (2025). doi: 10.1186/ s12872-025-04477-2. url: https://doi.org/10.1186/s12872-025-04477-2) [↩]
- Hesham Salah Eldin Taha et al. “Heart failure with reduced ejection fraction and chronic kidney disease: a focus on therapies and interventions”. In: Heart Failure Reviews 30 (2025), pp. 159–175.doi: 10.1007/s10741-024-10453-3. url: https://doi.org/10.1007/s10741-02410453-3) [↩]
- Mohammad Mamun et al. “Interpretable Heart Failure Identification Utilizing Auto Machine Learning Tools”. In: Proceedings of the 2nd International Conference on Next-Generation Computing, IoT and Machine Learning (NCIM). IEEE. 2025. doi: 10.1109/NCIM65934.2025.11159854.url:https://doi.org/10.1109/NCIM65934.2025.11159854) [↩]
- Masatake Kobayashi et al. “Kidney function trajectories before and after hospitalization for heart failure with reduced ejection fraction”. In: European Heart Journal 30 (2025), pp. 1–11. doi: 10.1093/eurheartj/ehaf457. url: https://doi.org/10.1093/eurheartj/ ehaf457) [↩]
- Yue Hua et al. “Machine learning-driven prediction of readmission risk in heart failure patients with diabetes: synergistic assessment of inflammatory and metabolic biomarkers”. In: International Journal of Cardiology 441 (2025), pp. 133743. doi: 10.1016/j.ijcard.2025.133743. url: https: //doi.org/10.1016/j.ijcard.2025.133743) [↩]
- Muhammad Saqib et al. “Machine learning in heart failure diagnosis, prediction, and prognosis: review”. In: Annals of Medicine Surgery 86 (2024), pp. 3615–3623. doi: 10.1097/MS9.0000000000002138.url: https://doi.org/10.1097/MS9.0000000000002138) [↩]
- Jerremy Weerts et al. “Microvascular dysfunction across organs in heart failure with preserved ejection fraction: the PROSE-HFpEF case-control study”. In: Cardiovascular Diabetology 24 (2025), pp. 310. doi: 10.1186/s12933-025-02850-1. url: https://doi.org/10.1186/s12933-025-02850-1) [↩]
- Murat Karacam et al. “From patterns to prognosis: machine learning-derived clusters in advanced heart failure”. In: Frontiers in Cardiovascular Medicine 12 (2025), pp. 1669538. doi: 10.3389/fcvm.2025.1669538. url: https: //doi.org/10.3389/fcvm.2025.1669538) [↩]
- Rabiah Aslam Ansari et al. “Artificial Intelligence-Guided Neuromodulation in Heart Failure with Preserved and Reduced Ejection Fraction: Mechanisms, Evidence, and Future Directions”. In: Journal of Cardiovascular Development and Disease 12.8 (2025), pp. 314. doi: 10.3390/jcdd12080314. url: https://doi.org/10.3390/jcdd12080314) [↩]
- Davide Chicco and Giuseppe Jurman. “Machine learning can predict survival of patients with heart failure from serum creatinine and ejection fraction alone”. In: BMC Medical Informatics and Decision Making 20 (2020), pp. 16. doi: 10.1186/s12911-020-1023-5. url: https://bmcmedinformdecismak.biomedcentral.com/ articles/10.1186/s12911-020-1023-5) [↩] [↩] [↩]
- Bryan Chulde-Fernández et al. “Classification of Heart Failure Using Machine Learning: A Comparative Study”. In: Life 15.3 (2025). Used UCI HF (299); Random Forest AUC = 0.970, pp. 496. doi: 10.3390/ life15030496. url: https://www.mdpi.com/2075-4418/13/11/ 1948. [↩]
- Md Sohanur Rahman et al. “Heart Failure Emergency Readmission Prediction Using Stacking Machine Learning Model”. In: Diagnostics 13.11 (2023), pp. 1948. doi: 10.3390/diagnostics13111948. url: https://www.mdpi.com/2075-4418/13/11/1948. [↩]


