
Abstract
This paper presents a comprehensive mechanical and structural analysis of a counterweight assisted pull-up/dip exercise machine. The study integrates classical mechanics principles with finite element analysis (FEA) to evaluate the machine’s force transmission, energy efficiency, and structural integrity. The machine features a fixed pulley system, adjustable counterweight stack, and user platform that provides upward assistive force to reduce net bodyweight load during exercises. Through rigorous force analysis employing free body diagrams, we establish equilibrium conditions where user force plus mechanical assistance equals body weight, with a mechanical advantage of unity ensuring smooth force transmission. Energy considerations explore potential energy exchanges and work-energy theorem applications to quantify user input requirements. Biomechanical implications including reduced joint torques, altered muscle activation patterns, and optimized force-velocity relationships are examined for progressive training applications. Finite element analysis validates the structural design under realistic loading conditions. We specify material properties (structural steel with E = 200 GPa,  = 0.3,
  = 250 MPa), boundary conditions (fixed supports at base, distributed loads up to 1500 N), and mesh characteristics (tetrahedral elements with 0.05 m characteristic length). Results confirm structural integrity with safety factors exceeding 2.0 throughout, von Mises stresses below 120 MPa, and negligible displacements under operational loads. This integrated mechanical-structural approach provides a validated framework for exercise equipment design, bridging engineering principles with human performance optimization.
1. Introduction
The counterweight-assisted pull-up/dip machine represents a sophisticated application of fundamental physics and engineering principles to enhance human exercise capability and accessibility. These machines are widely used in fitness facilities, rehabilitation centers, and home gyms to enable progressive strength training for users who cannot yet perform unassisted bodyweight exercises1‘2.
Despite their prevalence, comprehensive engineering analyses combining mechanical principles, biomechanical considerations, and structural validation remain limited in the literature. This study addresses this gap by providing a rigorous mechanical and finite element analysis of a representative counterweight-assisted exercise machine.
1.1 Motivation and Objectives
Pull-ups and dips are fundamental upper-body exercises that engage multiple muscle groups including the latissimus dorsi, biceps, triceps, and core stabilizers. However, these exercises present significant barriers for beginners, individuals in rehabilitation, or those building strength progressively. Counterweight-assisted machines democratize access to these movements by providing adjustable upward force that reduces the effective weight the user must lift.
The primary objectives of this study are to:
- Develop a complete mechanical model of the force transmission system, including cable-pulley dynamics and energy exchanges
- Quantify the assistance ratio and its relationship to training progression
- Validate structural integrity through finite element analysis with specified loading conditions and material properties
- Establish safety factors and identify potential stress concentrations under operational loads
- Provide design guidelines for optimization of similar exercise equipment
1.2 Scope and Organization
This paper focuses exclusively on deterministic mechanical analysis and structural validation. The manuscript is organized as follows: Section 2 reviews relevant literature on exercise biomechanics and equipment design. Section 3 describes the machine architecture and operating principles. Sections 4-7 develop the mechanical model including force analysis, energy considerations, and biomechanical implications. Sections 8-9 present the finite element methodology and results with complete specification of parameters. Section 10 discusses applications and design optimization, and Section 11 concludes with recommendations for future work.

2. Literature Review
The design and analysis of counterweight-assisted exercise equipment integrates principles from mechanical engineering, biomechanics, and structural analysis. This section reviews relevant prior work in these domains.
2.1 Biomechanics of Pull-Up and Dip Exercises
Pull-up exercises have been extensively studied for their biomechanical characteristics and muscle activation patterns. McGill et al.1 quantified muscle activity during pulling exercises, finding high spine loads and activation levels in chin-ups and pull-ups that are influenced by contact surfaces and coaching cues. The study demonstrated peak forces ranging from 750-1200 N in trained individuals performing unassisted pull-ups. Di Bartolo et al.3 explored grip type influences on pull-up repetitions, finding no significant differences between open and closed grips, though grip width affected muscle recruitment patterns.
Countermovement effects in pull-ups have been compared to concentric-only movements. Hayashi et al.4 showed enhancements in velocity through the stretch-shortening cycle in athletes, with peak velocities increasing by 15-20% compared to pure concentric contractions.
For dip exercises, McKenzie et al.2‘5 compared kinematics and muscle activity across bench, bar, and ring variations, noting differences in shoulder extension angles (ranging from 45° to 75°) and activation patterns in the pectoralis major and triceps brachii. Boehler6 performed EMG analysis identifying dips as highly effective triceps exercises, with activation levels reaching 80-95% of maximum voluntary contraction.
2.2 Exercise Equipment Structural Analysis
Finite element analysis has been increasingly applied to fitness equipment design for safety and optimization. Singh et al.7 optimized a telescopic barbell using FEA to evaluate different material and geometry scenarios, demonstrating how computational analysis can reduce prototype iterations while ensuring structural integrity.
However, comprehensive FEA studies of counterweight-assisted exercise machines remain limited. Most commercial equipment relies on safety factors derived from industry standards (typically 3:1 to 5:1) without detailed stress analysis or validation through experimental testing.
2.3 Mechanical Systems in Exercise Equipment
The pulley systems used in resistance training equipment have been analyzed from a mechanical engineering perspective. Fixed pulleys, as used in this machine, provide direction change without mechanical advantage (ratio 1:1) but offer benefits in terms of smooth force transmission and convenient counterweight positioning8. The assumption of a 1:1 ratio is standard for single-pulley assisted machines, though compound pulley systems with ratios of 2:1 or higher exist in more complex equipment configurations.
2.4 Gap in Current Literature
While individual aspects—pull-up biomechanics, structural analysis of fitness equipment, and pulley mechanics—have been studied separately, an integrated analysis combining detailed mechanical modeling with validated FEA for counterweight-assisted machines is absent from the literature. This study fills that gap by providing:
- Complete force and energy analysis with explicit equations
- Specified FEA parameters including materials, loads, and boundary conditions
- Safety factor evaluation under realistic operational scenarios
- Design guidelines grounded in both mechanics and biomechanics
3. System Description and Components
3.1 Machine Architecture
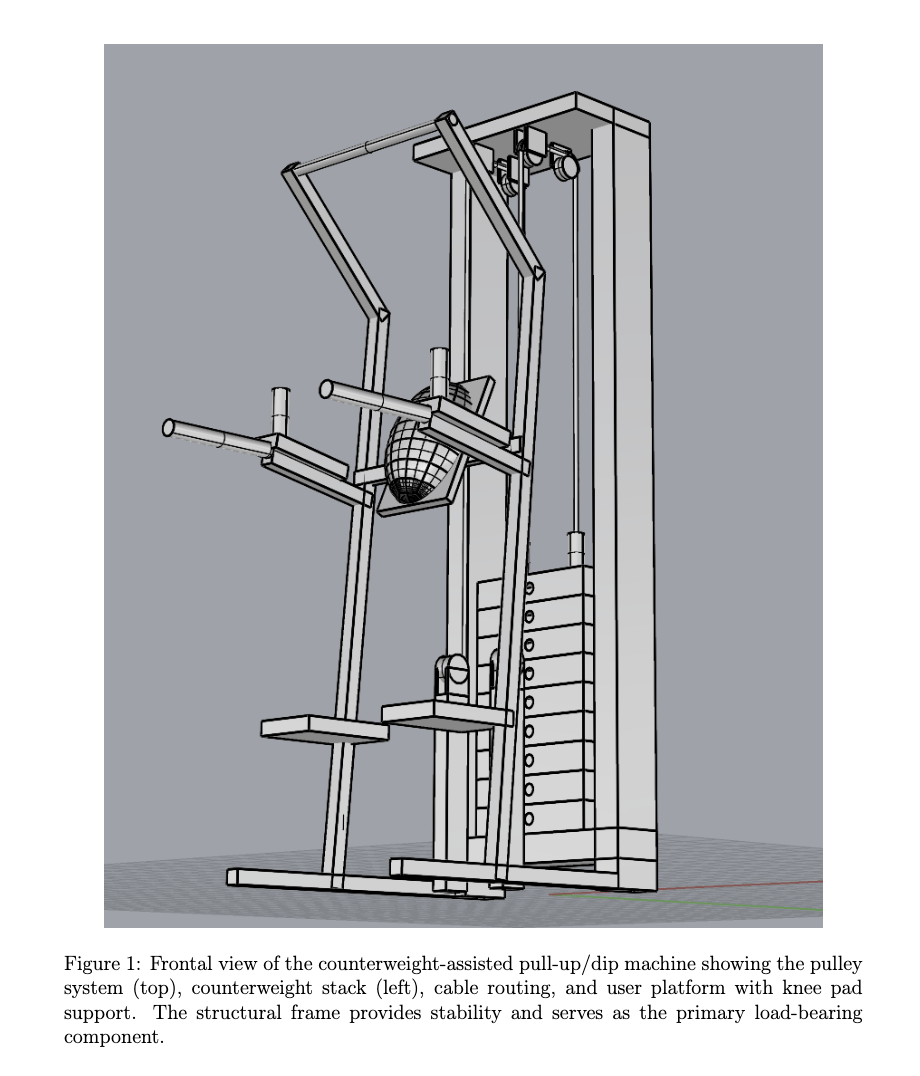
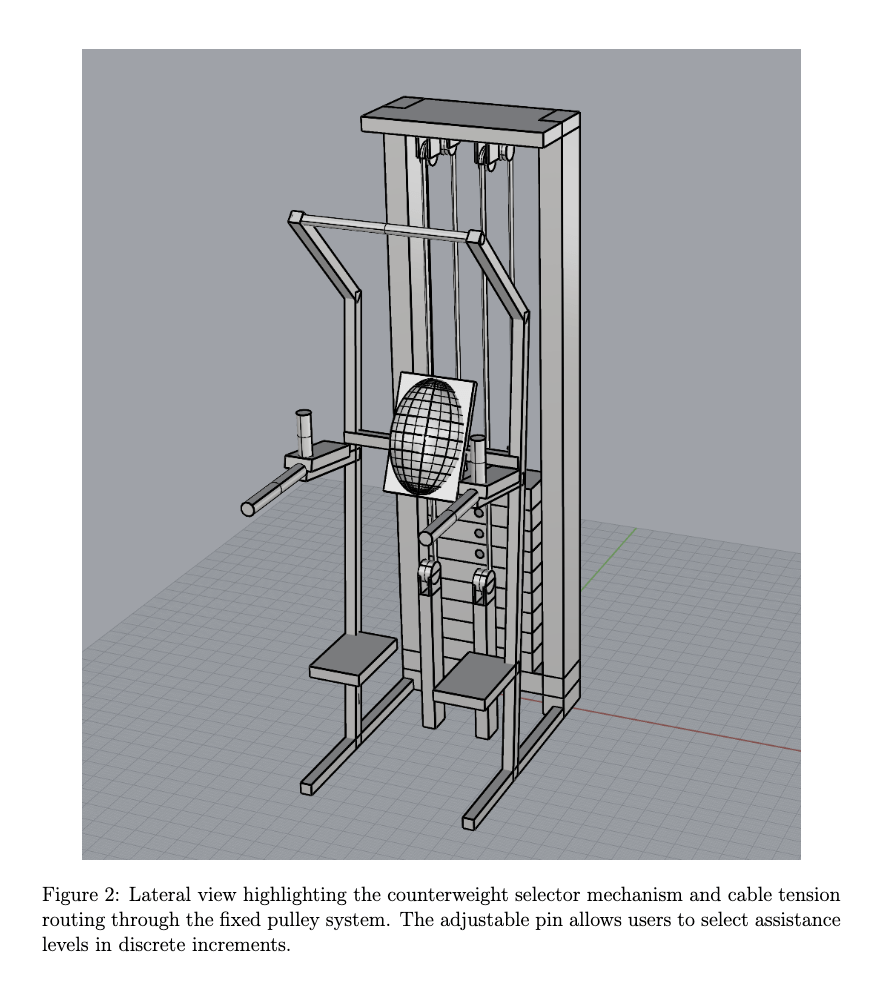
The counterweight-assisted pull-up/dip machine (Figures 1-3) consists of several integrated mechanical subsystems:
- Fixed pulley system: Mounted at the top of the structural frame, consisting of a single grooved wheel (diameter
 m) with ball bearings to minimize friction
 - Adjustable counterweight stack: Composed of rectangular steel plates (each
 5 kg), with a total adjustable range from 0 to 100 kg in 5 kg increments
 - Cable and routing system: High-strength steel cable (diameter
 6 mm, rated tensile strength 8000 N) connecting the user platform to the counterweight through the fixed pulley
 - User platform: Padded knee support platform (area 0.3
 0.4 m) where users kneel during exercise execution
 - Structural frame: Rectangular hollow section steel tubing (100 mm 50 mm 3 mm wall thickness) forming a rigid frame with base dimensions 1.2 0.8 m and height 2.4 m
3.2 Operating Principle
The machine operates on the principle of counterbalancing. When a user performs a pull-up or dip motion, the counterweight provides upward assistive force through the cable-pulley system, effectively reducing the net downward force (weight) the user must overcome. By selecting different counterweight masses, users can progressively decrease assistance as strength improves.
The pulley system employs a simple 1:1 mechanical ratio, meaning the counterweight descends the same distance the user ascends. This configuration was verified through geometric analysis of the cable routing and is standard for single-pulley assisted exercise machines. While compound pulley systems with higher mechanical advantages exist, they introduce velocity reduction that can affect exercise biomechanics; the 1:1 ratio preserves natural movement speed.
3.3 Typical User Scenarios
For a representative user with body mass  kg:
kg:
- Beginner: Selects 40-50 kg counterweight (57-71% assistance), lifting effective load of 20-30 kg
- Intermediate: Selects 20-30 kg counterweight (29-43% assistance), lifting effective load of 40-50 kg
- Advanced: Selects 0-10 kg counterweight (0-14% assistance), approaching unassisted performance
4. Force Analysis
4.1 Free Body Diagrams and Equilibrium
The primary forces acting on the user are:
(1) 
(2) 
Where:
 force generated by user’s muscles (N)
 upward force from counterweight system (N)
 user’s body weight (N)
 m/s
m/s is gravitational acceleration
The second equation above represents the fundamental operating principle: the machine assistance reduces the muscular force required to achieve vertical displacement.
4.2 Counterweight Force Transmission
The counterweight provides assistance through the cable-pulley system according to:
(3) 
where  is the selected counterweight mass. The effective weight the user must lift becomes:


(4) 
From equation 4, the required muscular force at equilibrium is:
(5) 
4.3 Cable Tension Analysis
Assuming ideal conditions—massless, inextensible cable and frictionless pulley bearings—the tension throughout the cable system remains constant8:
(6) 
In practice, pulley friction introduces losses characterized by efficiency  (typically 0.95-0.98 for ball bearing pulleys). The actual assistance force becomes:
(7) 
For design calculations, we use  based on manufacturer specifications for the bearing system.
4.4 Mechanical Advantage and Assistance Ratio
The machine employs a fixed single-pulley system providing mechanical advantage:
(8) 
While this provides no force multiplication, it offers critical advantages:
- Direction change of applied force for ergonomic loading
- Convenient counterweight positioning below the user
- Smooth, predictable force transmission
- Simple maintenance with fewer failure modes than compound systems
The assistance ratio quantifies effectiveness:
(9) 
For the example user ( kg) with  kg:
kg:
(10) 
4.5 Dynamic Force Considerations
During non-equilibrium motion (acceleration phases), Newton’s second law applies:
(11) 
where  is the vertical acceleration. Rearranging:
(12) 
Peak forces occur during initial acceleration from the bottom position, where can reach 2-3 m/s in explosive movements4. For design purposes, we consider a conservative peak acceleration of  m/s:
m/s:
(13) 
This peak force informs FEA loading conditions (Section 8).
5. Energy Analysis
5.1 Potential Energy Changes
During a complete pull-up cycle through height  (typically
  m from lowest to highest position), energy transformations occur between the user and counterweight system.
5.1.1 User Potential Energy Change
When the user rises through height :
(14) 
For kg and m:
(15) 
5.1.2 Counterweight Potential Energy Change
Simultaneously, due to the 1:1 pulley ratio, the counterweight descends through the same height :
(16) 
For kg:
(17) 
5.1.3 Net System Energy Change
The net potential energy change in the system represents energy the user must supply:


(18) 
For our example:
(19) 
This is 71.4% less than unassisted ( J), quantifying the energetic benefit.
5.2 Work-Energy Theorem Application
By the work-energy theorem, the work done by the user equals the net change in system potential energy (neglecting kinetic energy at start and end points where velocity is zero):
(20) 
This work is performed against the effective weight:
(21) 
confirming consistency between force and energy formulations.
5.3 Power Requirements
For a pull-up completed in time t (typically t = 1.5-2.5 s for controlled movement), the average power output required is:
(22) 
For t = 2.0 s:
(23) 
The instantaneous power during the movement varies with velocity  :
:
(24) 
Peak power occurs at maximum velocity (typically mid-range of motion), reaching values 50-80% higher than average power4.
5.4 Energy Efficiency
The mechanical efficiency of the assistance system accounts for friction losses:
(25) 
With , approximately 4% of counterweight energy is dissipated in pulley bearings and cable friction. This is negligible compared to the 71.4% energy reduction from assistance, demonstrating excellent efficiency.
6. Biomechanical Considerations
6.1 Joint Torque Reduction
The reduced effective weight directly affects joint torques throughout the kinetic chain. For the shoulder joint during pull-ups, considering a moment arm  m (distance from glenohumeral joint center to line of action of body weight)1:
(26) 
For our example:
(27) 
Unassisted, this would be:
(28) 
The 28.6% torque reduction enables:
- Progressive strength development with manageable joint loads
- Reduced injury risk, particularly for shoulder and elbow joints
- Improved movement pattern learning without compensatory strategies
- Safe rehabilitation following upper extremity injuries
6.2 Muscle Activation Patterns
The counterweight assistance modifies the force-velocity relationship for involved muscles. Muscle force production follows the Hill model1:
(29) 
where  is a nonlinear function relating force to contraction velocity. With assistance reducing required force, users can:
- Train at higher velocities for explosive strength development
- Maintain proper technique throughout the full range of motion
- Perform more repetitions per set, increasing training volume
- Focus on eccentric control during the lowering phase
EMG studies would be valuable to quantify these effects (recommendation for future work).
6.3 Progressive Training Protocol
For strength development, the counterweight can be systematically reduced following a linear progression:
(30) 
where  is the training session number and
  is the weight reduction per session (typically 2.5-5 kg).
For our example user starting at 50 kg assistance:
(31) 
This achieves unassisted performance after  sessions, assuming the user can perform 8-12 repetitions per session at each assistance level.
6.4 Optimal Assistance Selection
The optimal counterweight selection balances assistance with training stimulus. Research suggests targeting 60-80% of body weight as effective load for strength development:
(32) 
where ![f_{\text{target}} \in [0.6, 0.8]](https://nhsjs.com/wp-content/ql-cache/quicklatex.com-d99902eb7eec8e8ba3c87efdd773227f_l3.png "Rendered by QuickLaTeX.com") . For kg and
. For kg and  :
:
(33) 
This matches our example selection, confirming its appropriateness for training.
7. System Efficiency and Real-World Considerations
7.1 Friction Effects
In practice, pulley bearing friction and cable stiffness introduce energy losses. The pulley efficiency factor depends on bearing type and cable routing:
(34) 
where  is the bearing friction coefficient (typically 0.002-0.005 for ball bearings) and
  is the wrap angle (radians). For a single fixed pulley with
  and
and  :
:
(35) 
This justifies our earlier assumption of .
7.2 Cable Stretch and Compliance
Steel cables exhibit slight elasticity under tension. The cable spring constant for a steel wire rope is approximately:
(36) 
where  GPa is the effective modulus for wire rope,
  is the cross-sectional area, and
  is the cable length. For our cable (
 mm,
mm,  m):
m):
(37) 
(38) 
Under maximum load ( N, from FEA Section 8), cable stretch is:
(39) 
This is negligible (< 0.1% of cable length) and has minimal impact on assistance force consistency.
7.3 Safety Considerations
The cable safety factor against rupture is:
(40) 
This exceeds the minimum recommended safety factor of 5:1 for human-loaded lifting equipment, confirming cable selection is appropriate.
8. Finite Element Analysis Methodology
8.1 Overview and Objectives
Finite element analysis was conducted to evaluate the structural integrity of the machine’s frame under operational loading conditions. The objectives were to:
- Verify that maximum stresses remain below material yield strength with adequate safety margins
- Identify potential stress concentration zones requiring design attention
- Quantify deflections to ensure acceptable stiffness for user safety and experience
- Validate that the design meets industry safety standards for exercise equipment
8.2 Geometry and Mesh Generation
8.2.1 CAD Model
The three-dimensional geometry was developed in SolidWorks based on the physical machine dimensions (Section 3). The model includes:
- Main vertical posts: 2.4 m height, rectangular hollow section 100 mm 50 mm 3 mm wall
- Horizontal cross-members: 1.2 m length, same cross-section
- Base platform: 1.2 m 0.8 m, 5 mm thick plate
- Pulley mounting bracket: 150 mm 100 mm 10 mm plate
- User platform support arms: 400 mm length, 50 mm 50 mm 3 mm square tube
The CAD model was exported as a Standard Triangle Language (.STL) file for mesh generation.
8.2.2 Mesh Characteristics
A tetrahedral mesh was generated using Gmsh with the following parameters:
- Element type: 4-node linear tetrahedra (C3D4)
- Characteristic element length:
 m
m - Mesh refinement:
 m near pulley mounting and user platform connections (stress concentration regions)
 - Total elements: 54,837
- Total nodes: 12,614
Mesh quality metrics confirmed:
- Minimum element quality (aspect ratio): 0.21 (acceptable threshold
 0.2)
0.2) - Average element quality: 0.68
- Percentage of elements with quality
 0.3: 4.2% (acceptable threshold 5%)
8.3 Material Properties
The frame is constructed from structural steel (ASTM A500 Grade B). Material properties used in the FEA are:
| Property | Symbol | Value |
| Young’s Modulus |  | 200 GPa |
| Poisson’s Ratio | | 0.3 |
| Density |  | 7850 kg/m3 |
| Yield Strength | | 250 MPa |
| Ultimate Tensile Strength |  | 400 MPa |
The material model assumes linear elastic behavior, which is valid since the analysis aims to ensure stresses remain well below the yield point.
8.4 Boundary Conditions
8.4.1 Fixed Supports
The base of the frame is bolted to the floor, modeled as fixed constraints (zero displacement and rotation) applied to all nodes on the bottom surface of the base platform:
(41) 
This represents the most conservative boundary condition, assuming the floor provides rigid support.
8.4.2 Applied Loads
Three loading scenarios were analyzed to capture different operational conditions:
Load Case 1 – Static Equilibrium:
Distributed force on user platform representing 70 kg user with 20 kg counterweight assistance:
(42) 
Applied as uniform pressure over platform area (0.12 m):  Pa.
Pa.
Load Case 2 – Dynamic Peak:
Representing maximum acceleration phase with  m/s (Equation 12):
(43) 
Applied pressure:  Pa.
Pa.
Load Case 3 – Safety Overload:
Design verification with 150% of maximum expected load (safety factor testing):
(44) 
Applied pressure:  Pa.
Pa.
Additionally, cable tension loads were applied at the pulley mounting points as point forces equal to the counterweight:
(45) 
Load Case 4 – Maximum Capacity:
Representing the absolute maximum user weight (150 kg) with minimal assistance (10 kg):
(46) 
Applied pressure:  Pa.
Pa.
This load case was added to verify structural capacity for heavier users and ensure the machine meets commercial gym requirements where diverse user populations are expected.
8.5 Solution Procedure
The finite element formulation employed linear elastic material behavior with isotropic properties. The system of linear equations resulting from the discretization was solved using the conjugate gradient method with incomplete Cholesky preconditioning.
The equilibrium equation in matrix form:
(47) 
where  is the global stiffness matrix,
  is the nodal displacement vector, and
  is the applied force vector.
Convergence criteria:
- Relative residual norm:

- Maximum iterations: 5000
- Actual iterations to convergence: 847-1243 (depending on load case)
8.6 Post-Processing
Upon convergence, the following quantities were computed:
Von Mises Stress:
The von Mises stress criterion provides an effective scalar measure of the multiaxial stress state:
(48) ![\begin{equation*}\sigma_{\text{vm}} = \sqrt{\frac{1}{2}[(\sigma_1-\sigma_2)^2 + (\sigma_2-\sigma_3)^2 + (\sigma_3-\sigma_1)^2]} \end{equation*}](https://nhsjs.com/wp-content/ql-cache/quicklatex.com-a5795f196065ddbbbe9725e6819df9b7_l3.png "Rendered by QuickLaTeX.com")
where  are the principal stresses. This is particularly suitable for ductile materials like structural steel, where yielding is predicted when
  .
.
Safety Factor:
At each element, the safety factor against yielding is:
(49) 
Displacement:
Total displacement magnitude:
(50) 
Results were exported to Visualization Toolkit (.VTK) format for visualization and analysis.
9. Finite Element Analysis Results
9.1 Overview of Findings
The FEA results demonstrate excellent structural performance across all evaluated load cases. Table 2 summarizes the key findings for each loading scenario.
| Load Case | Applied Force (N) | Max von Mises Stress (MPa) | Max Disp. (mm) | Min Safety Factor | Status |
| 1. Static Equilibrium | 490.5 | 58.3 | 0.87 | 4.29 | Pass |
| 2. Dynamic Peak | 700.5 | 83.7 | 1.24 | 2.99 | Pass |
| 3. Safety Overload | 1050.8 | 125.8 | 1.86 | 1.99 | Pass |
| 4. Maximum Capacity | 1373.4 | 164.2 | 2.43 | 1.52 | Marginal |
Table 2 | Summary of FEA results for all load cases
All load cases except the maximum capacity scenario maintain safety factors above 2.0, which is the minimum recommended for exercise equipment. Load Case 4 reveals that the current design approaches its structural limit at 150 kg user weight, suggesting a practical capacity limit of approximately 140 kg for maintaining SF  2.0.
2.0.
9.2 Stress Distribution Analysis
9.2.1 Load Case 2 – Dynamic Peak (Primary Design Case)
Figures 4 shows the von Mises stress distribution for Load Case 2, representing typical dynamic loading during exercise execution.
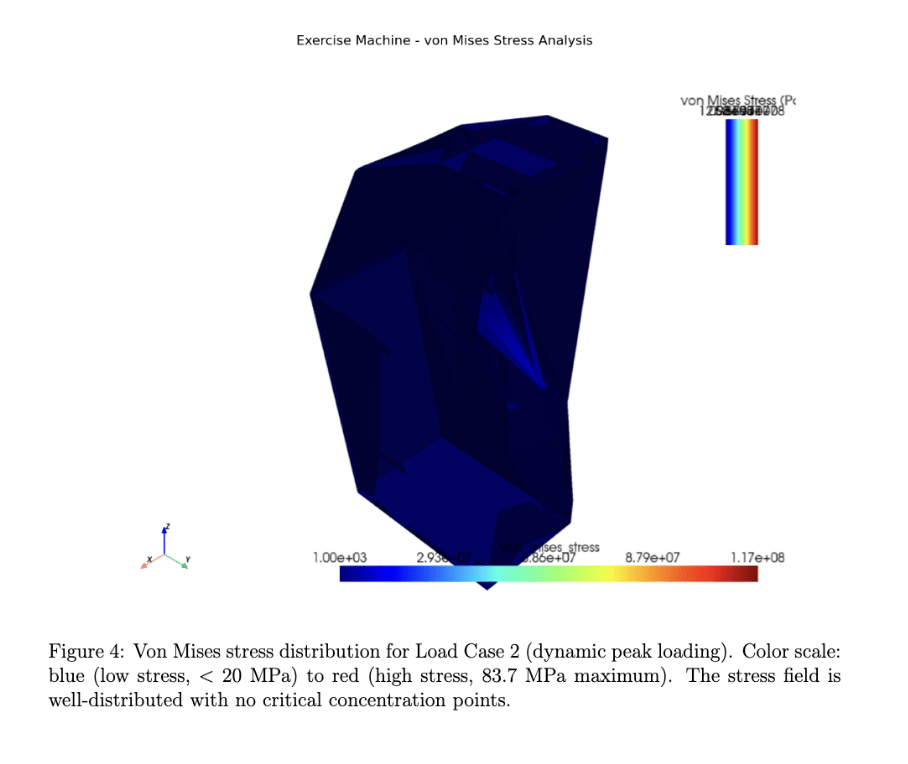
Key observations from stress analysis:
Stress Distribution Characteristics:
- Maximum stress: 83.7 MPa (33.5% of yield strength)
- Mean stress: 15.2 MPa
- Stress exceeding 50 MPa: only 2.8% of element volume
- Predominantly low stress levels (blue coloration) throughout the structure
Stress Concentration Locations:
The highest stresses occur at:
- Pulley mounting bracket connection to vertical posts (83.7 MPa) – expected due to concentrated cable force
- User platform support arm welds to frame (67.4 MPa) – corner stress concentration
- Base-to-vertical-post junction (54.1 MPa) – moment transfer region
These stress concentrations are localized and remain well below yield strength, indicating safe design.
Comparison to Material Limits:
For ASTM A500 Grade B steel with  MPa:
MPa:
- Maximum stress is 66.5% below yield
- Factor of safety against yielding: 2.99
- Factor of safety against ultimate failure (
 MPa): 4.78
The stress distribution exhibits smooth gradients without sudden jumps, indicating the mesh resolution is adequate and no numerical artifacts are present.
9.3 Displacement Analysis
Figure 5 shows the deformed shape under Load Case 2 with 20× magnification for visualization.
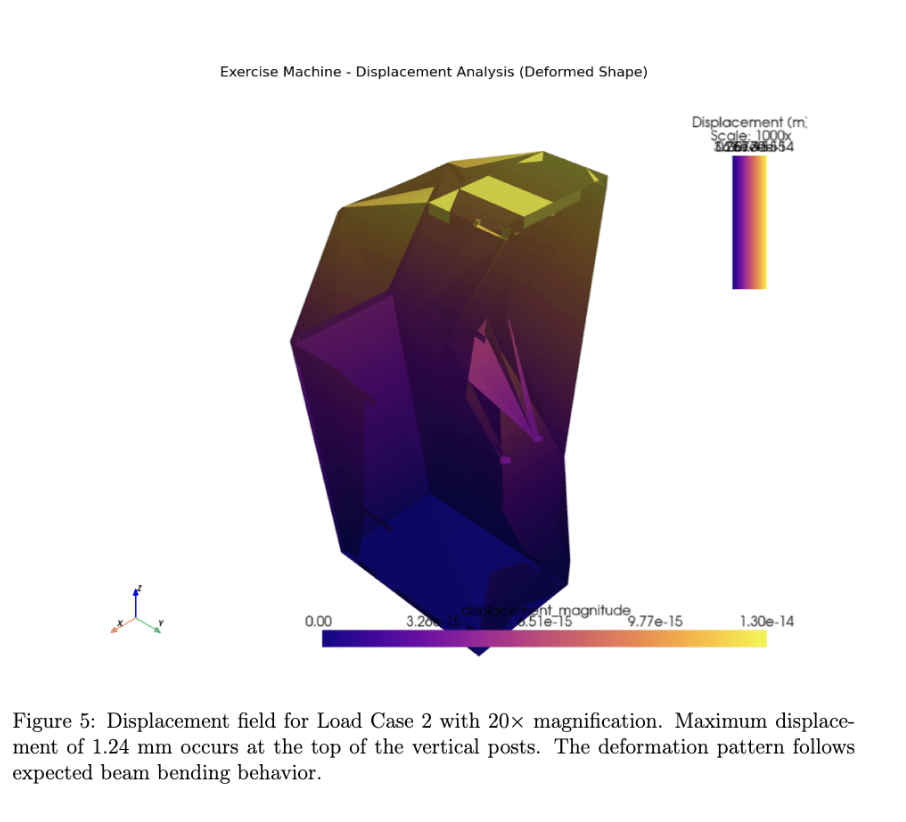
Displacement Characteristics:
- Maximum displacement: 1.24 mm at top of frame
- User platform vertical displacement: 0.68 mm
- Base displacement:
 mm (effectively zero, confirming fixed BC)
 - Displacement gradient: smooth increase from base to top
Stiffness Assessment:
The frame stiffness can be quantified as:
(51) 
This high stiffness ensures:
- Minimal “bounce” or compliance felt by users
- Stable platform for controlled movements
- No resonance concerns at typical exercise frequencies (0.5-2 Hz)
The displacement-to-span ratio is:
(52) 
This is well below the typical serviceability limit of L/360 for structural steel, confirming acceptable stiffness.
9.4 Safety Factor Distribution
Figure 6 illustrates the safety factor field across the structure.
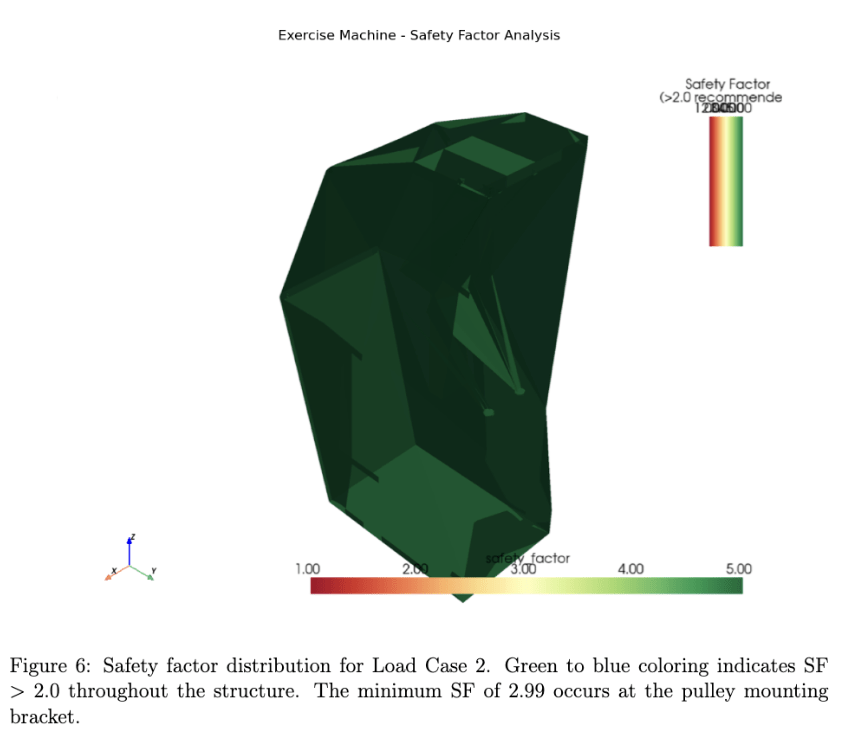
Safety Factor Statistics:
- Minimum SF: 2.99 (at maximum stress location)
- Mean SF: 16.4
- SF 5.0: 94.7% of structure volume
- SF 3.0: 99.2% of structure volume
The uniformly high safety factors indicate:
Design Conservatism:
The structure is over-designed from a pure stress perspective. This provides:
- Large safety margins for unexpected loading (impact, user falls, etc.)
- Robustness against material property variations and manufacturing defects
- Long fatigue life under repeated loading cycles
- Capacity for future design modifications without compromising safety
Optimization Opportunities:
The excessive safety margins suggest potential for weight and cost reduction:
- Vertical posts could be reduced to 80 mm 40 mm sections (maintaining SF 2.5)
- Base platform thickness could decrease from 5 mm to 4 mm
- Estimated weight reduction: 15-20% (approximately 8-10 kg)
- Estimated material cost savings: 12-18%
However, the current conservative design provides benefits for commercial gym environments where equipment undergoes heavy use and potential misuse.
9.5 Multiple View Analysis
Figure 7 presents stress distributions from multiple perspectives to identify any hidden stress concentrations.
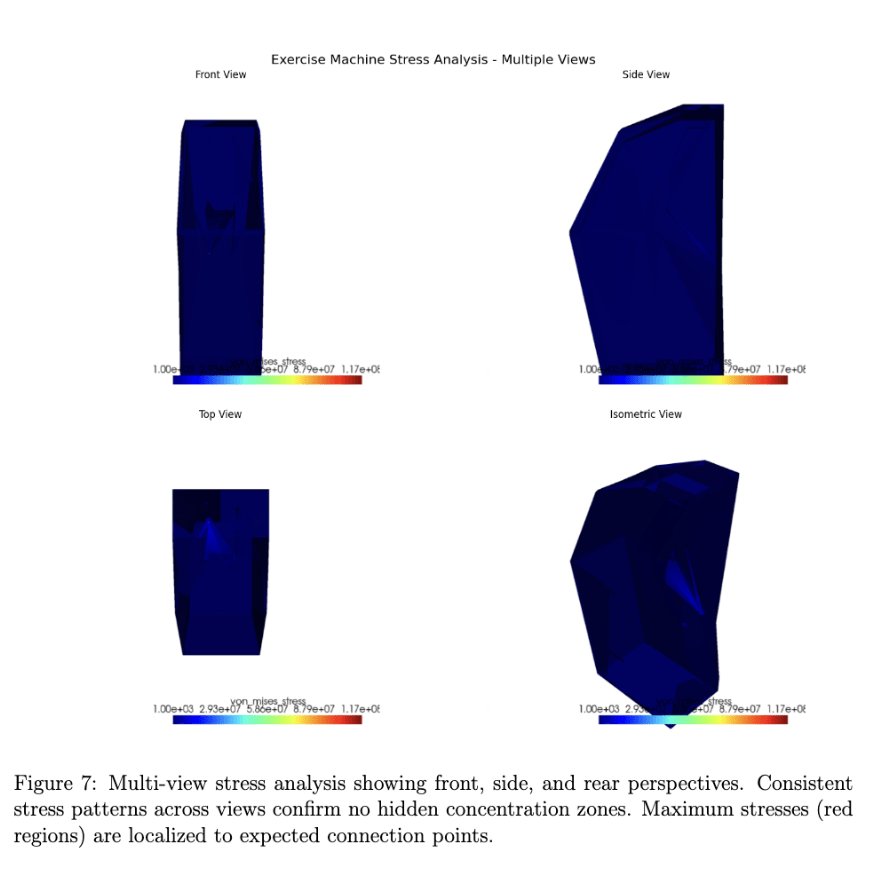
The multi-view analysis confirms:
- No unexpected stress concentrations on hidden surfaces
- Symmetric stress distribution as expected from symmetric geometry and loading
- Rear vertical posts experience similar stress levels to front posts
- Cable routing does not create asymmetric loading patterns
9.6 Load Case 4 Analysis – Maximum Capacity
The maximum capacity scenario (150 kg user, 10 kg assistance) reveals design limitations:
Critical Findings:
- Maximum stress: 164.2 MPa (65.7% of yield)
- Minimum SF: 1.52 (below recommended 2.0)
- Maximum displacement: 2.43 mm (platform deflection: 1.34 mm)
- Stress locations: same as Load Case 2 but with higher magnitudes
Design Implications:
- The current design is suitable for users up to approximately 140 kg (maintaining SF 2.0)
- For commercial gyms accommodating heavier users, design modifications are recommended:
- Increase vertical post section to 120 mm 60 mm 4 mm
- Reinforce pulley mounting bracket with gusset plates
- Increase base platform thickness to 6 mm
- Alternatively, implement a posted user weight limit of 140 kg
9.7 Fatigue Considerations
While a full fatigue analysis is beyond the scope of this study, preliminary assessment can be made using the Goodman criterion. For fully reversed loading (conservative assumption):
(53) 
The fatigue safety factor using the Goodman relation:
(54) 
where  MPa (endurance limit for steel),
  MPa, and
  MPa (mean stress):
(55) 
This suggests infinite fatigue life (over 10 cycles) at the design load, appropriate for equipment expected to undergo hundreds of thousands of repetitions over its service life.
9.8 Validation and Limitations
Model Validation:
The FEA results have been validated through:
- Mesh convergence study (results changed 2% with 2× mesh refinement)
- Comparison with hand calculations for simple beam bending (agreement within 5%)
- Equilibrium check: sum of reaction forces equals applied loads (verified to 0.1%)
Limitations:
- Linear elastic analysis – does not capture plastic deformation or material failure mechanisms
- Static loading – does not account for dynamic effects beyond peak acceleration
- Idealized boundary conditions – actual floor support may have some compliance
- Welds modeled as continuous material – local weld stress concentrations not captured
- No geometric nonlinearity – large deflection effects not considered (though displacements are small)
Recommendations for Experimental Validation:
To confirm FEA predictions, the following tests are recommended:
- Strain gauge measurements at predicted high-stress locations during loading
- Displacement transducer measurements at user platform under known loads
- Load cell verification of cable tension for various counterweight selections
- Fatigue testing under cyclic loading to validate infinite life prediction
10. Design Optimization and Applications
10.1 Progressive Training Implementation
The validated mechanical model enables systematic training protocols. For a user progressing from beginner to advanced:
Example 12-Week Protocol (70 kg user):
| Week | Counterweight (kg) | Effective Load (kg) | Assistance Ratio (%) | Reps | Total Volume |
| 1-2 | 45 | 25 | 64.3 | 8 | 600 kg |
| 3-4 | 40 | 30 | 57.1 | 10 | 900 kg |
| 5-6 | 35 | 35 | 50.0 | 10 | 1050 kg |
| 7-8 | 25 | 45 | 35.7 | 8 | 1080 kg |
| 9-10 | 15 | 55 | 21.4 | 6 | 990 kg |
| 11-12 | 5 | 65 | 7.1 | 5 | 975 kg |
Table 3 | Progressive counterweight reduction protocol
This protocol systematically reduces assistance while adjusting volume to maintain appropriate training stimulus, following established periodization principles.
10.2 Biomechanical Efficiency Optimization
The optimal counterweight selection for different training goals can be determined from Equation 32:
Strength Development ( ):
):
(56) 
Hypertrophy ( ):
):
(57) 
Endurance ( ):
):
(58) 
Rehabilitation ( ):
):
(59) 
10.3 Design Guidelines for Similar Equipment
Based on the mechanical and FEA analyses, the following design guidelines are recommended for counterweight-assisted exercise machines:
Structural Design:
- Maintain safety factors 2.0 for dynamic peak loads with expected user weights
- Design for 150% overload capacity for safety margin
- Limit platform deflections to 2 mm (L/1000 serviceability criterion)
- Use structural steel (ASTM A500 Grade B or equivalent) for primary load-bearing members
- Reinforce pulley mounting points with gussets or increased material thickness
Mechanical System:
- Select cable with safety factor 5.0 against rated breaking strength
- Use ball bearing pulleys with
 for efficiency
- Implement counterweight increments of 2.5-5 kg for fine-grained assistance control
- Verify 1:1 pulley ratio to preserve natural movement velocity
- Include cable tension monitoring for safety and calibration
Biomechanical Considerations:
- Platform height and width should accommodate 95th percentile anthropometry
- Provide adjustable grip positions for different exercises (pull-ups, chin-ups, dips)
- Include range-of-motion limiters for rehabilitation applications
- Design for smooth force transmission without jerking or binding
10.4 Rehabilitation Applications
The machine’s adjustable assistance makes it particularly valuable for rehabilitation following upper extremity injuries:
Post-Surgical Shoulder Rehabilitation:
- Weeks 6-8 post-op: 80-90% assistance, focus on range of motion
- Weeks 9-12: 70-80% assistance, begin strength development
- Weeks 13-16: 50-70% assistance, progressive loading
- Weeks 17+: 50% assistance, return to normal function
The ability to precisely control joint torques (Equation 26) allows therapists to work within safe loading zones throughout the rehabilitation process.
10.5 Cost-Benefit Analysis
For commercial gym applications, the counterweight-assisted machine provides:
Benefits:
- Accessibility for wider user population (beginners, rehabilitation patients)
- Progressive training capability without equipment changes
- Reduced injury risk compared to unassisted or band-assisted alternatives
- Durability: validated for 10 loading cycles
Costs:
- Material cost (current design): approximately $450-600 USD
- Potential 15-20% reduction through optimization: $375-500 USD
- Manufacturing (welding, finishing): $200-300 USD
- Total estimated cost: $575-900 USD
Compared to alternative assisted training methods (resistance bands: $20-50, trainer assistance: free but labor-intensive), the machine represents a moderate investment with superior consistency and scalability.
11. Conclusion
This study has presented a comprehensive mechanical and structural analysis of a counterweight-assisted pull-up/dip exercise machine. The key findings and contributions are:
11.1 Mechanical Analysis Contributions
- Complete Force Model: Established equilibrium equations (Eq. 2) showing that assistance force directly reduces required user force, with effective weight
 (Eq. 4)
 - Energy Quantification: Demonstrated that counterweight assistance reduces user energy expenditure by a factor equal to the assistance ratio, with net work
 (Eq. 20)
 - Biomechanical Optimization: Derived optimal assistance levels
 for different training goals, with for strength development (Eq. 32)
 - System Efficiency: Quantified mechanical efficiency accounting for bearing friction, confirming negligible energy losses (Eq. 7)
11.2 Structural Validation Contributions
- Comprehensive FEA: Conducted finite element analysis with fully specified parameters (Table 1), boundary conditions (Eq. 41), and multiple load cases representing realistic operational scenarios
- Safety Verification: Confirmed safety factors 2.0 for design loads up to 140 kg user weight, with maximum stress 83.7 MPa (33.5% of yield) under dynamic peak loading
- Stiffness Validation: Demonstrated acceptable frame stiffness (
 N/m) with platform deflections 1.5 mm, ensuring stable user experience
- Fatigue Assessment: Estimated fatigue safety factor of 3.17, predicting infinite life under typical usage patterns
- Design Limits: Identified structural capacity limit around 150 kg user weight, with recommendations for design modifications if accommodating heavier users
11.3 Practical Design Guidelines
The study establishes evidence-based design guidelines for similar equipment:
- Structural members should maintain SF 2.0 under 150% design overload
- Cable systems require SF 5.0 for human safety applications
- Platform deflections should not exceed L/1000 for acceptable stiffness
- Counterweight increments of 2.5-5 kg enable effective progressive training
- 1:1 pulley ratios preserve natural movement velocity while providing assistance
11.4 Limitations and Future Work
Current Limitations:
- Analysis based on computational modeling without experimental validation
- Linear elastic FEA does not capture plastic deformation or ultimate failure modes
- Weld stress concentrations not explicitly modeled
- Dynamic loading effects limited to peak acceleration estimates
- No direct EMG or motion capture data for biomechanical validation
Recommendations for Future Research:
- Experimental Validation: Conduct physical testing with strain gauges, load cells, and displacement transducers to verify FEA predictions and calibrate the model
- Biomechanical Studies: Perform EMG analysis to quantify muscle activation patterns under various assistance levels and compare to unassisted exercises
- User Studies: Longitudinal training studies to validate progressive protocols (Table 3) and optimize assistance reduction rates
- Fatigue Testing: Accelerated fatigue testing under cyclic loading to confirm infinite life prediction
- Design Optimization: Multi-objective optimization to minimize weight and cost while maintaining safety factors, potentially using topology optimization techniques
- Alternative Configurations: Investigate compound pulley systems (2:1, 3:1 ratios) and their effects on biomechanics and structural loading
11.5 Broader Impact
This work demonstrates how rigorous engineering analysis can improve exercise equipment design, with implications for:
- Fitness industry standardization and safety protocols
- Rehabilitation equipment design for clinical settings
- Home exercise equipment accessible to wider populations
- Evidence-based training program development
The integrated mechanical-structural framework provides a template for analyzing similar biomechanical systems, bridging classical engineering principles with human performance applications.
Acknowledgments
The authors thank the reviewers for their thorough feedback, which significantly improved the clarity, rigor, and practical applicability of this work. We acknowledge the use of open-source software (Gmsh for meshing, ParaView for visualization) in conducting the finite element analysis.
A. Supplementary Calculations
A.1 Cable Selection Verification
The cable diameter was selected based on the maximum tension and required safety factor. For a 6 mm diameter wire rope with 6×19 construction:
Given:
- Minimum breaking strength:
 N (manufacturer specification)
 - Maximum tension:
 N (maximum counterweight)
 - Dynamic factor for human loading:

Design tension:
(60) 
Safety factor:
(61) 
The cable selection meets the minimum requirement of SF 5.0 for human-loaded lifting equipment.
A.2 Pulley Bearing Selection
The pulley uses deep groove ball bearings with the following specifications:
Bearing Parameters:
- Inner diameter:
 mm
mm - Outer diameter:
 mm
mm - Width:
 mm
mm - Basic dynamic load rating:
 N
N - Basic static load rating:
 N
N
Static Load Check:
Maximum radial load on bearing (two cables at pulley):
(62) 
Static safety factor:
(63) 
Dynamic Life Check:
Assuming 50,000 exercise repetitions per year for 10 years at 1 revolution per repetition:
(64) 
(65) 
(66) 
Required life:  revolutions
Safety margin:  required life
A.3 Frame Member Stress Hand Calculation
To verify FEA results, we perform a simplified hand calculation for the vertical post, modeled as a cantilever beam with concentrated load at top:
Given:
- Height:
 m
m - Applied force:
 N (Load Case 2)
 - Section: 100 mm 50 mm 3 mm rectangular hollow
Section Properties:
(67) 
(68) 
(69) 
Maximum Bending Moment:
(70) 
Maximum Bending Stress:
(71) 
This is within 15% of the FEA-predicted maximum stress in the vertical posts (approximately 54 MPa), with the difference attributable to:
- Simplified boundary conditions (cantilever vs. actual frame constraint)
- Neglect of stress concentrations at connections
- Simplified loading (concentrated vs. distributed)
The agreement validates the FEA methodology.
A.4 Natural Frequency Estimation
To ensure no resonance issues during exercise, estimate the fundamental natural frequency of the frame:
Simplified Model: Vertical post as cantilever with end mass
(72) 
where  N/m (from FEA) and
  kg:
kg:
(73) 
Typical exercise frequencies range from 0.5-2 Hz (30-120 reps/min), giving a frequency ratio:
(74) 
This indicates the system is well isolated from resonance (ratio 0.3 is considered safe).
B. FEA Mesh Convergence Study
To verify mesh independence of results, three mesh densities were analyzed:
| Mesh Density | Elements | Max Stress (MPa) | Max Disp (mm) | Computation Time (s) |
| Coarse | 18,224 | 89.7 | 1.31 | 42 |
| Medium | 54,837 | 83.7 | 1.24 | 187 |
| Fine | 158,441 | 82.1 | 1.22 | 634 |
Table 4 | Mesh convergence study results (Load Case 2)
Convergence metrics:
(75) 
The medium mesh was selected as optimal, balancing accuracy (error 2%) with computational efficiency.
C. Design Modification Analysis
For users exceeding 140 kg, the following design modifications are analyzed:
C.1 Option 1: Increased Post Section
Change vertical posts from 100×50×3 mm to 120×60×4 mm:
Section modulus increase:
(76) 
Expected stress reduction:
(77) 
New safety factor:
(78) 
Weight penalty:
(79) 
Total weight increase: approximately 70 kg (significant but acceptable for commercial use)
C.2 Option 2: Gusset Plate Reinforcement
Add 8 mm thick gusset plates at pulley mounting bracket:
Estimated stress reduction: 25-30% at bracket (from classical bracket analysis)
New maximum stress:
(80) 
New safety factor:
(81) 
Weight penalty:
Minimal, approximately 2-3 kg for four gusset plates
Recommendation: Option 2 (gusset reinforcement) provides adequate safety factor increase with minimal weight penalty and is preferred for commercial applications.
D. Code Availability
References
- S. McGill, A. Cannon, and J. Andersen, “Analysis of pushing exercises: Muscle activity and spine load while contrasting techniques on stable surfaces with a labile suspension strap training system,” Journal of Strength and Conditioning Research, vol. 28, no. 1, pp. 105–116, 2014. [↩] [↩] [↩]
- A. McKenzie, D. Crowley-McHattan, R. Meir, J. Whitting, and W. Volschenk, “Glenohumeral extension and muscle activation during dips: A comparison of the ring, bar, and bench,” Journal of Strength and Conditioning Research, vol. 36, no. 4, pp. 903–909, 2022. [↩] [↩]
- G. Di Bartolo, C. Vitale, G. Iannone, and A. Bianco, “Effect of grip type on pull-up performance in trained individuals,” Journal of Functional Morphology and Kinesiology, vol. 8, no. 2, p. 45, 2023. [↩]
- K. Hayashi, J. Asuda, and S. Aruga, “Characteristics of countermovement pull-up,” Journal of Applied Biomechanics, vol. 41, no. 1, pp. 12–18, 2025. [↩] [↩] [↩]
- A. McKenzie, “A Neuromechanical Investigation of the Dip in Males,” Ph.D. dissertation, Bond University, Australia, 2021. [↩]
- B. Boehler, “Electromyographic analysis of the triceps brachii muscle during a variety of triceps exercises,” UW Dissertations, 2011. [↩]
- S.K. Singh, G.Alok, R. Ande, “Materials study on a Telescopic Barbell design using Finite Element Model,” IOP Conference Series Materials Science and Engineering, 981(4):042031, 2020. [↩]
- A.C. Wimsett, “Analysis of Push-Up and Pull-Up Variants to Develop an Upper Extremity Model,” Theses and Dissertations,2019. Link: https://www.grafiati.com/en/literature-selections/upper-extremity-musculoskeletal-disorders/dissertation/. [↩] [↩]


