
Abstract
As professional and recreational activities increasingly rely on laptops and smartphones, proper ergonomics has become essential in the modern sedentary lifestyle. Slouching or prolonged lumbar flexion from improper posture can lead to musculoskeletal disorders, including low back pain and intervertebral disc herniation. To reduce these risks, posture monitoring and classification systems can detect improper posture and provide immediate corrective feedback. Previous studies have applied CNNs with side-view images or traditional machine learning with front-view images. However, side-view methods require additional cameras that limit practical use, while landmark-based approaches are often sensitive to detection errors. Moreover, many studies rely on small, private datasets due to difficulties in construction and privacy concerns, posing a challenge to ensuring generalization and comparing results across studies. This study classifies posture from frontal webcam images using CNN-based and traditional machine learning models. A synthetic dataset was created with increased image variation to overcome dataset limitations and privacy concerns, and made available publicly. Prediction models classified posture into proper, improper, and cautionary classes on real and synthetic datasets. Ten traditional machine-learning models and five CNN models were compared. Results demonstrate that CNN-based models outperformed traditional machine learning approaches, with AUC values of 0.993±0.007 vs. 0.953±0.048 for distinguishing postures. On the synthetic dataset, CNNs also demonstrated robustness and effectiveness (0.928±0.008 vs. 0.833±0.033). These results underscore the feasibility of developing front-facing webcam-based posture monitoring applications using deep learning methods to enhance ergonomic practices during computer use.
Keywords: Robotics and Intelligent Machines; Machine Learning; Deep Learning, Classification; Ergonomics; Sedentary Posture; Body Landmark Detection
Introduction
As professional and recreational activities increasingly rely on laptops and smartphones, postural habits in daily life have significant implications for spinal health in the digital age. In particular, prolonged sitting with poor posture, such as slouching or hunching, exerts considerable pressure on the intervertebral discs. These poor postures can potentially lead to various musculoskeletal disorders and may also require surgical interventions1’2. Currently, more than 600 million individuals worldwide suffer from back pain, and the patient population continues to rise as sedentary lifestyles become widespread3. Recent data indicate that adults and children spend an average of nine and twelve hours sitting per day, respectively, with more than three and a half hours typically allocated to computer use4’5. Besides the physical discomfort that people may experience, a graver problem is that such poor postural habits often go overlooked until they manifest as back pain or more serious conditions, such as herniated discs. Given the potential health complications, associated healthcare costs, and impact on quality of life, preventative measures to maintain proper sitting postures are worth investigation6. To solve this problem, previous studies have attempted to classify posture using machine learning or deep learning based on physical sensors or images; however, these approaches have limitations in both usability and performance due to the need for additional devices and landmark detection errors.
This study explores posture classification using both traditional machine learning models and Convolutional Neural Network (CNN)-based deep learning models, based on the frontal-view images, which can be readily obtained from built-in webcams in typical working environments. Evaluating these approaches demonstrates how different levels of information from image frames influence classification performance. Ten traditional machine learning models were tested, including Logistic Regression, Support Vector Machine, Random Forest, Extra Trees, Gradient Boosting, XGBoost, LightGBM, CatBoost, K-Nearest Neighbors, and Multilayer Perceptron, while CNN-based models investigated included AlexNet, DenseNet, ResNet, and VGGNet.
In addition, previous studies have generally relied on small datasets, making it challenging to evaluate model generalizability and compare results across studies. Dataset sizes were typically limited because collecting large datasets was burdensome, and publishing human face datasets was constrained due to privacy concerns. To address these issues, in this study, a synthetic dataset was constructed using obtained image data and made publicly available on GitHub.
In summary, the main contributions of this study are:
- Posture classification was comparatively explored using both traditional machine learning models and CNN-based deep learning models, based on frontal-view images that are practical for real-world use, as they can be readily obtained from built-in webcams.
- A synthetic dataset was constructed to increase image diversity and enhance generalization, and was released to enable comparison of results across studies without raising privacy concerns.
The remainder of this paper is organized as follows. In Related Work, previous posture classification studies and their limitations are introduced. In Methods, the construction processes of both real and synthetic datasets are explained, and the operation of traditional machine learning and deep learning models using these datasets is described. The Results section provides detailed descriptions of the experimental parameters used and demonstrates the performance of the two types of models. In the Discussion, the findings are analyzed and interpreted, and finally, the Conclusion summarizes the study and highlights its key contributions.
Related Work
Physical sensors have previously been used to develop artificial intelligence (AI) models for posture analysis. One such proposed method is to create a dynamic chair to identify and predict postures for live adjustments7. Pressure sensors and electronics have also been researched for wheelchairs to collect data and classify postures in real time8’9’10 . Despite the AI-driven classification, these methods require additional equipment, limiting their practicality in everyday settings.
In addition to hardware-based models, classification through images has also been explored. CNN-based image classification has been tested with side-view images11. Still, using side-view images requires an additional camera in typical laptop-based working environments12. Although front-view images have also been used in prior studies, only traditional machine learning models based on hand-crafted features have been evaluated13, without applying CNN models that could provide better classification performance for two-dimensional image data.
Unlike these approaches, this study classifies posture from webcam-based frontal images, which can be easily captured in everyday settings, using both traditional machine learning and CNN-based deep learning models, and evaluates their comparative performance.
Methods
The methodology is divided into two main sections: dataset construction and posture classification processes, which are described sequentially in this section. For data construction, as illustrated in the top row of Figure 1, real and synthetic image datasets are created along with annotations. Using these datasets, both traditional machine learning models and CNN-based deep learning models are trained for posture classification to assess how different levels of image information in the data influence classification performance (bottom row of Figure 1).

Dataset Construction
Data Acquisition
Fourteen volunteers were recruited for this study with informed consent. The first step in constructing the dataset for posture identification from a frontal view is to collect videos from both the front and side views simultaneously, as posture is more easily distinguishable from the side view. This ensures accurate annotation for the frontal view. Specifically, one smartphone was positioned to capture lateral-view videos from the right-hand side of a subject, while the laptop’s built-in camera simultaneously recorded front-view videos. After the lateral video began recording, the subject started the front-view webcam video with a beep sound. The subjects were then given verbal instructions every 3-5 seconds to transition between proper and improper postures. After approximately 30 seconds of changing postures in this way, the subject paused the front-view webcam video before the smartphone video in the lateral-view was stopped. This process was repeated for all fourteen volunteer subjects. Each pair of videos was then synchronized by precisely aligning the start of the frontal videos with the peak of the starting sound waveform amplitude captured in the lateral videos, and the excess frames at the beginning and end of the lateral videos were trimmed (Figure 2). Every frame was extracted from each 30 frames per second (FPS) video using OpenCV, resulting in approximately 13,400 image frames across the fourteen subjects. Lastly, each frame was cropped to 512×512 pixels around the subject’s face to match the resolution of the synthetically generated images, as described under “Synthetic Data Generation”.

Data Annotation
Labels for the posture image frames were created to classify the postures into three classes: proper posture, improper posture, and cautionary posture. Instead of using binary classes (i.e., proper and improper postures), a transitional posture class, denoted as ‘cautionary’ throughout the paper, was included between them to enable the prediction model to alert users of a potential shift toward poor posture, serving as a cautionary warning system within the application. For example, the real-time posture monitoring system can issue alerts when users deviate from proper posture, thereby enabling early intervention before a significant change occurs. To protect data privacy, particularly for videos containing human subject faces, the entire annotation process was conducted locally without relying on any cloud-based labeling platforms such as Amazon Mechanical Turk (MTurk)14.
Each time frame was labeled as proper, improper, or cautionary posture using two fundamental criteria: verbal instruction-based qualitative definitions and anatomical angle-based quantitative criteria. The first criterion is based on prior knowledge of the continuity of body postures following the verbal instruction during data acquisition. The second criterion is based on key anatomic angles that define proper (e.g., straight neck and torso) and improper postures. Specifically, the sequence of verbal instructions from the lateral-view videos was used to manually determine continuous intervals of proper and improper postures. The neck, torso, and shoulder angles extracted from the front- and lateral-view images using the MediaPipe Pose library were then used to refine the boundaries distinguishing transitional posture from either proper or improper posture (Figure 3)15.

Once the proper and poor regions were defined using both qualitative and quantitative angle-based criteria, the overlapping areas of these regions were designated as the final annotation for proper and poor postures (Figure 4). The rest of the regions were labeled as cautionary, which is the transition period between the proper and poor postures. Regarding the anatomical angle criteria, a straight neck angle, a straight torso angle, and a horizontal shoulder alignment fundamentally constitute proper posture. Therefore, using neck and torso angles, two critical side-view angles were calculated: the neck angle, defined as the angle between the neck vector and a vertical vector, and the torso angle, defined as the angle between the torso vector and a vertical vector.
To determine the angular thresholds, various combinations of torso, neck, and shoulder angles were iteratively tested to maximize agreement with the verbal instructions while avoiding regions with frequent subtle angle changes due to the rule-based threshold method, thereby reducing labeling fluctuations. For example, although the rule-based threshold method resulted in a ‘Cautionary’ posture label around 30 seconds in Figure 4, this region was labeled as ‘Proper’ posture corresponding to verbal instructions to eliminate inconsistencies. The following thresholds were adopted to provide clear boundaries between label transitions:
- Proper posture: neck angle < 38° AND torso angle > 163° AND shoulder angle > 175°

- Improper posture: neck angle > 43° OR torso angle < 155° OR shoulder angle < 165°
- Cautionary posture: otherwise (38° < neck angle < 43° OR 155° < torso angle < 163° OR 165° < shoulder angle < 175°)
As a result, the proportions of proper, proper and cautionary postures were 36%, 33% and 31 %, respectively.
Synthetic Data Generation
A synthetic dataset was constructed alongside the real dataset to increase the dataset’s diversity and robustness and address data privacy concerns. For this dataset, synthetic images corresponding to each real frame were generated with variations in subject and background, while maintaining identical postures, since posture is the most critical factor in this study. To best replicate the postures of the human subjects, a ControlNet v1.1 model based on StableDiffusion v1.5, a text-to-image diffusion model, was utilized17’18. The model can precisely control the structure of generated images through spatial conditions—specifically, image depth conditions in this study.
To introduce variation in subjects and backgrounds, the prompts provided to the diffusion model included seven categories: age, gender, lighting, clothing, ethnicity, body shape, and background. Each category contained 10 different phrases, except for background, which included approximately 100 different backgrounds. The total number of possible prompts was 108, as a prompt was created by randomly selecting one phrase from each category, for example: “young adult woman, natural light lighting, wearing casual clothes, standing in a city street, East Asian, slim body, in a café, with long hair.” One unique prompt is generated for each frame of the original dataset, resulting in approximately 13,400 prompts. Each depth image estimated from the real images was then combined with its prompt into the ControlNet v1.1 model to generate a synthetic image with the same posture, as shown in Figure 5, while retaining the same label as the corresponding real frame19.

Traditional Machine Learning Model Development
Ten traditional machine learning models were built to classify postures based on numerical feature data derived from anatomic landmarks detected in the frontal view. Distances and angles between the facial and shoulder landmarks were employed to convert 2D image data into tabular feature data for training and testing classification models. Specifically, posture-related features were extracted from the images and were saved as a comma-separated variable (csv) file. Feature selection algorithm was then applied to choose the most important set of features from the collected feature set, removing irrelevant or redundant ones (bottom left diagram of Figure 1). These selected features were finally input into machine learning models for posture classification (bottom right diagram of Figure 1).
Feature Extraction
For developing machine learning models, each 2D image data was converted into 1D feature vector based on anatomic landmarks detected: the distance from each shoulder landmark to each facial landmark, the angle between the vectors from each facial landmark to left and right shoulder landmarks, and the horizontal tilt of the shoulders. These distances and angles can help distinguish postures. When individuals hunch their backs in a poor posture, their heads move down relative to their shoulders, shortening the distance from the facial landmarks to the shoulders and decreasing the angles they make with the shoulders. When the back is straightened in a proper posture, the head moves higher, increasing those distances and decreasing angles. During the transition between poor and proper postures (cautionary), the distances and angles fall between the two extremes. Horizontal shoulder tilt was also calculated as a feature, as proper postures require level shoulders, poor postures may show heavily skewed shoulders, and cautionary postures may show slightly skewed shoulders.
These features were calculated from each image frame in both the real and synthetic datasets. To create the features, landmarks were first extracted from each frame. For the face, Dlib’s 68-point facial landmark predictor was utilized to identify the pixel coordinates of 68 facial landmarks. For the body, MediaPipe Pose was used to detect the left and right shoulder landmarks. The locations of these landmarks can be seen in Figure 6. Two distance and two angle features were then calculated for each facial landmark. For the distance features, the distances from the facial landmark to the left and right shoulders were calculated. For the angle features, the angle a facial landmark made with a shoulder was measured by calculating the angle between the vector connecting the facial and shoulder landmarks with a horizontal vector (Figure 6). A final feature, shoulder angle, was calculated by measuring the angle between a vector connecting the two shoulder landmarks and a horizontal vector, resulting in a total of 273 features.
Feature Selection
To reduce overfitting and improve generalizability, identifying the most important feature set is necessary. A Boruta SHAP algorithm was employed to rank the features by importance, followed by correlation analysis to further narrow down the important features by removing collinearity. Boruta SHAP is a feature selection technique that combines the Boruta algorithm with SHAP (SHapley Additive exPlanations) values to assess the contribution of each feature toward model prediction20. Briefly, using a Random Forest as the base estimator, Boruta SHAP iteratively compares original features with their randomly shuffled versions, i.e., shadow features, ranking them by their contributions.
Once features were ranked by importance, correlation coefficients were computed to remove highly correlated features. Specifically, starting from the most important feature, each feature was compared with those of lower importance, and features with a correlation above a set threshold were removed. This process was repeated for the next most important unremoved feature. Correlation thresholds of 0.80, 0.85, 0.90, 0.95, and 0.99 were tested, with 0.95 yielding a reasonable number of features (23) and achieving a sufficient AUC of 0.951 on average over the ten prediction models. As a result, the total number of features was reduced from 273 to 23. This feature selection process ensures that only robust, non-redundant features are used to train the machine learning models.
Of these landmarks, most of the selected landmarks were located along the outer edge of the face, particularly the side edge (Figure 6).

Biomechanically, these regions are most sensitive to head rotation and movement, producing greater angle changes than central landmarks of the face. Notably, the selected landmarks are also symmetrically distributed relative to the facial midline. In addition, the chin, being closest to the shoulders, could serve as an effective feature as it exhibits the most significant angle changes relative to the shoulders as the head’s vertical position shifts between postures.
Machine Learning Models
The traditional machine learning models classified posture using selected 23 one-dimensional feature vectors extracted from images. To evaluate the different algorithms, ten machine learning classifiers were employed from different methodological categories (linear, margin-based, tree/bagging-based, boosting-base, and neural network based), and implemented with scikit-learn library21.
- Linear Model
- Logistic regression: A linear model that learns a decision boundary and outputs probabilities using the sigmoid function22. It is efficient for both binary and multiclass classification problems, under the assumption of linear separability between features and outputs.
- Margin/Distance-based ModelSupport Vector Machine (SVM): A margin-based classifier that finds the optimal hyperplane by maximizing the margin between support vectors23. The radial basis function (RBF) kernel is used to handle non-linear decision boundaries.
- K-Nearest Neighbors (KNN): An instance-based learning method that classifies new samples according to the majority label among the k nearest neighbors in the feature space, typically using Euclidean distance as the similarity measure24.
- Tree/Bagging-based ModelRandom Forest (RF): An ensemble of decision trees trained on bootstrapped subsets of the training data and aggregated by averaging predictions25. It is resistant to overfitting and effectively captures feature interactions.
- Extra Trees (ET): A variant of Random Forest that introduces additional randomness by selecting split thresholds randomly rather than optimally26. This often improves generalization at the cost of slightly higher variance.
- Boosting-based Model
- Gradient Boosting Trees (GBT): A sequential ensemble technique that builds decision trees one at a time, each correcting the residual errors of the previous one27. The model minimizes a specified loss function using gradient descent.
- LightGBM: A high-performance gradient boosting framework that employs histogram-based algorithms and leaf-wise tree growth, enabling both speed and accuracy28. It is particularly effective for large-scale and high-dimensional datasets.
- XGBoost: An optimized gradient boosting implementation with regularization and parallel processing29. It is especially effective for imbalanced classes and noisy data.
- CatBoost: A gradient boosting method that natively handles categorical features 30. It employs ordered boosting to reduce prediction shift and mitigate overfitting.
- Neural Network Model
- Multilayer Perceptron (MLP): A fully connected feedforward neural network trained using backpropagation31. In this study, the MLP contained one hidden layer with 100 neurons using ReLU activation), followed by a softmax output layer for classification.
Deep Learning Model Development
While traditional machine learning models classify posture using hand-crafted features, convolutional neural network (CNN)—based deep learning models predict posture directly from raw image data, which provides uncurated and information-rich representations (bottom-right diagram of Figure 1).
Deep Learning Models
Deep learning models classify posture directly using real or synthetic images. The following four deep learning algorithms were tested for comparison. All images were resized to 224×224 resolution and normalized.
- AlexNet: Consists of five convolutional layers and three fully connected layers, using ReLU activation and dropout regularization to enable effective training on moderately sized image datasets32.
- VGGNet: Characterized by a deep architecture with sixteen weight layers, employing small 3×3 convolutional kernels and consistent max pooling for hierarchical feature extraction33. Achieves strong performance on visual classification benchmarks.
- ResNet: Introduces residual connections to address the vanishing gradient problem in very deep networks34. In this study, ResNet18 and ResNet50 variants are used, allowing efficient training without degradation in accuracy.
- DenseNet: Connects each layer to every other layer in a feed-forward manner, promoting feature reuse and reducing the number of parameters35. Its compactness and efficiency make it suitable for learning subtle differences in posture.
Results
The performance of prediction models is compared across four aspects: (1) image type (real or synthetic), (2) presence of the cautionary class, (3) evaluation metrics, and (4) prediction model types. In particular, since the transitional period (i.e., cautionary class) between the proper and improper postures may contain significant ambiguity, performance metrics were evaluated separately for the proper and improper classes only, excluding the cautionary class.
Evaluation Metrics
Both traditional machine learning models and deep learning models are evaluated using stratified 5-fold cross-validation with four metrics: Area Under the Receiver Operating Characteristic Curve (ROC AUC), Accuracy, Cohen’s Kappa, and Matthew’s Correlation.
The ROC AUC measures how well a model distinguishes between classes across all decision thresholds and provides a robust metric independent of the threshold value for the predicted probability36. AUC values near 0.5 indicate no discriminative ability (i.e., random prediction), values between 0.7-0.8 indicate acceptable discrimination, 0.8-0.9 indicate excellent discrimination, and values above 0.9 indicate outstanding discrimination.
Accuracy measures overall correctness by the proportion of total predictions that a model correctly classifies based on the counts of true positives (TP), false positives (FP), true negatives (TN), and false negatives (FN), and is defined as:
![\[\text{Accuracy}= \frac{TP+TN}{TP+FP+TN+FN}\]](https://nhsjs.com/wp-content/ql-cache/quicklatex.com-8f92ca3b8a5cb004dd6726cad0d6fe60_l3.png "Rendered by QuickLaTeX.com")
Although accuracy metric does not have universally standardized interpretation category due to its dependency on the class balance of dataset, the following interpretation is used: values below 0.6 indicate poor performance, 0.6-0.7 indicate fair performance, 0.7-0.8 indicate moderate performance, 0.8-0.9 indicate good performance, and values above 0.8 indicate excellent performance.
Cohen’s Kappa ( ) represents the agreement between the predicted and actual labels while accounting for chance, and is defined as37::
![\[\kappa = \frac{p_o - p_e}{1 - p_e}\]](https://nhsjs.com/wp-content/ql-cache/quicklatex.com-e4545fee727b989a31c93a973010f260_l3.png "Rendered by QuickLaTeX.com")
where 
represent observed agreement and expected agreement by chance, respectively. The interpretation of κ values is as follows: below 0.20 indicates slight agreement, 0.21-0.60 indicates fair to moderate agreement, 0.61-0.80 indicates substantial agreement, and above 0.80 indicates almost perfect agreement.
Matthew’s Correlation Coefficient (MCC) assesses the classification quality by considering true positives, false positives, true negatives, and false negatives, providing a balanced measure even for imbalanced dataset38.
![\[\text{MCC} = \frac{TP \times TN - FP \times FN}{\sqrt{(TP + FP)(TP + FN)(TN + FP)(TN + FN)}}\]](https://nhsjs.com/wp-content/ql-cache/quicklatex.com-643e2fe27926290bdc8bee5626018484_l3.png "Rendered by QuickLaTeX.com")
The interpretation of MCC values is as follows: values below 0 indicate systemic disagreement, values near 0 indicate random prediction, 0.30-0.5 indicate moderate agreement, 0.5-0.7 indicate strong agreement, 0.7-0.9 indicate very strong agreement, and values above 0.9 indicate almost perfect agreement.
Implementation of Machine Learning Models
The specific settings applied to each traditional machine learning model are as follows. First, feature scaling was applied using the Standard Scaler. For the Logistic Regression model, a maximum iteration limit of 1000 was used to ensure convergence. For the Support Vector Machine classifier, a Radial Basis Function (RBF) kernel was used to capture nonlinear relationships among features. Probability estimates were enabled for AUC calculation, with other parameters set to their default values. The K-Nearest Neighbors (KNN) classifier was instantiated with five neighbors, and Euclidean distance as the default metric. Class prediction was based on majority voting among the five closest data points in feature space, with other hyperparameters at default values. The Random Forest classifier was implemented with bootstrapping, 100 estimators, and no maximum depth. It was also used to perform feature selection through the BorutaShap wrapper, which identified relevant features via Gini importance over 100 trials. The Extra Trees classifier was implemented similarly to the Random Forest classifier, with 100 estimators in the default configuration. Gradient Boosting Tree was implemented with a learning rate of 0.1, 100 estimators, and a subsample of 1. The LightGBM model was trained using the LGBMClassifier implementation with default parameters, including a learning rate of 0.1 and gradient-based one-sided sampling. The XGBoost classifier was implemented with default hyperparameters, including a learning rate of 0.3, maximum depth of 6, and 100 estimators. The CatBoost classifier was instantiated with default parameters. The Multilayer Perceptron classifier comprised a single hidden layer containing 100 neurons with ReLU activation function. Training was performed using stochastic gradient descent with the Adam optimizer, a maximum iteration count of 300, and default regularization parameters.
Implementation of Deep-learning Models
To evaluate the effectiveness of deep learning architectures for posture classification, systematic experiments were conducted by fine-tuning pretrained CNN models. Specifically, four CNN models (ResNet, DenseNet, AlexNet, and VGGNet) were initialized with pretrained ImageNet weights, and their final linear layer was replaced with one outputting three logits for posture classes. For each model, the fine-tuned layers were determined according to the model architecture and the number of trainable parameters (Table 1). Since AlexNet and VGGNet consist of multiple fully connected layers near the output, the last two linear layers were fine-tuned. In contrast, DenseNet and ResNet consist of convolutional layers followed by a single fully connected layer; therefore, convolutional layers along with the final linear layer were fine-tuned. As shown in Table 1, DenseNet and ResNet had fewer trainable parameters than AlexNet and VGGnet, since convolutional layers have relatively fewer parameters than linear layers.

The following implementation details were applied to train these CNN-based models. All models were trained on an NVIDIA A100 GPU (40 GB memory, Google Colab Pro+). A batch size 512 was used for up to 30 epochs, with early stopping (patience of 5 epochs) applied based on validation accuracy after 10 epochs. During training at each epoch, the best-performing model by validation accuracy was checkpointed for final evaluation. The Adam optimizer with a 0.001 learning rate was used for all models, and random horizontal flipping was applied for data augmentation.
Performance of Traditional Machine Learning Models
The performance of 10 individual machine learning models is summarized in Table 2. On average, traditional machine learning models achieved an AUC of 0.953±0.048 and an Accuracy of 0.856±0.070 on the real image dataset for distinguishing all three postures, both indicating excellent performance. Cohen’s Kappa (0.783±0.106) and MCC (0.786±0.103) also indicated high agreement. For distinguishing proper and improper postures without the cautionary class, performance improved to an AUC of 0.969±0.036, an Accuracy of 0.916±0.044, a Cohen’s Kappa of 0.847±0.072, and an MCC of 0.854±0.068.
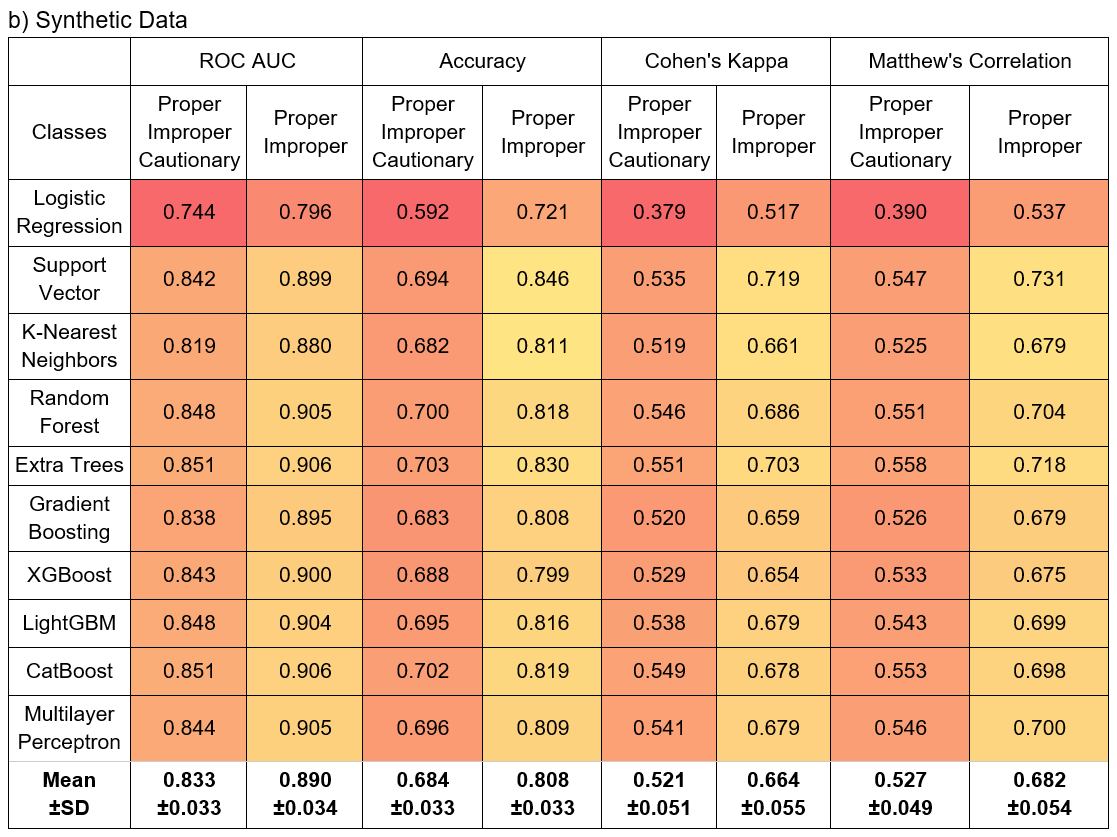
On the synthetic dataset, performance across all models was lower for distinguishing all three postures (AUC: 0.833±0.033; Accuracy: 0.684±0.033; Cohen’s Kappa: 0.521±0.051; MCC: 0.527±0.049). However, classification of proper versus improper postures maintained reasonable performance (AUC: 0.890±0.034; Accuracy: 0.808±0.033; Cohen’s Kappa: 0.664±0.055; MCC: 0.682±0.054). Models consistently performed better without the cautionary posture class in both real and synthetic datasets.
Performance of Deep Learning Models
The performance of five CNN-based deep learning models is summarized in Table 3. On average, deep learning models achieved an AUC of 0.993 ± 0.007 and an Accuracy of 0.949 ± 0.036 on the real image dataset for distinguishing all three postures, both substantially better than the performance of traditional machine learning models. Cohen’s Kappa (0.923 ± 0.054) and MCC (0.924 ± 0.053) also indicate excellent agreement. For distinguishing proper and improper postures without the cautionary class, performance improved to an AUC of 0.996 ± 0.004, an Accuracy of 0.974 ± 0.012, a Cohen’s Kappa of 0.950 ± 0.023, and an MCC of 0.951 ± 0.022.

a) Real Data
On the synthetic dataset, as with the traditional machine learning models, performance across all CNN models was lower for distinguishing all three postures (AUC: 0.928 ± 0.008; Accuracy: 0.814 ± 0.013; Cohen’s Kappa: 0.720 ± 0.020; MCC: 0.721 ± 0.019). However, classification of proper versus improper postures remained at reasonable levels (AUC: 0.952 ± 0.006; Accuracy: 0.870 ± 0.008; Cohen’s Kappa: 0.763 ± 0.013; MCC: 0.775 ± 0.013). Models consistently performed better without the cautionary posture class in both datasets.

a) Real Data

Discussion
In this section, two approaches for sedentary posture classification using front-view webcam images are compared: traditional machine learning models trained on hand-crafted features from anatomical landmarks, and deep learning convolutional neural network models trained on features automatically extracted from raw images. In addition, the impact of image diversity in the datasets on classification performance is assessed by comparing results from the real and synthetic datasets. Finally, the limitations of this study are discussed.

Performance Comparison of Traditional Machine Learning Models
A consistent performance trend was observed across all four evaluation metrics, though individual models exhibited varying performance levels. Logistic regression demonstrated the lowest performance across all metrics, likely due to its simple linear architecture. On the real dataset, most models achieved similar performance except for the Support Vector and Gradient Boosting Trees, which underperformed in Accuracy, Cohen’s Kappa, and Matthew’s Correlation Coefficient. On the synthetic dataset, however, these two models performed at levels comparable to the majority of models. The Support Vector Machine even outperformed all models in terms of Accuracy, Cohen’s Kappa, and Matthew’s Correlation Coefficient when the cautionary posture class was excluded. On the contrary, the K-Nearest Neighbors classifier showed the opposite trend, performing among the best on the real dataset but ranking second lowest on the synthetic dataset, ahead of only Logistic Regression.
The lower performance on the synthetic dataset can be attributed to the greater variation in facial structures and backgrounds in the synthetic dataset as it contains approximately 13,400 combinations compared to the real dataset. In addition, the Dlib facial landmark predictor, trained on real human faces in the iBUG 300-W dataset39’40, may show reduced detection accuracy on the synthetic faces, potentially due to inherent limitations of the generative model compared to real human data (Figure 5). Notably, models performed consistently better without the cautionary posture class across all metrics in both datasets (Figure 7). This is likely because the cautionary posture represents a transitional state between proper and improper postures, resulting in greater feature overlap and less distinct classification boundaries.
Comparison with Weber and Nadeem’s study provides practicality of the proposed approach13. Both studies classify posture from frontal images using traditional machine learning approaches. However, Weber and Nadeem relied on eight OpenPose-derived keypoints extracted from frontal images and applied only binary labels of good (Normal) and bad (Back/Forward) postures. Therefore, their best-performing models—Gradient Boosting Tree (0.91), Random Forest (0.89), Support Vector Machine (0.83), and Logistic Regression (0.83)—were compared with results from this study without the cautionary class (Table 2A). Random Forest (0.938) and Support Vector Machine (0.906) in this study outperformed their reported accuracy, while Gradient Boosting Tree (0.902) and Logistic Regression (0.799) showed similar performance. Although direct superiority cannot be claimed due to differences in datasets and experimental setups, these findings suggest comparable or better accuracy, supporting its practical utility.
In terms of dataset augmentation to address the limitations of a small dataset, Weber and Nadeem generated synthetic data by modeling keypoint distributions with a Gaussian distribution, whereas this study constructed entirely new synthetic images with varied faces, textures and backgrounds using a generative diffusion model. As shown in this study, however, performance on real image data was greater than the synthetic image data since the evaluation set may have strong similarity and correlations between consecutive frames. In this respect, the diffusion model-based data augmentation approach proposed in this study can provide greater variability in the dataset than their data augmentation approach for evaluation and thus can help improve the robustness of the prediction model for both traditional machine learning models and CNN-based models.
Performance Comparison of Deep Learning Models
Although performance across all four metrics was excellent and showed a consistent trend, the models exhibited slight variation in relative performance. AlexNet and VGGNet (AUC: 0.982-0.988 on the real dataset; 0.918-0.922 on the synthetic dataset) performed slightly worse than DenseNet and ResNet (AUC: 0.997-0.998 on the real dataset; 0.931-0.939 on the synthetic dataset). This difference is likely attributable to the fine-tuning strategy: only the linear layer was fine-tuned for AlexNet and VGGNet, whereas both the linear and convolutional layers were fine-tuned for DenseNet and ResNet. Linear layers flatten the image into one-dimensional vectors, resulting in loss of structural information about the image data, whereas convolutional layers preserve spatial structure. Training both types of layers therefore provides richer information to the CNN-based models, potentially improving classification.
Similar to the traditional machine learning models, the deep learning models performed better on the real dataset than on the synthetic dataset, although the difference was smaller. Unlike the real dataset, the synthetic dataset contains a wide variety of backgrounds and subjects, which has a similar effect to applying diverse augmentation techniques not only to the training set but also to the test set, thereby enhancing the models’ generalization ability but making the evaluation set more challenging. The models also showed slightly better performance without the cautionary class than with it. Since cautionary postures lie between distinctly proper and improper postures, the boundaries and pattern differences are more subtle and difficult to detect, reducing classification performance even for the CNN-based approaches.
Hand-Crafted Feature-based Traditional Machine Learning vs. Automatic Feature-based Deep Learning
This study highlights a fundamental trade-off between interpretability and performance when comparing traditional machine learning models with convolutional neural networks trained on raw image data. Compared to deep learning models, traditional machine learning models trained on hand-crafted features extracted from anatomical landmarks provide greater interpretability but relatively lower performance due to the inherently limited generalizability associated with the finite number of hand-crafted feature sets available prior to the standard feature selection process.
For example, hand-crafted features derived from anatomical landmarks (e.g., shoulder slope, facial height, and tilt) allow for direct interpretation and insight into posture classification. These features, informed by ergonomic principles, provide an understanding of which physical attributes most strongly contribute to detecting proper or improper posture. Feature selection further highlights the most critical areas of the face or torso for posture classification. Machine learning models trained on these selected features demonstrate reasonable and consistent performance across metrics, with the exception of Logistic Regression (AUC < 0.9). While landmark-based feature engineering enhances interpretability of the prediction model, it results in lower performance compared to deep learning approach (Figure 7), likely due to the limited number of landmarks identified (Figure 6).
In contrast, deep learning models trained on raw front-view images demonstrate superior performance across all four metrics and on both real and synthetic datasets, surpassing all traditional machine learning models. These results suggest that CNNs can autonomously extract complex posture-relevant visual cues – such as curvature of the shoulders and creasing of the skin and clothing – that would otherwise be difficult or impossible to quantify through landmark angles and distances alone. In addition, the use of pretrained models enables transfer learning from large-scale image datasets, allowing more complex architectures to effectively extract visual features even with a relatively limited dataset. Owing to the robustness of CNN model resulting from these aspects, the performance difference between the real and synthetic data (AUC: 0.993 vs. 0.928; difference: 0.064) is much smaller than that observed with traditional machine learning approaches (AUC: 0.953 vs. 0.833; difference: 0.120). However, due to the nature of CNNs, these automatically learned features are less interpretable than hand-crafted features.
Overall, the results show that while CNN-based deep learning models capture more extensive patterns for superior performance, hand-crafted features offer greater interpretability, providing clearer insight into the key anatomical cues for posture classification and correction.
Real vs. Synthetic Dataset
To avoid privacy concerns and augment data samples, a synthetic dataset was created for each frame and made publicly available in this study. Observing a performance decrease in the synthetic datasets compared to the real dataset clearly demonstrates the impact of image variation on the prediction performance.
On the synthetic dataset, however, both traditional machine learning and CNN-based deep learning models showed a noticeably narrower interquartile range of evaluation metrics compared with the real dataset (Figure 7). This smaller spread suggests that the models behaved more consistently with learning consistent patterns when trained on the synthetic data, even though the absolute performance of the models was lower than on real images. The reduced variability across algorithms and metrics indicates that the synthetic dataset effectively provides a structured dataset from which all models can learn consistently.
This finding suggests that the synthetic dataset is well-structured such that models can perform consistently across different algorithms despite the challenges associated with the greater variation of faces, textures, and backgrounds in the generated images. Moreover, it illustrates the utility of synthetic data in posture classification tasks where real human data is limited due to privacy concerns.
Limitations
This study has several limitations. The original dataset on which the synthetic data is based is relatively small and lacks demographic and conditional diversity, which limits its generalizability. While the synthetic images vary in background and subject appearance, they lack additional variation in posture because the depth condition extracted from the real dataset is retained to preserve original postures, which are critical for classification.
Since the landmark detection models used in this study are trained solely on real human face data (i.e., the iBUG 300-W dataset), the landmark extraction performance could likely be compromised on the synthetic images. This could reduce the effectiveness of traditional machine learning models even further compared with their performance on original image data. Training the landmark detection model on similar synthetic images could help address this limitation.
Future improvements include expanding the dataset by enrolling more diverse populations, incorporating 3D pose data, and developing hybrid models combining landmark-based and raw image features to enhance performance and robustness. Further research into utilizing both synthetic and real domains for training may also improve the applicability of synthetic data for CNNs.
Conclusion
This study, by applying traditional machine learning and deep learning models, investigates the feasibility of developing a posture monitoring system using front-facing webcam images that can be efficiently utilized in everyday environments without additional equipment. The prediction models classify images into three categories—proper, improper, and cautionary posture—where the cautionary class is introduced as a transitional state between proper and improper postures to alert users of a potential shift towards poor posture. For training the models, this study utilized a real human-face image dataset and a synthetic human-face dataset generated using a diffusion model. While addressing privacy concerns, the synthetic dataset effectively improved its diversity by varying age, gender, lighting, clothing, ethnicity, body shape, and background. The synthetic dataset is made publicly available to facilitate performance comparisons with future research. Using the real and synthetic datasets, 10 traditional machine learning algorithms and 5 CNN-based deep learning models were trained and compared. The results show that CNNs consistently outperformed traditional models and demonstrated higher robustness on the synthetic dataset. These findings highlight the strength of CNN models in learning complex spatial patterns from both real and synthetic image data. The proposed system shows potential for increasing postural awareness in daily life, particularly in laptop environments. Future development of real-time applications using built-in device cameras could provide immediate corrective feedback to users, thereby improving ergonomics, promoting healthier behaviors, and potentially reducing associated medical costs.
Data Availability
The raw image data and posture labels are shared only for the synthetic dataset and available on GitHub (https://github.com/bokchoyo/ErgonomicsData) the real human images are not provided to protect data privacy.
References
- J.-Q. Li, W.-H. Kwong, Y.-L. Chan, M. Kawabata. Comparison of in vivo intradiscal pressure between sitting and standing in human lumbar spine: a systematic review and meta-analysis. The Biomechanics of Injury and Rehabilitation 12 (3), 457 (2022). [↩]
- B. Kılıç. Lumbar disc herniation. Adv. Environ. Biol. 9 (2), 44–49 (2015). [↩]
- GBD 2021 Low Back Pain Collaborators. Global, regional, and national burden of low back pain, 1990–2020, its attributable risk factors, and projections to 2050: a systematic analysis of the Global Burden of Disease Study 2021. The Lancet Rheumatology 5 (6), e316–e329 (2023). [↩]
- P. Nguyen, L. K. Le, D. Nguyen, L. Gao, D. W. Dunstan, M. Moodie. The effectiveness of sedentary behaviour interventions on sitting time and screen time in children and adults: an umbrella review of systematic reviews. Int. J. Behav. Nutr. Phys. Act. 17 (1), 117 (2020). [↩]
- L. Yang, C. Cao, E. D. Kantor, L. H. Nguyen, X. Zheng, Y. Park, E. L. Giovannucci, C. E. Matthews, G. A. Colditz, Y. Cao. Trends in sedentary behavior among the US population, 2001–2016. JAMA 321 (16), 1587–1597 (2019). [↩]
- S. Chaudry, F. Rashid, S. I. H. Shah. Effectiveness of core stabilization exercises along with postural correction in postpartum back pain. Rawal Med. J. 38 (3), 256–259 (2013). [↩]
- G. Farhani, Y. Zhou, P. Danielson, A. L. Trejos. Implementing machine learning algorithms to classify postures and forecast motions when using a dynamic chair. Sensors 22 (1), 400 (2022). [↩]
- J. Roh, H. J. Park, K. J. Lee, J. Hyeong, S. Kim, B. Lee. Sitting posture monitoring system based on a low-cost load cell using machine learning. Sensors 18 (1), 208 (2018). [↩]
- Y. Lee, Y. M. Kim, S. Pyo, M. H. Yun. Development of a sitting posture monitoring system for children using pressure sensors: an application of convolutional neural network. Work 72 (1), 351–366 (2022). [↩]
- J. Ahmad, J. Sidén, H. Andersson. A proposal of implementation of sitting posture monitoring system for wheelchair utilizing machine learning methods. Sensors 21 (19), 6349 (2021). [↩]
- Y. Gupta, Y. Goyal, S. Chauhan, M. Rao. Design of a CNN based autonomous sitting posture recognition system. Proc. 16th Int. Conf. Computer and Automation Engineering (ICCAE), 437–441 (2024). [↩]
- N. Hoefflin, T. Spulak, A. Jeworutzki, J. Schwarzer. Lateral sitting posture detection using YOLOv5. Proc. IEEE Int. Conf. Biomedical Robotics and Biomechatronics (BioRob), 711–715 (2024). [↩]
- E. Weber, M. Nadeem. PosturePal: real-time posture classification with a laptop webcam. Technical Report, MIT EECS, Cambridge, MA (2024). [↩] [↩]
- K. Crowston, Amazon Mechanical Turk: A Research Tool for Organizations and Information Systems Scholars, in Shaping the Future of ICT Research: Methods and Approaches, A. Bhattacherjee and B. Fitzgerald, Eds., IFIP Advances in Information and Communication Technology, vol. 389, pp. 210–221, Springer, Berlin, Heidelberg, 2012. [↩]
- C. Lugaresi, J. Tang, H. Nash, C. McClanahan, E. Uboweja, M. Hays, F. Zhang, C.-L. Chang, M. Yong, J. Lee, W.-T. Chang, W. Hua, M. Georg, M. Grundmann. MediaPipe: a framework for perceiving and processing reality (2019). [↩]
- C. Lugaresi, J. Tang, H. Nash, C. McClanahan, E. Uboweja, M. Hays, F. Zhang, C.-L. Chang, M. Yong, J. Lee, W.-T. Chang, W. Hua, M. Georg, M. Grundmann, MediaPipe: a framework for perceiving and processing reality (2019). [↩]
- S. Zhang, X. Rao, H. Gu, H. Wang, B. Chen, Z. Liu, P. Luo. Adding conditional control to text-to-image diffusion models. arXiv 2302.05543 (2023). [↩]
- R. Rombach, A. Blattmann, D. Lorenz, P. Esser, B. Ommer. High-resolution image synthesis with latent diffusion models. Proc. IEEE/CVF Conf. Computer Vision and Pattern Recognition (CVPR), 10684–10695 (2022). [↩]
- R. Ranftl, K. Lasinger, D. Hafner, K. Schindler, V. Koltun. Towards robust monocular depth estimation: mixing datasets for zero-shot cross-dataset transfer. IEEE Trans. Pattern Anal. Mach. Intell. 44 (3), 1623–1637 (2022). [↩]
- K. Keany. BorutaShap: a wrapper feature selection method which combines the Boruta feature selection algorithm with Shapley values. arXiv preprint arXiv:2012.05421 (2020). [↩]
- F. Pedregosa, G. Varoquaux, A. Gramfort, V. Michel, B. Thirion, O. Grisel, M. Blondel, P. Prettenhofer, R. Weiss, V. Dubourg, J. Vanderplas, A. Passos, D. Cournapeau, M. Brucher, M. Perrot, É. Duchesnay. Scikit-learn: machine learning in Python. J. Mach. Learn. Res. 12, 2825–2830 (2011). [↩]
- D. W. Hosmer, S. Lemeshow, R. X. Sturdivant. Applied Logistic Regression. 3rd ed. John Wiley & Sons, Hoboken, NJ (2013). [↩]
- C. Cortes, V. Vapnik. Support-vector networks. Machine Learning 20 (3), 273–297 (1995). [↩]
- T. M. Cover, P. E. Hart. Nearest neighbor pattern classification. IEEE Trans. Inf. Theory 13 (1), 21–27 (1967). [↩]
- L. Breiman. Random forests. Machine Learning 45 (1), 5–32 (2001). [↩]
- P. Geurts, D. Ernst, L. Wehenkel. Extremely randomized trees. Machine Learning 63 (1), 3–42 (2006). [↩]
- J. H. Friedman. Greedy function approximation: a gradient boosting machine. Ann. Stat. 29 (5), 1189–1232 (2001). [↩]
- G. Ke, Q. Meng, T. Finley, T. Wang, W. Chen, W. Ma, Q. Ye, T.-Y. Liu. LightGBM: a highly efficient gradient boosting decision tree. Adv. Neural Inf. Process. Syst. (NeurIPS) 30, 3146–3154 (2017). [↩]
- T. Chen, C. Guestrin. XGBoost: a scalable tree boosting system. Proc. 22nd ACM SIGKDD Int. Conf. Knowledge Discovery and Data Mining (KDD), 785–794 (2016). [↩]
- L. Prokhorenkova, G. Gusev, A. Vorobev, A. V. Dorogush, A. Gulin. CatBoost: unbiased boosting with categorical features. Adv. Neural Inf. Process. Syst. (NeurIPS) 31, 6638–6648 (2018). [↩]
- F. Rosenblatt. The perceptron: a probabilistic model for information storage and organization in the brain. Psychol. Rev. 65 (6), 386–408 (1958). [↩]
- A. Krizhevsky, I. Sutskever, G. E. Hinton. ImageNet classification with deep convolutional neural networks. Commun. ACM 60 (6), 84–90 (2017). [↩]
- K. Simonyan, A. Zisserman. Very deep convolutional networks for large-scale image recognition. arXiv preprint arXiv:1409.1556 (2014). [↩]
- K. He, X. Zhang, S. Ren, J. Sun. Deep residual learning for image recognition. Proc. IEEE Conf. Computer Vision and Pattern Recognition (CVPR), 770–778 (2016). [↩]
- G. Huang, Z. Liu, L. van der Maaten, K. Q. Weinberger. Densely connected convolutional neural networks. Proc. IEEE Conf. Computer Vision and Pattern Recognition (CVPR), 4700–4708 (2017). [↩]
- T. Fawcett. An introduction to ROC analysis. Pattern Recognit. Lett. 27 (8), 861–874 (2006). [↩]
- J. Cohen. A coefficient of agreement for nominal scales. Educ. Psychol. Meas. 20 (1), 37–46 (1960). [↩]
- B. W. Matthews. Comparison of the predicted and observed secondary structure of T4 phage lysozyme. Biochim. Biophys. Acta Protein Struct. 405 (2), 442–451 (1975). [↩]
- D. E. King. Dlib-ML: a machine learning toolkit. J. Mach. Learn. Res. 10, 1755–1758 (2009). [↩]
- C. Sagonas, E. Antonakos, G. Tzimiropoulos, S. Zafeiriou, M. Pantic. 300 Faces In-The-Wild Challenge: Database and results. Image Vis. Comput. 47, 3–18 (2016). [↩]


