
Abstract
Type 1 diabetes (T1D) is an autoimmune disease that leads to the destruction of insulin-producing ß cells. The protein tyrosine phosphatase non-receptor type 2 (PTPN2) gene is highly associated with the disease, and its deletion in mouse T cells has been linked to an increased risk of TID development. However, it is unclear what the role of PTPN2 is in regulating antibody-producing B cells, and its subsequent effect on immune regulation. This research investigates how deletion of the PTPN2 gene in mouse B cells affects total IgG and IgG isotype antibody production using enzyme-linked immunosorbent assay (ELISA). Using a mouse model in which PTPN2 is specifically deleted in B cells (KO), our results demonstrate that serum from KO mice contains an 48.332% increase (p = 0.0458) in total IgG antibodies compared to control wild-type (WT) mice. The increase of total IgG antibody production in PTPN2 KO mice compared to WT controls may suggest that the absence of PTPN2 in B cells leads to increased antibody production and immune dysregulation, possibly correlating to the development of autoimmunity and T1D. Results for the IgG isotypes IgG1, IgG2a, IgG2b, and IgG3 were not proven to be statistically significant. Additionally, the experimental groups (n=5 for each condition) are too small to draw strong statistical conclusions given the variability of immune systems between individual mice. However, this study provides a strong background and protocols for future work when a higher sample size is available.
Keywords: Type 1 Diabetes (T1D), Autoimmunity, Antibody, Protein tyrosine phosphatase non-receptor type 2 (PTPN2), Immunoglobulin G (IgG), Enzyme-linked immunosorbent assay (ELISA)
1. Introduction
Type 1 diabetes (T1D) is an autoimmune disease in which insulin-producing ß cells are destroyed by the immune system. Although the exact cause of T1D is unknown, it typically begins during childhood in individuals who carry a genetic predisposition. In contrast, type 2 diabetes (T2D) is associated with obesity, lack of exercise, and poor nutrition, leading to overstimulated ß cells that no longer respond to rising glucose levels, reducing insulin secretion1.
Symptoms of T1D include fatigue, weight loss, and frequent urination2. The lack of insulin and lower glucose absorption into cells leads to hyperglycemia, commonly referred to as high blood sugar. Over time sustained hyperglycemia causes damage to blood vessels and nerves, reduces kidney and eye function, and can eventually result in a heart attack or stroke3. Reduced glucose availability in tissues causes fatigue, and possibly ketoacidosis. Ketoacidosis occurs when cells begin to break down muscle as a source of energy, releasing dangerous ketone acids, leading to brain swelling, unconsciousness, and eventually death4.
Certain genes are associated with the development of T1D. Intracellular protein tyrosine phosphatases (PTPs) play an important role in regulating T-cell and B-cell function5. Immune cells have a significant number of PTP genes, the largest amount in any tissue in the body6. Research using knockout mice has shown that PTPs are vital for maintaining immune balance and the absence of various PTPs often leads to immune deficiencies and a hyperreactive immune system that is prone to autoimmunity7.
Protein tyrosine phosphatase non-receptor type 2 (PTPN2) is associated with autoimmune disorders such as Crohn’s disease and T1D8. PTPN2 plays a vital role in regulating cell growth and development into different types of immune cells9. It is a signaling protein that modulates communication between cells and plays a role in anti-inflammatory10. Mice with mutations in the PTPN2 gene in T-cells tend to have hyperactive immune systems and increased destruction of ß cells11. This is due to the lack of regulation in signaling, causing increased T cell activation.
Previous studies investigating the role of PTPN2 knockout (KO) in immune cells, particularly in the context of inflammatory bowel diseases, have identified PTPN2 as a key regulator in the maturation of naïve B cells. Specifically, PTPN2 deficiency impairs the differentiation of pre-B cells into immature B cells and inhibits pre-B cell proliferation. A reduction in immature B cell populations has been associated with the survival of autoreactive B cells, which are typically eliminated during this developmental stage. The absence of PTPN2 may potentially contribute to the accumulation of autoreactive B cells12. However, direct experimental evidence supporting this hypothesis remains limited and it is currently unknown how the PTPN2 KO in B-cells affects antibody production.
In general, T cells and B cells play a role in autoimmunity by reacting to self-antigens. Both T cells and B cells are activated by binding to antigens, specific molecular moieties that are recognized by immune cells. During T-cell development, cells go through a tolerance mechanism to ensure that T cells that react to self-antigens are removed13. However, if any of these steps are defective, an uncontrolled expansion of self-reactive T cells could occur.
In T1D, T cells that recognize islet antigens produced by ß cells escape tolerance mechanisms, and therefore, trigger an immune response against ß cells. As such, treatment against T cells stops the progression of the disease, illustrating the role T cells play in the pathogenesis of T1D14. Similarly, B cells undergo a central tolerance mechanism to select against self-reactivity. Any defect in the selection, therefore, leads to the release of B cells that are stimulated by self-antigens15.
While it is clear T-cells mediate ß-cell destruction, studies suggest that B cells are also involved in T1D pathogenesis, although a clear role has yet to be established. B cells can play various roles in autoimmunity, such as by producing inflammatory cytokines like interleukins that regulate T cell activity. In addition, B cells may also help activate self-reactive T cells through presentation of autoantigens to T cells, who go on to destroy the ß cells16. B-cells may also play a role in T1D by secreting high-affinity autoantibodies15. However, it remains largely speculative as to how autoantibodies contribute to the development of T1D.
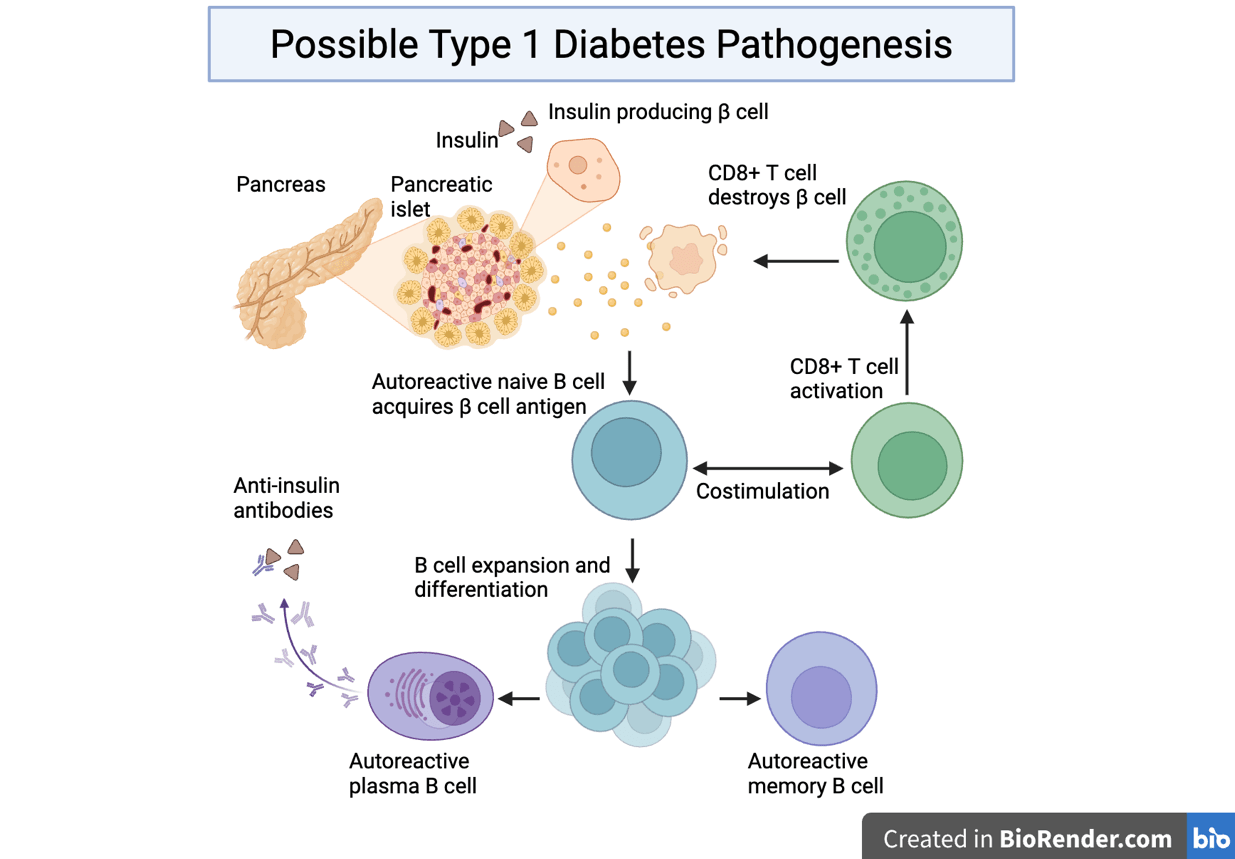
B cells are activated by binding to antigens directly and interacting with CD4+ T cells, which further enhances their activities. Antigen binding and CD4+ T cell interaction cause the B cell to differentiate and expand into either memory B cells that can remember the antigen in case of recurrent exposure, or plasma cells that produce antibodies to fight the pathogen as an immediate response. The antibodies created by plasma cells bind to bacteria and viruses to inactivate them.
Activated B-cells produce antibodies, which are Y-shaped proteins that recognize, bind, and neutralize pathogens. Immunoglobulin G (IgG) antibodies are the most common. In mice there are multiple IgG subclasses17. Each IgG isotype plays a specific role in regulating immune responses. IgG3 and IgG2b antibodies are important in beginning phases before T cells are activated. When T-cell defense becomes stronger, IgG2a antibodies increase the power of the response and IgG1 production helps limit inflammation and lessens inappropriate immune response18.
Antibody class switching is initiated in mature B cells through antigen stimulation and the presence of appropriate co-stimulation19. This study focuses on total IgG and IgG subclass antibodies due to their relative abundance in mouse and human blood20. Additionally, it was found that diabetic individuals have on average measurably higher levels of IgG antibodies in their blood serum21.
The goal of this study was to determine whether PTPN2 plays a role in B cell antibody production and how it may contribute to the development of T1D. To address this, we monitored the serum antibody levels from mice without the PTPN2 gene (PTPN2 KO/ PTPN2 knock-out) in B cells and compared them to the serum antibody levels from control WT mice with an intact PTPN2 gene.
A large increase in antibody production in mutant mice compared to WT control mice in the same environment could signify a lack of regulation in B cell antibody production, which may suggest that PTPN2 plays a vital role in B cell antibody regulation. We hypothesized that removing PTPN2 from the B cells of mice would impact the regulation of B cell antibody production, and that total IgG and IgG isotype antibody production would increase in KO mice compared to WT mice.
2. Results
2.1. Methodology and Procedures
In an enzyme-linked immunosorbent assay (ELISA), the more antibodies present in the serum sample, the more bound antibody structures with HRP will be attached to the plate, leading to an increased amount of reaction between the HRP and TMB substrate resulting in a higher concentration of color. The absorbance is then measured and used as a marker of antibody levels. An increase in antibody levels/absorbance in the wells with KO mouse serum compared to WT serum would indicate increased antibody production in the B cells of mice without the PTPN2 gene.
2.1.1. Mice
The mice used were PTPN2 KO (Mb1Cre–PTPN2 flox/flox) and WT mice (C57BL/6J). To knock out the PTPN2 gene, CRE recombinase was expressed under the Mb1 promoter, which is only active in B cells. This ensures precise genetic deletion of PTPN2 in B cells only. For controls, wild-type mice with no genetic deletion but of the same strain background were used. Serum was collected at 4-8 weeks of age for the experiment. Mouse genotypes were confirmed by polymerase chain reaction (PCR) and gel electrophoresis. B cell-specific PTPN2 knockout was confirmed by the lab using western blot. All mice were cared for at the University of Colorado Anschutz Medical Campus in accordance with the Institutional Animal Care and Use Committee (IACUC) regulations.
2.1.2. ELISA assay
Antibody levels were quantified using ELISA. An antibody that recognized a specific IgG isotype or all IgG antibodies was used to coat a 96-well ELISA plate. Serum from either PTPN2 KO or WT mice was added at the indicated dilutions and captured by the coating antibody. The captured antibody was then detected using a detection antibody, with the horseradish peroxidase (HRP) enzyme attached to it. When a chromogenic substrate is added, the enzyme oxidizes the substrate and changes the substrate’s color, which can be detected using a spectrophotometer. Therefore, the absorbance of the solution can be interpreted as a direct readout of the concentration of antibodies in the serum. To confirm the accuracy of the ELISA assay, blank columns and positive control dilutions were included in each plate for all isotypes.
2.1.3. Statistics
An unpaired T-test was then used to determine whether the results are significant. Generally, a p-value must be smaller than 0.05 to be considered significant. However, given that the sample size was 5 mice per condition, current conclusions are not considered to have any real statistical significance or implications. All p-values and graphs were accessed in Prism
2.1.4. Protocol
The experiment was conducted using a sandwich ELISA. To coat the ELISA plates, 160 μl of coating antibodies that bind total IgG, IgG2a, IgG2b, IgG1, or IgG3 (all at 1mg/mL concentration) was diluted in 40 ml of 1x Phosphate Buffered Saline (PBS) (10μg/ml final concentration). 50 μl of the solution was then transferred into each well of a 96-well plate. The antigen-coated plate was covered and incubated at 4℃ overnight. The next day, the plate was washed in 1x PBS & 0.05% Tween 20 solution 3 times. To remove excess liquid within the wells, the plate was forcefully flicked and then tapped onto a paper towel. Then, each well was filled with 100 μl of 2% BSA Blocking Buffer (1x PBS & 2% BSA), covered, and incubated at room temperature for 1 hour. The plate was washed 3 times and excess liquid was removed. The top row of wells was filled with 90 μl of 1x PBS and 10 μl of mouse serum that were diluted at 1:400 for a final 1:4000 dilution. The column containing the positive control was filled with 99 μl 1x PBS and 1 μl of positive control at a 0.1mg/ml. The rest of the empty wells were filled with 50 μl 1x PBS. The sera were further diluted by serial dilution at a 1:1 ratio. The samples were mixed by pipetting up and down 6-7 times. The process was continued until the bottom row and the 50 μl left in the pipette were discarded. The plate was sealed and incubated at room temperature for 2 hours. The washing step was repeated 3 times, and excess liquid was removed. 1.25 μl anti-mouse for total IgG and isotype-specific detection antibody IgG1, IgG2a, IgG2b, IgG3 with horseradish peroxidase (HRP) was diluted in 4998.75 μl of 2% BSA Blocking Buffer. 50 μl was added to each well. The plate was covered and incubated for 1 hour. A special washing step was completed 4 times by soaking the plates in the washing buffer for a minute. The plates were then pat completely dry. 50 μl of 3,3′,5,5′-Tetramethylbenzidine (TMB) substrate was added in each well and incubated in a dark area uncovered for 20-30 min. The reaction was stopped with 50 μl 1M HCl. The plate was read with a spectrophotometer immediately after at 450 nm. Data was exported to Excel.
2.1. Data compilation
After collecting and compiling data in Excel, abnormal readings were noted and removed from the data set. In the IgG1 ELISA, the average amount of IgG1 antibody in the PTPN2 KO with mouse #597 included in the data was an average of 104.18% more than that of the WT mice. However, the average deviation from the mean was a high value of 0.7381 in the PTPN2 KO mice. This was likely due to an experimental error because mouse #597 does not display unusually high amounts of other IgG antibodies. Exempting mouse #597 changed the increase from WT to PTPN2 KO mice to 30.17% and the average deviation from the mean was 0.2488. There may have been an experimental error of debris being in the well, leading to a higher absorbance value than in reality
In the IgG2b ELISA samples 586 and 588 read as blank and were therefore not valid, so the results were not included in the data. However, all other samples and the positive controls were unaffected by the error. This may be a result of samples being improperly added to the wells.
2.2. Total IgG, absorbance measured at 450 nm
| Total IgG Data, 1:32,000 dilution | |
| 584 WT | 2.359 |
| 587 WT | 2.39 |
| 566 WT | 1.652 |
| 555 WT | 2.167 |
| 558 WT | 0.995 |
| 602 KO | 3.14 |
| 604 KO | 1.826 |
| 597 KO | 3.177 |
| 586 KO | 2.593 |
| 588 KO | 3.449 |
| WT average | 1.9126 |
| KO average | 2.837 |
| Average percent deviation from mean – WT | 0.471 |
| Average percent deviation from mean – KO | 0.502 |
| Standard deviation from mean – WT | 0.592 |
| Standard deviation from mean – KO | 0.645 |
| P-value | 0.045873 |

Figure 2 displays levels of total IgG antibodies in the serum of mice, in terms of absorbance. Individual mice are represented: WT (black circles) or PTPN2 KO (red squares) on the plot.
Absorbance ∝ antibody levels, so absorbance can be used to indirectly quantify levels of total IgG antibodies. The average amount of IgG antibody in the PTPN2 KO mice was on average 48.332% more than that of the WT mice. There were no outliers, so all mice were included in the data.
The increase in total IgG antibodies is considered significant as its p-value is 0.045873. Overall, there was an increase in total IgG in the PTPN2 KO mice compared to WT control mice.
2.3. IgG isotypes, absorbance measured at 450 nm
| IgG1 1: 64,000 dilution | IgG2a 1: 4,000 dilution | IgG2b 1: 16,000 dilution | IgG3 1: 4,000 dilution | |
| 584 WT | 0.528625 | 0.602125 | 3.444875 | 1.923375 |
| 587 WT | 0.779625 | 0.612125 | 2.492875 | 1.136375 |
| 566 WT | 0.775625 | 0.757125 | 2.896875 | 1.549375 |
| 555 WT | 0.543625 | 0.587125 | 3.148875 | 1.732375 |
| 558 WT | 0.406625 | 0.609125 | 1.964875 | 1.869375 |
| 602 KO | 0.633625 | 0.764125 | 3.590875 | 0.888375 |
| 604 KO | 0.485625 | 0.622125 | 3.051875 | 1.709375 |
| 597 KO | * | 0.644125 | 3.084875 | 1.850375 |
| 586 KO | 0.752625 | 0.616125 | * | 1.430375 |
| 588 KO | 1.287625 | 0.884125 | * | 2.042375 |
| WT average | 0.606825 | 0.633525 | 2.789675 | 1.642175 |
| KO average | 1.239025 | 0.706125 | 3.242541667 | 1.584175 |
| Average percent deviation from mean – WT | 0.13664 | 0.049 | 0.448 | 0.239 |
| Average percent deviation from mean – KO | 0.2488 | 0.094 | 0.232 | 0.339 |
| Standard deviation from mean – WT | 0.1647291717 | 0.06976603758 | 0.5784005533 | 0.3175196057 |
| Standard deviation from mean – KO | 0.3493445052 | 0.1162411287 | 0.3021164235 | 0.448407404 |
| P-value | 0.329515 | 0.265405 | 0.264127 | 0.819331 |
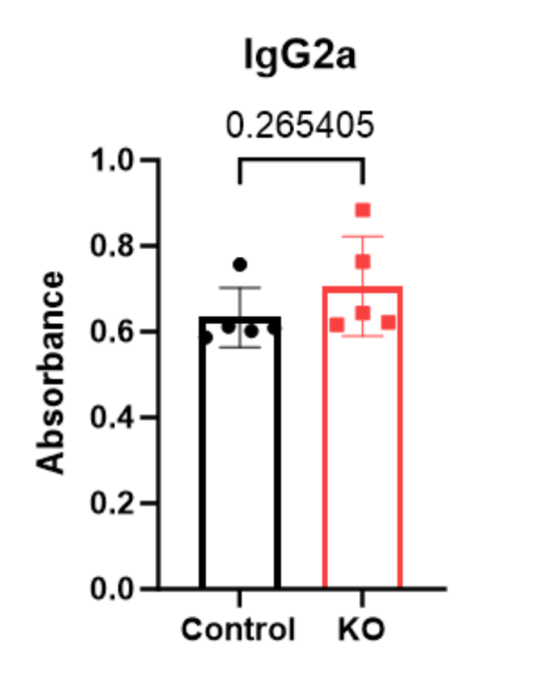
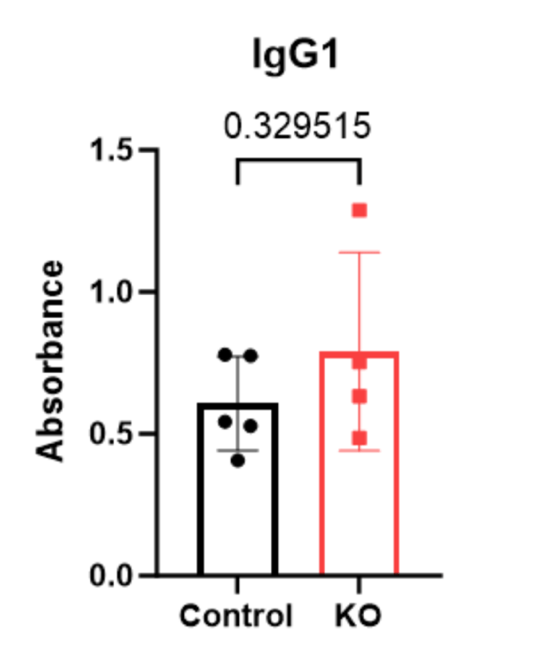
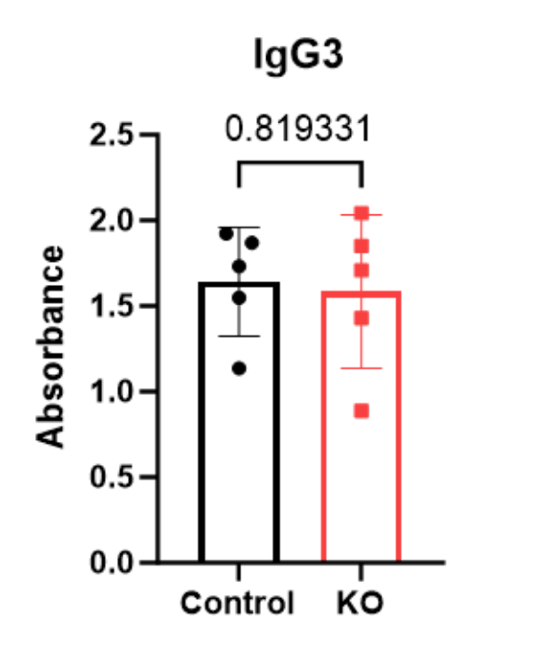
Figure 3-6 displays levels of IgG isotype antibodies in the serum of mice, in terms of absorbance. Individual mice are represented: WT (black circles) or PTPN2 KO (red squares) on the plot.
While variability was observed between the PTPN2 KO and WT mice, there were no significant changes in any of IgG isotype’s antibody levels.
3. Limitations
This research was subject to limitations due to the available sample size that should be considered when interpreting the results. The experimental groups (n=5 for each condition) are too small to draw strong statistical conclusions, especially given the biological variability in immune systems. Although one significant p-value was obtained for total IgG (p = 0.0458), the result is very close to the 0.05 threshold, which, given the small sample size, could be due to random variability. The small sample size arose from the restricted availability of genetically modified PTPN2 KO and WT control mice at the time of experimentation.
Additionally, variability within the isotype-specific data, such as outlier absorbance values such as in IgG1 mouse 597 and IgG2b 586 and 588 further reduce confidence in the reliability of isotype-specific findings.
4. Discussion
There was an increase in total IgG antibodies in PTPN2 KO mice compared to WT control mice. This suggests that the PTPN2 gene in B-cells may play a vital role in regulating antibody production. The absence of PTPN2 appears to increase overall IgG antibody production, which often correlates with autoimmunity, including T1D.
The lack of statistical significance in individual isotypes deserves further investigation with a larger number of subjects. Additionally, there were experimental errors noted in section 2.2.1 that may have skewed the data within individual isotypes.
Overall, the deletion of PTPN2 in B-cells correlated with an increase in total IgG antibodies, but no considerable change in IgG isotype antibodies in mice. Given that the sample size of this study was too small to justify any statistical significance, our current observations fail accept or reject the hypothesis that mutations in the PTPN2 gene may increase antibody production in mice, an indication of B-cell dysregulation and hyperstimulation, which may contribute to the development of T1D.
5. Future work
Future studies will include a power analysis to determine the appropriate number of mice needed to detect statistically significant differences, particularly in IgG isotype levels. Expanding the sample size will help reduce variability and improve confidence in the results.
In addition to increasing cohort size, future experiments will assess B-cell development and function more directly using flow cytometry, B-cell phenotyping, and anti-insulin specific ELISAs. These approaches could clarify how PTPN2 loss impacts B-cell tolerance and antibody regulation.
Longitudinal studies would also help determine how antibody levels change over time in PTPN2 knockout mice. Finally, crossing this PTPN2 KO model with non-obese diabetic (NOD) mice could provide information on whether B-cell-specific PTPN2 deletion accelerates or contributes to autoimmune diabetes, providing a more direct connection to disease development.
6. Methods
We used B-cell-specific PTPN2 knockout (Mb1Cre-PTPN2 flox/flox) and wild-type (C57BL/6J) mice, aged 4–8 weeks, housed under IACUC-approved conditions. In order to select mice, genotyping data was randomized to select 5 mice of each condition from a cohort of ~15 mice by another lab member. All mice of both conditions were fed the same pellets, given the same amount of water, and kept in identical environments. To ensure proper blinding protocols, individual mouse genotypes were unknown until after data collection. Serum was collected to assess antibody levels using sandwich ELISA. Absorbance values were considered proportional to antibody levels and analyzed in Excel and Prism, with statistical significance determined by unpaired T-test (p < 0.05). Percent increases were calculated to compare IgG levels between KO and WT groups. This paper was written in 2024, then revised for accuracy and concision in 2025.
Acknowledgments
I would like to express my gratitude to Dr. Soojin Kim, whose invaluable guidance, feedback, and patience were instrumental in the success of this research. I am thankful to Dr. Mia Smith for her consistent support throughout this process. I am grateful for the entire Smith Lab, especially Bridget Alexander and Maya Hunter, for their instruction on data collection and analysis.
References
- Olokoba A.B., Obateru O.A., Olokoba L.B. Type 2 diabetes mellitus: A review of current trends. Oman Med. J. 27, 269–273 (2012). [↩]
- Roche E., Menon A., Gill D., Hoey H. Clinical presentation of type 1 diabetes. Pediatr. Diabetes 6, 75–78 (2005). [↩]
- Cryer P.E., Davis S.N., Shamoon H. Hypoglycemia in diabetes. Diabetes Care 26, 1902–1912 (2003). [↩]
- Ghimire P., Dhamoon A.S. Ketoacidosis. In: StatPearls [Internet]. Treasure Island (FL): StatPearls Publishing (2025); https://www.ncbi.nlm.nih.gov/books/NBK534848/. [↩]
- Chistiakov D.A., Chistiakova E.I. T-cell protein tyrosine phosphatase: A role in inflammation and autoimmunity. Int. J. Diabetes Mellit. 2, 114–118 (2010). [↩]
- Rhee I., Veillette A. Protein tyrosine phosphatases in lymphocyte activation and autoimmunity. Nat. Immunol. 13, 439–447 (2012). [↩]
- Wiede F., Brodnicki T.C., Goh P.K., Leong Y.A., Jones G.W., Yu D., et al. T-cell–specific PTPN2 deficiency in NOD mice accelerates the development of type 1 diabetes and autoimmune comorbidities. Diabetes 68, 1251–1266 (2019). [↩]
- Sharp R.C., Abdulrahim M., Naser E.S., Naser S.A. Genetic variations of PTPN2 and PTPN22: Role in the pathogenesis of type 1 diabetes and Crohn’s disease. Front. Cell. Infect. Microbiol. 5, 95 (2015). [↩]
- Song J., Lan J., Tang J., Luo N. PTPN2 in the immunity and tumor immunotherapy: A concise review. Int. J. Mol. Sci. 23, 10025 (2022). [↩]
- Spalinger M.R., Manzini R., Hering L., Riggs J.B., Gottier C., Lang S., et al. PTPN2 regulates inflammasome activation and controls onset of intestinal inflammation and colon cancer. Cell Rep. 22, 1835–1848 (2018). [↩]
- Henry R., Kendall P., Thomas J. Autoantigen-specific B-cell depletion overcomes failed immune tolerance in type 1 diabetes. Immunol. Transplant. 2012, 2037–2044. [↩]
- Spalinger M.R., McCole D.F., Rogler G., Scharl M. Protein tyrosine phosphatase non-receptor type 2 and inflammatory bowel disease. World J. Gastroenterol. 22, 1034 (2016). [↩]
- Khan U., Ghazanfar H. Chapter three—T lymphocytes and autoimmunity. In: Galluzzi L., Rudqvist N.P., Eds. Int. Rev. Cell Mol. Biol. 341, 125–168 (2018); https://www.sciencedirect.com/science/article/pii/S1937644818300583. [↩]
- Roep B.O. The role of T-cells in the pathogenesis of type 1 diabetes: From cause to cure. Diabetologia 46, 305–321 (2003). [↩]
- Hampe C.S. B cells in autoimmune diseases. Scientifica (Cairo) 2012, 215308 (2012). [↩] [↩]
- Smith M.J., Simmons K.M., Cambier J.C. B cells in type 1 diabetes mellitus and diabetic kidney disease. Nat. Rev. Nephrol. 13, 712–720 (2017). [↩]
- Shinde P., Howie H.L., Stegmann T.C., Hay A.M., Waterman H.R., Szittner Z., et al. IgG subclass determines suppression versus enhancement of humoral alloimmunity to Kell RBC antigens in mice. Front. Immunol. 11, 1516 (2020). [↩]
- Collins A.M. IgG subclass co-expression brings harmony to the quartet model of murine IgG function. Immunol. Cell Biol. 94, 949–954 (2016). [↩]
- Stavnezer J., Guikema J.E., Schrader C.E. Mechanism and regulation of class switch recombination. Annu. Rev. Immunol. 26, 261–292 (2008). [↩]
- Vidarsson G., Dekkers G., Rispens T. IgG subclasses and allotypes: From structure to effector functions. Front. Immunol. 5, 520 (2014). [↩]
- El-Sayed M., Haroun M. Measurement of IgG levels can serve as a biomarker in newly diagnosed diabetic children. J-Stage 40, 56–61 (2007). [↩]


