
Abstract
This research examined the economic viability of climate finance in India, by reviewing if the financial sustainability and longevity of renewable energy investments, are worthy of investment in India. The research is based in part on the energy sources that have been most deployed in India, which are solar, wind, and hydro. Using case studies, corporate financials, as well as a tenure review of the deployment of renewable technologies in India, we attempted to better understand which renewable investment may present the best economic return and scalability considering India’s policies and infrastructure in the current day. Aside from the capacity to generate energy and the cost of installation, we examined the flow of capital from government schemes, international funding to private investments and how they moved into sustainable energy. Through the process of examining climate finance systems, we considered if the funds for climate financial investment were delivered effectively, and in a way that can help drive economic and environmental goals. The study results concluded that, in order of economic viability and scalable resources, solar power was the most viable renewable energy technology choice. This conclusion was driven largely by decreasing solar panel costs, easier installation, and a higher return on investment compared to the other technologies, particularly if the analysis was done on a regions in India that have high insolation. Wind and hydro, while important, were only viable at a reasonable long-term capital or maintenance cost in specific regions.
Keywords: Climate finance, green finance, SDGs, climate funds, carbon credits, PPPs, LCOE, ETS, UNFCCC.
Introduction
This study evaluates the economic viability of climate finance in India with case studies, financial statements, and trend analysis of three of the country’s largest renewable resources. It was discovered that solar power was the most viable option because it is inexpensive and has a high return on investment.
The study considers whether India is ideal for climate finance, a cross-cutting component left out of other researches. The outcome provides practical guidance to investing in climate business, identifying solar energy as the best and least expensive option.
Follow-up research can subsequently investigate less-mapped terrain of climate finance, as this research addressed the most obvious solutions in consideration of time and scope constraints.
Background information:
What is Climate Finance:
Climate finance refers to funding used to combat climate change and adapt to it, like investment in renewable energy and climate-resilient infrastructure. Climate finance is both private and public finance that is aimed at low-carbon, sustainable development in vulnerable areas.1
Why is Climate Finance Essential:
It supports sustainable development goals (SDGs), spur economic growth, create jobs, and improves population health through reduction in emissions. It presents developing countries with increased climate resilience through improved infrastructure, early warning systems, and regenerative and sustainable agriculture to minimize existing risks, including food insecurity, water and energy crises.2
Economic Viability of Climate Finance:
It is cost-effective, produces positive return on investment (ROI), and supports enduring economic development. Clean technology investments are increasingly profitable, following the potential for subsidization and meaningful pricing for carbon and green financing instruments (i.e., bonds) in the future. Moreover, it also saves the anticipated costs of economic losses from climate impacts in the future.
Climate finance is not just about the economic aspect, it is also about global equity. Developed economies, as the principal historical polluters, need to finance the developing world, as committed in the Paris Accord, allowing them to fulfil obligations in climate forecasts.1
Biases:
The potential for biases in assessing the economic viability of climate finance may undermine the fit for purpose validity and reliability and the policy relevance of the findings. Climate finance has a multi-faceted scope that incorporates a number of participants and approaches, generating possibilities for bias in data collection and modelling as well as institutional biases.
Selection Bias and Limitations in Data
Various existing studies report on regions, or instruments, on which better data is available – most clearly in the OECD (2015), which strongly underscores higher income countries climate finance contributions to the detriment of the investments in developing countries. Research incorrectly reports credible evidence and estimations and then changes the perceived viability.
Modelling Assumptions and Economic Biases
The concept of economic modelling also carries biases within it. Nordhaus’s DICE model that represents the worst cases use very high discount rates, suggesting that we could invest gradually.3 advocates action now and large-scale actions that use low discount rates and necessarily ignores what Nordhaus and others have extrapolated from their model. As illuminated above, assumptions are extremely powerful and used to either confirm or deny and indicate specific policy recommendations suggesting that both choices in terms of ideology and method impact the output from the economic viability judgement.4
Political & Institutional Bias
The institutions may reflect their agendas. OECD and UNFCCC frameworks generally place greater emphasis on (developed) nations’ roles commensurate with their policy objectives; consider reports backed by the OECD, which support private investment, possibly diverting focus away from regulations or public solutions. The IPCC (2022) may be less biased, but again we see a more consensus values process – hence, a possible tendency to a conservative estimate to avoid a political situation –5.
Aim:
To evaluate the economic viability of climate finance in India and its potential to support a shift toward renewable energy sources such as solar, wind, and hydro. By assessing their feasibility, the study supports India’s transition to cleaner, sustainable energy.
The aim will be considered achieved if:
- The scope and potential of climate finance in India are assessed.
- Key factors influencing its allocation and effectiveness.
- Renewable energy compared to conventional energy in cost, efficiency, and environmental impact.
- Recognising barriers to climate finance adoption in India.
- Proposed Policy and regulatory improvements.
- Development of plan to boost stakeholder investment in renewables via climate finance
Objectives:
- a. Develop a framework to assess current climate finance levels in India.
- b. Identify suitable data collection methods (e.g., surveys).
- c. Propose methods to estimate future climate finance levels.
- d. Identify key renewable energy sources for transition.
- e. Collect and analyse relevant data.
- f. Draw conclusions and key discussion points from findings.
Importance:
India, a signatory of Paris Agreement (2016), committed to limiting global warming below 2°C. It reinforced its climate goals at COP26 and announced a net-zero target by 2070 at COP27. This study contributes to understanding how climate finance can help meet these goals.
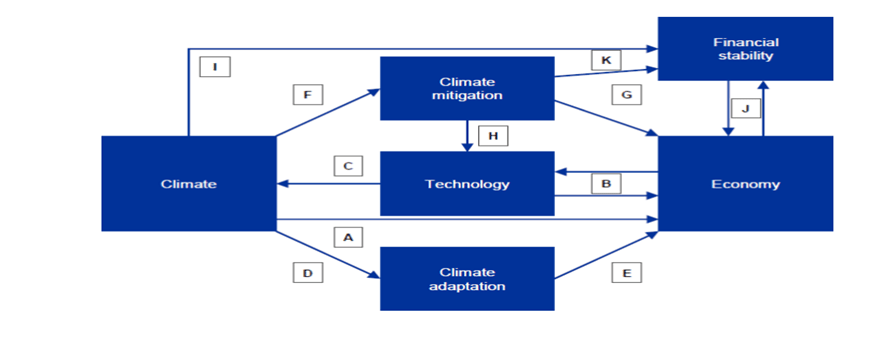
Considering the following graph

Role and Risk of Climate Finance
India is amongst the most vulnerable to climate change.6 Therefore, it is important to identify alternative energy sources that can mitigate climate harms.
Climate finance promotes renewable energy, cuts fossil fuel reliance, and supports a resilient energy mix. It drives economic growth, clean tech innovation, and renewable adoption in India, strengthening its global clean energy role and improving health and sustainability7.
Methodology
Method 1: Quantitative Analysis of Financial Flows
Pros:
- Offers a deep understanding of climate finance sources and distribution.
- Utilizes credible sources like OECD and NBER reports.
- Enables tracking of long-term trends and forecasting.
- Supports strategic planning and highlights high-return, low-impact projects.
Cons:
- Inconsistent reporting, incomplete data, and low transparency hinder analysis.
- Complex and resource-heavy to manage large datasets.
- May overlook impactful projects with high upfront costs.
- Static data may not capture evolving finance trends.
Method 2: Case Studies of Renewable Energy Projects
Pros:
- Provides detailed insights into specific projects.
- Identifies real-world challenges, successes, and best practices.
- Highlights community relevance and market innovation in renewables.
Cons:
- Inconsistent data across case studies can cause confusion.
- Hard to compare due to varied costs and efficiency across technologies.
- Often misses broader trends and systemic finance issues, limiting policy relevance.
Method 3: Graphical Trend Analysis
Pros:
- Visualizes distribution, growth, and impact trends in climate finance.
- Identifies phases of change or stability.
- Facilitates quick comparison and stakeholder communication.
- Simplifies large datasets for efficient interpretation.
Cons:
- May oversimplify or misrepresent data
- Poor design can mislead
- Relies on data quality
- Omits qualitative factors (e.g., policy, stakeholder input)
- Static and lacks interactivity
- Often outdated due to ongoing R&D
Courses of action:
- Social Viewpoint
Rationale: Assess the societal costs, benefits, and equity outcomes of climate finance, including its impact on livelihoods and community resilience.
Data Collection: Gather qualitative data on public perceptions, social benefits, and challenges related to project implementation. - Governmental Viewpoint
Rationale: Governments play a key role in shaping and enforcing climate finance policies.
Research Focus: Analyse national and international climate finance policies.
Data Collection: Use existing reports and policy documents on financial spending and its outcomes. - Personal Viewpoint
Rationale: Public perception influences climate finance adoption. Understanding personal beliefs and biases is essential.
Data Collection: Collect secondary data on public attitudes, crowdfunding efforts, and individual climate finance contributions. - Research Methodology
Approach: Use a mixed-methods strategy combining quantitative tools (e.g., financial metrics) with qualitative techniques (interviews, case studies, focus groups).
Data Analysis: Apply ROI and cost-benefit analysis to evaluate financial outcomes of climate investments. - Conclusion & Recommendations
Based on insights from all viewpoints, suggest optimal investment strategies and policy recommendations to enhance climate finance effectiveness.
Conclusion, Recommendations and Time Allocation: 20 days
Objective:
Summarize findings and propose actionable recommendations.
Activities:
- Draft the final report, detailing findings, methods, and conclusions.
- Develop policy recommendations based on research.
- Prepare presentations and supporting materials.
Literature Review
Overview:
New research shows the expanding importance of climate finance for economic sustainability. This is particularly true regarding financial flow patterns, expected returns, and policy implications. Attention to climate finance is growing, but the literature still has gaps, biases, and methodological weaknesses that require further scrutiny.
Current Status of Climate Finance Research
According to the CPI (2022), global climate finance reached $850 billion in 2021, compared to $364 billion in 2012, with finance primarily geared towards renewable energy, efficiency and adaptation sectors. The8 estimates that each dollar invested in clean energy is expected to return between three and eight economic dollars, which can include the creation of jobs and lasting health benefits.
Today, private finance amounts to 56% of total flows (2019/2020), aided by green bonds and sustainable investment funds, but major issues still remain, including access inequality, geographic imbalance, and resource inefficiencies.
Patterns, Trends, and Gaps in Literature
A significant ongoing trend is mitigation finance dominating adaptation funds, where mitigation concessional finance represents 90% of all adaptation finance9. Mitigation priorities neglect the resilience needs for vulnerable parts of the world.
There is also an increasing trend toward dependence on private investment. While public funds are still core to any finance model, private finance has increasingly taken large proportions of flows (> 50% of all flows)10 putting profit above climate needs, often excluding projects of critical need but that are less profitable, such as rural electrification or smallholder climate resilience projects.
The absence of standard methods impedes even the discount rates and models used in evaluations which could contain contradictory findings3. The absence of long-term studies also reduces policy planning and evaluation efficacy.
Biases in Climate Finance Literature
There are multiple biases present in climate finance literature that affect the interpretation of findings and ultimately policy directions. One bias is selection bias, almost all studies focus on developed countries or big projects and neglect low-income countries as well as community-based projects. The second notable bias is funding source bias, as studies funded by governments, international organizations or private entities may skew findings positively to promote funders interests, and exaggerate the efficacy of implementing the financial mechanisms available10.
Publication bias is also a concern, where studies with realized positive impacts are more likely to get published, which misrepresents the success of climate finance, and silences or obscures failure11. Method bias is a result of different model specifications and metrics- for example, in using discount rates that are high will discount long-term benefits. There are also some assumptions made by studies that do not have cross context application12.
Finally, data bias is a concern- for the possible assessment of climate finance is creating evaluations on self-reported data, be it from international organizations, institutions, and governments, or from given reports1. Moreover, many developing countries do not have adequate tracking systems and as such data is not collected and this may be underrepresented in global assessments altogether. A long-term bias is also prevalent, evidenced by literature that often emphasizes short term situations rather than ongoing economic and environmental impacts13.
Financial Market Imperfections Theory explains barriers to private climate investment information asymmetry, high costs, and uncertain returns deter investors. This supports blended finance models that combine public and private funds to de-risk projects.
Institutional Theory highlights how governance, regulations, and policy frameworks shape climate finance flows. Strong institutions and transparent management improve fund effectiveness and reduce misallocation14.
Results:
The True Cost of Fossil Fuels
Fossil fuels are finite—some estimates suggest oil may run out within a century. As we tap into reserves once set aside, we must ask a critical question:
What should be done once all fossil fuels are used up.
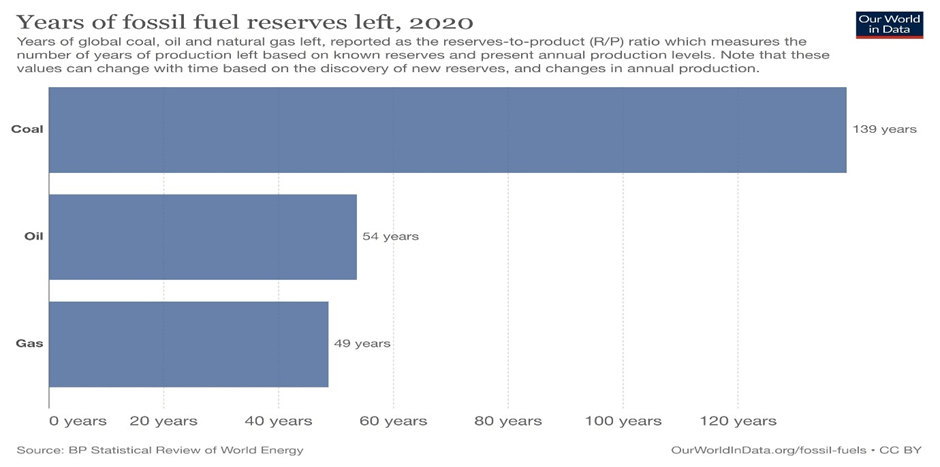
Fossil fuels currently supply 85% of global energy, far more than nuclear or renewables. Their use drives climate change, ice melt, desertification, and species loss, making them a major environmental threat. So why haven’t we fully shifted to clean energy? The answer lies in technology’s failure to fully replace fossil fuels so far15.
Even with growth over the past decade, solar power contributes only 4.5% of global energy.16 It still lags behind hydropower and wind as a preferred renewable source explaining the continued dependence on fossil fuels.
Solar technology comes in two forms: thermal (heats buildings/water) and photovoltaic (produces electricity to supplement or replace grid power).
Current Status in India (Initiatives and Positives):
India ranks fourth in climate-driven migration, with over 3 million displaced in 2020–21 (State of India’s Environment – 2022). The graph below highlights India’s coal-heavy energy use and the need for a shift.

Utilizing projections from the IEA’s World Energy Outlook 2023 (WEO2023), our most current policy scenario implies that, under Stated Policies Scenarios (STEPS),17 India’s total energy-related emissions are estimated to peak around 2035, with emissions from the power sector peaking around 203018. Overall, the share of power generated by coal is currently about 55%, which is marginally less than estimated for 2022. As with NEP2023, we have observed increased solar capacity additions but declining wind capacity additions.

Due to prolonged heatwaves, India has experienced a significant surge in summer electricity demand. To meet this demand, the government of India has authorized gas and coal plants to work at full capacity. Coal production and coal imports in 2023 were at record levels.19 India is working to mitigate its carbon footprint. The first step in this action was the National Action Plan on Climate Change (NAPCC). Sworn into action in 2008, the NAPCC outlined a national climate adaptation and sustainability blueprint, complete with eight missions to achieve better ecological footprints. By 2022, governments progressed with the eight missions that comprised NAPCC and resubmitted NDCs (nationally determined contributions) to announce its intentions for climate adaptations moving forward.
Coal remains India’s main power source, generating over 70% of electricity and 40% of national emissions. The coal-reliant energy sector accounts for most emissions (see Fig. 6). The graph below compares renewable and non-renewable costs, highlighting why India sees potential in renewables.
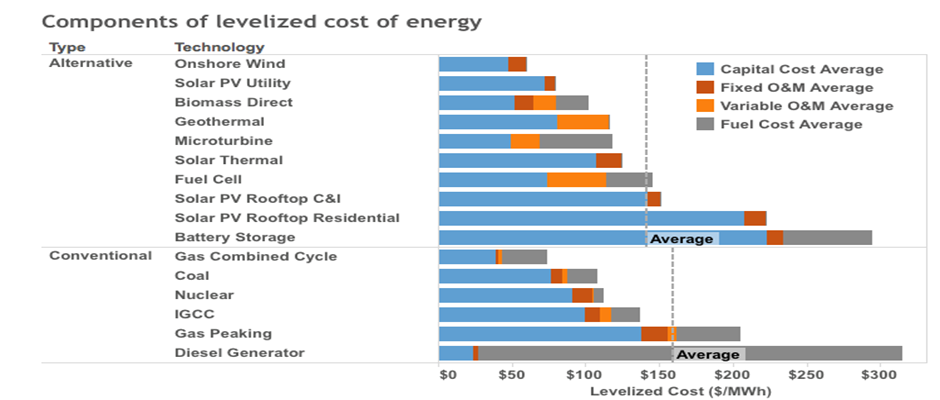
An example of the betterment of renewables comes through the increase in rooftop solar which can be reflected through the following graph:20

Existing Policies and Regulatory Framework in India
India’s climate finance system includes complex policies and tools to tackle climate change, but mobilizing enough resources for its goals remains a challenge.21
Policy Design and Financing Needs
India’s 2008 National Action Plan on Climate Change (NAPCC) is the country’s flagship climate policy, which contains eight missions covering solar energy, energy efficiency, and climate-resilient agricultural practices.22. In order to achieve the outlined goals of the NAPCC, India will need approximately USD 2.5 trillion in climate finance between 2015-2030, or USD 170 billion annually, and by 2070, roughly USD 10.1 trillion in total, as per the International Finance Corporation (IFC)23. For India to limit the climate finance need, a coordinated climate finance strategy and framework is needed.
The good news is that climate finance has increased, reportedly tripling total financing between 2016 and 2021 (USD 57 billion)24. However, the country does have a USD 120 billion gap to fill for mitigation by 2030.
Regulatory Initiatives and Challenges
To boost climate investment, India introduced tools like sovereign green bonds to cut carbon intensity.25 However, the due to weak demand; in November 2024, the Reserve Bank of India was forced to allocate 70% of the issue went to primary dealers26 highlighting the need for more competitive green financial products
Private Sector Participation
Private investment is rising, with corporate investors making up 47% of climate finance in 2023. Yet, much more is needed to meet climate goals.
Barriers to Effective Climate Finance Mobilization
- Policy : Unclear, unpredictable policies deter private investment.
- Institutional: Limited capacity and complex systems slow fund distribution.
- Informational: Poor climate data and risk information hinders decisions.
- Problems:
Climate change could reduce India’s GDP by 3% to 10% annually by 2100.27
- Under a business-as-usual scenario, India’s per capita GDP may fall by 2.6% in 2030, 6.7% in 2050, and 16.9% by 2100.28 Sectors likely to be affected include infrastructure, labour productivity, agriculture, and public health.

India’s adaptation cost was INR 29 trillion in 2020, projected to rise to INR 86 trillion by 2030 (DEA, 2020). Yet, 2020 funding was just INR 370 billion annually, (CPI, 2022). Mostly from strained public budgets29.
Climate change is accelerating with some impacts, like sea level rise, potentially irreversible within human lifetimes30. Global temperatures were 1°C above pre-industrial levels for the eighth straight year in 202231. The WMO (2023) warns of a 66% chance of exceeding 1.5°C in at least one year between 2023 and 2027
Important economic risks associated with climate change include:
• Impacts on productivity, technology development, and climate adaption.
• Rising adaptation costs, stranded assets, and economy-policy feedbacks.
• Agriculture is most vulnerable.
• Increased disease risk (e.g. Zika, dengue, Lyme) and allergies from higher temperature and rainfall.
• Extreme weather harms mental health, (e.g. vulnerable populations, children, elderly, low-income communities).
• Warming waters cause harmful algal blooms; wildfires degrade air quality; sea level rise and biodiversity loss hurt tourism.
Business and Financial Sector Impacts
Climate-related events disrupt supply chains, raise water and input costs, and increase risks across energy, transport, and insurance sectors. Natural disasters like floods and cyclones cost India up to USD 9.8 billion annually, USD 7 billion from floods alone32, disproportionately affecting vulnerable groups through asset loss, displacement, and livelihood disruption.
India lost USD 79.5 billion to climate-related disasters from 1998–2017, with 1,800 deaths and 1.8 million displaced across 14 states in 2019 alone33. These events significantly affect output and inflation. Coastal cities face rising long-term flood risks by 2050, 35 million people could be at risk annually. A half-meter sea-level rise could triple exposure and drastically increase asset losses. Without adaptation, Mumbai alone could face over USD 700 billion in flood damages34.
Broader Economic Effects Rising temperatures and erratic rainfall threaten GDP growth, trade balance, and fiscal health (RBI, 2024), impacting agriculture, health, migration, and productivity. Heat stress alone could cost India 34 million jobs by 2030, 4.5% of GDP35. Further losses stem from reduced crop yields and climate-related health impacts, undermining development goals36.
Challenges of Integrating Renewables into Power Grids
Integrating renewable energy into existing grids is challenging due to technical, economic, and regulatory limits. Unlike controllable fossil fuels, solar and wind are weather-dependent, causing unpredictable output and grid instability. This variability requires real-time balancing through forecasting, demand response, and storage solutions37.
Inadequate storage limits the use of surplus energy. Traditional grids, built for centralized, controllable power, struggle with the added complexity and variability of distributed sources, increasing risks of congestion, overloads, and outages.
Upgrading to smart grids, HVDC, and flexible systems will require major investment38. During the transition to full renewable generation, grid stability and power quality may suffer. Lacking inertia from traditional generators, renewables can cause voltage instability, frequency deviations, and harmonics.
Storage, grid-forming inverters, and synchronous condensers offer limited reliability39. Until scaled, overreliance on renewables poses risks. Achieving reliable integration will require billions in infrastructure, new technologies, and updates to outdated market frameworks still favoring centralized fossil generation.
New market mechanisms like capacity markets, flexible pricing, feed-in tariffs, and storage incentives are essential40. Reliable integration requires long-term planning across grid upgrades, policy, technology, and regulation. Collaboration among governments, utilities, and industry is key to building a resilient low-carbon energy system
India’s Solar Progress and Opportunities
India is advancing solar initiatives to reduce import dependence and build 65 GW of manufacturing capacity, with 48 GW qualifying for PLI subsidies. The IEA estimates this could meet domestic demand through 2030, though progress depends on scaling local technologies and long-term R&D.
Perovskite solar panels are a promising innovation, offering 30% more energy and 10% lower costs than silicon41. They require low-temperature processing and use 75% less energy than polysilicon, making them ideal for large-scale, low-cost production.
Perovskites can power vehicles, satellites, rural grids, and IoT devices at various price points. They also reduce reliance on silicon panels, enabling hybrid perovskite-silicon manufacturing. U.S.-based production avoids many supply chain and labour issues tied to polysilicon, as they don’t require complex mineral inputs
Commercial deployment remains tricky. However, perovskites offer the possibility of rapidly scaling up solar energy solutions in the decade ahead, enabling India to become a leader in cost-effective, scalable clean energy.
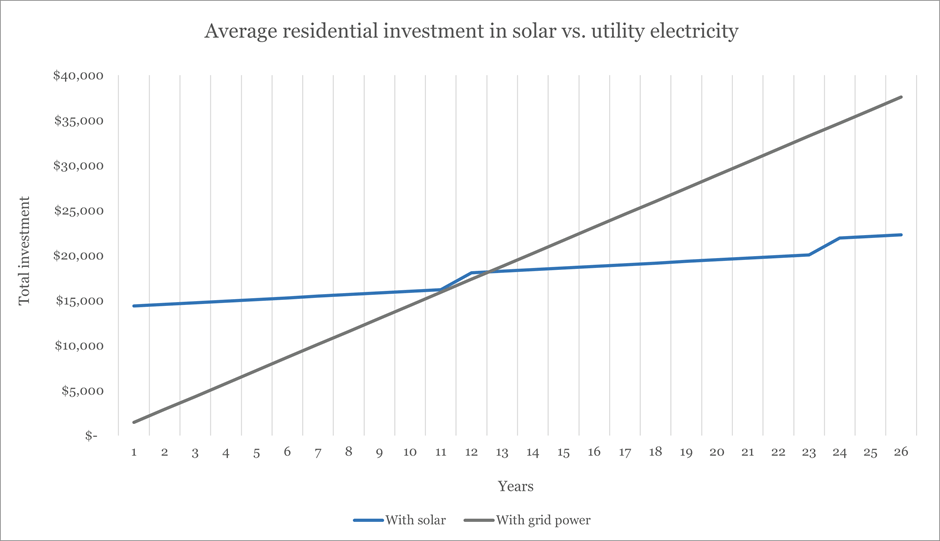
Residential Solar Savings & Advantages
By year 13, grid electricity costs exceed the initial investment in solar. By 2030, homeowners could save around $9,400. Rooftop solar offers stable tariffs, with most costs upfront and minimal ongoing expenses unlike rising utility rates leading to long-term savings.
Scaling Perovskite Solar Technology
Western perovskite research remains at prototype scale. To compete globally, large-scale production is needed. Solar power supports climate action, grid resilience, and energy independence. Public-private partnerships can speed up this shift.
An ESG expert highlighted the potential of high-efficiency PV cells and the need for grid upgrades. They were sceptical of India’s 2030 climate goals but saw 2070 as achievable with more progress. They stressed the need for clear climate finance policies, subsidies, and legislative support to ensure social and economic benefits.
Wave & Tidal Energy: Status and Potential
Waves and tides offer consistent, reliable energy, but adoption has been slow due to design, transmission, and infrastructure challenges.
Wave Power Innovation (M3 Wave)
M3 Wave’s submerged device avoids surface risks and is compact, minimizing disruption to marine life and ocean views. Using dual air chambers and a bi-directional turbine, it can produce 150–500 kWideal for mobile or disaster relief use
Tidal Innovation (Brown University Hydrofoil)
A hydrofoil device that moves up and down with tidal flows to regenerate energy and folds to safely allow marine traffic. A 10-kW prototype supported by ARPA-E is in development and is promising as the hydrofoil can make office with lower tidal speeds.
Challenges
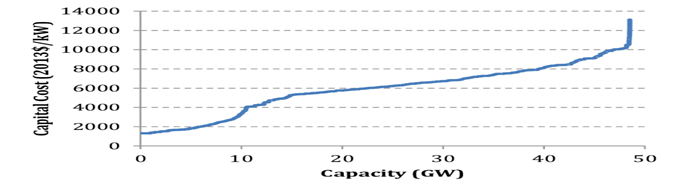
Tidal energy is highly predictable, unlike solar and wind, but its current global output is under 0.003%. High capital costs (~$15,000/kW), low turbine efficiency (40–50%), and harsh ocean conditions result in high maintenance costs (~40% of total cost). Limited viable sites and ecological concerns add further barriers.
Investment Disparities
In 2022, offshore wind secured $35B in funding while tidal energy only got $600M, even though tidal has equal to or higher capacity factors (50-60%). With technological advancements such as floating technology or hybrid integration, along with feed-in tariffs, costs may be reduced by 80% which could allow tidal to be the cheaper alternative than nuclear (ORE Catapult, 2024)
Innovations in Wind Power
1. Vertical Axis Wind Turbines (VAWTs):
VAWTs increase efficiency by around 15% compared to traditional HAWTs when installed in optimized arrangements and close spacing of 3 diameters apart with a wind angle of 60° translates to a 3% efficiency reduction. VAWTs have versatility that make them usable in urban locations.
2. Diffuser-Augmented Wind Turbines (DAWTs):
These HAWTs use wind funnels to focus airflow, raising efficiency. Japanese prototypes are achieving 100 kW output.42
3. Vortex-Induced Vibration (VIV):
A cylinder on an elastic rod oscillates with wind, using resonance and an alternator to generate power. Compact and innovative.
4. Floating & Tethered Turbines:
These alternatives are being tested for use in deep-sea or mobile environments, with potential to scale wind in new terrains.
Challenges and Current Status
Wind power is challenged by intermittency (35%–45% availability, so grid storage and backups are needed) and is constrained by Betz’s Law (59.3% max), and most turbines don’t achieve >45%–50%.43
Material Dependency:
Neodymium and dysprosium key turbine elements are 85% sourced from China, creating supply risks.44
Cost & Social Factors:
Offshore wind (> $3,500/kW) costs more than onshore wind ($1,300 − $2,200/kW) – even though offshore has a better capacity factor. Noise (35 − 45 dB) and visual prohibition are causing slow adoption; 67% of U.S. landowners view wind as intrusive.45
Subsidy Disparities:
In 2022, global renewable subsidies were $73B, skewed toward solar despite wind’s higher EROI. Recycling is also a concern85% of turbine blades still end up in landfills.46
Discussion
Economic Viability: Wind vs. Solar
Solar:
There was a decline in the cost of solar PV to $0.10/kWh by 2017, and these costs are continuing to decline. The IEA model states that solar could account for 5% of the world’s electricity by 2030 and 16% by 2050 with an abatement of CO₂ equivalent to roughly 6 billion tons/year.44 Some modest scenarios suggest solar could cover 76% of global electricity by 2050. However, concerns persist about mining impacts, remote locations, and panel e-waste.
Wind:
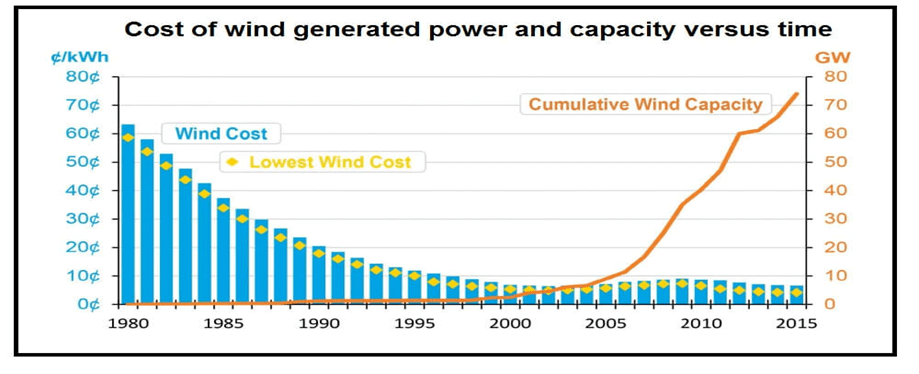
Between 2010–2019, LCOE for onshore wind dropped 39%; offshore wind fell 29%, with innovations and policy support further improving prospects.
Technological Advancements:
Wind turbines are evolving in efficiency because of larger rotor diameters, taller towers, and better materials leading to increased energy output and reduced costs per unit. Manufacturing and installation economies of scale have lowered capital costs.
Market Growth:
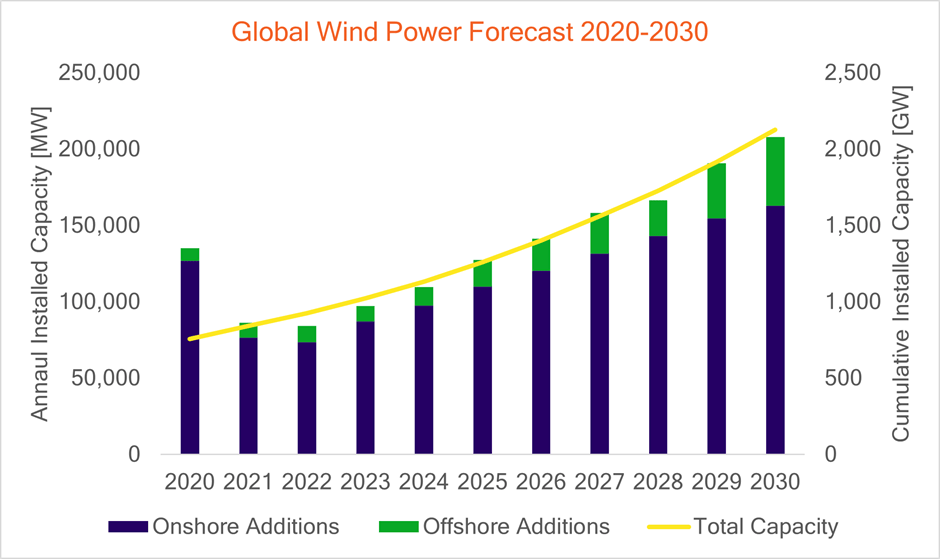
Global wind capacity is projected to rise from 651 GW (2019) to 1,123 GW by 2025, driven by supportive policies and increasing demand for clean energy.47
Competitive Auctions:
Countries like Brazil, India, and Mexico have successfully used competitive auctions to lower wind energy contract prices.
Corporate PPAs:
With growing corporate demand for renewables, power purchase agreements (PPAs) offer wind projects stable revenue, reducing reliance on subsidies.
Challenges:
Wind still has intermittency that needs to be improved with grid integration and storage. Making sure communities and wildlife are not negatively impacted by wind/farms, from development to operations, is crucial. Wind can, and should be, a primary source of sustainable energy if we keep innovating, cutting costs, and driving good policies.
Hydropower Viability:
Hydropower remains economically competitive with stable LCOE, around $0.05/kWh in 2022.46

Technological Advancements:
Improved turbine tech, dam design, and pumped storage have enhanced hydropower efficiency. Advances in run-of-river and small-scale systems expand deployment options.
Rehabilitation & Upgrades:
Existing plants are being modernized to boost efficiency, extend lifespan, and reduce environmental impact.
Market Dynamics:
Hydropower is growing gradually though not as fast as some other renewables. Global hydropower capacity is estimated to grow from 1,330 GW in 2020 to 1,600 GW in 2030, thanks to new systems in developing countries and refurbishing systems in developed countries.48
Integration with Renewables:
Hydropower complements variable renewables like wind and solar by offering grid stability and storage. Pumped storage, in particular, helps balance supply and demand.
Challenges:
- Environmental & Social Impact: Large hydropower can displace communities and harm ecosystems. Proper planning and stakeholder engagement are essential.
- Financing Issues: High upfront costs and long payback periods hinder investments. Solutions include concessional finance, PPPs, and innovative funding models.
- Water Resource Management: Sustainable hydro use requires balancing water needs across sectors.
Outlook:
Hydropower remains key to the global energy mix due to cost stability, tech advances, and policy support. Despite challenges, its reliability and synergy with other renewables ensure its future. Success depends on innovation, resilient infrastructure, and sustainability.
Environmental and Social Considerations
Solar Power: Solar energy has minimal environmental impact during operation. Key concerns land use and panel disposal are being mitigated through recycling. It supports job creation in manufacturing, installation, and maintenance.
Wind Power: Environmentally low-impact but can harm birds and bats; offshore setups may disrupt marine life. Noise and aesthetics affect social acceptance.
Hydropower: Alters ecosystems, water quality, and may displace communities. Social tensions may arise from water use conflicts.
Conclusion:
While wind and hydropower hold promise, solar is the most cost-effective due to falling costs, low O&M expenses, and high revenue potential. Its low LCOE and minimal environmental impact make it ideal for large-scale deployment.
Economic Viability of Climate Investment in India
Investing in climate action fosters sustainable development, economic growth, job creation, energy security, and improved public health. Green technologies offer long-term returns and climate resilience.
Climate Finance Sources
Global funds such as GEF, GCF, SCCF, and LDCF provide support for climate goals in India. Additionally, domestically, there exist sovereign wealth funds, pensions, private equity, and green bonds which all help to provide finance. Furthermore, institutions like REC and PFC exist that can provide complements to finance for green projects.
Investment Risks
- Physical Risks: Extreme weather and sea-level rise disrupt operations and damage infrastructure.
- Transition Risks: Evolving regulations, tech shifts, and consumer behaviour affect markets and fossil fuel assets.
- Market Risks: Natural disasters trigger volatility in asset prices. Modelling uncertainty adds unpredictability.
Despite these, careful risk analysis enables investors to navigate climate finance successfully.
Ideal Energy Source for India
Solar power is the best. Its cost has fallen tremendously (e.g. $0.06/kWh by 2017 per IRENA) and India’s high solar insolation makes it a real prospect. It is now among the least expensive energy sources in existence.
Short & Long-Term Impacts
Short-Term: Jobs, energy security, and economic stimulus through renewable infrastructure
Long-Term: Cleaner air, reduced healthcare costs, less impact on climate, and improved global competitiveness. A strong renewable sector can create new trade opportunities.
R&D Viability
Breakthroughs in solar PV illustrate how R&D slashes costs and boosts competitiveness. Continued innovation is essential to scale renewable technologies affordably.
Final Note
The economic case for India’s move toward solar powered renewables is indisputable and the strategic one is paramount. Climate finance and green investments create opportunities for immediate returns as well as resilience for the long run, which will create lasting prosperity for India, and provide leadership for the world in the green economy.
References
- UNFCCC. 2019. “Nationally Determined Contributions (NDCs) | UNFCCC.” Unfccc.int. 2019. https://unfccc.int/process-and-meetings/the-paris-agreement/nationally-determined-contributions-ndcs. [↩] [↩] [↩]
- “Why Is Climate Finance so Important? | International Rescue Committee (IRC).” 2023. Www.rescue.org. December 5, 2023. https://www.rescue.org/article/why-climate-finance-so-important. [↩]
- Stern, Nicholas. 2006. « Stern Review: the Economics of Climate Change ». http://mudancasclimaticas.cptec.inpe.br/~rmclima/pdfs/destaques/sternreview_report_complete.pdf. [↩] [↩]
- Stern, Nicholas. 2006. « Stern Review: the Economics of Climate Change ». http://mudancasclimaticas.cptec.inpe.br/~rmclima/pdfs/destaques/sternreview_report_complete.pdf. [↩]
- Intergovernmental Panel on Climate Change. 2021. “Climate Change Widespread, Rapid, and Intensifying.” The Intergovernmental Panel on Climate Change. 2021. https://www.ipcc.ch/2021/08/09/ar6-wg1-20210809-pr/. [↩]
- “Figure 2. The Map highlights most risky and least risky Countries,” ResearchGate [↩]
- Dey, Subhashish, Anduri Sreenivasulu, G. T. N. Veerendra, K. Venkateswara Rao, and P. S. S. Anjaneya Babu. 2022. “Renewable Energy Present Status and Future Potentials in India: An Overview.” Innovation and Green Development 1 (1): 100006. https://doi.org/10.1016/j.igd.2022.100006. [↩]
- « World Energy Outlook 2021 – Analysis ». IEA. octobre 2021. https://www.iea.org/reports/world-energy-outlook-2021. [↩]
- « Global Landscape of Climate Finance 2023 ». s. d. CPI. https://www.climatepolicyinitiative.org/publication/global-landscape-of-climate-finance-2023/. [↩]
- Buchner, Barbara, Alex Clark, Angela Falconer, Rob Macquarie, Chavi Meattle, Rowena Tolentino, et Cooper Wetherbee. 2019. « A CPI Report ». https://climatepolicyinitiative.org/wp-content/uploads/2019/11/2019-Global-Landscape-of-Climate-Finance.pdf. [↩] [↩]
- « Annual Report 2020 ». 2021. International Environmental Technology Centre. 9 juillet 2021. https://www.unep.org/ietc/news/story/annual-report-2020. [↩]
- Stern, Nicholas. 2006. « Stern Review: the Economics of Climate Change ». http://mudancasclimaticas.cptec.inpe.br/~rmclima/pdfs/destaques/sternreview_report_complete.pdf [↩]
- OECD. 2015. “Education at a Glance 2015.” OECD. 2015. https://www.oecd.org/en/publications/2015/11/education-at-a-glance-2015_g1g59741.html. [↩]
- « OECD Economic Outlook, Volume 2021 Issue 1 ». 2021. OECD. 31 mai 2021. https://www.oecd.org/en/publications/2021/05/oecd-economic-outlook-volume-2021-issue-1_88e062cf.html. [↩]
- MET Group. 2021. “When Will Fossil Fuels Run Out?” MET Group. January 18, 2021. https://group.met.com/en/mind-the-fyouture/mindthefyouture/when-will-fossil-fuels-run-out [↩]
- IEA. 2023. “Solar PV.” International Energy Agency. https://www.iea.org/energy-system/renewables/solar-pv [↩]
- n.d. https://www.researchgate.net/figure/Pie-chart-showing-of-distribution-of-power-sources-The-Government-of-India-has-been_fig1_314110462. [↩]
- 2023b. “World Energy Outlook 2023 – Analysis.” IEA. October 2023. https://www.iea.org/reports/world-energy-outlook-2023. [↩]
- PTI. 2024. “India’s Coal Import Rises 8% to 268 MT in FY24.” The Economic Times. https://economictimes.indiatimes.com/news/economy/foreign-trade/indias-coal-import-rises-8-to-268-mt-in-fy24/articleshow/110049693.cms?from=mdr [↩]
- “Components of Levelized Cost of Energy.” n.d. Energy Innovation: Policy and Technology. https://energyinnovation.org/2015/02/07/levelized-cost-of-energy/dashboard-7/. [↩]
- Gopi. 2019. “India’s Rooftop Solar Capacity – Infographics.” Social News XYZ, June 6. https://www.socialnews.xyz/2019/06/06/infographics-indias-rooftop-solar-capacity-gallery/. [↩]
- Tiwari, Saumya. 2024. « Transforming India’s Climate Finance through Sector-Specific Financial Institutions ». CPI. 8 avril 2024. https://www.climatepolicyinitiative.org/transforming-indias-climate-finance-through-sector-specific-financial-institutions/. [↩]
- « Blended Finance for Climate Investments in India ». 2023. IFC. 2023. https://www.ifc.org/en/insights-reports/2023/blended-finance-for-climate-investments-in-india?. [↩]
- « India: annual climate finance | Statista ». 2021. Statista. 2021. https://www.statista.com/statistics/1553587/annual-climate-finance-in-india/. [↩]
- « India incorporates green bonds into its climate finance strategy ». s. d. World Bank Blogs. https://blogs.worldbank.org/en/climatechange/india-incorporates-green-bonds-its-climate-finance-strategy. [↩]
- Dharamraj Dhutia. 2024. « India cenbank devolves 70% of new green bonds, cutoff below 10-year note ». Reuters, 29 novembre 2024. https://www.reuters.com/world/india/india-cenbank-devolves-70-new-green-bonds-cutoff-below-10-year-note-2024-11-29/. [↩]
- “Climate Finance in India 2023 – IIHS Knowledge Gateway.” 2023. Iihs.co.in. 2023. https://iihs.co.in/knowledge-gateway/climate-finance-in-india-2023/. [↩]
- “CLIMATE FINANCE in INDIA 2023 CLIMATE FINANCE in INDIA 2023.” 2023. Researchgate. November 23, 2023. https://www.researchgate.net/publication/376001292_CLIMATE_FINANCE_IN_INDIA_2023_CLIMATE_FINANCE_IN_INDIA_2023#:~:text=In%20a%20business%2Das%2Dusual,%2C%20labour%20productivity%2C%20and%20infrastructure. [↩]
- Bhatt, Swati. n.d. “India’s Cost of Adapting to Climate Change Needs Seen at $1 Trillion by 2030, Report Says.” https://www.reuters.com/business/sustainable-business/indias-cost-adapting-climate-change-needs-seen-1-trillion-by-2030-report-2023-05-03/. [↩]
- Intergovernmental Panel on Climate Change. 2021. “Climate Change Widespread, Rapid, and Intensifying.” The Intergovernmental Panel on Climate Change. 2021. https://www.ipcc.ch/2021/08/09/ar6-wg1-20210809-pr/.\ [↩]
- 2024a. “Climate Change Poses Challenges for Monetary Policy, Says RBI Report.” The Economic Times. Economic Times. April 8, 2024. https://economictimes.indiatimes.com/news/economy/policy/climate-change-poses-challenges-for-monetary-policy-says-rbi-report/articleshow/109139315.cms?from=mdr. [↩]
- « UNISDR annual report 2015 ». s. d. Www.undrr.org. https://www.undrr.org/publication/unisdr-annual-report-2015. [↩]
- UNDRR Annual Report 2019 (47138) ». 2019. Undrr.org. 2019. https://www.undrr.org/media/47138. [↩]
- Hallegatte, Stephane, Colin Green, Robert J. Nicholls, et Jan Corfee-Morlot. 2013. « Future flood losses in major coastal cities ». Nature Climate Change 3 (9) : 802‑6. https://doi.org/10.1038/nclimate1979. [↩]
- Goswami, Urmi. 2022. « Heat stress may wipe out 4.5% of India’s GDP, cost 34mn jobs by 2030 ». The Economic Times. Economic Times. 30 novembre 2022. https://economictimes.indiatimes.com/news/economy/indicators/heat-stress-may-wipe-out-4-5-of-indias-gdp-cost-34mn-jobs-by-2030/articleshow/95894524.cms?from=mdr. [↩]
- s. d. https://www.imf.org/-/media/Files/Publications/REO/AFR/2020/April/English/ch2.ashx. [↩]
- Le, Bisping, Horn Sr, Duberstein Ca, T Haigh, L Moon, E Dinh, K Norris, et al. 2024. « Pacific Northwest National Laboratory Annual Site Environmental Report for Calendar Year 2023 ». Consulté le 21 juin 2025. https://www.pnnl.gov/main/publications/external/technical_reports/PNNL-36464.pdf. [↩]
- McKinsey & Company. 2024. « Integrating renewable energy sources into grids | McKinsey ». Www.mckinsey.com. 8 février 2024. https://www.mckinsey.com/industries/electric-power-and-natural-gas/our-insights/how-grid-operators-can-integrate-the-coming-wave-of-renewable-energy. [↩]
- “18th International Conference on Energy Sustainability.” 2024. Asme.org. 2024. https://event.asme.org/ES-2024. [↩]
- Rodríguez, Laura. 2023. « Challenges of integrating renewables into today’s power grids — RatedPower ». Ratedpower.com. 27 février 2023. https://ratedpower.com/blog/challenges-integrating-renewables-ower-grid/. [↩]
- World, Renewable Energy. 2024. “Are Perovskites the Future of Solar Energy?” Renewable Energy World. March 11, 2024. https://www.renewableenergyworld.com/solar/are-perovskites-the-future-of-solar-energy/#gref. [↩]
- n.d. https://www.researchgate.net/figure/Wind-lens-turbine-the-mechanism-and-its-performance_fig1_312564963. [↩]
- IRENA. 2023. “Renewable Power Generation Costs in 2022.” Www.irena.org. August 29, 2023. https://www.irena.org/Publications/2023/Aug/Renewable-Power-Generation-Costs-in-2022. [↩]
- IEA. 2023a. “Solar PV.” International Energy Agency. 2023. https://www.iea.org/energy-system/renewables/solar-pv. [↩] [↩]
- NREL, 2023; Wiser & Bolinger, 2022 [↩]
- IRENA. 2023. “Renewable Power Generation Costs in 2022.” Www.irena.org. August 29, 2023. https://www.irena.org/Publications/2023/Aug/Renewable-Power-Generation-Costs-in-2022. [↩] [↩]
- GWEC. 2023. “Global Wind Report 2023.” Global Wind Energy Council. February 14, 2023. https://gwec.net/globalwindreport2023/. [↩]
- International Hydropower Association. 2022. “Facts about Hydropower.” Www.hydropower.org. 2022. https://www.hydropower.org/iha/discover-facts-about-hydropower. [↩]


