
Abstract
Mental illness is a growing concern globally, yet early detection and diagnosis remain challenging due to the subtle nature of symptoms and stigma surrounding mental health. This study aims to bridge the gap in understanding the relationship between online behavior and indicators of mental illness by utilizing natural language processing (NLP) and machine learning (ML). The present research analyzed a set of social media posts labeled to indicate mental health condition, applying sentiment analysis with machine learning techniques to preprocess and extract features from the text. The exploration aims to derive a deeper understanding of the relationship between online presence and serious medical conditions, along with additional insights that can aid health professionals in advancing diagnoses and treatment planning, building upon prior work in the field. Our findings show that 1) the correlation between the class labels and a sentiment measure was strong, 2) after using a feature selection technique, only 0.493% of features had a feature importance score greater than zero, and 3) the Gaussian Naive Bayes model outperformed both Logistic Regression and Random Forest. The findings suggest that the present model has potential for large-scale application in research settings, pending further validation. Overall, the proposed approach offers a scalable tool for identifying mental health indicators from text data.
Keywords: Natural Language Processing (NLP), Mental Illness, Machine Learning Models, Sentiment Analysis, Feature Importance, Predictive Measures, N-Gra
Introduction
Mental health is becoming an increasingly prominent issue as we progress through the 21st century1‘2. In the United States alone, around 19.86% of adults experience a mental illness, with more than 8% of those illnesses being depression3. Early recognition of mental health symptoms is critical to ensuring individuals receive timely and appropriate care. According to the World Health Organization, about two-thirds of mental illnesses are left untreated, which is a substantial amount of people facing detrimental effects. Untreated illnesses such as PTSD and depression significantly increase suicide risk, with 90% of cases linked to mental health illnesses4.
The current study aims to explore the role of social media in correlation to mental illness. Social media has been proven to take a prominent role in many cases of depression and other illnesses. Platforms that include Twitter, Instagram, and Snapchat often contribute to mental health disorders through comparisons and societal pressures5. According to the Pew Research Center, 69% of adults and 81% of teens in the U.S. use social media, placing them at a high potential risk6. The widespread use of social media presents a valuable opportunity to explore its potential for early detection of mental illness. The goal is to build off the usage of Natural Language Processing (NLP) models, a subfield of artificial intelligence that enables computers to analyze, interpret, and generate human language5. These algorithms aid in detection by incorporating sentiment analysis and predictive measures on social media data, essentially answering the question of: Can leveraging social media and public forums detect the signs for a possible mental illness?
There have been many studies conducted around the idea of utilizing NLP models to diagnose a mental illness. Within said studies, many of the computer simulations researchers have created to identify illnesses take input consisting of Facebook and Reddit posts, such as the research done by Schwartz et al. (2014), where labeled results, ones with pre-analyzed output indicating the presence or absence of mental illness, from Facebook users were analyzed to create an estimated depression score7. Expanding on this research, Thorstad et al. (2019) employed a dataset of Reddit posts as input to dilate the platforms taken advantage of, and trained an
L2-penalized logistic regression model within scikit-learn, a Python library, using C = 1, which is a default regularization strength parameter8. This model held importance since it revolved around the concept of using only a few words to create a prediction, rather than the prior belief that models typically relied on a substantial volume of textual input to produce a result. Rather than a “yes” or “no” technique, a few research papers expanded the types of mental illness addressed, such as Dinu et al. (2021), who used Transformers-based models BERT, XLNet, and RoBERTa to classify nine varieties of mental health concerns9. Similarly, Murarka et al. (2011) also went with three classifiers: LSTM, BERT, and RoBERTa10. However, these results were sorted into a series of six categories rather than nine: ADHD, Anxiety, Bipolarity, Depression, PTSD, and None. Both of these research projects allowed for specific categorizations of mental illnesses detected within text derived from social media. Diseases such as bipolarity and PTSD are niche varieties under the umbrella-term “mental illness” that provide an additional analysis done by the sorting computer model.
While previous models focused on identifying mental illness, Sailunaz et al. (2019) made equally significant contributions to text analysis identifying mental health flags11. Using Twitter data as input, these researchers cleaned and preprocessed pieces of text before applying a Naïve Bayes classifier, which is a supervised machine learning algorithm commonly used for text classification due to its probabilistic foundation and simplicity12, to come up with the corresponding sentiment and emotion. This technique is coined as sentiment analysis, and the process plays a huge role in the NLP industry. The results were a complex series of scores and accuracy rates with categories consisting of seven emotions and three sentiment types. Building on this advancement, Benrouba et al. (2021) conducted a sentiment and emotional analysis of tweet content13. For their analysis, the researchers identified around 450 words in the English
dictionary that signify positive emotions. Once this was completed, each tweet was transformed into an array showcasing any of the following emotions: sadness, anger, joy, fear, disgust. After this, the research defined the “perfect” sentiment matrix using the IBM API, with the rows representative of the tweet samples and the columns containing the ideal intensity score for each of the five emotions. The completion of the analysis leveraged Euclidean Distance to calculate the similarity between the tweet’s emotional matrix and the defined perfect matrix for comparison.
Although both these projects were not directly connected to detecting mental health disorders, the concept of deriving an emotional or sentiment scoring is a factor that can enhance any mental health detecting NLP. In turn, this provides health professionals with additional intel to obtain highly specific analyzes of a patient’s mental health status, enhancing the medical credibility and efficiency in cases worldwide. This growing body of work underscores the importance of analyzing user-generated content, directly aligning with this study’s goal of leveraging text analysis for early mental illness detection. By utilizing both pure labeled results and sentiment analysis, a merge of what the various papers did above, the present research has the potential to construct a model with higher accuracy to diagnose mental illness in a manner that provides medical specialists with insights to help them navigate a treatment plan for patients.
Data
The dataset (Table 1) this research utilizes is the Mental Health Corpus found on the Kaggle database, consisting of a set of textual paragraphs derived from various social media platforms. The file size is 13.11 MB, with the average length of 72 words (Table 1), and incorporates both the raw text (text column) and an expert labeled section, consisting of labels 0 and 1 (label counts: 13,838 and 14,139 respectively), where 1 represents a positive result when searching for mental illness, and 0 demonstrates the opposite. This dataset has 27,972 corpora, which is significantly larger than datasets used in previous studies, such as the work done by Ameer et. al (2022), which consisted of 16,930 values4. The larger dataset allows for more accurate results to pinpoint even the slightest appearance of a mental health disorder.
However, it is important to note that limited documentation is available regarding the expert labeling process for this dataset, including the criteria used or inter-rater reliability statistics. This limitation is now acknowledged as a potential source of labeling bias for future consideration.
| Statistic | Value |
| Mean | 72 |
| Standard Deviation | 104 |
| Minimum | 0 |
| 25% Quartile | 16 |
| Median | 38 |
| 75% Quartile | 87 |
| Maximum | 2,676 |
Note: This table summarizes the statistics of data, including the average amount of words per input, longest and shortest textual input, and other factors that are relevant to the dataset.
Methodology

The overall machine learning pipeline is illustrated in Figure 1, which outlines the preprocessing and modeling steps. The model begins with ingesting the data. After inputting the data, the model preprocessed each text and removed any “stop-words”. These are words that have no actual relevance or correlation to the presence of mental illness and therefore have no substantial value to the model. We also applied tokenization to split each text into individual word units, which enabled more granular analysis. However, stemming and lemmatization were not performed to preserve full word forms, which is important to n-gram analysis, where emotional context, such as ‘suicidal’ vs. ‘suicide’, may be important. Words such as “the” and “as” fall into this category, and removing these terms allows the model to focus on important words such as “hate” or “kill”, which have a significantly higher probability of being correlated to mental illness.
After the data was preprocessed, we leverage the VaderSentiment Python Application Programing Interface (API) in order to calculate the sentiment of each body of text. The tool returned a continuous sentiment value between -1.0 and 1.0 for each entry. Following this analysis, the model computed the Pearson Correlation Coefficient (Formula 1), which is a metric used to evaluate the linear relationship between two continuous variables. Assuming that negative sentiment values are more likely to be associated with mental illness, sentiment scores below 0 were mapped to label 1 (mental illness presence), while scores >= 0 were mapped to label 0 (no mental illness).
Formula 1. Pearson’s Correlation Coefficient
![\[r = \frac{\sum (x_i - \bar{x}) (y_i - \bar{y})}{\sqrt{\sum (x_i - \bar{x})^2 \sum (y_i - \bar{y})^2}}\]](https://nhsjs.com/wp-content/ql-cache/quicklatex.com-07249b1e88279f3d653c4d6f153c06da_l3.png "Rendered by QuickLaTeX.com")
In the formula for Pearson’s Correlation Coefficient (Formula 1), 𝑥1 and y1 represent individual values from the two variables, such as sentiment scores and binary mental illness labels. The 𝑥̄ and 𝑦̄ are the two variables respective means. This formula assumes a linear relationship between two continuous variables and measures the strength and direction of that relationship. A value of +1 indicates a perfect positive correlation, -1 indicates a perfect negative correlation, and 0 indicates no correlation.
Using unigrams, bigrams, and trigrams, the machine learning model analyzed each string of words and calculated feature importance based on frequency and relevance across the dataset. Unigrams refer to a singular word, while bigrams and trigrams represent sequences of two and three words, respectively. Calculating feature importance allowed for a ranked assessment of which textual elements were most correlated with the presence of mental illness. For example, it can be inferred that n-grams such as “suicidal” or “I hate myself” yielded higher importance scores than neutral or positive phrases like “happy” or “I am excited”. After the code ran through the feature importance for the 1,546 n-grams that were derived from the data, we sorted the results in order of most to least significant. In addition to this, we also analyzed features with importance scores greater than 0, as these were considered as having propensity.
To streamline the dataset, we first applied chi-squared feature selection to filter out low-relevance n-grams based on their statistical dependence with class labels. After reducing the feature space, we computed feature importance scores for the remaining n-grams using a count-based approach. This allowed us to focus on the most informative tokens with both statistical and semantic relevance when classifying mental illness from text.
The next step involved training the model. We leveraged logistic regression, Gaussian Naive Bayes, and Random Forest as machine learning models for this training. The following is a brief overview of the three models and their functionality:
Logistic regression is a type of classifier that is used for predictive measures. It is able to calculate the probability of the occurrence of an event through a logit function. Logistic regression is the simplest model of the three, yet this simplicity does not imply poorer performance. This model’s distinction relies on its accuracy when it comes to the predict_proba function, which returns class probabilities, as it is able to make precise estimates that top that of the other two models.
Gaussian Naive Bayes implements the Gaussian Naive Bayesian algorithm for classification. The model assumes feature likelihoods are Gaussian (Formula 2), meaning each feature’s values are distributed according to a normal distribution within each class. Mathematically, this is represented in Formula 2, where μy and σ 2 are the mean and variance of feature xi in class y, respectively. While a decent classifier, it is known to be a poor probability estimator. Therefore, predict_proba outputs from Gaussian Naive Bayes should be interpreted with caution. All in all, when considering the allocation of Gaussian Naive Bayes in a research project such as this, it is important to identify what the goal is regarding whether there is a heavier focus on results or the probability of said results.
Formula 2. Gaussian Probability Density Function
![\[P(x_i \mid y) = \frac{1}{\sqrt{2\pi\sigma^2_y}} \exp \left( -\frac{(x_i - \mu_y)^2}{2\sigma^2_y} \right)\]](https://nhsjs.com/wp-content/ql-cache/quicklatex.com-e97a7dc221ede26006cde32b00cda1c5_l3.png "Rendered by QuickLaTeX.com")
Random Forest is a machine learning model that builds multiple decision trees using bootstrapped samples of the training data, and then aggregates the prediction to improve accuracy and reduce overfitting. The manipulation of data division plays a key role in Random Forest and is often the reason why so many people decide to use this model when conducting thorough analysis using NLP. Additionally, one attribute of Random Forest that sets it apart from logistic regression and Gaussian Naive Bayes is that it can run feature importance, which the other two models lack the ability to do. This is a bonus supplemental factor that can be leveraged by mental health professionals in the industry to further examine the pattern recognition amongst various cases of illnesses.
Our program trained the three models above and compared the results based on precision, recall, and f-score. To actually train the models, we followed the 80-20 rule and utilized 80% of the dataset for training, and the remaining 20% for testing. Along with training the model to return a labeled value, we also incorporated predict_proba to run a probability analysis of the binary outcome to give users an idea of how likely the model’s result is true.
After the models were all successfully trained, we ran through the remaining data for testing purposes and recorded the three factors mentioned above: precision, recall, and F1-score.
Additionally, to determine whether the observed differences in model performance (precision, recall, and F1-score) were statistically significant, we conducted paired t-tests on per-sample classification correctness between each pair of models. This statistical test compares the differences in prediction outcomes on the same test set, allowing us to understand whether the performance differences observed between models were likely due to chance or were statistically meaningful.
It is important to note that mapping all negative sentiment scores to a positive mental illness label is a simplification that may misclassify neutral or context-dependent expressions of sadness as pathological. Future work should consider more nuanced sentiment analysis or multi-class labeling approaches to better capture the complexity of mental health indicators in text.
Discussion
Formula 3. F1-Score Formula
![\[F_{\beta} = \frac{(1 + \beta^2) \cdot (\text{precision} \cdot \text{recall})}{(\beta^2 \cdot \text{precision} + \text{recall})}\]](https://nhsjs.com/wp-content/ql-cache/quicklatex.com-1e38c89bf1401d85240374cd0578e013_l3.png "Rendered by QuickLaTeX.com")
For a more profound understanding of the three models, we conducted a calculation of the metrics for each model. The metrics we took into consideration consisted of precision, recall, and f-score. Precision refers to the ratio of tp / (tp + fp), where tp is an abbreviation for true positives and fp is for false positives. This essentially describes the accuracy of the model to return the correct label diagnosing a mental illness based on the text. Recall refers to the ratio of tp / (tp + fn), where fn is an abbreviation for false negatives. This metric calculates how accurately the model can identify actual positive cases. A high recall suggests that the model is able to identify the majority of the actual positive results, while a low recall signifies that the model is missing out on numerous positive results. Lastly, the present study points out the
F1-score, which is a calculated value following a formula (Formula 3) that solves for a numerical value combining both precision and recall, also known as a weighted harmonic mean. An F1-score of 1 indicates a perfect balance between precision and recall, meaning that both are at their maximum possible value. Since the F1-score ranges from 0 to 1, values closer to 1 represent a better overall balance between precision and recall, while lower scores represent a drawback in that either precision, recall, or both are lacking.
Since this research focuses on binary classification, we utilized the F1-micro score. This metric aggregates the contributions of both classes to compute global precision and recall, offering a balanced evaluation of overall performance. F1-micro is particularly well-suited for binary tasks where the goal is accurate classification across all instances. In contrast, F1-macro averages the F1-scores of each class independently and is more appropriate for multi-class or heavily imbalanced multi-label tasks where class-level performance must be evaluated equally.
Given our dataset’s imbalance, and our focus on maximizing detection across the entire sample, F1-micro provides a more representative and reliable measure of model effectiveness in this context.
Following the methodology, it is clear that different models have their own advantages over others. The results of the metrics (Table 2) indicate that Logistic Regression achieved the highest precision score (0.893), suggesting that it was the most conservative model, having effectively minimized false positives but at the cost of missing more true cases, as shown by its lower recall of 0.770. This behavior reflects that this model type was more hesitant to label text as indicating mental illness unless highly confident, which could be beneficial in settings where false positives carry a higher cost. Gaussian Naive Bayes yielded the highest recall (0.954) and F1-score (0.883), making it the strongest overall performer in terms of balanced classification abilities. Random Forest performed between the two, with high precision (0.867) and balanced F1-score (0.802). To summarize, all three models demonstrated strong performance for text-based mental illness detection.
To statistically validate the observed performances, we analyzed the results of the paired sample t-tests on their classification accuracy across individual test samples. In order to deem a t-test statistically significant, the p-value should be less than or equal to 0.05. The paired t-test between Logistic Regression and Gaussian Naive Bayes yielded a p-value of 0.319, indicating no significant difference. Similarly, the t-test between Logistic Regression and Random Forest produced a p-value of 0.416, still above the 0.05 or less range. Finally, the comparison between Gaussian Naive Bayes and Random Forest produced a p-value of 0.123, which likewise did not translate to a difference. These results suggest that while performance metrics may have varied, the differences between models are not too statistically significant as to pose a concern, according to this test.
However, while Gaussian Naive Bayes excelled in recall and F1-score, it is important to acknowledge a key limitation of the model in that it assumes feature independence. In the context of text data, especially with the use of n-grams, this assumption is unrealistic, as words and phrases often exhibit strong contextual dependencies. Despite this, Gaussian Naive Bayes is known for its efficiency and strong baseline performance in high-dimensional datasets, which may explain its success in this task. Future work may consider more complex models that better capture feature dependencies, such as deep learning-based classifiers or transformer architectures.
Random Forest differentiates itself through its transparency by incorporating feature importance, detailing what specific words and word combinations align with the likelihood of mental illness. This interpretable feature makes it valuable in clinical settings where understanding the rationale behind a classification is just as important as the actual classification.
A simpler way to conceptualize the comparison between these models is as follows: Gaussian Naive Bayes acts as an efficient and aggressive detector, flagging the largest number of at-risk individuals. Logistic Regression prioritizes precision and reduces false “alarms”. Lastly, Random Forest serves as a middle ground, offering both relevant performance and interpretability through feature importance rankings.
| Precision | Recall | F-Score | |
| Logistic Regression | 0.893 | 0.770 | 0.827 |
| Gaussian Naive Bayes | 0.822 | 0.954 | 0.883 |
| Random Forest | 0.867 | 0.747 | 0.802 |
The Pearson correlation coefficient (Formula 1) between sentiment and mental illness label was -0.346 (p < 0.001), indicating a moderate negative linear relationship. This suggests that more negative sentiment in text is moderately associated with the presence of a mental illness label. While this is not a strong correlation, it is statistically meaningful in behavioral sciences, where values between 0.3 and 0.5 (regardless of sign) are often considered practically significant. This aligns with the assumption that negative emotional language increases the likelihood of a mental illness label. In practical terms, this indicates that sentiment may be a helpful signal, but not a definitive predictor of mental illness. Therefore, it should be used alongside other textual features rather than as a standalone diagnostic measure.
Notably, this finding aligns with clinical research. For example. the National Library of Medicine (2024) identifies common symptoms such as suicidal ideation, anger, and anxiety, all of which are emotionally negative states likely to influence sentiment analysis results. While the relationship is correctional, not causal, it provides valuable insight for further exploration in computational mental health screening.
After the model ran through the correlation code, it progressed onto the feature importance section with count vectorization. Both Table 3 and Figure 2 showcase the top most significant n-grams, ranging from unigrams to trigrams, in regard to mental illness found across the dataset. As displayed, Table 3 and Figure 2 present the n-gram with the highest feature importance score to be “suicidal”, with a value of ~0.008. This unigram is nothing out of the ordinary, as we expected words such as these to appear in the top twenty most important n-grams.
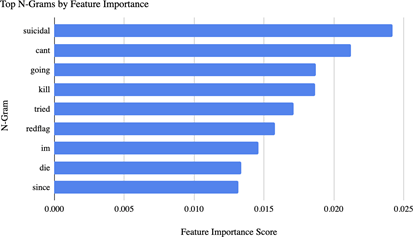
| N-Gram | Feature Importance |
| Suicidal | 0.02421973127 |
| Cast | 0.02122034879 |
| Going | 0.01870042847 |
| Kill | 0.01865535862 |
| Tried | 0.01711179655 |
| RedFlag | 0.01576951538 |
| Im | 0.01462451881 |
| Die | 0.01339363552 |
| Since | 0.01316318311 |
Lastly, the results of the chi-squared feature selection. One of the most fascinating aspects of our research is actually what we discovered through chi-squared. Only 1546 unique tokens (unigrams, bigrams, and trigrams) out of 129,901 total tokens showed statistically significant association (p < 0.05) with the class label during chi-square feature selection. This reflects a feature sparsity problem, with only around 0.5% of features showing discriminative power for mental illness classification, which is a small number of words with propensity. We acknowledge that alternative feature selection methods such as mutual information or L1 regularization could provide complementary insights, and exploring these in future work is strategy to enhance model robustness.
Ethical Considerations
The development of automated tools to detect mental illness from social media content presents significant ethical challenges. These include issues with informed consent, user privacy, and the possibility of misuse or incorrect diagnosis, particularly when used outside of a clinical setting. Although the data used in this study was anonymized and made publicly available from the Kaggle Mental Health Corpus, we acknowledge that rigorous ethical oversight, including institutional review and explicit privacy safeguards, would be necessary for real-world deployment. The model is intended for academic research only and should not be interpreted as a diagnostic tool. Future iterations must be developed in collaboration with clinical professionals and ethics boards to ensure responsible application.
Furthermore, we recognize the serious ethical risks of deploying this model in real-world contexts, such as analyzing workplace emails to identify mental illness. Such applications could violate employee privacy, lack informed consent, and lead to harmful consequences such as stigma or discrimination. False positives — where individuals under temporary stress might be misclassified as mentally ill — could result in unjust treatment or surveillance. To avoid these outcomes, we emphasize that this model is intended purely for academic exploration. Any future deployment would require strict ethical guidelines, transparency, informed consent, and clinical validation to mitigate potential harm.
Conclusion
By integrating sentiment analysis, n-gram feature importance, and chi-squared selection, the model demonstrated the capacity to detect meaningful linguistic patterns associated with mental health conditions. Among the models tested, Gaussian Naive Bayes performed best in terms of precision, although we acknowledge the independence assumption it relies on is often violated in real-world text data. Nonetheless, the results offer compelling evidence that machine learning can play a valuable role in augmenting mental health analysis, particularly when paired with complementary tools and human oversight.
The broader implications of this research point toward the potential for scalable, accessible early-warning systems that can assist in identifying signs of mental distress through textual expression. However, it is critical to recognize that this model is not a diagnostic tool, nor should it be used in isolation to make clinical judgments. Textual data—particularly from social media—may not always accurately reflect an individual’s mental health state, and false positives or misclassifications could have serious consequences if used irresponsibly. These concerns are especially important in high-risk contexts such as workplaces, where privacy, informed consent, and the potential for discrimination must be considered with utmost caution.
While previous versions of this study considered applications such as email analysis within organizations, we now stress that such uses must be approached with extreme care, if at all. Any future deployment should involve full transparency, user consent, ethical oversight (akin to Institutional Review Boards), and validation by mental health professionals. Our work is intended as a research exploration—one that highlights the technical possibilities of NLP and machine learning in supporting mental health awareness, not as a tool for unsolicited surveillance or diagnosis.
Moving forward, future research should consider the integration of more context-sensitive models, such as transformer-based architectures like BERT or RoBERTa, as well as the use of psychological lexicons specifically tuned to mental health discourse. Expanding the dataset to include clinically validated cases, and collaborating with mental health experts, can enhance the credibility and effectiveness of such tools. Ultimately, our goal is to contribute to a future in which technology is used responsibly—to empower individuals, improve access to mental health resources, and support professionals in delivering timely care.
While this study demonstrates technical feasibility, it remains an early-stage, exploratory project. The model has not undergone clinical validation or real-world testing, and therefore, any claims of diagnostic utility or deployment, whether in apps or organizational settings, would be premature. Before real-world use can be considered, extensive clinical collaboration, validation with diverse populations, and longitudinal testing are essential. This work is a foundation for future research, not a substitute for professional diagnosis or ethically vetted mental health interventions.
References
- Thorstad, R., & Wolff, P. (2019). Predicting future mental illness from social media: A big-data approach. Behavior Research Methods, 51, 1586–1600.; Gkotsis, G., Oellrich, A., Hubbard, T., Dobson, R., Liakata, M., Velupillai, S., & Dutta, R. (2016). The language of mental health problems in social media. In Proceedings of the Third Workshop on Computational Linguistics and Clinical Psychology (pp. 63–73). [↩]
- G. Gkotsis, A. Oellrich, T. Hubbard, R. Dobson, M. Liakata, S. Velupil lai and R. Dutta, Proceedings of the Third Workshop on Computational Linguistics and Clinical Psychology, 2016, pp. 63–73. [↩]
- Ameer, I., Arif, M., Sidorov, G., Gómez-Adorno, H., & Gelbukh, A. (2022). Mental illness classification on social media texts using deep learning and transfer learning. arXiv preprint arXiv:2207.01012.; Jurafsky, D., & Martin, J. H. (2024). Speech and Language Processing (3rd ed., draft). Stanford University. https://web.stanford.edu/~jurafsky/slp3/ [↩]
- Ameer, I., Arif, M., Sidorov, G., Gómez-Adorno, H., & Gelbukh, A. (2022). Mental illness classification on social media texts using deep learning and transfer learning. arXiv preprint arXiv:2207.01012. [↩] [↩]
- Jurafsky, D., & Martin, J. H. (2024). Speech and Language Processing (3rd ed., draft). Stanford University. https://web.stanford.edu/~jurafsky/slp3/ [↩] [↩]
- Sharma, C. M., Damani, D., & Chariar, V. M. (2023). Review and content analysis of textual expressions as a marker for depressive and anxiety disorders (DAD) detection using machine learning. Discover Artificial Intelligence, 3(1), 38.; Benrouba, F., & Boudour, R. (2023). Emotional sentiment analysis of social media content for mental health safety. Social Network Analysis and Mining, 13(1), 17. [↩]
- Schwartz, H. A., Eichstaedt, J., Kern, M., Park, G., Sap, M., Stillwell, D., Kosinski, M., & Ungar, L. (2014). Towards assessing changes in degree of depression through Facebook. In Proceedings of the Workshop on Computational Linguistics and Clinical Psychology: From Linguistic Signal to Clinical Reality (pp. 118–125). [↩]
- Thorstad, R., & Wolff, P. (2019). Predicting future mental illness from social media: A big-data approach. Behavior Research Methods, 51, 1586–1600. [↩]
- Dinu, A., & Moldovan, A.-C. (2021). Automatic detection and classification of mental illnesses from general social media texts. In Proceedings of the International Conference on Recent Advances in Natural Language Processing (RANLP 2021) (pp. 358–366). [↩]
- Murarka, A., Radhakrishnan, B., & Ravichandran, S. (2021, April). Classification of mental illnesses on social media using RoBERTa. In Proceedings of the 12th International Workshop on Health Text Mining and Information Analysis (pp. 59–68). [↩]
- Sailunaz, K., & Alhajj, R. (2019). Emotion and sentiment analysis from Twitter text. Journal of Computational Science, 36, 101003. [↩]
- Zhang, H. (2004). The optimality of Naive Bayes. AA, 1(2), 3. [↩]
- Benrouba, F., & Boudour, R. (2023). Emotional sentiment analysis of social media content for mental health safety. Social Network Analysis and Mining, 13(1), 17. [↩]


