
Abstract
The size of the institution of medicine within the United States is vast, with 2023 national health expenditure of 4.9 trillion dollars, or about 18% of gross domestic product. Approximately 18 million people work in the healthcare industry, making this sector the largest employer in the US. Given its vast scope and critical role, the institution and its leaders have the responsibility to act in ways that promote trust in people and the communities they serve, as distrust can prevent people from making informed health decisions and accessing essential resources. Our study utilized nationally representative data from N=22,185 respondents surveyed in the 1977-2024 General Social Survey (GSS) to assess whether the level of trust in the leaders of the institution of medicine differed by race, other socio-demographic characteristics, political affiliation, and attitudinal perceptions over time. We fit a weighted ordinal logistic regression model with the level of trust (hardly any, only some, and a great deal) as the three-level outcome. Covariates included sex, age, educational attainment, race, perceived family income, and opinions on national health spending and national drug addiction spending. We found a secular decrease in the proportion of adults nationally who expressed a great deal of confidence in the leaders of the institution of medicine over time: from 54% in 1977 (95% confidence interval [CI]: 53.4% to 54.6%) to 25% in 2024 (95% CI: 24.4% to 25.6%). Compared to White adults, the odds of being more trustful were lower for Black adults (adjusted odds ratio [aOR]=0.90; 95% CI: 0.81 to 0.99), accounting for other socio-demographic characteristics, political party affiliation, and attitudinal perceptions. Compared to those who believed national spending on improving and protecting health was about right, the odds of being more trustful lower for those who believed spending is too little (aOR=0.61; 95% CI: 0.53 to 0.70) and for those who believed spending was too much (aOR=0.54; 95% CI: 0.43 to 0.68). Restoring public trust in the leaders of the institution of medicine is essential because it helps enable people to make better health choices and improve treatment adherence, which in turn helps reduce health inequities.
Introduction
The institution of medicine in the United States is a complex social system that comprises multiple entities including the healthcare workforce (e.g., doctors and nurses), public and private hospitals, insurance companies, private industry, non-profit organizations, and governmental agencies1‘2‘3‘4. These entities engage in healthcare delivery, healthcare coverage, and maintaining public health at the federal, state, local, private, and community levels4. At the federal level, the Department of Health and Human Services (HHS) oversees over a hundred programs under thirteen different agencies.5. The largest agencies include: the Centers for Medicare and Medicaid Services (CMS), which administers Medicare, Medicaid, and CHIP programs; the Food and Drug Administration (FDA), which regulates pharmaceuticals and medical devices; the Centers for Disease Control and Prevention (CDC), which oversees disease surveillance and public health; the National Institutes of Health (NIH), which funds biomedical research; and the Health Resources and Service Administration (HRSA), which oversees care for economically and medically vulnerable populations6.
At the state and local levels, health departments, county, and city health departments serve an important role in chronic disease screening and management, tobacco cessation, vaccine administration, and addressing social determinants of health. In addition to providing direct care, these agencies also drive policy and system-level changes to reduce health inequities7. Finally, at community levels, hospitals, clinics, and health organizations focus on the specific healthcare needs of the people in the community to strengthen their health and welfare8.
The size of the institution of medicine within the United States is vast, with 2023 national health expenditure of 4.9 trillion or about 18% of gross domestic product (GDP)9. In 2025, approximately 18 million people work in the healthcare industry, making this sector the largest employer in the United States10. There are also numerous leaders across the broad institution of medicine including healthcare system, pharmaceutical, and non-profit executives; doctors; elected officials; political appointees; and civil servants4.
Given its vast scope and critical role, the institution and its leaders have the responsibility to act in ways that promote trust in people and the communities they serve,11 as distrust can prevent people from making informed health decisions and accessing essential resources12. Trust is a multi-dimensional concept that involves the relationship among actors (e.g., patients, doctors, hospitals, insurance companies, pharmaceutical companies, governmental agencies)13. These complex relationships include various aspects of trust including risk-taking, belief in credible sources of information, and willingness to take risks with an expectation of benefit13. In the context of medical relationships, trust has been widely recognized as an essential element carrying both intrinsic and instrumental significance14‘15. Intrinsically, trust is the foundational characteristic that provides meaning and substance to the doctor-patient relationship16. Instrumentally, trust influences patient behaviors and attitudes about willingness to seek medical care, adhere to medical treatment, and participate in research for medical advancement17‘18‘19‘20‘21.
Patient trust is further defined as the willingness of individuals to accept vulnerability by relying on healthcare professionals to act in the best interest of patients22‘23. Wolfson and Lynch (2021) described trust in medical organizations as a multidimensional phenomenon including the so-called ‘4Cs’24. These include: 1) competency: providing evidence-based services effectively, reliably and consistently; 2) caring: showing concern, empathy, and concern for the patients; 3) communication: showing respect and understanding to those the organization serves; and 4) comfort: providing safe, fair, and equitable services, especially to marginalized communities24. Experiential trust—developed over time—is crucial for strong patient-physician relationships and the efficient use of healthcare resources14. In contrast, patients’ distrust in physicians erodes this relationship and weakens the quality of care provided.
Several studies show that trust in medicine has been declining in the last five decades across all demographic populations, but most notably since the COVID-19 pandemic19‘24‘25‘26‘27‘28. Smith and Son (2013), for example, found that overall confidence in medicine dropped from 61% in 1977 to 38.9% in 201227. And Baron and Berinsky (2019) showed similar findings with continuous decline of confidence in medicine from 80% in 1975 to 38% in 2019, and confidence in the people running medical institutions decreased from 61% in 1974 to 37% in 201829. This finding was further supported by Perlis et al. (2024), who showed that people’s trust in physicians and hospitals decreased substantially across all demographics from 71.5% in 2020 to 40.1% in January 202426.
Recognizing that the public’s trust in medicine is important in improving healthcare, especially when it comes to the adoption of health behaviors and health outcomes,19 several agencies have established initiatives to improve the public’s trust. For example, the ABIM Foundation established a Trust Practices Network bringing together diverse stakeholders including hospitals, health plans, medical societies, consumer groups, and employers, all of whom network to share their trust building strategies30 . However, multiple studies show racial disparities in level of trust towards the institution of medicine, which appear to be based on historical unjust treatments25‘31‘32‘33‘34‘35‘36.
Unethical medical treatments of Black people date back to at least the 1840s when enslaved African American females were subjected to painful experimental gynecological procedures without anesthesia37. This injustice continued well into the 1900s. One of the most significant historical events that shaped the trust in the healthcare system among African Americans is the Tuskegee Syphilis Study, conducted in 1932. This study revealed the gross injustice when US public health officials deliberately withheld syphilis treatment from African American males, subjecting these men to life threatening effects such as blindness, mental illness, and even death33‘38‘35‘36. Another example includes a case of HeLa cells, named after Henrietta Lacks, a young African American woman whose cervical cancer cells were collected in the mid-1900s and later used for research without her knowledge. HeLa cells were the first known human cell line capable of dividing indefinitely31‘39. These cells have significantly helped advance medical knowledge including treatment of cancer and other diseases. Nonetheless, these advancements came from the cells that were utilized without the patient’s consent31‘39‘40.
A more recent example involves a 1992-1998 study conducted at the New York State Psychiatric Institute, which recruited one hundred mostly African American boys, aged 6-10 years, to study the effects of the drug fenfluramine on reducing aggressive behaviors41‘42. These boys were younger brothers of incarcerated juveniles and their parents agreed to participation of these children. The drug had also been used as a popular obesity medication due to its appetite suppressant effects; however, it was withdrawn from the market in 1997 due to its cardiac side effects41‘43‘44‘45. Despite this recall, the researchers continued administering the drug to these boys for another year41.
While numerous studies have identified a secular decrease in the level of trust in the leaders of the institution of medicine and how it affects marginalized communities, there remains limited understanding of whether this decrease was faster over time for Black Americans than White Americans. Additionally, we also do not know if mistrust is more prevalent among people with lower levels of perceived income. This study addresses these gaps by utilizing 50-years of nationally representative General Social Survey (GSS) data to assess: 1) secular changes in the level of trust in the institution of medicine and 2) differences in the level of trust across race. We hypothesize that there has been a significant decline in the level of trust in the leaders of the institution of medicine over time. We also hypothesize that there is a difference in the level of this trust between Black and White Americans.
Methods
Data
Our study utilized nationally representative data from the General Social Survey. The GSS is a nationally representative survey used to collect data on Americans to track overall changes in public attitudes, behaviors, and opinions since 1972. It contains a variety of attitudinal and demographic questions.42 Questions in the GSS are weighted in accordance with the population information provided by the US Census Bureau through a raking algorithm to weight sums to known population totals for each category of variables46.
The primary outcome was confidence in the leaders of the institution of medicine, with respondents being given the prompt: “I am going to name some institutions in this country. As far as the people running these institutions are concerned, would you say you have a great deal of confidence, only some confidence, or hardly any confidence at all in them?”.
Covariates included socio-demographic and opinion-based variables that could be associated with the level of trust in the leaders of the institution of medicine. Specifically, we included: age, with levels 18-29 years old, 30-54 years old, 55-64 years old, and 65 and older; sex, with levels male and female; self-reported race, with levels White and Black; educational attainment, with levels less than high school education, high school graduate, and at least some college; rurality/urbanicity; region of country; country of birth; political party affiliation with levels strongly Democrat, not very strong Democrat, independent close to Democrat, independent neither, independent close to Republican, not very strong Republican, strong Republican, and other party; opinion on national health spending (“Improving and protecting the nation’s health … are we spending too much, too little, or about the right amount”); opinion on national drug addiction spending (“Dealing with drug addiction … are we spending too much, too little, or about the right amount”); and perceived family income (“Compared with American families in general, would you say your family income is far below average, below average, average, above average, or far above average?”). Our study began in 1977 as this was the first year in which GSS ascertained the outcome and all covariates. See Appendix Table 1 for the percent of observations missing per characteristic.
Statistical Analysis
First, we calculated the distribution of each characteristic for the sample. Second, we calculated the weighted prevalence of levels of trust in leaders of the institution of medicine over time (i.e., hardly any, only some, a great deal). For each level of trust, we fit a weighted linear regression to assess the overall time trend. Third, we also calculated this weighted prevalence by race (Black and White) over time. Fourth, we calculated the prevalence of level of trust across levels of each characteristic. Similarly, for each level of trust, we fit a weighted linear regression to assess the time trend by race. Fifth, we fit a weighted ordinal logistic regression model. The ordinal outcome was the level of trust. The levels were: hardly any, only some, and a great deal. The covariates included: sex, age group, educational attainment, race, political affiliation, opinion on national health spending, opinion on national drug addiction spending, and perceived family income.
We also conducted a series of secondary analyses. First, we fit a weighted ordinal logistic regression model for 2000-2024 data with expanded racial/ethnic categories (Hispanic, non-Hispanic Black, non-Hispanic White, non-Hispanic American Indian/Alaskan Native, non-Hispanic Asian, and other). Second, we fit a weighted logistic regression model for the 2000-2024 data with expanded racial/ethnic categories and included the interaction of race and year. We utilized R for all statistical analyses, including the packages tidyverse and srvyr. We set the type I error rate at  .
.
Results
Summary of Respondent Characteristics
The GSS ascertained the level of trust in the leaders of the institution of medicine and the covariates among N=22,185 adults between 1977 and 2024 (Table 1). Nearly half of the sample (46%) was aged 30-54-years old, 21% were 18-29-years old, 15% were 55-64 years old, and about 18% were 65 and older. The sample included 56% female and 44% male. The majority of the participants were White (85%) and 15% were Black. In terms of educational attainment, 49% had at least some college. Geographically, 36% resided in the South. Most participants (94%) were born in the US. By political party affiliation, 18% and 15% identified as strongly Democrat and not very strong Democrat, respectively. And 12% and 13% identified as strongly Republican and not very strong Republican, respectively. Regarding opinions on national spending, 66% of people responded that spending on improving and protecting health was too little. Finally, 47% of respondents perceived their family income as average relative to American families in general, 20% thought it was above average, and 25% thought it was below average.
Trust Over Time
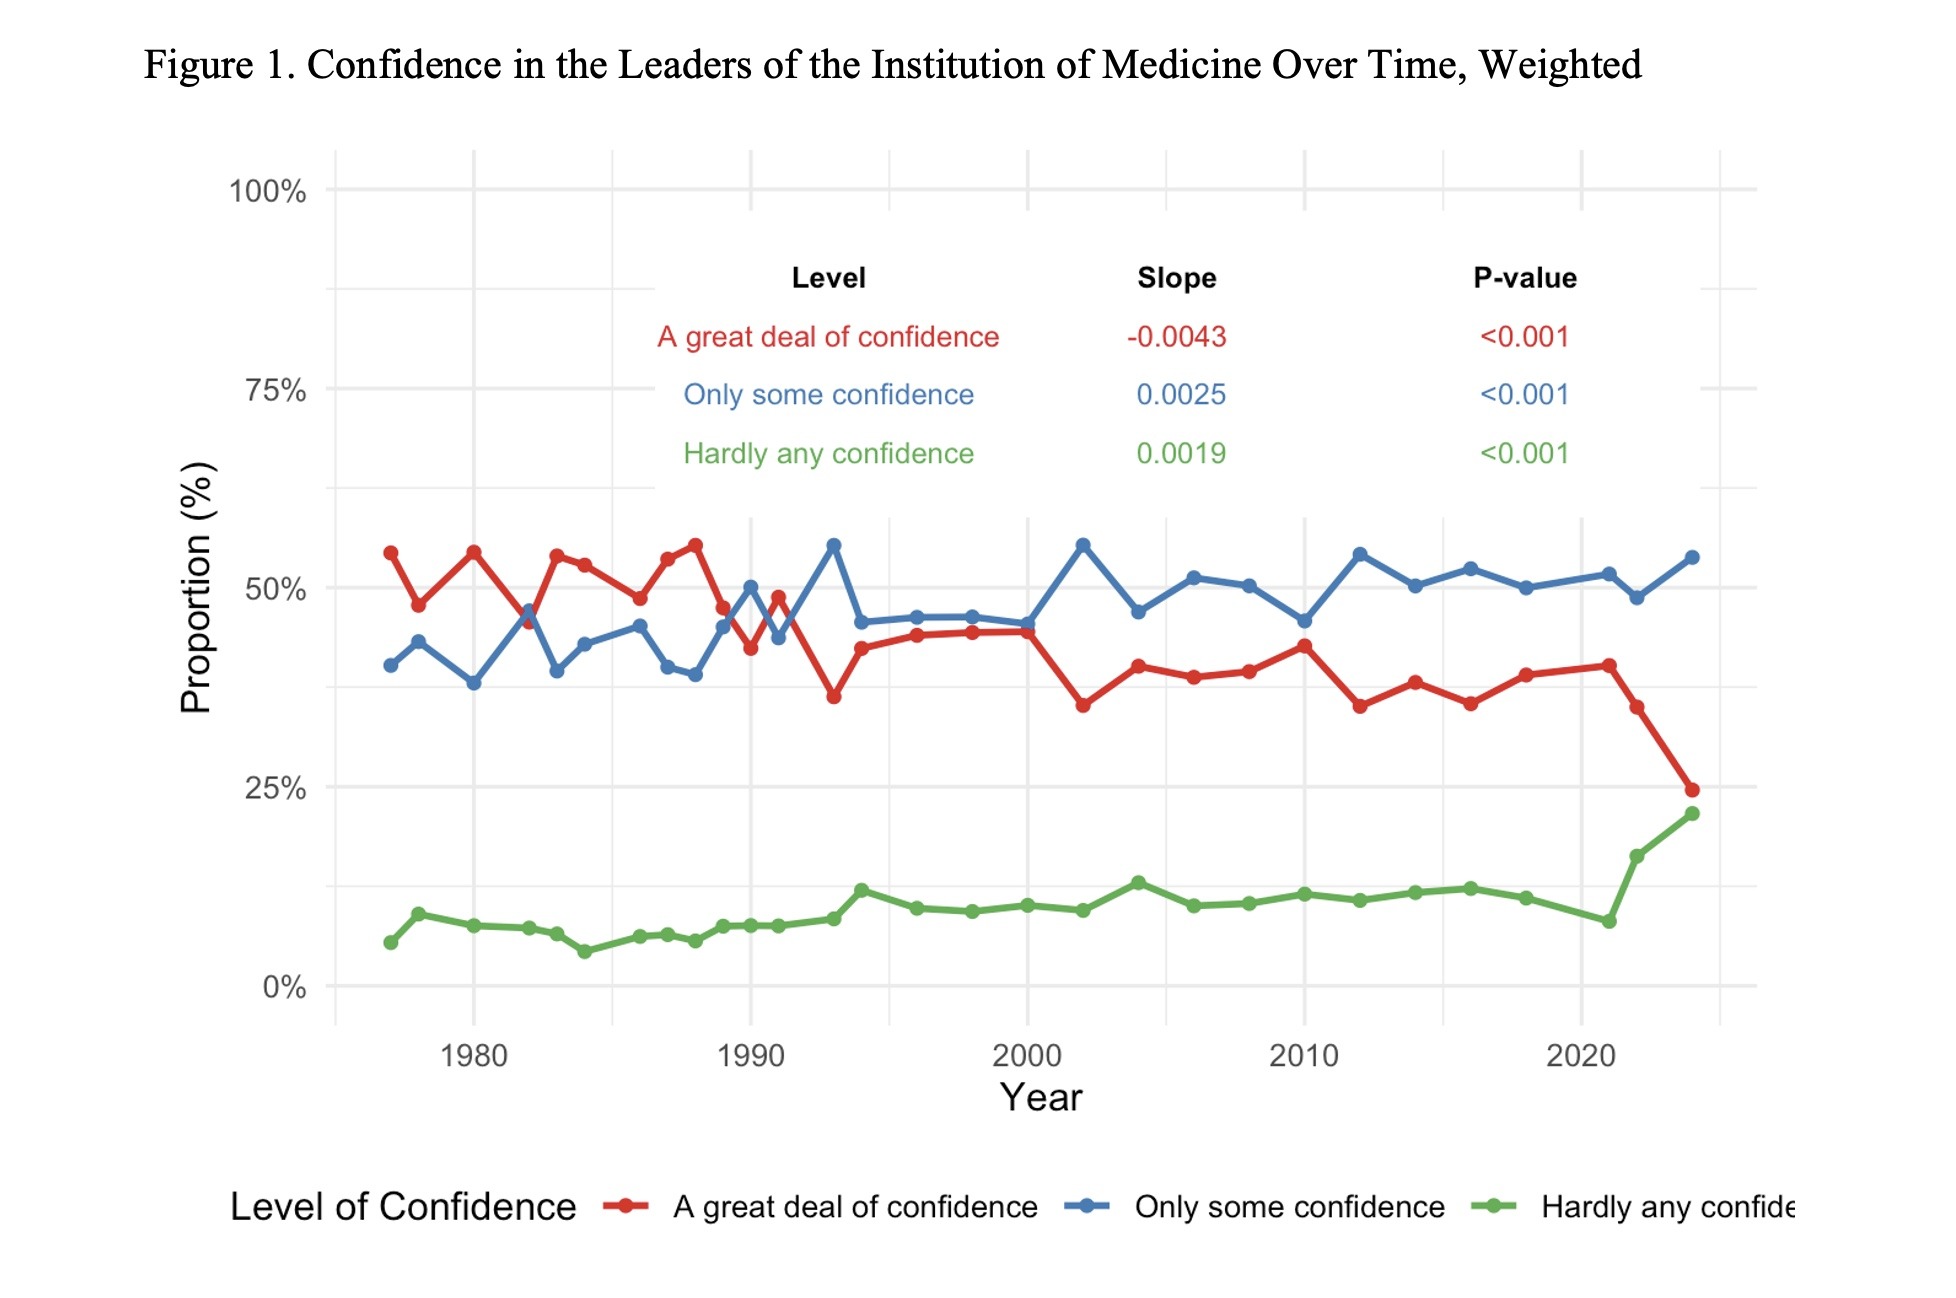
The proportion of adults nationally who expressed a great deal of confidence in leaders of the institution of medicine over time: from 54% in 1977 (95% confidence interval [CI]: 53.4% to 54.6%) to 25% in 2024 (95% CI: 24.4% to 25.6%; Figure 1). The proportion of adults nationally who expressed hardly any confidence varied between 10% and 12% between 1979 and 2020. After the COVID-19 pandemic, the proportion increased from 12% in 2020 (95% CI: 11.6% to 12.4%) to nearly 15% in 2022 (95% CI: 14.5% to 15.5%) to 22% in 2024 (95% CI: 21.4% to 22.6%). The proportion of adults nationally who expressed a great deal of confidence in the leaders of the institution of medicine decreased 4.3 percentage points per decade ( ). The proportion of adults nationally who expressed only some confidence in the leaders of the institution of medicine increased 2.5 percentage points per decade (). Finally, the proportion of adults nationally who expressed hardly any confidence in the leaders of the institution of medicine increased 1.9 percentage points per decade ().
Trust Over Time by Race
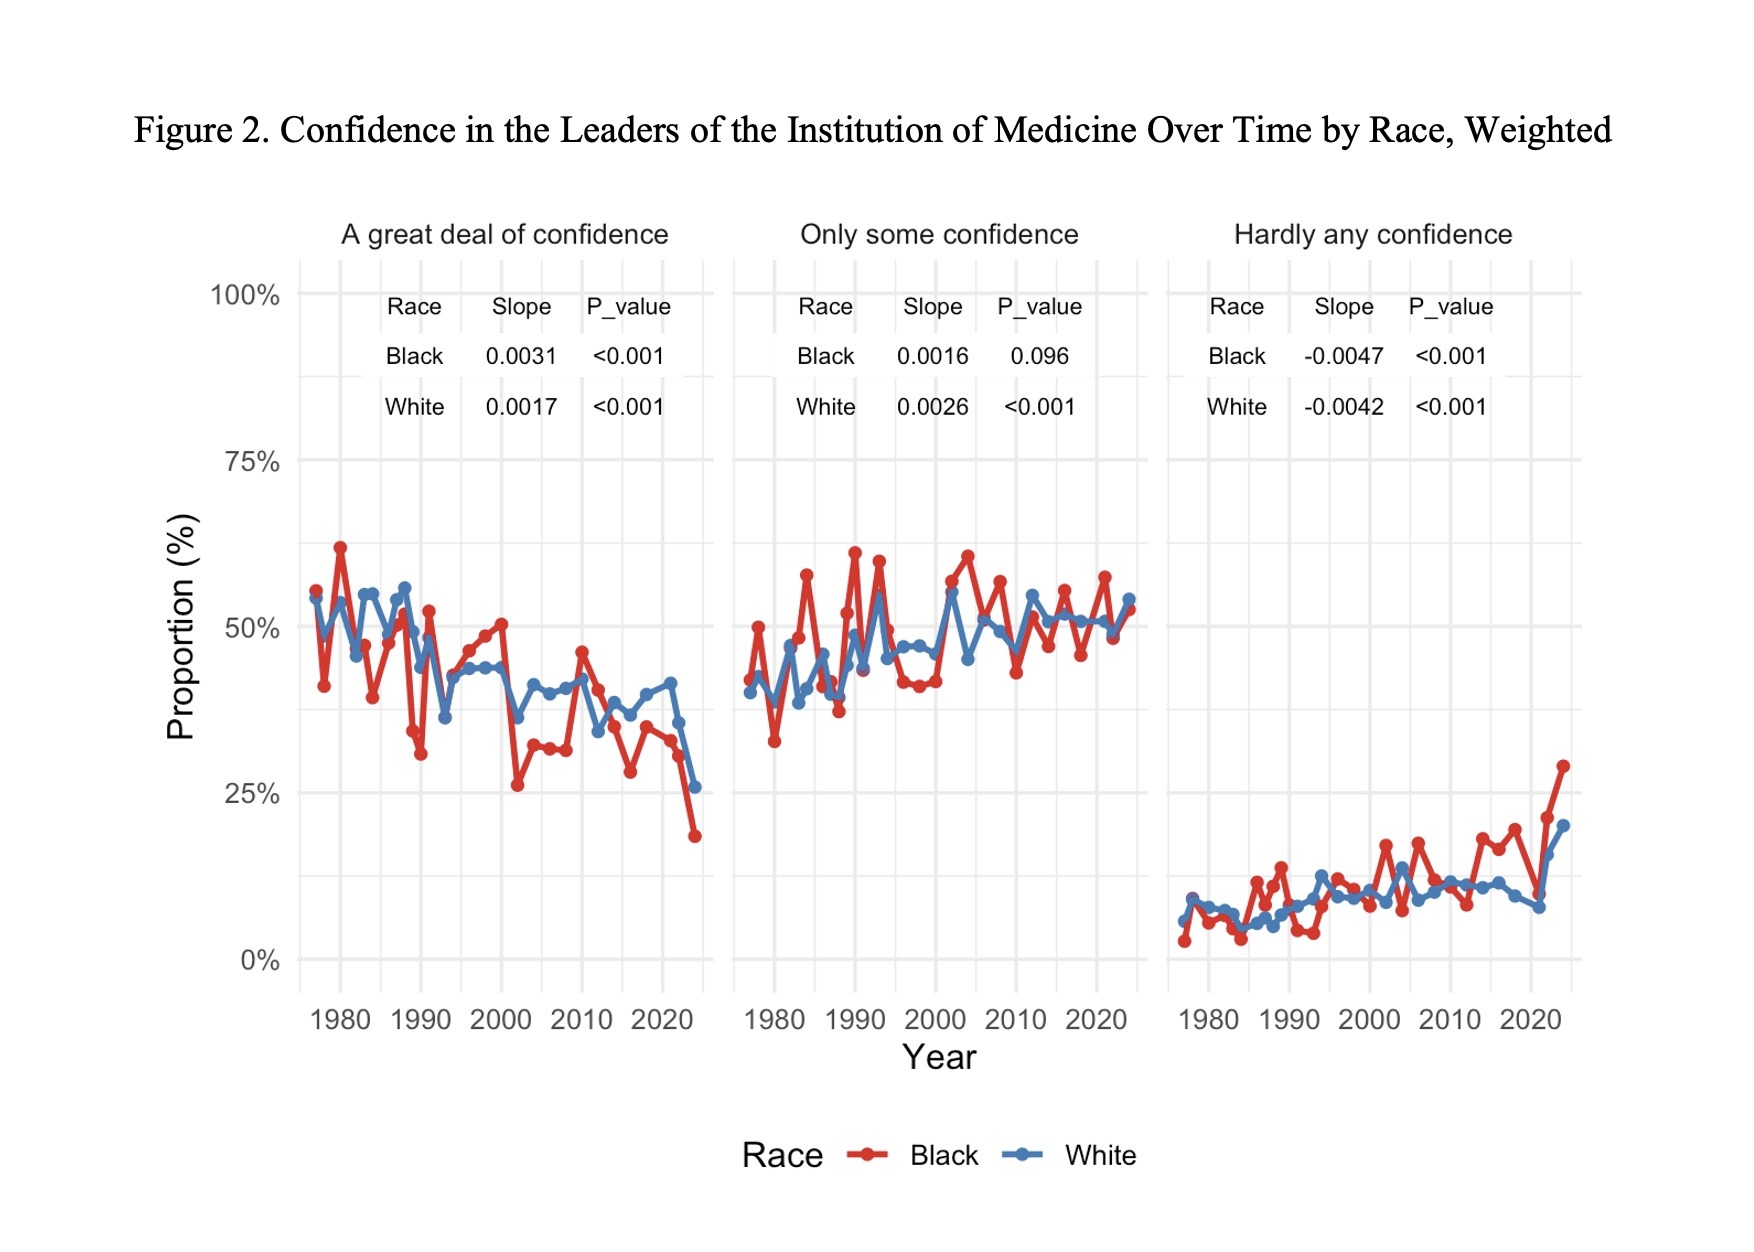
The proportion of Black and White adults nationally who expressed a great deal of confidence in leaders of the institution of medicine over time: from 45% in 1977 (95% CI: 43.3% to 46.7%) to 27% in 2024 (95% CI: 25.4% to 28.6%) and from 55% in 1977 (95% CI: 54.3% to 55.7%) to 22% in 2024 (95% CI: 21.4% to 22.6%), respectively (Figure 1). In contrast, the proportion of Black and White adults nationally who expressed hardly any confidence in the institution of medicine over time increased secularly: from 5% in 1977 (95% CI: 4.3% to 5.7%) to 27% in 2024 (95% CI: 25.4% to 28.6%) and from 5% in 1977 (95% CI: 4.7% to 5.3%) to 22% in 2024 (95% CI: 21.4% to 22.6%), respectively. The proportion of adults nationally who expressed a great deal of confidence in the leaders of the institution of medicine decreased 4.7 percentage points per decade for Blacks () and 4.2% percentage points per decade for Whites (). The proportion of adults nationally who expressed hardly any confidence in the leaders of the institution of medicine increased 3.1 percentage points per decade for Blacks () and 1.7 percentage points per decade for Whites ().
Trust by Characteristic
Table 2 shows that the level of trust varied by age, with younger adults (18-29 year-olds) showing the highest proportion expressing a great deal of confidence at 52.7% (95% CI: 50.9%, to 54.5%) compared to 41.2% (95% CI: 40.0% to 42.3%) among 30-54-year-olds, 40.0% (95% CI: 38.0% to 42.0%) among 55-64 year-olds, and 43.5% (95% CI: 41.6% to 45.3%) among those 65 and older. The proportion expressing hardly any confidence was lowest among 18-29-year-olds, at 7.7% (95% CI: 6.7% to 8.7%), and ranged from 9.9% to 10.0% across other age groups. By sex, males showed slightly higher confidence than females, with 46.6% (95% CI: 45.4% to 47.8%) of males expressing a great deal of confidence compared to 42.1% (95% CI: 41.0% to 43.1%) of females. The proportion expressing hardly any confidence was similar between sexes at 9.0% (95% CI: 8.3% to 9.7%) for males and 9.7% (95% CI: 9.1% to 10.4%) for females.
By race, White adults showed higher confidence than Black adults, with 44.7% (95% CI: 43.9% to 45.6%) of White adults expressing a great deal of confidence compared to 40.9% (95% CI: 38.8% to 43.0%) of Black adults. Black adults showed a higher proportion expressing hardly any confidence at 11.1% (95% CI: 9.7% to 12.4%) compared to 9.2% (95% CI: 8.7% to 9.7%) among White adults. By educational attainment, those with less than high school education showed the highest proportion expressing a great deal of confidence at 46.2% (95% CI: 44.4% to 48.0%) and the highest proportion expressing hardly any confidence at 12.0% (95% CI: 10.8% to 13.1%). Those with at least some college showed the lowest proportion expressing hardly any confidence at 8.2% (95% CI: 7.6% to 8.8%).
By opinion on national spending on improving and protecting health, those who believe spending is about right showed the highest proportion expressing a great deal of confidence at 52.6% (95% CI: 51.1% to 54.2%) and the lowest proportion expressing hardly any confidence at 5.7% (95% CI: 4.8% to 6.5%). Those who believe spending is too much showed the lowest proportion expressing a great deal of confidence at 37.2% (95% CI: 34.2% to 40.1%) and the highest proportion expressing hardly any confidence at 15.0% (95% CI: 12.9% to 17.1%).
By perceived family income relative to American families in general, those with far below average income showed the lowest proportion expressing a great deal of confidence at 37.9% (95% CI: 34.7% to 41.0%) and the highest proportion expressing hardly any confidence at 16.6% (95% CI: 14.2% to 19.1%). Those with above average income showed the highest proportion expressing a great deal of confidence at 48.7% (95% CI: 46.8% to 50.5%) and among the lowest proportions expressing hardly any confidence at 6.7% (95% CI: 5.7% to 7.6%).
Regression Results
For each additional decade, the odds of being more trustful in the leaders of the institution of medicine (e.g., a great deal versus only some or hardly any) were 0.86 times higher (95% CI: 0.84 to 0.88), holding constant all other covariates (Table 3). In other words, for each additional decade, the odds of being less trustful were 1.16 times higher (95% CI: 1.14 to 1.19). Compared to 18-29-year-olds, the odds of being more trustful were 0.67 times higher for 30 to 54-year-olds (95% CI: 0.61 to 0.73), 0.66 times higher for 55 to 64-year-olds (95% CI: 0.59 to 0.74), and 0.74 times higher for those 65+ (95% CI: 0.66 to 0.82).
Compared to White adults, the odds of being more trustful were 0.90 times higher for Black adults (95% CI: 0.81 to 0.99;  ). In other words, the odds of being less trustful were 1.11 times higher for Black adults than for White adults (95% CI: 1.01 to 1.23). Compared to female adults, the odds of being more trustful were 1.23 times higher for male adults (95% CI: 1.11 to 1.37). Compared to those high school graduates, the odds of being more trustful were 1.11 times higher for those with at least some college (95% CI: 1.03 to 1.20).
Compared to Independents, the odds of being more trustful were 1.40 times higher for those who identified as strongly Democrat (95% CI: 1.24 to 1.58) and 1.30 times higher for those who identified as strongly Republican (95% CI: 1.14 to 1.48). Compared to those who believed national spending on improving and protecting health was about right, the odds of being more trustful were 0.68 times higher for those who believed spending was too little (95% CI: 0.63 to 0.74) and 0.54 times higher for those who believed spending was too much (95% CI: 0.47 to 0.63). Compared to those with average perceived family income, the odds of being more trustful were 0.77 times higher for those with far below average income (95% CI: 0.66 to 0.88).
Secondary Analyses
Based on the 2000-2024 data with expanded racial/ethnic categories, we found that for each additional decade, the odds of being more trustful in the leaders of the institution of medicine (e.g., a great deal versus only some or hardly any) were 0.81 times higher (95% CI: 0.75 to 0.88), holding constant all other covariates (Appendix Table 2). Compared to non-Hispanic White adults, the odds of being more trustful were 0.76 times higher for non-Hispanic Black adults (95% CI: 0.64 to 0.90) and 1.41 times higher for Hispanic adults (95% CI: 1.05 to 1.91). We did not observe a statistically significant interaction between race/ethnicity and year (Appendix Table 3).
Discussion
In this nationally representative study spanning over 50 years using GSS data, we reached three central findings regarding trust in the leaders of the institution of medicine among U.S. adults. First, we found a substantial secular decline in public confidence, particularly following the COVID-19 pandemic. Second, regression analysis revealed statistically significant racial differences in trust levels after controlling for age, sex, education, political affiliation, opinions on national spending, and perceived income. Third, trust levels varied based on sociodemographic characteristics and attitudinal factors. The regression analysis showed that trust levels were higher among males than females, younger adults (18 to 29 years) than older adults, and White adults compared to Black adults.
Our finding of the secular decline in trust is consistent with previous studies, which showed declining confidence in medicine over decades, with a steeper drop after the COVID-19 pandemic26‘27‘29‘30‘47‘48‘49. The decline in trust post pandemic stemmed, in part, because the institutions failed to deliver clear and reliable messages and did not communicate openly during the pandemic in alignment with the recommended “4Cs” of trust framework24‘50‘51‘52.
The pattern of conflicting information continued after the pandemic, as evidenced by the recent public comments of HHS Secretary Robert F. Kennedy Jr. In April 2025, during a measles outbreak in West Texas, which resulted in more than 500 cases and two child fatalities, he stated that measles, mumps, and rubella (MMR) vaccination provides the best protection against measles spread while he simultaneously minimized the outbreak by stating it was decreasing without supporting evidence. Additionally, his comments about higher measles-related death records in Europe, as compared to the US, created more confusion and weakened public confidence in vaccination recommendations53‘54. Inconsistent messages like this perpetuate public distrust and deter people from adhering to medical treatments and preventive measures like vaccination12‘18.
Consistent with our hypothesis, we found a statistically significant racial disparity in trust levels between Black and White adults since 1977 and between non-Hispanic Black and non-Hispanic White adults since 2000. This finding aligns with several prior studies, which showed lower trust among Black Americans due to historical injustices such as the Tuskegee Syphilis Study and unethical experiments on Black children in the 1990s31‘33‘38‘55. Guffey and Yang (2012) analyzed GSS data from 1998, 2002, and 2006 and found that Black adults were less likely to trust their doctors than Whites only in 2002, with no differences in 1998 or 200656. They suggested that trust may be influenced by personal interactions with providers, frequency of contact, or other factors like perceived racism. Finally, other studies showed that trust varies based on sociodemographic factors such as gender, geography, educational attainment, and insurance status, suggesting that race alone is not independently related to distrust25‘57.
Several underlying factors may explain the racial difference in the level of trust observed in our study. First, controlling for confounders like perceived income and spending attitudes may account for some racial effects, as lower-income groups (disproportionately Black) showed greater distrust, partially supporting our income hypothesis. These findings suggest that socioeconomic barriers like financial hardships and limited access to care can lead to distrust4‘11‘12. The strong association with spending attitudes suggests that perceptions of misallocated resources, whether it is underspending or overspending, lead to a decline in trust across demographics, impacting the institution’s perceived competency and caring24. Third, the GSS measures trust in the leaders of the institution of medicine, which may differ from provider-specific trust (e.g., in doctors) examined in other studies56‘57‘58.
The COVID-19 pandemic highlighted the limitations of public health campaigns, as individuals who distrust medical institutions exhibited negative attitudes toward vaccines, received fewer vaccinations, and followed mask guidelines less frequently26‘59‘60. COVID-19 vaccination rates were particularly lower among Black Americans, in part, due to past medical mistreatment and inconsistent vaccine information61‘62‘63. A 2021 Kaiser Family Foundation survey showed that 78% of US adults were exposed to misinformation about COVID-19, further driving vaccine hesitancy and distrust in public health institutions64.
Recent debates about acetaminophen-autism links with conflicting messages from public officials and the scientific community demonstrate how observational studies linking prenatal acetaminophen use to neurodevelopmental disorders get misinterpreted as proof of causation65‘66‘67. Research studies demonstrate that observed associations between variables do not prove causation, but public misunderstandings about correlation and causation create distrust when people receive conflicting information from various sources67‘68‘69.65–68 Rebuilding trust requires policymakers to establish open scientific discussions and transparent community-based communication systems70.
Medical mistrust also prevents various groups from joining clinical trials, which is essential because different population groups metabolize drugs differently and react to treatments and side effects differently. However, minorities continue to remain underrepresented in trials at 3.1% Black and 6.1% Hispanic levels from 2008 to 2018, resulting in non-generalizable study outcomes71‘72‘73. Underrepresented groups may avoid participation in medical studies because of deep-rooted mistrust stemming from the Tuskegee study as well as ongoing discrimination, leading to lower participation rates and higher dropout rates35‘71‘74.
Medical mistrust further leads to health disparities because people with high mistrust avoid medical care, which results in delayed cancer screenings, vaccinations, and higher emergency department utilization35‘74. The solution requires healthcare policies to enforce implicit bias training, build research teams with diverse members, establish community partnerships for recruitment, and follow FDA diversity guidelines to achieve better participation and equal healthcare access. The 2010 Patient Protection and Affordable Care Act created the Patient-Centered Outcomes Research Institute (PCORI), which funds patient-centered clinical effectiveness research. PCORI actively involves community members in proposal development, grant review, and reporting.75 This process of empowering community members to actively engage in medical research may also lead to greater trust. Additionally, public acknowledgement by elected officials of harmful and unethical medical research can help to restore trust by recognizing past injustices. For example, in 1997, President Clinton spoke Tuskegee from the East Room of the White House directly to the eight remaining survivors of syphilis study and the nation as a whole and apologized: “You did nothing wrong, but you were grievously wronged. I apologize and I am sorry that this apology has been so long in coming”76. These statements can serve to rebuild trust in medicine and science among marginalized communities.
This secular decline in trust in leaders of the institution of medicine aligns with theoretical frameworks related to the erosion of social capital and the perceived legitimacy of major institutions. The social capital theory argues that diminishing civic engagement, weakening community ties, and rising political polarization reduce individuals’ willingness to extend trust to institutional actors, including leaders in medicine77‘78. Likewise, legitimacy theory posits that institutions maintain authority only when the public views their actions as competent, fair, and aligned with community values79. When public health agencies deliver inconsistent messages or fail to communicate transparently—as occurred during the COVID-19 pandemic—their perceived legitimacy declines, leading to lower confidence. Together, these theories help explain why trust in the leaders of the institution of medicine has eroded over time and why restoring trust will require rebuilding both institutional legitimacy and the social bonds that support it.
A notable strength of this study is the use of nationally representative GSS data from 1977 to 2024, which allowed us to conduct a robust analysis of long-term trends in institutional trust across racial and sociodemographic groups. However, this study has several limitations. First, this study depends on a single item to measure medical confidence, which may not capture the multidimensional nature of trust, such as trust in doctors versus hospitals, which could produce biased results. Second, the GSS only ascertained White and Black race before 2000. The GSS began ascertaining Hispanic ethnicity and Asian race in 2000. Thus, we were only able to consider these two population subgroups over the full time period. We conducted a secondary analysis based on data from 2000 onward that included additional racial and ethnic population subgroups and reached similar substantive conclusions. Third, the results may be subject to acquiescence bias in which respondents may be more likely to agree with the survey question about trust in the institution of medicine. However, the GSS asked respondents to express their level of confidence and the survey question was agnostic to this level. Fourth, the nearly 6% of respondents were missing values for the race covariate. Our results may be biased if this missing was not missing completely at random80. Finally, the GSS is a cross-sectional study. Future longitudinal-based studies could assess changes in the level of trust over time among the same study respondents to better quantify the effect of specifical temporal events.
In conclusion, the most important finding of this study using nationally representative analysis of GSS data showed a persistent decline in US adults’ trust in the leaders of the institution of medicine, with the proportion showing a great deal of confidence dropping from 54% in 1977 to 25% in 2024. There were notable differences in the level of trust by age, sex, race/ethnicity, perceived income, and attitudes toward health spending. Future research could use longitudinal designs to study causal pathways to better understand what contributes to a growth in or erosion of trust over time among adults. Additionally, qualitative-based studies could ascertain the themes most associated with low and high levels of trust. Additionally, survey-based studies can ascertain the level of trust across the many domains and actors that comprise the institution of medicine. Restoring public trust in medicine is essential because it enables people to make better health choices, improve treatment adherence, which in turn helps reduce health inequities. Strengthening institutional accountability and fostering transparent, patient-centered communication may help restore confidence in medicine and ensure that future public health efforts are met with trust.
| Characteristic | N = 22,1851 |
| Age (years) | |
| 18-29 | 4,576 (21%) |
| 30-54 | 10,268 (46%) |
| 55-64 | 3,260 (15%) |
| 65+ | 4,081 (18%) |
| Sex | |
| Female | 12,417 (56%) |
| Male | 9,768 (44%) |
| Race | |
| Black | 3,402 (15%) |
| White | 18,783 (85%) |
| Educational Attainment | |
| Less than high school | 4,479 (20%) |
| High school graduate | 6,759 (30%) |
| At least some college | 10,947 (49%) |
| Size of Place | |
| Unincorporated area of large central or medium size central city | 3,261 (15%) |
| Not with an SMSA to open country within larger civil divisions | 5,401 (24%) |
| Suburb of large central or medium size central city | 7,016 (32%) |
| Large central or medium size central city | 6,507 (29%) |
| Region of Residence | |
| Midwest | 5,873 (26%) |
| Northeast | 4,201 (19%) |
| South | 7,959 (36%) |
| West | 4,152 (19%) |
| Born in US | |
| Born in the US | 20,843 (94%) |
| Not born in the US | 1,342 (6.0%) |
| Political Party Affiliation | |
| Strongly democrat | 3,630 (16%) |
| Not very strong democrat | 4,554 (21%) |
| Independent, close to democrat | 2,795 (13%) |
| Independent (neither, no response) | 3,247 (15%) |
| Independent, close to republican | 2,065 (9.3%) |
| Not very strong republican | 3,334 (15%) |
| Strong republican | 2,205 (9.9%) |
| Other party | 355 (1.6%) |
| Opinion on National Spending on Improving and Protecting Health | |
| Too little | 14,712 (66%) |
| About right | 5,966 (27%) |
| Too much | 1,507 (6.8%) |
| Opinion on National Spending on Drug Addiction | |
| Too little | 13,953 (63%) |
| About right | 6,363 (29%) |
| Too much | 1,869 (8.4%) |
| Perceived Family Income Relative American Families in General | |
| Far below average | 1,394 (6.3%) |
| Below average | 5,456 (25%) |
| Average | 10,431 (47%) |
| Above average | 4,373 (20%) |
| Far above average | 531 (2.4%) |
Table 1 | Characteristics of Sample.
1Values are presented as n (%).
| Characteristic | Level | Hardly any confidence | Only some confidence | A great deal of confidence |
| Age | 18-29 | 7.7% (6.8%, 8.7%) | 39.6% (37.9%, 41.3%) | 52.7% (50.9%, 54.4%) |
| 30-54 | 10.0% (9.3%, 10.7%) | 48.8% (47.7%, 50.0%) | 41.2% (40.0%, 42.3%) | |
| 55-64 | 10.0% (8.7%, 11.2%) | 50.0% (47.9%, 52.1%) | 40.0% (38.0%, 42.0%) | |
| 65+ | 10.0% (8.9%, 11.2%) | 46.5% (44.7%, 48.4%) | 43.4% (41.6%, 45.3%) | |
| Sex | Female | 9.8% (9.1%, 10.4%) | 48.1% (47.1%, 49.2%) | 42.1% (41.0%, 43.2%) |
| Male | 9.0% (8.3%, 9.8%) | 44.4% (43.2%, 45.5%) | 46.6% (45.4%, 47.8%) | |
| Race | Black | 11.2% (9.8%, 12.5%) | 48.0% (45.9%, 50.2%) | 40.8% (38.7%, 42.9%) |
| White | 9.2% (8.7%, 9.7%) | 46.1% (45.2%, 46.9%) | 44.8% (43.9%, 45.6%) | |
| Educational Attainment | Less than high school | 12.0% (10.8%, 13.2%) | 41.8% (40.1%, 43.6%) | 46.2% (44.4%, 48.0%) |
| High school graduate | 9.6% (8.7%, 10.5%) | 47.1% (45.7%, 48.5%) | 43.3% (41.9%, 44.7%) | |
| At least some college | 8.2% (7.6%, 8.8%) | 47.7% (46.6%, 48.9%) | 44.1% (42.9%, 45.2%) | |
| Size of Place | Unincorporated area of large central or medium size central city | 9.0% (7.8%, 10.2%) | 46.9% (44.9%, 48.9%) | 44.1% (42.1%, 46.1%) |
| Not with an SMSA to open country within larger civil divisions | 9.6% (8.7%, 10.6%) | 44.3% (42.8%, 45.9%) | 46.0% (44.4%, 47.6%) | |
| Suburb of large central or medium size central city | 9.1% (8.2%, 9.9%) | 48.0% (46.6%, 49.4%) | 42.9% (41.5%, 44.3%) | |
| Large central or medium size central city | 9.9% (9.0%, 10.8%) | 45.7% (44.1%, 47.2%) | 44.5% (42.9%, 46.0%) | |
| Region of Residence | Midwest | 8.1% (7.2%, 8.9%) | 45.7% (44.2%, 47.2%) | 46.2% (44.7%, 47.8%) |
| Northeast | 9.0% (8.0%, 10.1%) | 46.0% (44.1%, 47.8%) | 45.0% (43.1%, 46.8%) | |
| South | 10.2% (9.4%, 11.1%) | 46.3% (44.9%, 47.6%) | 43.5% (42.2%, 44.8%) | |
| West | 10.0% (8.9%, 11.2%) | 47.5% (45.6%, 49.3%) | 42.5% (40.7%, 44.3%) | |
| Born in US | Born in the US | 9.4% (8.9%, 9.9%) | 46.0% (45.2%, 46.8%) | 44.6% (43.8%, 45.4%) |
| Not born in the US | 9.9% (7.9%, 12.0%) | 49.4% (46.1%, 52.7%) | 40.7% (37.5%, 43.9%) | |
| Political Party Affiliation | Strongly democrat | 9.8% (8.6%, 11.0%) | 44.8% (42.7%, 46.8%) | 45.5% (43.4%, 47.5%) |
| Not very strong democrat | 8.4% (7.4%, 9.4%) | 44.7% (42.9%, 46.4%) | 46.9% (45.1%, 48.7%) | |
| Independent, close to democrat | 9.2% (7.9%, 10.4%) | 48.4% (46.2%, 50.6%) | 42.4% (40.2%, 44.6%) | |
| Independent (neither, no response) | 13.1% (11.7%, 14.5%) | 48.6% (46.5%, 50.7%) | 38.3% (36.2%, 40.4%) | |
| Independent, close to republican | 8.8% (7.0%, 10.6%) | 44.7% (42.0%, 47.4%) | 46.5% (43.8%, 49.2%) | |
| Not very strong republican | 7.3% (6.2%, 8.3%) | 46.5% (44.5%, 48.5%) | 46.2% (44.2%, 48.2%) | |
| Strong republican | 8.2% (6.9%, 9.4%) | 47.2% (44.7%, 49.7%) | 44.6% (42.2%, 47.1%) | |
| Other party | 17.8% (12.7%, 22.9%) | 45.7% (39.0%, 52.4%) | 36.5% (29.6%, 43.4%) | |
| Opinion on National Spending on Improving and Protecting Health | Too little | 10.4% (9.8%, 11.0%) | 48.1% (47.1%, 49.1%) | 41.4% (40.5%, 42.4%) |
| About right | 5.6% (4.8%, 6.5%) | 41.6% (40.1%, 43.2%) | 52.7% (51.2%, 54.3%) | |
| Too much | 15.1% (12.9%, 17.2%) | 47.8% (44.7%, 50.8%) | 37.2% (34.2%, 40.1%) | |
| Opinion on National Spending on Drug Addiction | Too little | 9.8% (9.2%, 10.4%) | 47.5% (46.5%, 48.5%) | 42.7% (41.7%, 43.7%) |
| About right | 7.1% (6.3%, 7.8%) | 44.1% (42.6%, 45.6%) | 48.8% (47.3%, 50.3%) | |
| Too much | 14.9% (12.9%, 16.9%) | 45.2% (42.5%, 48.0%) | 39.8% (37.1%, 42.6%) | |
| Perceived Family Income Relative American Families in General | Far below average | 16.7% (14.3%, 19.1%) | 45.4% (42.2%, 48.6%) | 37.9% (34.7%, 41.1%) |
| Below average | 11.4% (10.3%, 12.4%) | 46.5% (44.9%, 48.2%) | 42.1% (40.5%, 43.7%) | |
| Average | 8.7% (8.0%, 9.3%) | 47.2% (46.1%, 48.4%) | 44.1% (43.0%, 45.3%) | |
| Above average | 6.7% (5.7%, 7.6%) | 44.7% (42.9%, 46.5%) | 48.6% (46.8%, 50.5%) | |
| Far above average | 12.1% (7.7%, 16.5%) | 42.0% (36.9%, 47.2%) | 45.9% (40.7%, 51.1%) |
Table 2 | Level of Confidence in the Leaders of the Institution of Medicine by Characteristic, Weighted.
| Covariate | Level | OR (95% CI) | P-value |
| Year (per 10-year increase) | per 10-year increase | 0.86 (0.84, 0.88) | <0.001 |
| Age (years) | 18-29 | – | – |
| 30-54 | 0.67 (0.61, 0.73) | <0.001 | |
| 55-64 | 0.66 (0.59, 0.74) | <0.001 | |
| 65+ | 0.74 (0.66, 0.82) | <0.001 | |
| Sex | Female | – | – |
| Male | 1.15 (1.08, 1.23) | <0.001 | |
| Race | White | – | – |
| Black | 0.90 (0.81, 0.99) | 0.038 | |
| Educational Attainment | High school graduate | – | – |
| Less than high school | 1.04 (0.94, 1.15) | 0.413 | |
| At least some college | 1.11 (1.03, 1.20) | 0.008 | |
| Size of Place | Unincorporated area of large central or medium size central city | – | – |
| Not with an SMSA to open country within larger civil divisions | 0.98 (0.89, 1.09) | 0.771 | |
| Suburb of large central or medium size central city | 0.99 (0.90, 1.09) | 0.795 | |
| Large central or medium size central city | 1.00 (0.90, 1.11) | 0.986 | |
| Region of Residence | Midwest | – | – |
| Northeast | 0.97 (0.88, 1.07) | 0.529 | |
| South | 0.93 (0.86, 1.01) | 0.073 | |
| West | 0.87 (0.79, 0.96) | 0.004 | |
| Born in US | Born in the US | – | – |
| Not born in the US | 0.98 (0.86, 1.12) | 0.769 | |
| Political Party Affiliation | Independent (neither, no response) | – | – |
| Strongly democrat | 1.40 (1.24, 1.58) | <0.001 | |
| Not very strong democrat | 1.35 (1.21, 1.51) | <0.001 | |
| Independent, close to democrat | 1.14 (1.01, 1.29) | 0.032 | |
| Independent, close to republican | 1.31 (1.14, 1.51) | <0.001 | |
| Not very strong republican | 1.28 (1.14, 1.44) | <0.001 | |
| Strong republican | 1.30 (1.14, 1.48) | <0.001 | |
| Other party | 0.96 (0.70, 1.31) | 0.782 | |
| Opinion on National Spending on Improving and Protecting Health | About right | – | – |
| Too little | 0.68 (0.63, 0.74) | <0.001 | |
| Too much | 0.54 (0.47, 0.63) | <0.001 | |
| Opinion on National Spending on Drug Addiction | About right | – | – |
| Too little | 0.85 (0.79, 0.91) | <0.001 | |
| Too much | 0.70 (0.61, 0.80) | <0.001 | |
| Perceived Family Income Relative American Families in General | Average | – | – |
| Far below average | 0.77 (0.66, 0.88) | <0.001 | |
| Below average | 0.95 (0.88, 1.03) | 0.209 | |
| Above average | 1.24 (1.13, 1.35) | <0.001 | |
| Far above average | 1.04 (0.81, 1.33) | 0.778 |
Table 3 | Ordinal Logistic Regression Predicting Level of Trust in the Leaders of the Institution of Medicine (1977–2024). Abbreviations: SMSA=standard metropolitan statistical area; CI=confidence interval.
Appendix
| Covariate | Missing N (%) |
| Race | 1,415 (5.9%) |
| Age (years) | 235 (1.0%) |
| Educational Attainment | 49 (0.2%) |
| Sex | 19 (0.1%) |
| Size of Place | 0 (0.0%) |
| Region of Residence | 0 (0.0%) |
| Born in US | 0 (0.0%) |
| Political Party Affiliation | 0 (0.0%) |
| Opinion on National Spending on Improving and Protecting Health | 0 (0.0%) |
| Opinion on National Spending on Drug Addiction | 0 (0.0%) |
| Perceived Family Income Relative American Families in General | 0 (0.0%) |
Appendix Table 1 | Percent Observations Missing by Covariate
| Characteristic | OR | OR (95% CI) |
| Year (per 10-year increase) | 0.81 | 0.75, 0.88 |
| Age (years) | ||
| 18-29 | — | — |
| 30-54 | 0.64 | 0.55, 0.76 |
| 55-64 | 0.71 | 0.59, 0.86 |
| 65+ | 0.89 | 0.74, 1.06 |
| Sex | ||
| Female | — | — |
| Male | 1.23 | 1.11, 1.37 |
| Race/Ethnicity | ||
| Non-Hispanic White | — | — |
| Hispanic | 1.41 | 1.05, 1.91 |
| Non-Hispanic American Indian/Alaskan Native | 0.77 | 0.52, 1.14 |
| Non-Hispanic Asian | 0.99 | 0.72, 1.36 |
| Non-Hispanic Black | 0.76 | 0.64, 0.90 |
| Other | 1.27 | 0.66, 2.44 |
| Educational Attainment | ||
| High school graduate | — | — |
| Less than high school | 1.17 | 0.95, 1.45 |
| At least some college | 1.29 | 1.13, 1.47 |
| Size of Place | ||
| Unincorporated area of large central or medium size central city | — | — |
| Not with an SMSA to open country within larger civil divisions | 0.89 | 0.75, 1.06 |
| Suburb of large central or medium size central city | 1.05 | 0.90, 1.22 |
| Large central or medium size central city | 1.11 | 0.94, 1.32 |
| Region of Residence | ||
| Midwest | — | — |
| Northeast | 0.97 | 0.82, 1.14 |
| South | 0.92 | 0.80, 1.06 |
| West | 0.82 | 0.70, 0.97 |
| Born in US | ||
| Born in the US | — | — |
| Not born in the US | 1.03 | 0.84, 1.27 |
| Political Party Affiliation | ||
| Independent (neither, no response) | — | — |
| Strongly democrat | 1.54 | 1.27, 1.87 |
| Not very strong democrat | 1.33 | 1.10, 1.60 |
| Independent, close to democrat | 1.18 | 0.97, 1.42 |
| Independent, close to republican | 1.17 | 0.93, 1.48 |
| Not very strong republican | 1.16 | 0.96, 1.41 |
| Strong republican | 1.05 | 0.87, 1.27 |
| Other party | 1.03 | 0.70, 1.53 |
| Opinion on National Spending on Improving and Protecting Health | ||
| About right | — | — |
| Too little | 0.61 | 0.53, 0.70 |
| Too much | 0.54 | 0.43, 0.68 |
| Opinion on National Spending on Drug Addiction | ||
| About right | — | — |
| Too little | 0.76 | 0.68, 0.86 |
| Too much | 0.70 | 0.56, 0.87 |
| Perceived Family Income Relative to American Families | ||
| Average | — | — |
| Far below average | 0.79 | 0.63, 0.99 |
| Below average | 0.90 | 0.79, 1.03 |
| Above average | 1.43 | 1.25, 1.65 |
| Far above average | 1.34 | 0.91, 1.98 |
Appendix Table 2 | Ordinal Logistic Regression Predicting Level of Trust in the Leaders of the Institution of Medicine with Expanded Race/Ethnicity Categories (2000–2024). Abbreviations: SMSA=standard metropolitan statistical area; CI=confidence interval.
| Characteristic | OR | OR (95% CI) |
| Year (per 10-year increase) | 0.84 | 0.77, 0.92 |
| Race/Ethnicity | ||
| Non-Hispanic White | — | — |
| Hispanic | 1.40 | 1.04, 1.89 |
| Non-Hispanic AIAN | 0.74 | 0.49, 1.12 |
| Non-Hispanic Asian | 1.00 | 0.72, 1.37 |
| Non-Hispanic Black | 0.76 | 0.64, 0.90 |
| Other | 1.20 | 0.64, 2.25 |
| Age (years) | ||
| 18-29 | — | — |
| 30-54 | 0.64 | 0.55, 0.76 |
| 55-64 | 0.71 | 0.59, 0.85 |
| 65+ | 0.89 | 0.74, 1.06 |
| Sex | ||
| Female | — | — |
| Male | 1.23 | 1.11, 1.37 |
| Educational Attainment | ||
| High school graduate | — | — |
| Less than high school | 1.17 | 0.95, 1.45 |
| At least some college | 1.29 | 1.13, 1.47 |
| Size of Place | ||
| Unincorporated area of large central or medium size central city | — | — |
| Not with an SMSA to open country within larger civil divisions | 0.89 | 0.75, 1.06 |
| Suburb of large central or medium size central city | 1.05 | 0.90, 1.22 |
| Large central or medium size central city | 1.12 | 0.94, 1.32 |
| Region of Residence | ||
| Midwest | — | — |
| Northeast | 0.97 | 0.81, 1.14 |
| South | 0.92 | 0.80, 1.06 |
| West | 0.82 | 0.70, 0.97 |
| Born in US | ||
| Born in the US | — | — |
| Not born in the US | 1.04 | 0.85, 1.28 |
| Political Party Affiliation | ||
| Independent (neither, no response) | — | — |
| Strongly democrat | 1.53 | 1.26, 1.86 |
| Not very strong democrat | 1.32 | 1.10, 1.59 |
| Independent, close to democrat | 1.17 | 0.97, 1.42 |
| Independent, close to republican | 1.16 | 0.92, 1.47 |
| Not very strong republican | 1.17 | 0.96, 1.41 |
| Strong republican | 1.05 | 0.87, 1.27 |
| Other party | 1.03 | 0.70, 1.52 |
| Opinion on National Spending on Improving and Protecting Health | ||
| About right | — | — |
| Too little | 0.61 | 0.53, 0.70 |
| Too much | 0.54 | 0.43, 0.68 |
| Opinion on National Spending on Drug Addiction | ||
| About right | — | — |
| Too little | 0.76 | 0.68, 0.86 |
| Too much | 0.70 | 0.56, 0.86 |
| Perceived Family Income Relative to American Families | ||
| Average | — | — |
| Far below average | 0.79 | 0.63, 0.99 |
| Below average | 0.90 | 0.79, 1.03 |
| Above average | 1.44 | 1.25, 1.65 |
| Far above average | 1.36 | 0.92, 2.01 |
| Year × Race/Ethnicity | ||
| Year (per 10-year increase) * Hispanic | 0.96 | 0.65, 1.40 |
| Year (per 10-year increase) * Non-Hispanic AIAN | 0.76 | 0.40, 1.42 |
| Year (per 10-year increase) * Non-Hispanic Asian | 0.83 | 0.55, 1.27 |
| Year (per 10-year increase) * Non-Hispanic Black | 0.80 | 0.65, 0.98 |
| Year (per 10-year increase) * Other | 1.95 | 0.77, 4.95 |
Appendix Table 3 | Ordinal Logistic Regression Predicting Level of Trust in the Leaders of the Institution of Medicine with Race × Time Interaction (2000–2024). Abbreviations: AIAN=American Indian/Alaskan Native; CI=confidence interval.
Acknowledgement
This paper was completed with the mentorship of Dr. Samir Soneji, Professor at Duke University. His guidance on data analysis and interpretation improved every aspect of this research. His feedback strengthened the statistical models and helped align the study with real-world public health questions. I am deeply grateful for his time, precision, and support throughout the process.
References
- D. Bhugra. All medicine is social. Journal of the Royal Society of Medicine. Vol. 107, pg. 183–186, 2014 https://doi.org/10.1177/0141076814525069 [↩]
- Starr, P. The Social Transformation of American Medicine: The Rise of a Sovereign Profession and the Making of a Vast Industry. Basic Books, New York, 2017 [↩]
- Z. Belrhiti, A. Nebot Giralt, B. Marchal. Complex leadership in healthcare: a scoping review. International Journal of Health Policy and Management. Vol. 7, pg. 1073–1084, 2018 https://doi.org/10.15171/ijhpm.2018.75 [↩]
- S. Supri, K. Malone. On the critical list: the us institution of medicine. The American Journal of Medicine. Vol. 124, pg. 192–193, 2011 https://doi.org/10.1016/j.amjmed.2010.11.010 [↩] [↩] [↩] [↩]
- D. C. United States Department of Health and Human Services. HHS organizational charts office of secretary and divisions. https://www.hhs.gov/about/agencies/orgchart/index.html 2025 [↩]
- Assistant Secretary of Public Affairs (ASPA). HHS agencies & offices. https://www.hhs.gov/about/agencies/hhs-agencies-and-offices/index.html 2025 [↩]
- S. L. Huston, A. Porter. State and local health departments: research, surveillance, and evidence-based public health practices. Preventing Chronic Disease. Vol. 20, pg. E86, 2023 https://doi.org/10.5888/pcd20.230142 [↩]
- E. J. Trickett, S. Beehler, C. Deutsch, L. W. Green, P. Hawe, K. McLeroy, R. L. Miller, B. D. Rapkin, J. J. Schensul, A. J. Schulz, J. E. Trimble. Advancing the science of community-level interventions. American Journal of Public Health. Vol. 101, pg. 1410–1419, 2011 https://doi.org/10.2105/AJPH.2010.300113 [↩]
- NHE fact sheet | cms. https://www.cms.gov/data-research/statistics-trends-and-reports/national-health-expenditure-data/nhe-fact-sheet?utm 2025 [↩]
- Bureau of Labor Statistics. Employment and earnings table b-1a. Bureau of Labor Statistics https://www.bls.gov/web/empsit/ceseeb1a.htm 2025 [↩]
- I. Mendez, C. Alvarado S., P. Alberti M. Trust trends: u.s. adults’ gradually declining trust in institutions, 2021-2024. AAMC Center For Health Justice https://www.aamchealthjustice.org/news/polling/trust-trends 2025 [↩] [↩]
- D. M. Griffith, E. M. Bergner, A. Fair, C. H. Wilkins. Using mistrust, distrust, and low trust precisely in medical care and medical research advances health equity. American Journal of Preventive Medicine. Vol. 60, pg. 442–445, 2021 https://doi.org/10.1016/j.amepre.2020.08.019 [↩] [↩] [↩]
- R. on P. I. of the L. Sciences, B. on L. Sciences, D. on E. and L. Studies, B. on S. Education, D. of B. and S. S. and Education, E. The National Academies of Sciences. What is trust. in Trust and Confidence at the Interfaces of the Life Sciences and Society: Does the Public Trust Science? A Workshop Summary National Academies Press (US), 2015 [↩] [↩]
- S. D. Goold. Trust, distrust and trustworthiness. Journal of General Internal Medicine. Vol. 17, pg. 79–81, 2002 https://doi.org/10.1046/j.1525-1497.2002.11132.x [↩] [↩]
- D. Mechanic. Changing medical organization and the erosion of trust. The Milbank Quarterly. Vol. 74, pg. 171, 1996 https://doi.org/10.2307/3350245 [↩]
- R. Rhodes, J. J. Strain. Trust and transforming medical institutions. Cambridge Quarterly of Healthcare Ethics: CQ: The International Journal of Healthcare Ethics Committees. Vol. 9, pg. 205–217, 2000 https://doi.org/10.1017/s096318010090207x [↩]
- J. Greene, D. Wolfson. Physician perspectives on building trust with patients. The Hastings Center Report. Vol. 53 Suppl 2, pg. S86–S90, 2023 https://doi.org/10.1002/hast.1528 [↩]
- Z. Fritz, R. Holton. Too much medicine: not enough trust? Journal of Medical Ethics. Vol. 45, pg. 31–35, 2019 https://doi.org/10.1136/medethics-2018-104866 [↩] [↩]
- E. Souvatzi, M. Katsikidou, A. Arvaniti, S. Plakias, A. Tsiakiri, M. Samakouri. Trust in healthcare, medical mistrust, and health outcomes in times of health crisis: a narrative review. Societies. Vol. 14, pg. 269, 2024 https://doi.org/10.3390/soc14120269 [↩] [↩] [↩]
- M. Wolfensberger, A. Wrigley. Trust in Medicine. Cambridge University Press, 2019 [↩]
- Z. Zhao, Z. Zhang, C. Yang, Q. Li, Z. Chen, W. Yin. The influence of patient experience and patient trust on willingness to see a doctor based on sor theory. BMC Health Services Research. Vol. 24, pg. 1278, 2024 https://doi.org/10.1186/s12913-024-11775-6 [↩]
- M. A. Hall, F. Camacho, E. Dugan, R. Balkrishnan. Trust in the medical profession: conceptual and measurement issues. Health Services Research. Vol. 37, pg. 1419–1439, 2002 https://doi.org/10.1111/1475-6773.01070 [↩]
- E. Sarbazi, H. Sadeghi-Bazargani, Z. Sheikhalipour, M. Farahbakhsh, A. Ala, H. Soleimanpour. Trust in medicine: a scoping review of the instruments designed to measure trust in medical care studies. Journal of Caring Sciences. Vol. 13, pg. 116–137, 2024 https://doi.org/10.34172/jcs.33152 [↩]
- D. B. Wolfson, T. J. Lynch. Increasing trust in health care. The American Journal of Managed Care. Vol. 27, pg. 520–522, 2021 https://doi.org/10.37765/ajmc.2021.88790 [↩] [↩] [↩] [↩] [↩]
- K. Armstrong, K. L. Ravenell, S. McMurphy, M. Putt. Racial/ethnic differences in physician distrust in the United States. American Journal of Public Health. Vol. 97, pg. 1283–1289, 2007 https://doi.org/10.2105/AJPH.2005.080762 [↩] [↩] [↩]
- R. H. Perlis, K. Ognyanova, A. Uslu, K. Lunz Trujillo, M. Santillana, J. N. Druckman, M. A. Baum, D. Lazer. Trust in physicians and hospitals during the covid-19 pandemic in a 50-state survey of us adults. JAMA Network Open. Vol. 7, pg. e2424984, 2024 https://doi.org/10.1001/jamanetworkopen.2024.24984 [↩] [↩] [↩] [↩]
- T. W. Smith, J. Son. Trends in public attitudes about confidence in institutions. 2013 [↩] [↩] [↩]
- T. J. Lynch, D. B. Wolfson, R. J. Baron. A trust initiative in health care: why and why now? Academic Medicine: Journal of the Association of American Medical Colleges. Vol. 94, pg. 463–465, 2019 https://doi.org/10.1097/ACM.0000000000002599 [↩]
- R. J. Baron, A. J. Berinsky. Mistrust in science — a threat to the patient–physician relationship. New England Journal of Medicine. Vol. 381, pg. 182–185, 2019 https://doi.org/10.1056/NEJMms1813043 [↩] [↩]
- D. Wolfson. Building trustworthiness in the health care system n-ow and in the future. ABIM Foundation https://abimfoundation.org/blog-post/building-trustworthiness-in-the-health-care-system-now-and-in-the-future Accessed 2025. [↩] [↩]
- D. Baptiste, N. Caviness‐Ashe, N. Josiah, Y. Commodore‐Mensah, J. Arscott, P. R. Wilson, S. Starks. Henrietta lacks and America’s dark history of research involving African Americans. Nursing Open. Vol. 9, pg. 2236–2238, 2022 https://doi.org/10.1002/nop2.1257 [↩] [↩] [↩] [↩]
- L. E. Boulware, L. A. Cooper, L. E. Ratner, T. A. LaVeist, N. R. Powe. Race and trust in the health care system. Public Health Reports (Washington, D.C.: 1974). Vol. 118, pg. 358–365, 2003 https://doi.org/10.1093/phr/118.4.358 [↩]
- V. N. Gamble. Under the shadow of Tuskegee: African Americans and health care. American Journal of Public Health. Vol. 87, pg. 1773–1778, 1997 https://doi.org/10.2105/AJPH.87.11.1773 [↩] [↩] [↩]
- C. H. Halbert, K. Armstrong, O. H. Gandy Jr, L. Shaker. Racial differences in trust in health care providers. Archives of Internal Medicine. Vol. 166, pg. 896–901, 2006 https://doi.org/10.1001/archinte.166.8.896 [↩]
- D. P. Scharff, K. J. Mathews, P. Jackson, J. Hoffsuemmer, E. Martin, D. Edwards. More than Tuskegee: understanding mistrust about research participation. Journal of Health Care for the Poor and Underserved. Vol. 21, pg. 879–897, 2010 https://doi.org/10.1353/hpu.0.0323 [↩] [↩] [↩] [↩]
- M. Shukla, M. Schilt-Solberg, W. Gibson-Scipio. Medical mistrust: a concept analysis. Nursing Reports. Vol. 15, pg. 103, 2025 https://doi.org/10.3390/nursrep15030103 [↩] [↩]
- J. M. Sims. The Story of My Life. D. Appleton, 1884 [↩]
- A legacy of distrust: African Americans and medical research. American Journal of Preventive Medicine. Vol. 9, pg. 35–38, 1993 [↩] [↩]
- R. Skloot. The Immortal Life of Henrietta Lacks. Crown, New York, 2011 [↩] [↩]
- F. A. Khan. The immortal life of Henrietta lacks. The Journal of IMA. Vol. 43, pg. 93–94, 2011 https://doi.org/10.5915/43-2-8609 [↩]
- D. S. Pine, J. D. Coplan, G. A. Wasserman, L. S. Miller, J. E. Fried, M. Davies, T. B. Cooper, L. Greenhill, D. Shaffer, B. Parsons. Neuroendocrine response to fenfluramine challenge in boys: associations with aggressive behavior and adverse rearing. Archives of General Psychiatry. Vol. 54, pg. 839–846, 1997 https://doi.org/10.1001/archpsyc.1997.01830210083010 [↩] [↩] [↩]
- M. Wadman. Row erupts over child aggression study. Nature. Vol. 392, pg. 747–747, 1998 https://doi.org/10.1038/33760 [↩]
- Y. K. Loke, S. Derry, A. Pritchard-Copley. Appetite suppressants and valvular heart disease – a systematic review. BMC Clinical Pharmacology. Vol. 2, pg. 6, 2002 https://doi.org/10.1186/1472-6904-2-6 [↩]
- A. E. Shamoo, C. A. Tauer. Ethically questionable research with children: the fenfluramine study. Accountability in Research. Vol. 9, pg. 143–166, 2002 https://doi.org/10.1080/08989620214685 [↩]
- V. H. Sharav. Children in clinical research: a conflict of moral values. The American Journal of Bioethics. Vol. 3, pg. 12–59, 2003 https://doi.org/10.1162/152651603322781639 [↩]
- M. Davern, R. Bautisata, J. Freese, P. Herd, S. Morgan. GSS data explorer | NORC at the university of Chicago. https://gssdataexplorer.norc.org/gsscite 2024 [↩]
- D. W. Baker. Trust in health care in the time of covid-19. JAMA. Vol. 324, pg. 2373–2375, 2020 https://doi.org/10.1001/jama.2020.23343 [↩]
- R. J. Blendon, J. M. Benson. Trust in medicine, the health system & public health. Daedalus. Vol. 151, pg. 67–82, 2022 https://doi.org/10.1162/daed_a_01944 [↩]
- H. Zheng. Losing confidence in medicine in an era of medical expansion? Social Science Research. Vol. 52, pg. 701–715, 2015 https://doi.org/10.1016/j.ssresearch.2014.10.009 [↩]
- M. S. Pollard, L. M. Davis. Decline in trust in the centers for disease control and prevention during the covid-19 pandemic. Rand Health Quarterly. Vol. 9, pg. 23, 2022 [↩]
- L. Schnirring. Mixed messages hamstring us covid-19 response | cidrap. https://www.cidrap.umn.edu/covid-19/mixed-messages-hamstring-us-covid-19-response Accessed 2025 [↩]
- G. K. SteelFisher, M. G. Findling, H. L. Caporello, K. M. Lubell, K. G. Vidoloff Melville, L. Lane, A. A. Boyea, T. J. Schafer, E. N. Ben-Porath. Trust in us federal, state, and local public health agencies during covid-19: responses and policy implications. Health Affairs. Vol. 42, pg. 328–337, 2023 https://doi.org/10.1377/hlthaff.2022.01204 [↩]
- M. Godoy. Amid a growing measles outbreak, doctors worry RFK Jr. is sending the wrong message. NPR 2025 [↩]
- D. Payne. ‘Most effective way’ to prevent measles is vaccination, RFK Jr. says, in most direct remarks yet. STAT https://www.statnews.com/2025/04/06/rfk-jr-measles-statement-west-texas-outbreak/ 2025 [↩]
- E. Brown. The Condemnation of Little B: New Age Racism in America. Beacon Press, 2003 [↩]
- T. Guffey, P. Q. Yang. Trust in doctors: are African Americans less likely to trust their doctors than white Americans? Sage Open. Vol. 2, pg. 2158244012466092, 2012 https://doi.org/10.1177/2158244012466092 [↩] [↩]
- C. Campos-Castillo. Exploring skin color and black-white differences in trust in physicians in a cross-sectional study of u.s. adults. Journal of the National Medical Association. Vol. 111, pg. 393–406, 2019 https://doi.org/10.1016/j.jnma.2019.01.009 [↩] [↩]
- B. Smith. Skepticism in healthcare: an analyzation of race discrimination and trust in doctor’s judgement. 2021 [↩]
- J. D. Allen, Q. Fu, S. Shrestha, K. H. Nguyen, T. J. Stopka, A. Cuevas, L. Corlin. Medical mistrust, discrimination, and covid-19 vaccine behaviors among a national sample U.S. adults. SSM – Population Health. Vol. 20, pg. 101278, 2022 https://doi.org/10.1016/j.ssmph.2022.101278 [↩]
- J. W. Shockey. Social context and public health compliance: mask wearing during the covid-19 pandemic. SSM – Qualitative Research in Health. Vol. 7, pg. 100564, 2025 https://doi.org/10.1016/j.ssmqr.2025.100564 [↩]
- H. Budhwani, T. Maycock, W. Murrell, T. Simpson. COVID-19 vaccine sentiments among African American or black adolescents in rural Alabama. Journal of Adolescent Health. Vol. 69, pg. 1041–1043, 2021 https://doi.org/10.1016/j.jadohealth.2021.09.010 [↩]
- J. Knudsen, M. Perlman-Gabel, I. G. Uccelli, J. Jeavons, D. A. Chokshi. Combating misinformation as a core function of public health. Nejm Catalyst Innovations in Care Delivery. pg. CAT.22.0198, 2023 https://doi.org/10.1056/CAT.22.0198 [↩]
- C. Roat, K. J. Webber-Ritchey, R. S. Spurlark, Y.-M. Lee. Black Americans receiving the covid-19 vaccine and effective strategies to overcome barriers: an integrative literature review. Journal of Racial and Ethnic Health Disparities. pg. 1–11, 2022 https://doi.org/10.1007/s40615-022-01437-w [↩]
- L. Hamel, L. Lopes, A. Kirzinger, G. Sparks, M. Stokes, M. Brodie. KFF covid-19 vaccine monitor: media and misinformation. KFF https://www.kff.org/health-information-trust/kff-covid-19-vaccine-monitor-media-and-misinformation/ Accessed 2025 [↩]
- S. Alemany, C. Avella-García, Z. Liew, R. García-Esteban, K. Inoue, T. Cadman, M. López-Vicente, L. González, I. Riaño Galán, A. Andiarena, M. Casas, K. Margetaki, K. Strandberg-Larsen, D. A. Lawlor, H. El Marroun, H. Tiemeier, C. Iñiguez, A. Tardón, L. Santa-Marina, J. Júlvez, D. Porta, L. Chatzi, J. Sunyer. Prenatal and postnatal exposure to acetaminophen in relation to autism spectrum and attention-deficit and hyperactivity symptoms in childhood: meta-analysis in six European population-based cohorts. European Journal of Epidemiology. Vol. 36, pg. 993–1004, 2021 https://doi.org/10.1007/s10654-021-00754-4 [↩]
- A. Montero, G. Sparks, M. Mulugeta, J. Montalvo III, L. Lopes, L. Hamel. KFF tracking poll on health information and trust: tylenol-autism link and vaccine policies. KFF https://www.kff.org/public-opinion/kff-tracking-poll-on-health-information-and-trust-tylenol-autism-link-and-vaccine-policies/ 2025 [↩]
- D. Prada, B. Ritz, A. Z. Bauer, A. A. Baccarelli. Evaluation of the evidence on acetaminophen use and neurodevelopmental disorders using the navigation guide methodology. Environmental Health. Vol. 24, pg. 56, 2025 https://doi.org/10.1186/s12940-025-01208-0 [↩] [↩]
- P. Damkier, E. B. Gram, M. Ceulemans, A. Panchaud, B. Cleary, C. Chambers, C. Weber-Schoendorfer, D. Kennedy, K. Hodson, K. S. Grant, O. Diav-Citrin, S. G. Običan, S. Shechtman, S. Alwan. Acetaminophen in pregnancy and attention-deficit and hyperactivity disorder and autism spectrum disorder. Obstetrics and Gynecology. Vol. 145, pg. 168–176, 2025 https://doi.org/10.1097/AOG.0000000000005802 [↩]
- F. Graham. Daily briefing: no strong evidence backs up trump’s claims about tylenol and autism. Nature. 2025 https://doi.org/10.1038/d41586-025-03123-3 [↩]
- M. J. Goldenberg. Public trust in science. Interdisciplinary Science Reviews. Vol. 48, pg. 366–378, 2023 https://doi.org/10.1080/03080188.2022.2152243 [↩]
- I. I. Curro, L. C. Wyatt, V. Foster, Y. Yusuf, S. Sifuentes, P. Chebli, J. A. Kranick, S. C. Kwon, C. Trinh-Shevrin, M. N. LeCroy. The association of medical mistrust, clinical trial knowledge, and perceived clinical trial risk with willingness to participate in health research among historically marginalized individuals living in New York city. Research Square. pg. rs.3.rs-6699898, 2025 https://doi.org/10.21203/rs.3.rs-6699898/v1 [↩] [↩]
- J. M. Loree, S. Anand, A. Dasari, J. M. Unger, A. Gothwal, L. M. Ellis, G. Varadhachary, S. Kopetz, M. J. Overman, K. Raghav. Disparity of race reporting and representation in clinical trials leading to cancer drug approvals from 2008 to 2018. JAMA Oncology. Vol. 5, pg. e191870, 2019 https://doi.org/10.1001/jamaoncol.2019.1870 [↩]
- A. L. Schwartz, M. Alsan, A. A. Morris, S. D. Halpern. Why diverse clinical trial participation matters. New England Journal of Medicine. Vol. 388, pg. 1252–1254, 2023 https://doi.org/10.1056/NEJMp2215609 [↩]
- E. National Academies of Sciences, P. and G. Affairs, E. Committee on Women in Science, C. on I. the R. of W. and U. M. in C. T. and Research, K. Bibbins-Domingo, A. Helman. Barriers to representation of underrepresented and excluded populations in clinical research. in Improving Representation in Clinical Trials and Research: Building Research Equity for Women and Underrepresented Groups National Academies Press (US), 2022 [↩] [↩]
- M. A. Fischer, S. M. Asch. The future of the patient-centered outcomes research institute (pcori). Journal of General Internal Medicine. Vol. 34, pg. 2291–2292, 2019 https://doi.org/10.1007/s11606-019-05324-9 [↩]
- William Clinton. Remarks by the president in apology for study done in Tuskegee. 1997 [↩]
- R. D. Putnam. Bowling alone: America’s declining social capital. Journal of Democracy. Vol. 6, pg. 65–78, 1995 [↩]
- E. Bisung, S. J. Elliott. Toward a social capital based framework for understanding the water-health nexus. Social Science & Medicine. Vol. 108, pg. 194–200, 2014 https://doi.org/10.1016/j.socscimed.2014.01.042 [↩]
- M. E. Spencer. Weber on legitimate norms and authority. The British Journal of Sociology. Vol. 21, pg. 123–134, 1970 https://doi.org/10.2307/588403 [↩]
- M. W. Heymans, J. W. R. Twisk. Handling missing data in clinical research. Journal of Clinical Epidemiology. Vol. 151, pg. 185–188, 2022 https://doi.org/10.1016/j.jclinepi.2022.08.016 [↩]


