
Abstract
Palindromic sequences in DNA are unique genetic configurations where a sequence of nucleotides reads the same forward and backward on complementary strands. These sequences play crucial roles in various biological mechanisms, including gene regulation, DNA replication, and the organization of chromosomal architecture. In particular, palindrome formation followed by subsequent amplifications are known to cause genetic instability, a hallmark of cancer. Several studies have highlighted the prevalence of palindromic sequences in cancer genomes. Despite the importance of these sequences, detecting palindromic DNA poses significant challenges due to their structural complexity. This paper describes an algorithm designed to efficiently detect palindromic sequences, including complex variations that have historically been difficult to identify. The algorithm performs well at identifying imperfect palindromes, palindromes with long arms, and palindromes containing substantial gaps between the arms. These more intricate configurations have been largely overlooked or poorly handled by existing algorithms. This algorithm addresses these challenges. To validate its performance, the algorithm was tested using the CHM13 (T2T) human Chromosome 2 dataset. The results demonstrated its ability to detect a wide range of palindrome types along the chromosome, with varying arm lengths and gap sizes. Additionally, the algorithm achieves speed improvements by optimizing the traditional Smith-Waterman or Needleman-Wunsch algorithms, reducing its complexity from quadratic (O(n2)) to linear (O(nd), where n is the length of the sequence). The algorithm described here will help the identification and annotation of palindrome sequences and may facilitate the research on palindrome sequences and cancer.
Keywords: Palindrome DNA, Complex Palindrome Variations, Computer Algorithm, Cancer genome
Introduction
Palindromic sequences in DNA are unique genetic configurations where a sequence of nucleotides reads the same forward and backward on two complementary strands. These sequences play crucial roles in various biological mechanisms, including gene regulation, DNA replication, and the organization of chromosomal architecture. The significance of palindromic DNA extends beyond basic biological processes; it is also pivotal in the context of genetic stability and evolution. Despite the importance of these sequences, detecting palindromic DNA poses significant challenges due to their structural complexity1.
Currently existing tools for detecting palindrome sequences remain limited: they are typically inefficient and slow for whole-chromosome scanning, and poorly optimized for imperfect palindromes with long arms or spacers.
In this study, we adopt a new approach. Instead of using conventional methods by (i) searching for initial, short matching sequence pattern as a “core”, and then (ii) gradually expanding from the core in both directions for additional matches, we take advantage of sequence alignment tools that have been traditionally used for genomic sequence assembly, and adapt their design rationales for palindrome detection. Three hypotheses are tested in this study: (i) the algorithm can detect complex and imperfect palindromes with mismatches/indels/gaps; (ii) it can identify long palindromes efficiently, including palindrome arms longer than 1 kb; (iii) it can achieve faster runtime.
Palindromic DNA Overview
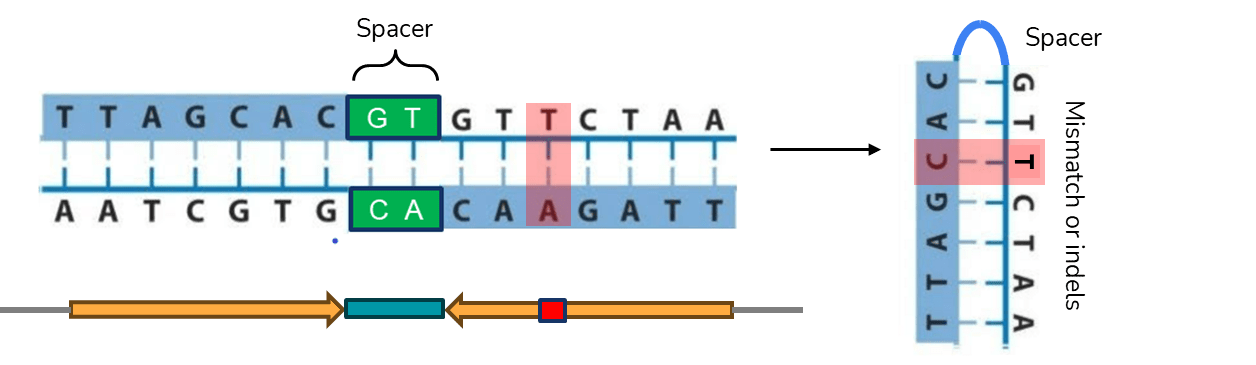
A palindrome in DNA is a sequence consisting of two identical or highly similar inverted repeats which are either adjacent to one another or separated by a spacer region (Figure 1). Because one repeat (also called the palindrome arm) is the reverse compliment of the other, the palindrome DNA sequence reads identically in both directions. If the repeats are identical and have no spacer in between, the palindrome is referred to as perfect (Figure 1A). The term quasipalindrome can be used to refer to a non-perfect palindrome (Figure 1B).
A

B
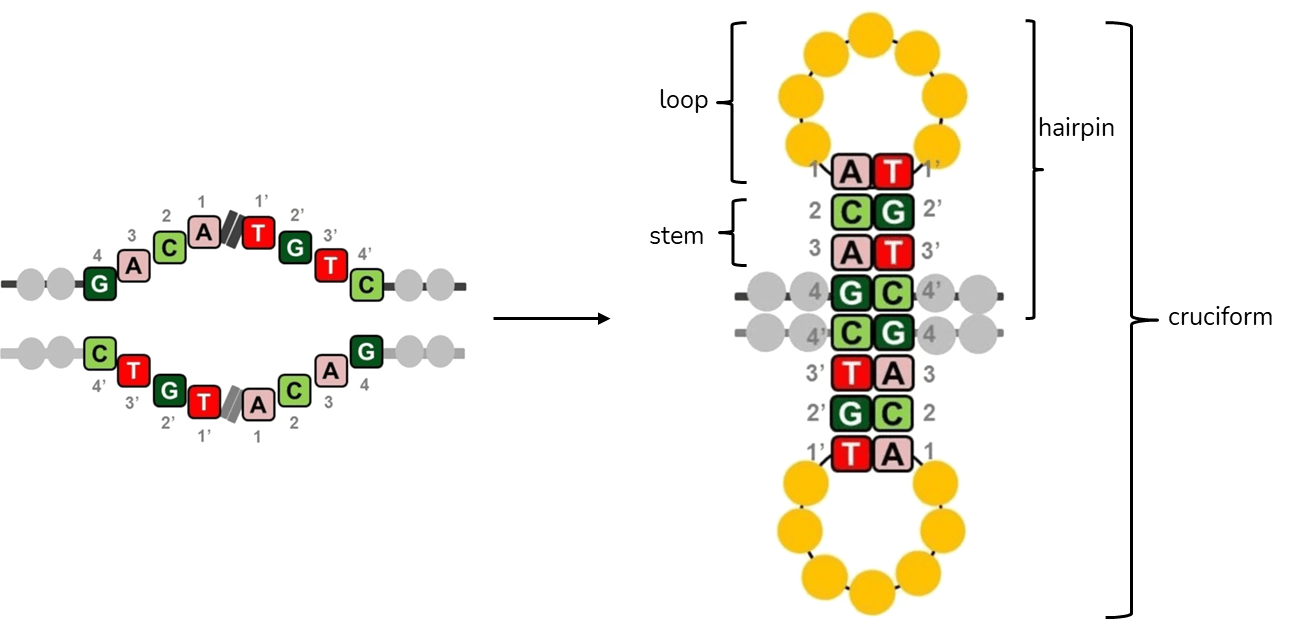
Palindromes are found in genomes of all species investigated so far and they often play important roles as binding sites for homodimeric proteins, parts of promoters, replication origins or other regulatory sequences1. However, many of the discovered palindromes have no known biological function and can be relatively long (from several dozen to several hundred base pairs). During DNA replication, when two strands of DNA are separated, intrastrand base pairing can occur and this results in formation of secondary structures in DNA (Figure 2). In the single-stranded DNA, a hairpin structure forms, while in the double-stranded DNA, a cruciform structure consisting of two hairpins, one in each strand, forms1.
Palindromic Amplification in Cancer Cells
Secondary structures such as hairpin and cruciform in DNA present a risk for genome stability – a hallmark of cancer. These unstable regions are prone to breakage, referred to as double-strand DNA breaks (DSBs), which in turn lead to genetic recombination, potentially resulting in translocations, deletions or gene amplifications with various consequences for the cell and organism.
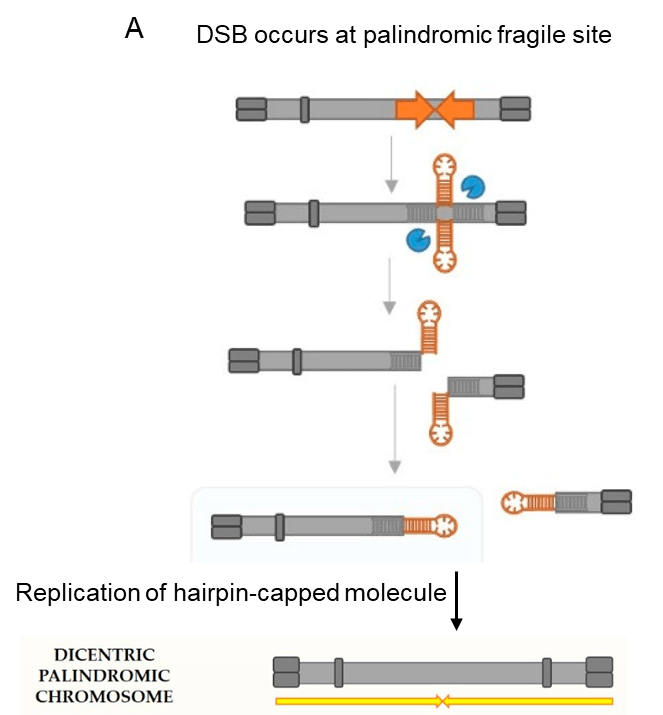
One example of palindrome-induced genomic instability is the breakage-fusion-bridge (BFB) cycles, illustrated in Figure 3. As shown in Figure 3, the cruciform structure is cut by a structure-specific endonuclease, after which ligation produces closed hairpin-capped double-strand break (DSB) ends. Such ends must be opened and processed into conventional DSB ends which can undergo repair. The repair of hairpin-capped molecule can lead to occurrence of a dicentric chromosome upon DNA replication. The entire chromosome is now a palindrome (Figure 3A, represented by two yellow arrows).
During cell division, the palindromic dicentric chromosome can be asymmetrically broken, and one of the resulting chromosomes will carry a palindrome. Multiple rounds of the BFB cycles can result in palindromic amplifications of certain genomic regions (Figure 3B).

Palindrome amplification can lead to additional genetic rearrangements and genome instability. For example, due to “repetitive” nature of palindrome amplification, during cell cycle, unequal sister chromatid exchange can lead to gene copy number gains or losses. Further, intrachromosomal recombination between the acquired repeats can result in the popping out of an extrachromosomal amplicon, also a typical feature of cancer cells.
Because cancer cells often carry deficiencies in one or more tumor suppressor genes important for DNA repair and DNA damage sensing as well as deficiencies in checkpoint systems which should lead the cell into cell cycle arrest, palindrome formation often leads to genetic instability in cancer cells. Ganapathiraju et al. has highlighted the prevalence of palindromic sequences in cancer genomes, emphasizing their role in promoting genetic instability2. The study also linked disease-associated single nucleotide polymorphisms (SNPs) with palindromic regions, finding that disease risk variants were 14 times more likely to occur within palindrome regions than in non-palindromic parts of the genome.
Challenges in Detecting Palindromic Amplifications
Existing palindrome-counting algorithms for detecting the abundance and distribution of DNA palindromes in genome often result in palindrome sequences being overlooked or underrepresented1. Moreover, the cloning of palindrome-containing genome fragments has been found to be difficult or unsuccessful. Finally, it has also been reported that some palindromes maintained on artificial DNA construct were lost during propagation1.
Ganapathiraju et al. constructed a catalog of human DNA palindromes and analyzed variations in these palindromic sequences in 1000 sequenced human genomes2. Their algorithm starts palindrome counting by finding an 8 bp perfect palindrome and then extends the span of the sequence to each side, allowing a maximum of four mismatches between the palindrome arms. In other words, it counts only “near-perfect” palindromes without a spacer. While the algorithm allows for some mismatches between palindrome arms, its strict tolerance for only up to four mismatches may miss biologically significant palindromes with more imperfections. For example, longer palindromes should be allowed to have more mismatches. Furthermore, this method does not account for insertions or deletions in one palindrome arm (but not the other arm), since it checks for matches pair by pair. Finally, the algorithm is more effective at identifying short palindromes, but may not be as well-optimized for detecting long palindromes, which could have greater biological importance. As other studies have shown, palindromes longer than 200 bp are rare but potentially more relevant to disease processes.
Anjana et al. proposed an algorithm by using advanced pattern-matching techniques and optimizing search algorithms to scan nucleic acid sequences for palindromes5. The user provides input, including the DNA sequence and specific constraints such as the minimum or maximum palindrome length to be found. The algorithm begins by iterating through the entire sequence, starting at each nucleotide position one by one. It checks for palindromic sequences by comparing adjacent nucleotides on both sides of the starting position to see if they form complementary base pairs. Since it checks for matches base by base, for longer sequences, it scales poorly with increasing sequence length, and is particularly inefficient if the palindrome contains large gap sizes between the two arms. Furthermore, this method works well for perfect palindromes but the pruning process does not allow for any mismatches, insertions, or deletions. This means that the algorithm would miss longer and imperfect palindromes with mismatches, which are common in genomic sequences.
A few web-based tools, such as EMBOSS Palindrome6 and PalindromeAnalyzer7 are available for detecting palindromes. EMBOSS Palindrome is an application for UNIX-based operating systems that requires high level of computing skills. It can detect imperfect palindrome that contains a central non-palindromic spacer and/or non-complementary pairs in the pairing stem. PalindromeAnalyzer improves its user interface by reporting arm length, mismatches, and secondary structure potential. Both tools remain computationally limited for genome-wide applications, and neither can efficiently handle complex palindromes that are frequently associated with cancer genome. Furthermore, these tools operate on a fixed mismatch process, requiring a user to predefine the number of mismatches permitted. For example, a user needs to type in “0-10” as the range for total mismatches allowed, before scanning a genomic sequence. This could lead to long palindromes with more mismatches not being detected, even if the overall mismatch percentage remains low. Both tools also require a user defined maximal palindrome arm length, so a user may have to make multiple attempts to re-define parameters when searching for long palindromes with unknown length.
The ability to confidently identify palindrome sequences would allow researchers to better understand the biological functions of palindromes. In particular, computational tools to identify the full range of palindrome sequences, including sequence, mismatch, and size variants, would help advance our understandings of biological roles that palindromes play, such as gene expression regulation, binding of regulatory proteins, and genome instabilities in cancer cells.
Methods
To develop a better tool for detecting palindromic DNA, we propose a new approach that can rapidly identify palindrome sequences, by aligning a DNA sequence against its reverse complement. Such alignment method allows us to better accommodate complex palindrome structure when mismatches and gaps/spacers occur.
Rationale Behind the Algorithm
Traditional palindrome-finding tools begin with a search for a short “core” sequence that is a perfect palindrome, then gradually expanding the search to both directions, looking for additional sequence matches. Such approach typically limits the length and complexity of palindromes it could identify.
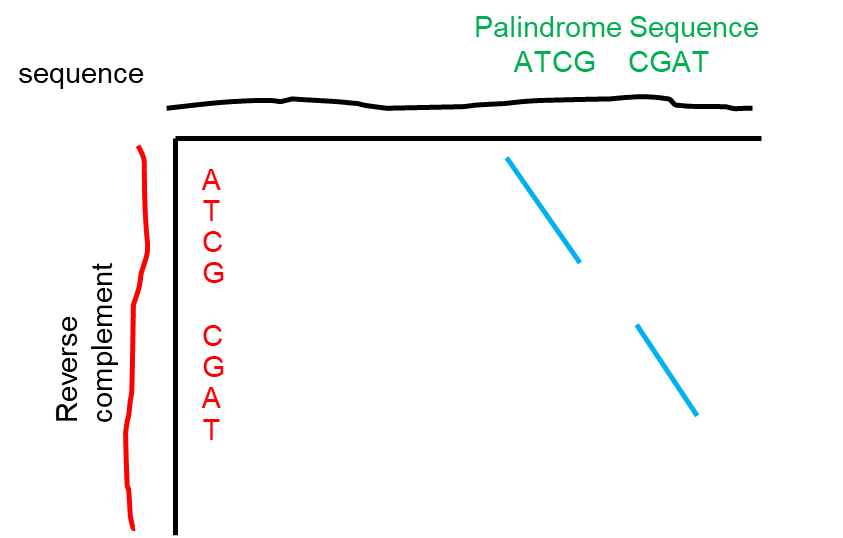
Here, we propose a different approach: a palindrome sequence can be identified based on the rationale that, by definition, it reads the same forward and backward on two complementary strands (see Figure 1); therefore, if one aligns a sequence against the reverse complement of itself, a non-palindrome sequence would yield poor alignment (see below, left, using the first 21 nucleotides from human hemoglobin alpha); in contrast, a palindrome sequence would produce identical or substantially identical sequence alignment (below, right, using the sequence from Figure 1).
ATGGTGCTGTCTCCTGCCGAC TTAGCACGTGCTAA
| | | | | | ||||||||||||||
GTCGGCAGGAGACAGCACCAT TTAGCACGTGCTAA
non-palindrome palindrome
Because we draw inspiration from sequence alignment tools due to the “inverted repeat” nature of a palindrome, we primarily look at how well two different sequences align against each other by overall sequence homology, avoiding the cumbersome process of looking for “core” palindrome first the gradually expanding the palindrome length.
To perform an alignment of a sequence against its reverse complement strand, our algorithm draws inspiration from the traditional dynamic-programming method of finding overlap alignment.
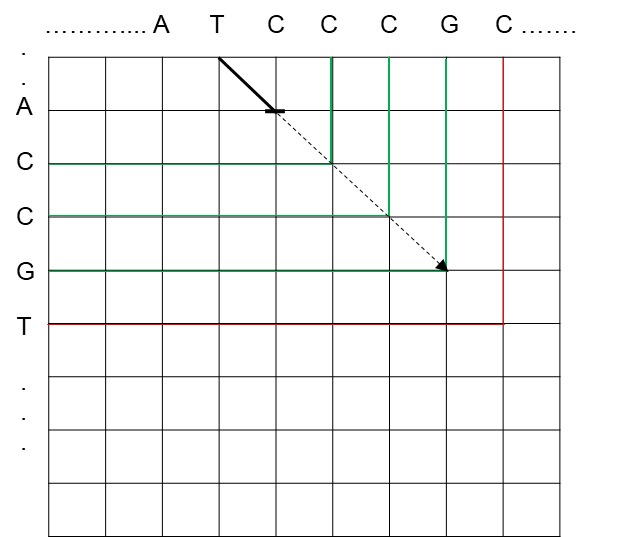
In standard alignment, alignment is done by constructing a dynamic-programming matrix and back-tracing from the bottom right corner of the matrix. To find the overlap alignment between a sequence and its reverse complement, the standard alignment algorithm is adapted such that the back-trace path of the final alignment starts at the right edge of the alignment graph and ends at the top edge of the alignment graph (Figure 4).
Traditional dynamic programming Algorithm (Smith-Waterman)
Our initial algorithm design used traditional dynamic programming method, also referred to as Smith-Waterman algorithm. The goal was to adapt this algorithm to find regions where a sequence and its reverse complement are substantially identical. Such method is typically used when comparing fragments of genomic DNA sequences to each other, or to larger chromosomal sequences8, but there is no published report that it has ever been adapted for palindrome detection through alignment of a sequence against its own reverse compliment.
This method starts with a 2D matrix where one sequence is placed along the rows and the other along the columns. Next, in Step 2, the algorithm uses a scoring scheme to compare the two sequences. A match typically gets a positive score, mismatches get a negative score, and gaps (insertions or deletions) also incur a penalty. In Step 3, each cell in the matric is filled with a score that represents the best alignment up to that point. The idea is to compute the highest score for each cell by considering matches, mismatches, or gaps. If a negative score would be assigned, a zero is placed instead, which allows the algorithm to identify local alignments rather than forcing the entire sequence to be aligned. Next, in Step 4, after the matrix is filled, the algorithm finds the cell with the highest score, which represents the end of the best local alignment. From there, the algorithm traces back through the matrix to reconstruct the alignment by following the path that led to this highest score. The final output is the highest-scoring local alignment between the two sequences. This local alignment may only cover a part of each sequence but will represent the region of highest similarity. An example of the Smith-Waterman is illustrated below as Figure 5.
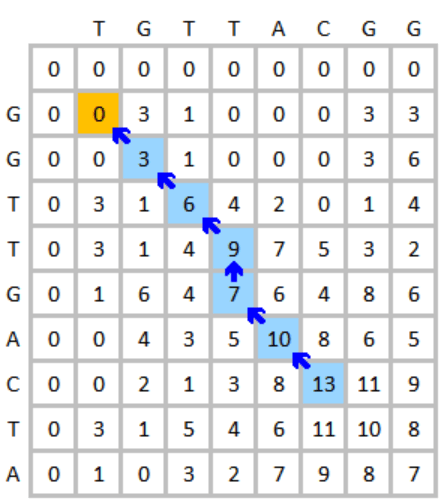
By aligning a sequence against its reverse complement, and using the traditional Smith-Waterman algorithm, one can identify regions where a sequence matches its reverse complement, suggesting the existence of palindromes. Unlike the algorithms reported by Anjana et al. and Ganapathiraju et al., our algorithm allows for mismatches and spacers between the palindrome arms.
Algorithmic Speedups: Diagonal Transition
One problem with the Smith-Waterman alignment algorithms implemented above is that it has quadratic complexity of O(n2), where n is the length of the sequence. As exemplified in Figure 5, as the sequences increase in length, the grids grow quadratically so is the algorithmic complexity. Filling the matrix with scores with longer sequences would take substantial amount of computing power.
We can achieve significant speedups by calculating edit distance in a different way. We can use “diagonal-transition” to achieve significant algorithmic speedups. This “diagonal-transition” algorithm, which takes inspiration from Gene Myers’ O(ND) edit distance algorithm9, reimagines the traditional dynamic programming matrix as a series of paths, by which an alignment can be constructed by tracing a given path back to the upper edge. As a result, we do not need to compute an entire matrix to perform the alignment, which is the bottleneck in the commonly used algorithms (such as Smith-Waterman-based implementations). In our new algorithm, we assign an array that represents each “diagonal” of the dynamic programming matrix as a furthest-reaching path. In other words, for a given edit distance D, it represents the furthest-reaching path, i.e. the path with the greatest height, ending on that diagonal. An example is illustrated in Figure 6.

To perform the alignment, we iterate through edit distance D = 0, 1, 2… Each iteration consists of two steps, each corresponding to an observation about the dynamic programming matrix.
In the first step, each furthest-reaching path is extended as far as possible along matching diagonals, as shown in Figure 7.
In the second step, we compute the next array, allowing for mismatches within the paths. We can simulate this by computing the furthest reaching point between the given path and its immediate neighbors. In other words, for each path, we calculate the next value by determining the furthest-reaching path between a substitution mismatch, an insertion/deletion (indel) from extending the path of the leftmost neighbor, or an indel from extending the path of the rightmost neighbor. Figure 8A-8C provide illustrations of furthest-reaching paths between the three types of operations.
When a path reaches the right-most edge of the graph, that path is considered completed and not considered in any more calculations. The edit distance is stored and the identity of that alignment is calculated from it. When all paths have been completed or an arbitrary edit distance threshold has been reached, the algorithm terminates, returning an array containing all of the calculated identity alignments.
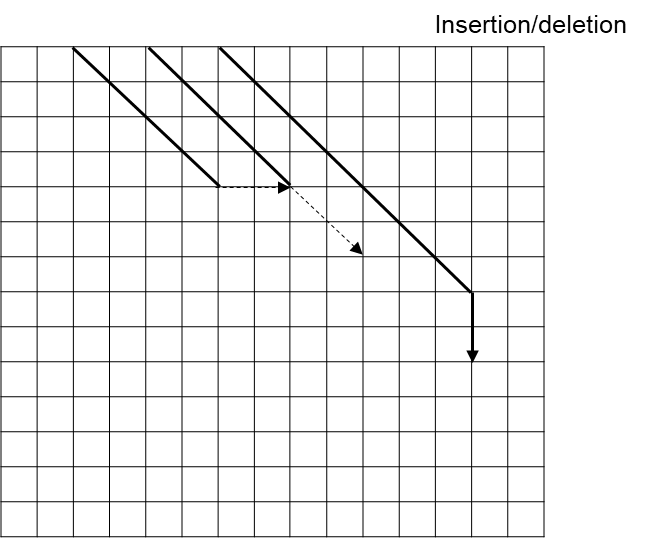


Figure 9 provides an example comparing the traditional Smith-Waterman method used in our initially attempt (9A, where the entire matrix is filled), and the optimized algorithm implemented in subsequent iterations (9B, where alignment is limited to areas surrounding the diagonal region).

One can see that, as compared with previous algorithms for detecting palindrome sequences, our algorithm handles imperfect palindromes well. Mismatches, insertions, and deletions between the two palindrome arms are all accounted for by shifting the diagonal path, as illustrated in Figure 8A, 8B, and 8C. Further, the algorithm also can detect palindromes with spacers between palindrome arms. A spacer nucleotide is in essence considered as “indels,” and the algorithm simply shifts the diagonal path to the right or shifts down by 1, as described in detail above. As the algorithm scans through the gap sequences, the “mismatch” continues to force the diagonal path to shift rightwards or downwards until it finds the other palindrome arm.
There are a few caveats to this approach, all of which are handled effectively by the algorithm. First, alignment along the main diagonal will result in a perfect alignment. Further, alignment towards the end of the sequence will result in extremely noisy computations, as the overall alignment length is shorter. We can handle these by restricting the alignment interval and removing the main diagonal and diagonals below a certain length from the alignment.
XOR Optimization
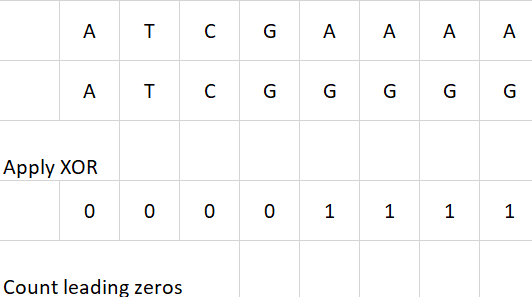
We incorporated an additional commonly used optimization strategy in our algorithm by employing XOR operations and bitwise comparisons for sequence matching. Instead of sequentially comparing base pairs one by one, our approach leverages bitwise operations to simultaneously match eight base pairs. Specifically, we utilize the XOR function to detect mismatches and employ a highly efficient low-level routine to count consecutive zero bits, indicating matches. This enhancement yields an approximately eightfold improvement in processing speed, as it enables the parallel comparison of eight base pairs in a single operation. Figure 10 provides an example of XOR optimization.
Mismatch Criteria
When analyzing continuous genomes that may contain multiple palindromes, it is essential to establish a criterion for terminating the search for a given palindrome and initiating the search for a new one. Our algorithm achieves this using a mismatch-percentage. Specifically, a palindrome is considered to end when the mismatch rate – defined as the number of mismatches relative to the total palindrome length, or the percentage of mismatches within the sequence – reaches or exceeds a user-specified threshold. For instance, if the user sets the maximum allowable mismatch rate to 0.25, the algorithm permits no more than one mismatch per four base pairs, such that a palindrome of 100 base pairs can tolerate up to 25 mismatches before termination. This allows for more tolerance for longer palindromes, rather than a fixed number of mismatches that could terminate longer sequences early.
While this approach accommodates imperfect palindromes, it introduces new inefficiencies, particularly for long palindromes. In cases where the palindrome contains a high percentage of matches, the algorithm may continue searching beyond the actual endpoint because the mismatch threshold has not yet been met. For example, if the mismatch threshold is set to 1/3, and initial scanning has already identified a palindrome with 100 perfectly matched base pairs, then, it would require another 50 consecutive mismatches (resulting in a mismatch rate of 50/150 = 1/3) to terminate and output the palindrome. Under this scenario, the output would have a first 100 bp matched palindrome sequences, followed by 50 irrelevant, mismatched sequences. This inefficiency highlights a trade-off between tolerating imperfections and optimizing computational performance. Further, this would permit large non-palindromic regions at the end of palindromes to be included in the sequence output.
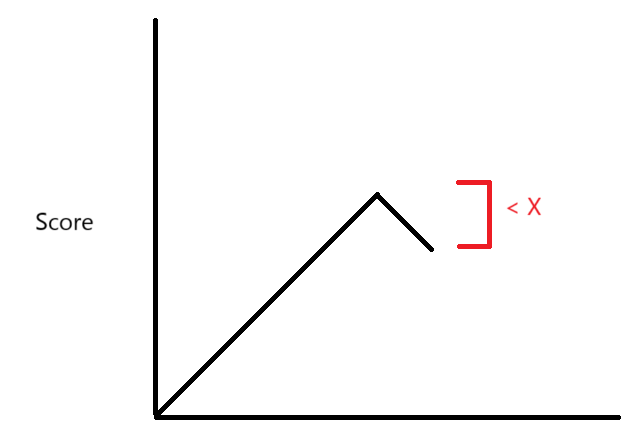
To address this issue, we draw inspiration from the algorithm proposed by Zhang et al., which employs the “X-drop” technique10. X-drop strategy was previously used in DNA sequence alignment analysis to improve efficiency. This approach assigns score bonuses for matches and score penalties for mismatches, insertions, and deletions. By tracking the maximum score achieved during the search, the algorithm determines termination when the current score drops by a user-defined value, X, below the maximum, effectively signaling an excessive accumulation of mismatches. We now incorporate similar strategies into our algorithm to address potential inefficiencies in detecting palindromes with long arms. Using the example above, with 100 bp perfect match already identified, and mismatch threshold set at 1/3, one can set X-drop value to 20; then, if the mismatch penalty is -4 (default), it will only take 5 consecutive mismatches (5 x (-4) = -20) to terminate the palindrome search. This way, the output would not include long stretches of irrelevant sequence at the end.
Importantly, the scoring parameters – including bonuses, penalties, and the X-drop value – are user-defined, allowing users to tailor the algorithm’s sensitivity to specific requirements. Figure 11 provides a graphic illustration of using X-drop to define maximal allowed drop in matching scores tolerated by a palindrome sequence.
Scoring and Thresholds
The following scoring system is implemented to ensure the accuracy of palindrome sequences that are identified by this algorithm: matches = +1; mismatches = –4; X-drop = 20. Mismatch-to-length ratio = 0.05. Default values were chosen to balance sensitivity and false positives. Because we used diagonal transition instead of traditional Smith-Waterman method, the gap penalties are fixed to accommodate diagonal-based based algorithm, and are calculated based on the match bonuses and mismatch penalties according to Zhang et al.10; this is to ensure that the scores are solely based on the diagonal.
Pseudocode and Source Code
Pseudocode for the algorithm is provided as Appendix 1. The full source code is available at GitHub (https://github.com/brianli314/palindrome-finder).
Results
The primary application of this algorithm is the rapid identification of palindromic sequences within genomes, a task that is typically computationally intensive. We systematically analyzed the human genome by tracking a starting position and performing sequence alignment against its own reverse complement to detect palindromes. The algorithm scans through “matched” sequences and resets upon encountering a significant number of mismatches. If a palindrome meeting the minimum length criterion is identified before the reset, the sequence is recorded, and the new starting position is set to the endpoint of the previous alignment. If no palindrome is detected or if the identified sequence is shorter than the required minimum length, the algorithm advances to the base pair immediately following the previous starting position.
User Interface and Output
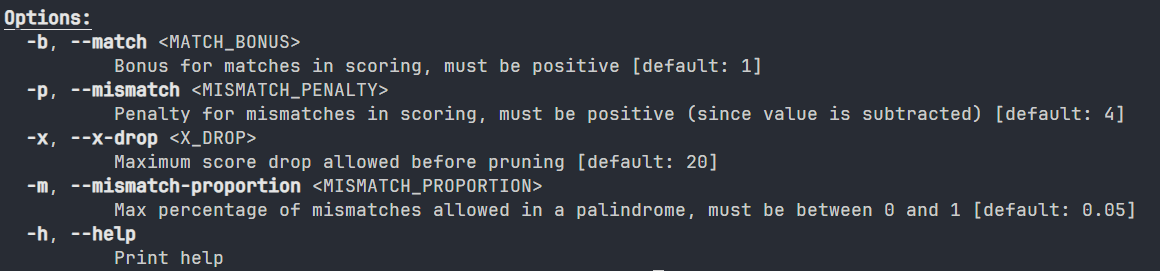
This tool operates through a Command Line Interface (CLI), requiring users to specify pre-defined parameters directly via the command line. Screenshots showing user interface and parameter inputs are shown as Supplemental Figure S1. The tool also accepts FASTA, FASTQ, and compressed FA/FQ inputs. An example of a Command Line is as follows:
./palindrome-finder wfa –input input.fastq –fq –output
results.tsv –length 10 –gap 5 –match-bonus 1
–mismatch-penalty 1 –x-drop 25 –mismatch-proportion 0.05
In this example, “fq” refers to FASTQ input format, the minimal length of the palindrome arm is set at 10 bp, with a gap size capped at 5, and mismatch tolerance set at 0.05 (5%).
The output generated from running the sequence analysis is a tsv file listing all palindromic sequences identified within the input file or sequence. A screenshot of a sample output is shown as Figure 12. Data output includes the start point, end point, arm length, gap length, total length, the number of mismatches, and the palindromic sequence itself. A user can download the identified sequences and further analyze their biological significances. Certain output sequences were randomly selected to manually verify and confirm their palindromic nature.

Our initial analyses for “palindromes” identified by our algorithm suggested that many are actually higher-order repeats – large stretches of repetitive sequences within the chromosome (e.g., atatatatatatat), which are generally uninformative as they do not contribute to biologically significant coding sequences. However, these higher order repeats were still documented as palindromes. In most genomes, and in the CHM13 dataset that we used, such repeats are denoted by original curators as lowercase base letters to indicate their repetitive and non-coding nature. To refine the results and exclude unnecessary data, we refined the output result through another filter to focus on biologically more relevant palindromes, and palindromes containing more than 50% lowercase base pairs were filtered out. Use of this filter is optional, as it is based on a separate script.
Detecting Palindrome Sequences in Human Chromosomes
In 2022, Holt et al. and Nurk et al. presented the discovery and annotation of the complete, telomere-to-telomere (T2T) assembly of the pseudo-haploid human cell line CHM1311,12. The algorithm described in this paper was tested on the CHM13 dataset, including the various algorithmic speedups, and produced promising results.
As a pilot study, chromosome 2, the second largest human chromosome, was scanned for palindrome sequences using the algorithm described in this paper. Running the algorithm on Chromosome 2 took 5-10 minutes, using the following parameters: (1) reference genome chm13v2.0, chromosome 2; (2) input settings: minimum arm length = 10; maximum gap length = 200; match bonus = 1; mismatch penalty = -4; X-drop = 20; mismatch-length ratio = 0.05 = 5%.
The results are summarized in Figure 13. Figure 13A illustrates the length distribution of palindrome arms identified on Chromosome 2. The majority of palindromes have arm lengths shorter than 40 nucleotides, with a notable dominance of arms shorter than 20 nucleotides.
More significantly, the algorithm also identified numerous longer palindromes, including the longest, which features an arm length exceeding 100,000 base pairs, a gap of 700 base pairs, and only 1,800 mismatches (or a mismatch percentage of <1.8%) throughout the whole palindrome, not including the gap. As discussed above, palindromes longer than 200 bp are rare but potentially more relevant to disease processes. Further, despite the high absolute number of mismatches (1,800), the proportion of mismatches relative to arm length remains very low (<1.8%), thus the mismatches are unlikely to disrupt overall base-pairing stability of palindrome stems.
Interestingly, many of the identified palindromes exhibit long gaps (spacers). Figure 13B presents the distribution of gap lengths, which range from 10 nucleotides (indicating no gap) to 200 nucleotides (the cutoff value). Although a substantial portion of palindromes have gaps shorter than 12 nucleotides, the distribution of gap lengths above 15 nucleotides is surprisingly uniform.
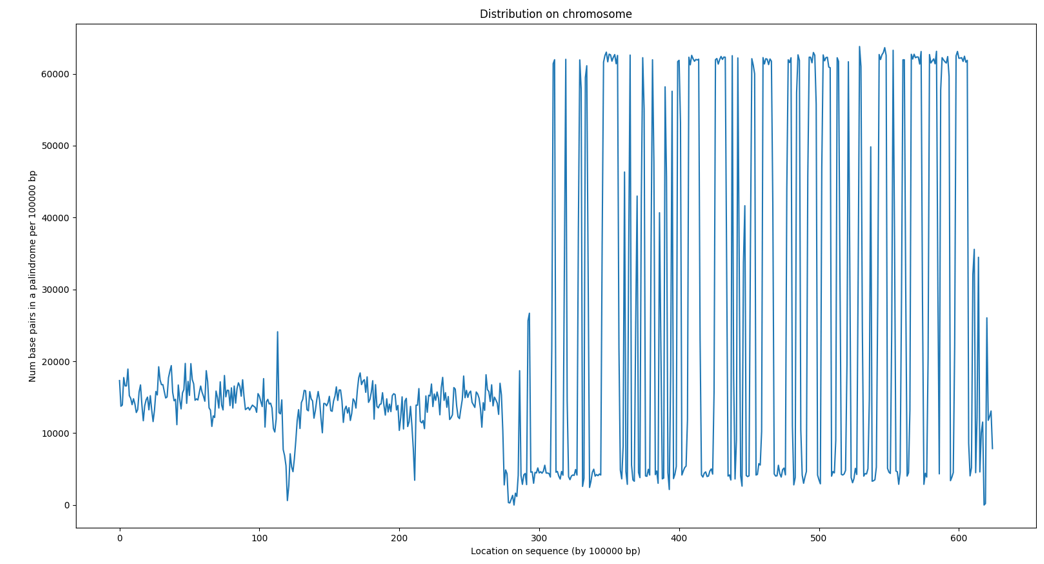
Finally, Figure 13C shows the spatial distribution of palindrome sequences along Chromosome 2. The X-axis represents the chromosomal positions of palindrome sequences, while the Y-axis indicates the number of base pairs involved in palindromes within 100,000-base-pair intervals. As depicted, palindrome sequences are distributed throughout the chromosome, with a higher concentration observed near the telomere regions.
The higher occurrence of palindrome near the telomere regions is consistence with previous report linking palindrome formation with telomere losses. Raykov et.al. reports that telomere losses trigger formation of palindromes, thus contributing to loss of genomic guardians or amplification of oncogenes. Consistent with this hypothesis, palindromes are often detected in human cancer cells and their frequency increases with telomere dysfunction in mouse cancer cells13,14,15.
Using similar parameters, all chromosomes from CHM13 were successfully scanned for potential palindrome sequences. Results from Y chromosome are plotted and show in Figure 13D.
The Y chromosome profile reveals a sharp increase in large palindromes in the ampliconic region of the long arm (Yq). These peaks correspond to regions known to harbor the large palindromic amplicons that define the male-specific region of the Y (MSY). For example, as reported by Trombetta et al. and Skaletsky et al., the majority of the large palindromic sequences are found in the Yq ampliconic region and are named P1 through P816,17.
This algorithm offers a powerful tool for the discovery and annotation of palindrome sequences in both existing and newly sequenced genomes.


Preliminary Results From A Breast Cancer Cell Line
Having successfully demonstrated the advantages of our algorithm in human genome that is derived from a normal cell, the next step is to use our algorithm to detection palindrome sequences in cancer genomes, and comparing the differences in palindrome occurrence in normal cells versus cancer cells. As noted before, palindromes and breakage-fusion-bridge cycles have been documented as causing genome instability and potentially resulting in cancer.
Analysis into the presence of palindromic structures in cancer cell lines is still ongoing. One particular obstacle is that unlike CHM13 dataset, which has been fully assembled, curated, and annotated, there is no assembled datasets from cancer-derived cell lines.
De novo genome assembly is particularly difficult due to well-known challenges such as repetitive DNA regions, which break the assembly process, and high computational demands for processing massive datasets.
Cancer cell line HiFi reads corresponding to breast ductal carcinoma were downloaded from https://ftp.sra.ebi.ac.uk/vol1/fastq/SRR283/063/SRR28305163/. Due to the large file size and computational requirements to assemble, the Galaxy public web server was used (usegalaxy.org). Hifiasm (Galaxy version 0.25.0) was used with the default settings to assemble the reads, and the primary assembly contigs were used for our analysis. Since de novo assembly contains significant technical challenges, this assembled into 2000+ contigs instead of 46 fully assembled human chromosomes, so the results run on this assembly are not perfect and should be considered preliminary.
To identify breakage-fusion-bridge (BFB) cycle structures (Figure 3B) in this cancer cell line, our search primarily targeted large palindromes with small gap sizes, which are more likely to be biologically significant and indicative of BFB structures. CHM13 dataset was run simultaneously as a control. For both CHM13 and our de novo assembled cancer cell line, we set the minimum arm length of 200 and a maximum gap of 50 as our selection criteria.
The results of one representative run are shown in Tables 1A and 1B. Table 1A summarizes palindromes detected from the breast cancer cell line, and Table 1B summarizes palindromes detected from control dataset CHM13. Due to space constraints, the sequences of these palindromes are not shown.
| Start | End | Arm length | Gap | Total length | Mismatches | Seq-name |
| 97172 | 108779 | 5785 | 38 | 11608 | 246 (4.1%) | ptg000002l |
| 80301487 | 80302173 | 326 | 35 | 687 | 17 | ptg000003l |
| 36676605 | 36677170 | 283 | 0 | 566 | 15 | ptg000013l |
| 35835033 | 35835548 | 250 | 16 | 516 | 13 | ptg000015l |
| 45932328 | 45932852 | 248 | 29 | 525 | 13 | ptg000015l |
| 11608860 | 11609485 | 290 | 46 | 626 | 15 | ptg000020l |
| 52133933 | 52134868 | 455 | 26 | 936 | 23 | ptg000021l |
| 74104977 | 74105839 | 415 | 33 | 863 | 21 | ptg000021l |
| 9925276 | 9925726 | 201 | 49 | 451 | 11 | ptg000022l |
| 15669081 | 15669684 | 301 | 2 | 604 | 16 | ptg000026l |
| 20449246 | 20449676 | 215 | 1 | 431 | 11 | ptg000037l |
| 17785731 | 17786224 | 224 | 46 | 494 | 12 | ptg000041l |
| 43985922 | 43986365 | 206 | 32 | 444 | 11 | ptg000053l |
| 13885330 | 13885855 | 243 | 40 | 526 | 13 | ptg000056l |
| 1236121 | 1236720 | 285 | 30 | 600 | 15 | ptg000072l |
| 0 | 5416 | 2689 | 39 | 5417 | 0 | ptg000088l |
| 1483283 | 1483811 | 262 | 5 | 529 | 14 | ptg000089l |
| 6003372 | 6003787 | 202 | 12 | 416 | 11 | ptg000160l |
| 4023075 | 4023498 | 207 | 10 | 424 | 11 | ptg000214l |
| 291357 | 292023 | 326 | 15 | 667 | 17 | ptg000217l |
| 29774 | 41316 | 5765 | 13 | 11543 | 239 (4.3%) | ptg000422l |
| 1340687 | 1356746 | 8007 | 46 | 16060 | 261 (3.3%) | ptg000489l |
| 4350 | 4773 | 207 | 10 | 424 | 11 | ptg000871l |
| Start | End | Arm length | Gap | Total length | Mismatches | Seq-name |
| 157054435 | 157055253 | 392 | 35 | 819 | 20 | chr1 |
| 179036873 | 179037808 | 444 | 48 | 936 | 23 (5.2%) | chr1 |
| 241111963 | 241112413 | 201 | 49 | 451 | 11 | chr1 |
| 135874242 | 135874770 | 249 | 31 | 529 | 13 | chr3 |
| 145975448 | 145975963 | 247 | 22 | 516 | 13 | chr3 |
| 12693324 | 12693754 | 208 | 15 | 431 | 11 | chr4 |
| 87939607 | 87940291 | 339 | 7 | 685 | 17 | chr8 |
| 132356346 | 132356895 | 257 | 36 | 550 | 13 | chr8 |
| 99615030 | 99615562 | 264 | 5 | 533 | 14 | chr10 |
| 112127076 | 112127963 | 421 | 46 | 888 | 22 (5.2%) | chr10 |
| 30386648 | 30387075 | 205 | 18 | 428 | 11 | chr11 |
| 47717315 | 47717947 | 294 | 45 | 633 | 15 | chr11 |
| 116827018 | 116827486 | 231 | 7 | 469 | 12 | chr11 |
| 42009113 | 42009712 | 285 | 30 | 600 | 15 | chr17 |
| 55724249 | 55735791 | 5765 | 13 | 11543 | 238 (4.1%) | chrX |
As shown in Table 1A, the breast cancer cell line harbors multiple unusually large palindromes that far exceed the sizes typically observed in the reference genome. Several of these palindromes have arms greater than 5 kb, including one as large as 8,007 bp. Notably, these large palindromes exhibit very small gap sizes, consistent with the hypothesis that they are generated through breakage–fusion–bridge (BFB) cycles (Figure 3B). These large palindromes are not isolated events, but distributed across multiple contigs, suggesting widespread palindrome expansion in the cancer genome. By contrast, the CHM13 reference genome (Table 1B) contains far fewer extreme examples: although one large palindrome spans 5,765 bp on chromosome X, the majority are substantially smaller, clustered around 200–400 bp arm lengths.
Despite the high absolute number of mismatches in long palindromes, the proportion of mismatches relative to arm length remains low, generally in the range of 3–4%. This highlights an advantage of our algorithm: it is able to detect palindromes where mismatch counts appear large in absolute terms but remain proportionally minor, and thus unlikely to disrupt overall base-pairing stability of palindrome stems. In contrast, other tools such as EMBOSS Palindrome and PalindromeAnalyzer require the user to predefine an absolute mismatch threshold, which increases the likelihood of missing the long palindromes identified in Tables 1A and 1B.
Taken together, these findings indicate that the cancer genome harbors a greater abundance of large palindromes, many of which likely arise through BFB cycles given their small gap sizes, whereas the normal reference genome largely contains shorter palindromes. The enrichment of long palindromes in cancer is consistent with prior reports linking palindromes to genomic instability, particularly through mechanisms such as BFB cycles and gene amplification. Our findings therefore reinforce existing evidence that palindrome accumulation and expansion are hallmarks of cancer genome instability18.
Benchmarking Against Existing Palindrome Finders
To evaluate the efficiency and scalability of our tool, we benchmarked it against the two most widely used palindrome detection tools, EMBOSS Palindrome and PalindromeAnalyzer. These comparisons were designed to highlight differences in runtime, memory usage, detection sensitivity, and accuracy across CHM13 datasets.
Our initial attempt to perform a genome-wide comparison on the complete CHM13 human reference genome was unsuccessful, as both EMBOSS Palindrome and the PalindromeAnalyzer web server crashed after several hours of running. After multiple attempts with adjusted parameters, we restricted the benchmarking to the Y chromosome only, since it is the second smallest chromosome and palindromes are known to be a prominent feature of haploid sex chromosomes16. Even with this significantly reduced dataset, however, PalindromeAnalyzer consistently failed, terminating after more than five hours of runtime, and thus no benchmarking results could be obtained.
Benchmarking against EMBOSS Palindrome was more successful, and the results are summarized in Tables 2A and 2B. Table 2A reports runtime and memory usage on the CHM13 Y chromosome, where our method was significantly faster EMBOSS Palindrome.
| Method | Runtime | Memory Use |
| Our tool | 10.06 seconds | 26.5 mb |
| EMBOSS web server | * | * |
| EMBOSS via Galaxy | ~2 hours | Not reported |
| PalindromeAnalyzer | * | * |
* Program crashed or did not produce a result after 8+ hours
Table 2B summarizes the palindromes detected across the Y chromosome. We observed that EMBOSS consistently reports shorter palindromes, whereas our tool generally identifies longer ones. Manual inspection revealed that EMBOSS often terminates palindrome searches prematurely, fragmenting a long palindrome into several smaller ones. As a result, simply comparing the number of palindromes detected does not provide an accurate benchmark. To address this, we instead use the total nucleotide count in palindromic sequence as a more reliable statistic for head-to-head comparison.
| total palindromic nucleotide counts | Predefined arm Length | Predefine Gap size | Predefined mismatches | |
| Our tool | 4394378 | ≥20 | 0-6 | ≤25% |
| EMBOSS | 2381116 | 20-1000 | 0-6 | 0-5 |
| PalindromeAnalyzer | * | – |
* Program crashed or did not produce a result after 8+ hours
Compared to EMBOSS, our tool detected nearly twice as many nucleotides involved in palindromic sequences on the Y chromosome (4.39 Mb vs. 2.38 Mb), demonstrating its better ability to capture long and complex palindromes.
It should be noted, however, that direct head-to-head comparisons with EMBOSS for detecting long palindromes were unsuccessful, as the program either crashed or ran for more than 5–6 hours without producing a result. After multiple attempts, we restricted the parameters to a palindrome arm length of 20–1000 bp with a maximum of five mismatches. Attempts to extend the upper arm length limit beyond 1000 bp, or to increase the minimum arm length threshold from 20 to 50 bp, consistently resulted in substantially longer runtimes (on the order of 8 hours or more) without yielding a meaningful increase in the number of palindromes detected.
As discussed above, Y chromosome is known to have usually large palindromes in the Yq arm region16,17, and our own data (Figure 13D) confirm that large palindromes longer than 6000 bp are common. EMBOSS’s inability to process palindromes with arm lengths greater than 1000 bp therefore represents a major limitation, particularly for chromosomes such as Y that are enriched in large ampliconic palindromes.
Taken together, these results demonstrate that our tool not only achieves substantially shorter runtimes compared to existing algorithms, but is also capable of detecting long and complex palindromes that other tools, including EMBOSS Palindrome and PalindromeAnalyzer, fail to handle.
Discussions
Advantages of the Algorithm
Structure-forming repeats, including palindromes, have been linked to genome instability and mutagenesis19. Repeat-mediated instability is a well-established source of chromosomal rearrangements and disease-related mutations20.
Our algorithm holds several advantages over the algorithms proposed by Ganapathiraju et al. and Anjana et al.2,5. The Ganapathiraju algorithm starts palindrome counting by finding an 8 bp perfect palindrome and then extends the span of the sequence to each side, allowing a maximum of four mismatches between the palindrome arms. Its strict tolerance for only up to four mismatches may miss biologically significant palindromes with more imperfections. Furthermore, this method does not account for insertions or deletions in one palindrome arm (but not the other arm), since it checks for matches pair by pair. Finally, the algorithm is not well-optimized for detecting long palindromes.
Anjana’s algorithm begins by iterating through the entire sequence, starting at each nucleotide position one by one. Since it checks for matches base by base, for longer sequences, it scales poorly with increasing sequence length, and is particularly inefficient if the palindrome contains large gap sizes between the two arms. Furthermore, this method works well for perfect palindromes but the pruning process does not allow for any mismatches, insertions, or deletions.
By aligning a sequence against its reverse complement and identifying matches, our algorithm holds the unique advantages efficiently identifying palindrome sequences of all sizes, including imperfect palindromes and palindromes with gaps (spacers) between its two arms. Insertions, deletions, mismatches, and gaps between the two palindrome arms are all factored in as “scores” and a threshold can be set to determine when the matching score becomes too low and the palindrome search should end.
Furthermore, our algorithm has a major speed advantage over the traditional Smith-Waterman or Needleman-Wunsch algorithms. It has an algorithmic complexity of O(nd), where d is the edit distance between the two sequences and n is the length of the sequence. This represents a major improvement over Smith-Waterman alignment algorithms, which have quadratic complexity of O(n2).
Finally, our benchmarking results show that existing tools such as EMBOSS and PalindromeAnalyzer become impractical for detecting long palindromes, often requiring many hours of runtime and enforcing restrictive limits on palindrome length. These constraints limit their applicability to genome-wide studies, where long and imperfect palindromes are often more biologically significant. By contrast, our method achieves substantially shorter runtimes while detecting long and complex palindromes, providing a scalable framework for large-scale genomic analysis.
Disease Association
According to Ganapathiraju et al., disease risk-associated single nucleotide polymorphisms (SNPs) were 14 times more likely to be found within the palindromic regions than in other regions2. In another study, researchers compared 69 serum-normal and tumor genomes originating from The Cancer Genome Atlas with 1000 human genomes as a control21. The aim of this study was to computationally identify differences in palindrome occurrence on chromosomes 8 and 11 between these two groups of genomes. The authors report that in multiple cases, palindromes which happen to be near genes involved in breast carcinogenesis were among those which differed the most in cancer compared to normal cell genomes.
As discussed above, currently one significant challenge in detecting palindrome sequences in cancer genome is the lack of fully assembled cancer genome sequences. There is no curated dataset similar to CHM13, thus hindering further analyses that compare the differences in palindromes in normal cells vs cancer cells. Nonetheless, our preliminary data have shown a significant increase in usually large palindromes in a breast cancer cell line, as compared to CHM13 dataset (Tables 1A and 1B). With the rapid advance in computational tools, we are confident that curated cancer genomes should become available in the near future, and the algorithms reported in this study holds the potential to facilitate the identification and annotation of amplified palindrome sequences in cancer cells.
Another area for our future work is to annotate the palindrome sequences identified by our algorithm and study amplified genes encompassed by sequences. One can imagine that most likely, two types of palindrome-induced amplification will be identified, one associated with the increased cell proliferation that is common for all cancer types (such as MYC oncogene amplification that has been found across many different types of tumors), the other associated with specific type or lineage of cancer cells (such as amplification of HER2 oncogene in breast cancer). By scanning and comparing palindrome sequences across different types of cancer cells, researchers could potentially identify and compare palindrome-induced amplifications across different types of cancers. This may help elucidate the functions of certain genes that are common for all types of cancers, as well as genes that are unique to specific type of cancer.
Besides genome instability and cancer, recombination between palindrome arms can result in formation of dicentric Y chromosome, and recombination between different Y-specific palindromes can result in massive deletion, all known causes of a range of sex-linked reproductive disorders. Elucidating palindromes in Y chromosomes may help us gain insights into such sex-linked reproductive disorders.
Population Variation Analysis and Evolutionary Analysis
Human genome harbors large segmental duplications which make up for about 5% of the genome and are together clustered in about 400 regions. Segmental duplications arose during primate evolution and maintain high sequence identity between duplicated regions. It has been reported that palindromes with longer arms sharing a higher degree of sequence similarity and having a shorter or absent spacer present a higher risk for the genome stability. These observations have not only been experimentally proven for palindromes in model organisms but also noted for palindromes with varying spacer length and arm length polymorphisms within the human population1. Our algorithm would aid in the detection of new palindrome sequences within human genome, such that population variation and disease association can be studied. Further the algorithm can be used to identity new palindrome sequences in other species, thus helping us to obtain more insight into our evolutionary past.
In addition, studying palindromes sequences in Y chromosome is particularly intriguing because Y chromosome only pairs with X chromosome during meiosis; therefore, homologous chromosome exchange cannot occur on Y chromosome. Instead, palindrome sequences serve an important evolutionary purpose because they allow intra-chromosomal recombination in an otherwise non-recombining chromosome. For example, palindromes P1–P8 on the male-specific section of chromosome Y span dozens of genes, many of which are essential for spermatogenesis. Intrachromosomal gene conversion can protect against deleterious mutations, but also having an extra copy of these genes can enhance the adaptive evolution of chromosome Y1. Our algorithm would aid in the detection of new palindrome sequences in Y chromosomes and help us understand the evaluation of Y chromosomes as well as Y-linked reproductive disorders.
Algorithmic Improvements
Additional methods have been planned to further reduce the algorithmic complexity and speed up the process even faster. The algorithmic complexity of the current algorithm is O(nd), where n is the length of the string, and d is the maximum edit distance passed as a parameter to the alignment function. Although this is already a significant improvement over the standard O(n2) algorithm, nonetheless, when analyzing long sequences with large parameters, such as extended arm lengths or larger gap sizes, it may still require substantial processing time.
We can leverage the fact that the algorithm introduced above lends itself naturally to parallel execution to achieve additional speedups. For example, Graphics Processing Units (GPUs) are massively parallel devices with thousands of threads. By sharing the scalar operations among multiple threads, it is possible to achieve speedups of 100x or more.
Conclusion
In conclusion, the novel method for detecting palindromic DNA presented in this paper demonstrates significant advancements in the identification and analysis of these unique genetic sequences. The development of this algorithm not only advances the identification and annotation of palindromic sequences but also provides a valuable tool for cancer research. By facilitating the study of these sequences, the algorithm has the potential to enhance our understanding of their role in genomic instability and cancer development, contributing to the broader field of genomic research and cancer biology.
Acknowledgements
First and foremost, I extend my gratitude to my mentor, Prof. Heng Li, for his guidance, support, and patience. His extensive knowledge and expertise have been a constant source of inspiration throughout this project. I also thank Ying Zhou from Prof. Li’s lab for her assistance with data analysis. Lastly, I am grateful to my brother, Aaron Li, for his thoughtful advice, which contributed to the success of this work.
Appendix 1. Pseudocode
Input : S // the sequence to be aligned
n // the length of S
D // the maximum mismatch ratio
X // the x-drop threshold
g // the max gap
L // the min length
Output: [v1 v2 v3 … vn] // list of palindromes detected
Function palindromes(S, n, D, X, g, L):
// Initialize output
V → Array [] of Palindromes
// Reverse complement
Sc → reverseComplement(S)
// Loop through S…
for index 0 → S do
// Array contains furthest-reaching paths along each diagonal
W → Array [0..g] of integers
// Number of mismatches
E → 0
// Highest score
M → 0
// Keep track of the longest path
ℓ → 0.001 // Small number to avoid dividing by 0
// Extension phase: extend along matching diagonals until mismatch
while E / ℓ < D do
for w in W do
// Extend while the sequence matches its reverse complement
// Special indexing for S required
while S(W[w]) = Sc(W[w]) do
W[w] → W[w] + 1
// Update max score if new score is larger than old score
M → Max(score(W[w]), M)
// Update max length
ℓ → Max(W[w], ℓ)
// Update number of mismatches after sequence stops matching
E → E + 1
// Continue to next base if score goes below X-drop
// or the mismatch ratio exceeds D
if score(ℓ) < M − X OR M / ℓ ≥ D then
// Stop searching and keep current palindrome
Break
// Check if palindrome has the required length
if ℓ ≥ L then
// Add palindrome P to V
V.append(P)
// Skip to end of current palindrome and continue loop
index → index + ℓ
else
index → index + 1
return V

References
- M. Svetec Miklenić, I. K. Svetec. Palindromes in DNA—a risk for genome stability and implications in cancer. Int J Mol Sci. 22, 2840 (2021). [↩] [↩] [↩] [↩] [↩] [↩] [↩]
- M. K. Ganapathiraju, S. Subramanian, S. Chaparala, K. B. Karunakaran. A reference catalog of DNA palindromes in the human genome and their variations in 1000 Genomes. Hum Genome Var. 7, 40 (2020). [↩] [↩] [↩] [↩] [↩]
- M. Svetec Miklenić, I. K. Svetec. Palindromes in DNA—a risk for genome stability and implications in cancer. Int J Mol Sci. 22, 2840 (2021). [↩]
- C. Li, L. Chen, G. Pan, W. Zhang, S. C. Li. Deciphering complex breakage-fusion-bridge genome rearrangements with Ambigram. Nat Commun. 14, 5528 (2023). [↩]
- R. Anjana, M. Shankar, M. K. Vaishnavi, K. Sekar. A method to find palindromes in nucleic acid sequences. Bioinformation. 9, 255–258 (2013). [↩] [↩]
- P. Rice, I. Longden, A. Bleasby. EMBOSS: the European molecular biology open software suite. Trends Genet. 16, 276–277 (2000). [↩]
- V. Brázda, J. Kolomazník, J. Lýsek, L. Hároníková, J. Coufal, J. Št’astný. Palindrome analyser: a new web-based server for predicting and evaluating inverted repeats in nucleotide sequences. Biochem Biophys Res Commun. 478, 1739–1745 (2016). [↩]
- R. Durbin, S. R. Eddy, A. Krogh, G. Mitchison. Biological sequence analysis: Probabilistic models of proteins and nucleic acids. Cambridge University Press (1998). [↩]
- S. Marco-Sola, J. C. Moure, M. Moreto, A. Espinosa. Fast gap-affine pairwise alignment using the wavefront algorithm. Bioinformatics. 37, 456–463 (2021). [↩]
- Z. Zhang, S. Schwartz, L. Wagner, W. Miller. A greedy algorithm for aligning DNA sequences. J Comput Biol. 7, 203–214 (2000). [↩] [↩]
- S. J. Hoyt, J. M. Storer, G. A. Hartley, R. M. Berrens, S. E. Bryson, M. J. Blanco, M. M. Ordoñez, R. A. Furey, T. E. Macfarlan. From telomere to telomere: The transcriptional and epigenetic state of human repeat elements. Science. 376, eabk3112 (2022). [↩]
- S. Nurk, S. Koren, A. Rhie, M. Rautiainen, A. Bzikadze, A. Mikheenko, S. Vollger, L. Altemose, et al. The complete sequence of a human genome. Science. 376, 44–53 (2022). [↩]
- V. Raykov, M. E. Marvin, E. J. Louis, L. Maringele. Telomere dysfunction triggers palindrome formation independently of double-strand break repair mechanisms. Genetics. 203, 1659–1668 (2016). [↩]
- L. Maringele, D. Lydall. Telomerase- and recombination-independent immortalization of budding yeast. Genes Dev. 18, 2663–2675 (2004). [↩]
- N. LeBrasseur. Palindromic protection. J Cell Biol. 167, 580 (2004). [↩]
- B. Trombetta, F. Cruciani. Y chromosome palindromes and gene conversion. Hum Genet. 136, 605–619 (2017). [↩] [↩] [↩]
- H. Skaletsky, T. Kuroda-Kawaguchi, P. J. Minx, H. S. Cordum, L. Hillier, L. G. Brown, S. Repping, T. Pyntikova, J. Ali, T. Bieri, A. Chinwalla, R. K. Wilson, D. C. Page. The male-specific region of the human Y chromosome is a mosaic of discrete sequence classes. Nature. 423, 825–837 (2003). [↩] [↩]
- H. Tanaka, D. A. Bergstrom, M. C. Yao, S. J. Tapscott. Widespread and nonrandom distribution of DNA palindromes in cancer cells provides a structural platform for subsequent gene amplification. Nat Genet. 37, 320–327 (2005). [↩]
- R. E. Brown, C. H. Freudenreich. Structure-forming repeats and their impact on genome stability. Curr Opin Genet Dev. 67, 41–51 (2021). [↩]
- A. N. Khristich, S. M. Mirkin. On the wrong DNA track: Molecular mechanisms of repeat-mediated genome instability. J Biol Chem. 295, 4134–4170 (2020). [↩]
- S. Subramanian, S. Chaparala, V. Avali, M. K. Ganapathiraju. A pilot study on the prevalence of DNA palindromes in breast cancer genomes. BMC Med Genomics. 9, 73 (2016). [↩]


