Abstract
Background/Objective: After the phased renovation of the Santiago Bernabeu that began in 2019 the revenue patterns of Real Madrid seem to have changed. This paper looks at whether these changes are a sign of a fundamental shift in the financial model of Real Madrid or whether they can be better explained by other things happening at the same time such as the recovery from the pandemic the success of Real Madrid in the Champions League and the overall growth of commercial activity in elite football. All of the results in this paper are based on observations.
Methods: Seven seasons of data from 2018/19, to 2024/25 were examined. The data came from Real Madrid’s published reports and Deloitte’s Football Money League, which covers the years 2019 to 2026. The analysis focused on three areas: how revenue sources changed over time how Real Madrid compared to six other top-earning clubs and a Combined Performance Score (CPS) that was plotted against annual revenues. The CPS combines La Liga finishing position and a weighted Champions League result. Lower CPS values mean performance. Pearson correlation (r = 0.290) and Spearman correlation (rho = 0.393) were calculated. However, neither result is statistically significant because the sample size is seven years.
Results: Matchday income almost doubled after the renovation going up to 248 million euros in 2023/24 compared to 114 million euros in 2018/19. Commercial income increased by 92% to 594 million euros by 2024/25. Broadcastings part of income dropped from around 44% to 30%. In 2024/25 total income hit a high of 1,185 million euros even though the club came in second in La Liga and left the Champions League at the quarter-final round with a CPS of 3 that matched the lowest, in the data set.
Conclusions: Findings line up well with the growth framework. The data we have shows that the Bernabeu renovation might have helped create a varied revenue model that relies more on the venue and is less affected by how the team performs. However we cannot prove this with data alone. The usual way of breaking down revenue into three parts could be improved by adding a category for venue‑based earnings. All of these points are still uncertain because the sample after the renovation includes two seasons; there is no counterfactual and the methods used cannot firmly link cause and effect.
Keywords: Real Madrid; stadium economics; revenue diversification; football finance; arena-anchored growth; Bernabeu effect
Introduction
In 2025 Deloitte published the newest version of its Football Money League. This is a report that is seen as the best way to measure club money. For the time ever the difference in money between the top club and the second top club was more than 200 million euros. At the top was Real Madrid. They made 1,045 million euros in income during the 2023/24 season. They made 207 million euros more than Manchester City1. The new Santiago Bernabeu was seen by Deloitte as a reason for the money they made. The main question this paper is looking at is not whether the club has become richer (that is clear). The question is whether this growth is part of lasting changes, in how top clubs make money.. If it is just because of short-term things.
Professional football teams generate their incomes through home games, broadcasting agreements, and sponsorships. In the last decades, money generated by broadcasting agreements increased faster than other sources. There was a significant increase in money with each new contract agreement. Now this income is the primary source for most of the top European clubs. Overreliance on this income source can lead to problems since studies have proved that income generated by broadcasting may fluctuate greatly. The income varies depending on the club’s performance in the competition and in games and renewal dates of their broadcasting agreements. One may see the vulnerability of this income stream in the case of the COVID-19 pandemic. Suspension of games put clubs that relied mainly on ticket and broadcasting income in a difficult situation.
As a result of the renovation project that began in the Bernabeu in 2019, the finances of Real Madrid have been evolving in a manner that is not typical under normal circumstances. Revenue for the club grew from 757 million euros in 2018/19 to 1,185 million euros in 2024/25, which constitutes a 57% growth in the course of six seasons2. Even more importantly, the structure has been evolving: broadcasting revenue decreased from around 44% to 30% of overall income; matchday revenue grew twofold compared to its pre-renovation peak; and commercial income increased by 92%. For the season of 2024/25, the highest revenue was generated when the club finished second domestically and failed to make it past the quarter-finals of the Champions League, a feat that, under normal circumstances, would limit revenue growth.
Three research questions are posed by this study. The first asks whether the revenue patterns of Real Madrid following its renovation are observable in comparison to pre-renovation and non-renovated competitors. Second, whether such observable revenue patterns comport with venue-centered economic growth, as predicted by theory in stadium economics literature. Finally, does observed data indicate any correlation between the renovation and revenue buffering from sporting volatility?
Three contributions are made by this paper. A descriptive empirical analysis of the post-renovation revenue structure at Real Madrid is undertaken using seven seasons of data compared to other teams. The application of Barry et al.’s (2022) theory of arena-centered growth to a premier league European football team. Finally, an amendment to the three-pillar revenue model developed by Deloitte.
Several limitations constrain this analysis. The operational period after the renovations consists of only two seasons. There is no counterfactual available, and thus, causation cannot be established on the basis of secondary sources. The descriptive methodology is suitable for pattern recognition but cannot help establish significance or causation.
Literature Review
Football Club Revenue Models
Beginning from the early 1990s, transformations in terms of broadcast rights started to influence club finance3. The formation of the Premier League and the reform of UEFA competitions made media money the major income source, increasing the discrepancies in finances among clubs even more4. Nowadays, television revenues are so high that they represent the biggest revenue component for most of the leading European clubs5. According to Bergantiños and Moreno-Ternero, the joint sale and distribution of broadcasting rights itself represents an economic issue, which implies the unequal distribution depending on the allocation procedure used6. Moreover, Wills, Tacon, and Addesa prove that there is no competitive uncertainty among fans but only the demand for high-quality teams and players which becomes a reason for the inequality in the distribution of broadcast income among a few elite clubs7. The economics behind this dependence is explained by Solberg and Gratton who distinguish two models of broadcasting – free-to-air and pay-television and prove that the move to subscription broadcasting increased the importance of a few elite properties8.
The revenue model used by Deloitte’s Football Money League for its ranking since 1997 (matchday, broadcast, and commercial revenues) was based on the limitations associated with matchday revenues at the time of inception1. As stadiums are now multi-purpose facilities, this classification becomes less applicable to reflect the nature of venue-derived revenues. Holzmayer and Schmidt prove with empirical analysis that diversified business is associated with superior financial performance in the case of Premier League clubs, while unrelated diversification is not9. The authors’ second study demonstrates that this effect is contingent upon dynamic managerial capabilities of club board members10.
The question whether diversified clubs are more resistant to external shocks is explicitly explored by Fuhner, Schmidt, and Schreyer, who show through stock market analysis that diversified clubs were less affected financially by the COVID-19 crisis than non-diversified ones, implying that revenue diversification acts as insurance against external shocks11. This observation helps to understand the revenue stability of Real Madrid during the crisis period in this study.
Financial Risk and Revenue Dependency
The financial instability of football clubs is not a new issue for academic investigation. It was pointed out by Philippou and Maguire that dependency on broadcast revenues makes clubs highly vulnerable12. The fragility mentioned above was shown during the period of the pandemic; specifically, clubs who relied on matchday and TV revenues faced losing both5. Iaia et al. place the fragility under discussion in the broader context of a structural change taking place in professional sports during the 1990s and consisting in shifting the financing base from gate revenues to TV rights4.
Financial instability at the structural level is exacerbated by wages. Peeters and Szymanski proved that increasing players’ remuneration reduces the benefits of revenue increase for top clubs through competition in the labor market13. Fan et al. proved that the same applies to publicly held clubs14. According to Atghia and Nazarian, sustainability in football can only be achieved through structural diversification of income and not mere increases in revenue, which is precisely what this venue-based model entails15. Garcia-del-Barrio and Pujol showed that brand value and media exposure act as independent sources of revenue: clubs with strong media exposure maintain their revenue streams even with poor performance16.
Fan willingness to pay for team merchandise is found to be positively correlated with fan identification with the team and somewhat independent of performance in the short term, yet another way through which extra financial gains can be achieved regardless of poor performance in the season17. Lianopoulos et al. find that social media interaction with football teams is motivated by sports participation and identification with the team and not just current results18.
Stadium Economics and Venue Diversification
Impact literature for sports facilities, on the other hand, has traditionally been sceptical about public spending on such projects. According to Bradbury, Coates, and Humphreys, stadiums financed by public funding fail to deliver the economic returns that their advocates claim they do19. The authors’ extensive literature review in this regard comes to the same conclusion regarding consistent negligible effect of franchises and arenas on local employment, income, and taxes20. However, this paper differs in its focus from the aforementioned research since the issue discussed here is not city-level spill-overs but rather the revenue structure of a particular club in relation to the modernisation of the facility.
In this case, the theoretical framework presented in Barry, Mason, and Trzonkowski’s paper on growth through arenas appears to be the most relevant21. The authors explore the way sports venues serve as anchors for economic development based on the flow of visitors and economic activity that is only partly dependent on the results of games.
Financial Fair Play rules have brought about unforeseen effects on competitive balance in European leagues, favoring clubs that already have commercial clout, and this is one way of understanding Real Madrid’s increasing commercial revenue strength in a structural manner22.
Governance and Regulatory Context
The regulatory environment surrounding the transformation in the finances of Real Madrid is defined by the Financial Fair Play (FFP) regulation from the Union of European Football Associations (UEFA), established in 2010 and amended significantly in 2022. In their assessment of FFP as a governance model, Dunbar and Middleton found that its implementation generally complied with best practices but had shortcomings in the area of enforcement transparency23. Martin-Magdalena et al. systematically reviewed and meta-analyzed 22 relevant studies, finding in 2024 that FFP had exerted a statistically significant positive impact on profitability of clubs (effect size 0.151, p = 0.050) but did not have any effect on solvency of clubs, meaning that while it ensured compliance with the income requirements, FFP had not addressed the structural fragility of football clubs24. Additionally, Garcia-del-Barrio and Rossi showed that FFP had increased competitive imbalance by increasing the benefits for clubs that were more commercially successful, thus having direct implications for Real Madrid’s renovation of the Bernabeu stadium25.
The UEFA European Club Finance and Investment Environment 2024 report indicates that commercial income for the top 20 European football clubs is 1.9 times more than domestic television revenue, representing a change in structure that cannot be captured using the traditional three-source income model26.
Jargon Glossary
In order to be clear about some of the terms employed in this piece, their definitions are provided below. The compound annual growth rate (CAGR) is defined as the rate at which an entity grows annually over a number of years, expressed as (ending value/ beginning value) ^ (1/n) -1. Venue-based revenue is the income made from the actual venue of a stadium through events and services, as opposed to revenues from broadcast and traditional sponsorships. Anchor tenant model is the rationale for the way in which the tenant ensures the continued activity around him/her.
Research Gap
Four main points are deduced from the above-mentioned review. Revenue from broadcast leads the way in terms of financing elite football teams. Such dependence causes serious problems. Modern stadiums might create revenue independent from game outcomes. The regulation framework established by FFP helped to increase commercial strength of elite clubs but did not address the issue of inherent instability of their finances. Something that is currently missing in academic literature is the actual proof backed up by several years of financial data and peer comparison whether renovation of stadiums leads to changes in revenue streams of a club.
The comparison of top European clubs by Chengappa that includes Real Madrid focuses on how the revenue sources, regulations, and ownership structure affect financial sustainability in the developed football leagues, and concludes that the ownership structure is an important moderating factor for financial resilience27. According to Jafari’s comparative study of twelve top clubs, networks of clubs’ ownership outperform individual clubs and multisport ownership structures in terms of revenue scalability and growth but are more exposed to reputational risk, while single clubs maintain strong fan identification with the team28. In contrast to both of these ownership models, Real Madrid belongs neither to them as it is a member-owned (socio) club with no external shareholders; the lack of external shareholders may be one of the reasons why the construction of new facilities was fully financed through debts and not external investments, which becomes an important aspect for the analysis of financing later on.
To date, there are no studies applying the venue-based perspective to Real Madrid’s finances after its renovation or creating systematic comparisons with peers across several seasons1. The paper tries to fill this gap.
Methods
The study utilizes a descriptive comparative method in analyzing secondary financial data. The research design is observational, there is no experiment or quasi-experiment included in the research design. The methodology used is suitable for the objective of identifying revenue composition patterns in a seven-season panel, considering the unavailability of primary or disaggregated data of the club or their business partners.
There are two major sources of data collection. Published annual financial statements (2022-2025) of Real Madrid, which can be accessed from the club’s transparency page, disaggregate revenues into three categories per year2. Football money league by Deloitte (2019-2026) provides revenues and revenue composition for the top twenty football clubs in the world1. In case of slight discrepancies between the two sources of data collection, for example, in 2024/25 where Deloitte’s aggregated figure is slightly different from the club’s publication, the club’s publication will prevail.
This analysis includes seven seasons starting from 2018/19 until 2024/25, organized in three stages: pre-renovation stage (2018/19); disruption and construction stage, including pandemic disturbances (2019/20-2022/23); and post-renovation stage (2023/24-2024/25). In this way, it is possible to establish a longitudinal comparison despite COVID-19 distortions but it is not possible to make a causal conclusion.
There are three analytical approaches used in the research. The first one is connected with the analysis of revenue structure in all seven seasons analyzed in terms of both figures and percentages per each source of revenue. The second one involves a cross-sectional comparison of the revenue structure of Real Madrid in 2023/24 with six competitors among the top seven in the Deloitte 2025 ranking.
The CPS is an aggregation of scores and was developed exclusively for use within this research. It is calculated using the following formula: sum of La Liga finish position (1st = 1, 2nd = 2, etc.) and weighted Champions League performance score, where weights are: Round of 16 elimination or earlier = 0, quarter-finals elimination = 1, semi-finals elimination = 2, runner-up = 3, champion = 5. In order to interpret the scores correctly, they have to be inverted, i.e., smaller CPS values imply better team performance. The CPS is known to be a research-specific tool that had not previously undergone any form of validation within the academic literature. The weights were selected purposefully, and the gap between runner-up (3) and champion (5) scores was selected bigger than others due to greater financial gains and prestige of winning the competition. The season statistics for CPS calculations were cross-referenced with UEFA and Wikipedia sources.
Statistical Analysis
In order to provide further insight, Pearson’s product moment correlation coefficient (r) and Spearman’s rank correlation coefficient (rho) were calculated between total annual revenue and the CPS for the full seven seasons. The above mentioned tests indicate whether there is any linear relationship (or monotonic relationship) between the variables but neither test proves the causation.
Statistical power is severely limited by the sample size. With n = 7 the critical value is t = 2.571 (p < 0.05, df = 5), so only a correlation of approximately r = 0.75 or above could reach conventional significance. Both coefficients are therefore treated as descriptive rather than inferential. The same tests were also run on the pre-renovation sub-sample (df = 3) as a check on the full-sample result.
The direction of the coefficients requires care in interpretation. Because smaller CPS figures represent better performance, a positive coefficient means revenue is greater in the periods when performance is worse, which reverses the relationship conventionally assumed in football economics. The coefficient of determination (r²) is reported alongside the correlations to indicate how much of the variation in revenue the CPS accounts for.
There are three more methodological constraints in addition to those listed above. First, the operational sample after the renovation contains data about only two seasons. Second, the real data published by Real Madrid do not distinguish revenue from events on matchdays from revenue from gates, and thus the paper cannot measure the earnings related to the venue directly, but only check whether the patterns found are consistent with such growth. Third, separating renovation’s effect from other factors’ effects is impossible using secondary analysis.
Results
Revenue Composition Shift (2018/19-2024/25)
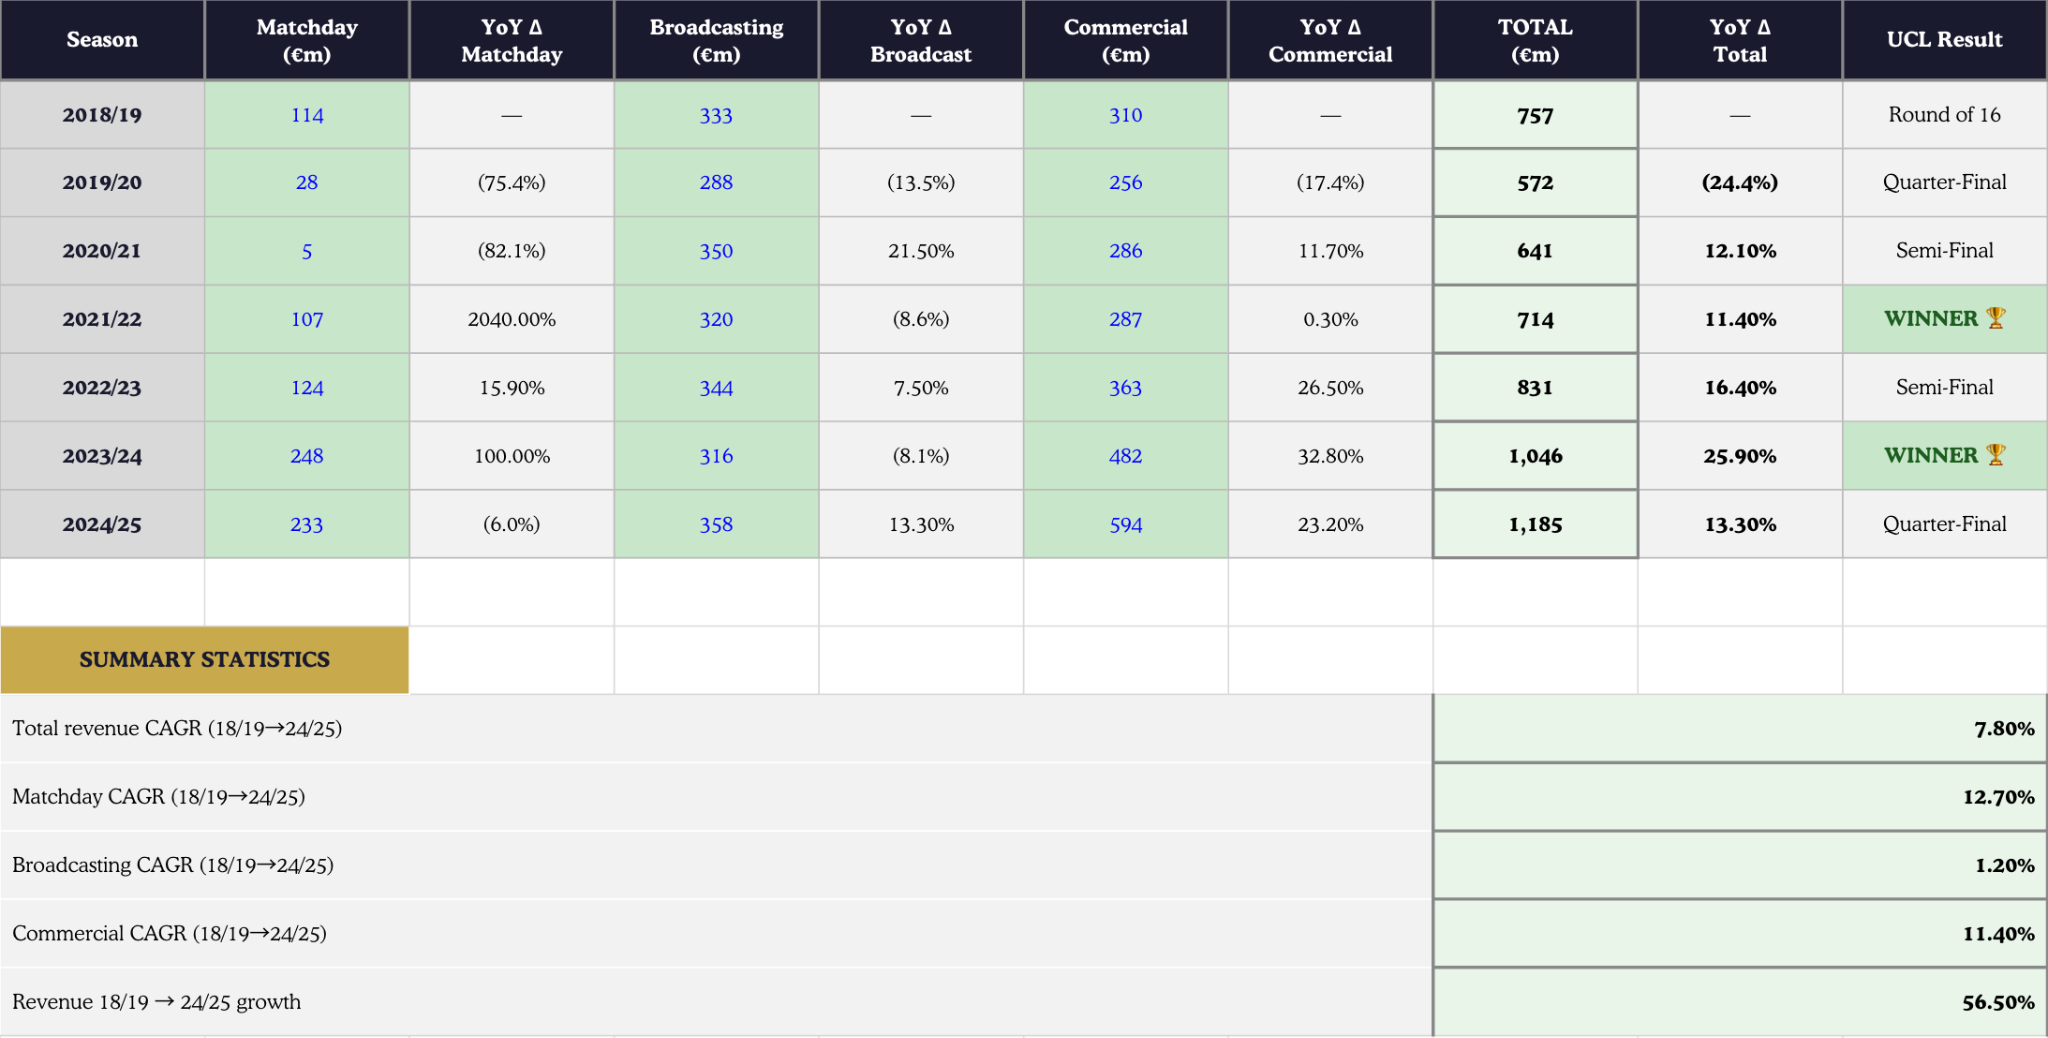
The total revenue of Real Madrid increased from 757 million euros in 2018/19 to 1,185 million euros in 2024/25 with the CAGR of approximately 7.8%2. When the revenue is disaggregated into its three principal components, a notable shift can be observed in the share of each of the revenue sources represented throughout the study period.
The most evident change occurred in the matchday revenue. Matchday income accounted for 114 million euros in 2018/19, or approximately 15% of total revenues2. Pandemic-related restrictions in 2020/21 resulted in this revenue falling to only 5 million euros due to the lack of visitors at the matches instead of any other structural reason. With the renovation of the Bernabeu Stadium becoming completed, the matchday income rebounded to 124 million euros in 2022/23 and jumped to 248 million euros in 2023/24 – the first season after the completion of the renovations. Despite an adverse shift in the level of sporting performance, the matchday income in 2024/25 amounted to 233 million euros.
The pattern for commercial revenue was consistent growth. Starting from the base level of 310 million euros in 2018/19, commercial revenue increased to 363 million euros in 2022/23, then to 482 million euros in 2023/24 and 594 million euros in 2024/25, achieving an aggregate increase of 92%2. It is not clear whether the growth was due to renovations that increased the club’s reputation, market growth in the sponsorship of elite football, or the club’s international commercial partners – all three are plausible explanations that the available data cannot separate.
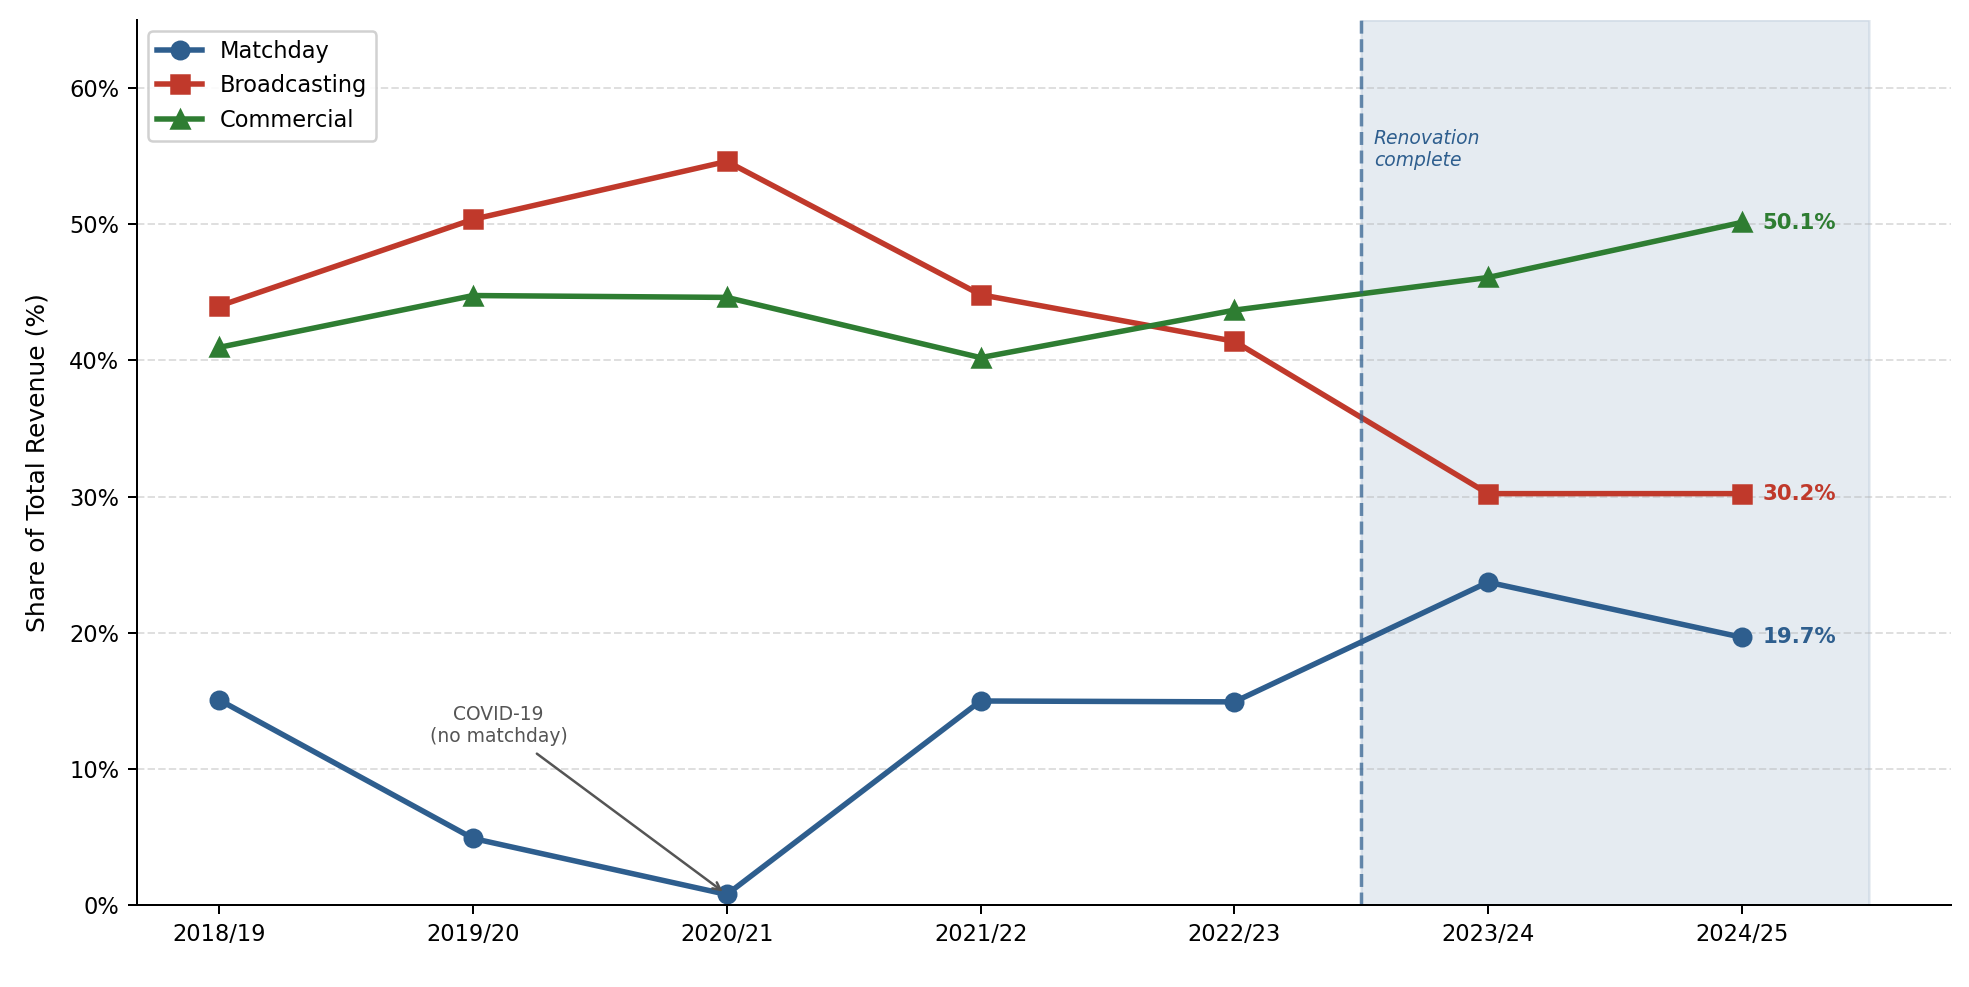
The share of broadcasting revenue in overall revenue dropped from around 44% in 2018/19 to around 30% in 2024/252. The relative decrease in the broadcasting share happened despite Real Madrid being the winner of the UEFA Champions League both in 2021/22 and 2023/24 seasons. Table 1 and Figure 1 show the complete information for seven seasons analyzed.
Peer Comparison (2023/24 Season)
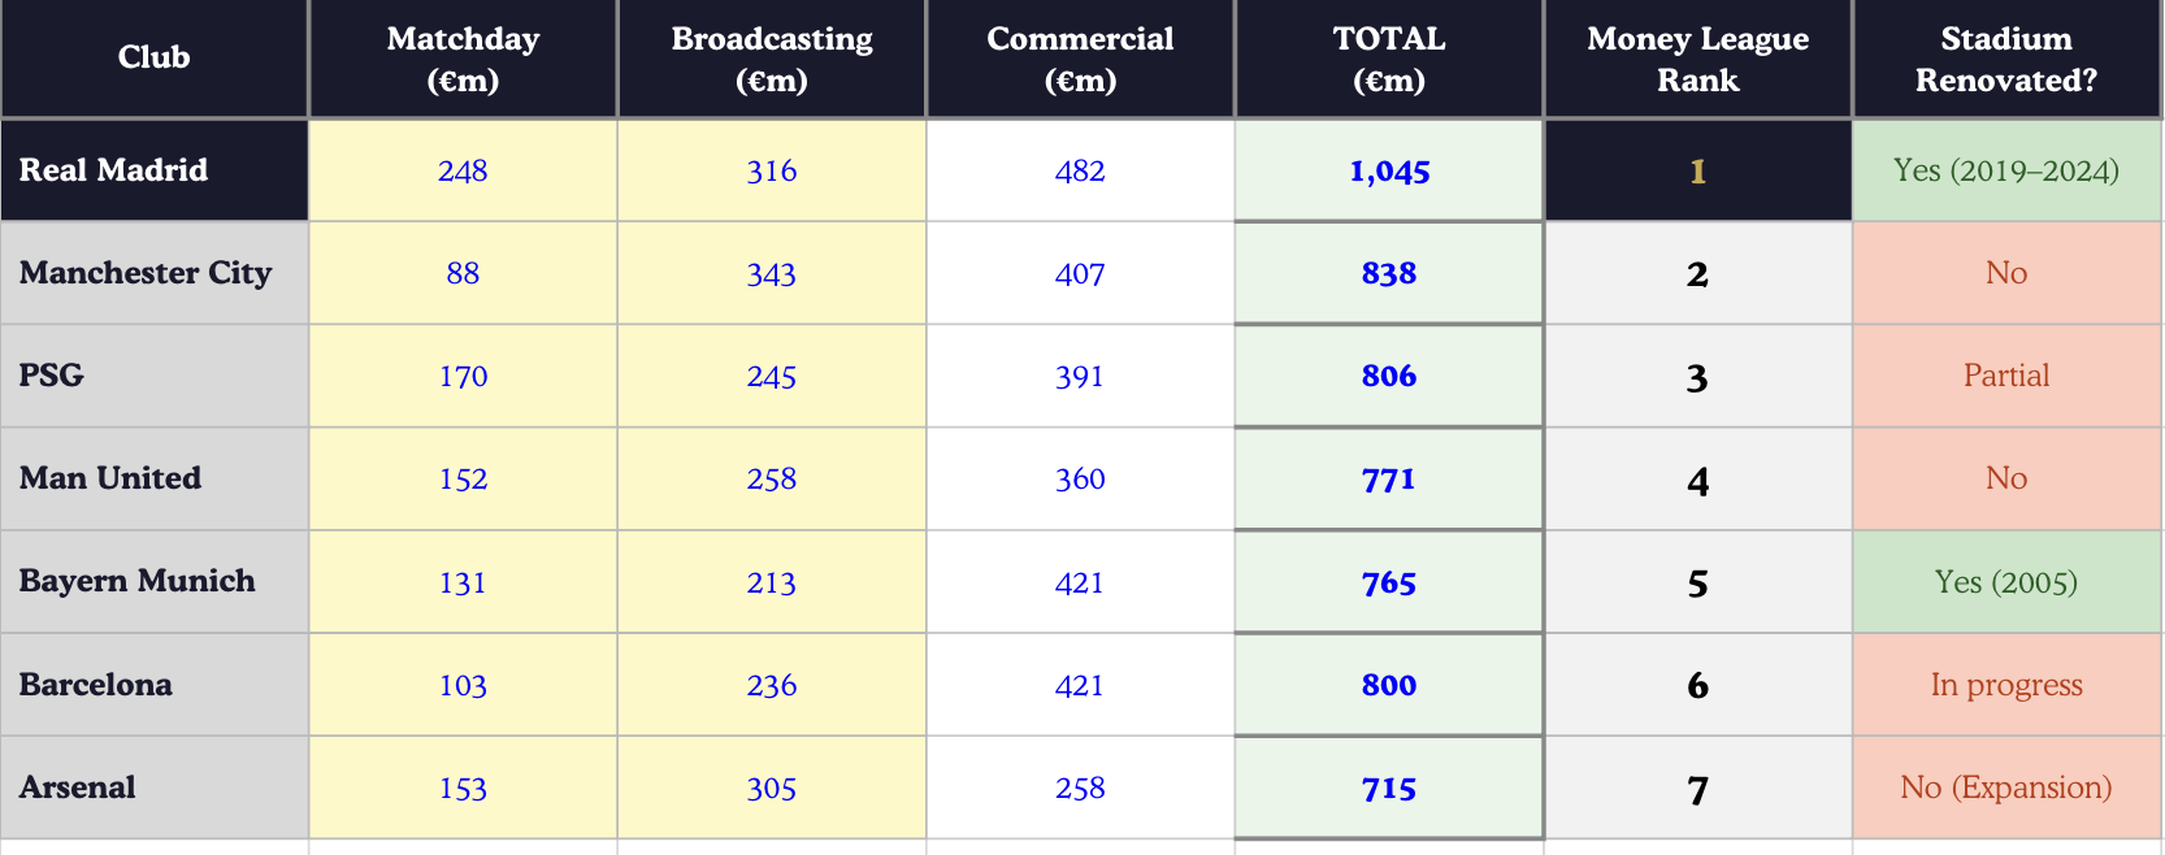
The second table displays the disaggregated cross-sectional figures of the top seven clubs featured in Deloitte Football Money League 2025 for the 2023/24 season1. The sample includes Real Madrid, Manchester City, Arsenal, Paris Saint-Germain, Bayern Munich, Liverpool, and Barcelona.
While Real Madrid earned an astounding 248 million euros in matchday revenue, which was twice as high as Manchester City’s 88 million euros1, the 2023/24 UEFA Champions League runners-up Borussia Dortmund did not manage to earn even a fraction of Real Madrid’s matchday revenue, suggesting that fixture quality does not play a role in such a wide difference. The findings support the conjecture that renovations of the Santiago Bernabeu Stadium made the establishment capable of generating revenues from non-matchdays, although no internal breakdown is available for verification.
Moreover, the share of Real Madrid’s broadcasting revenue (30.2%) is relatively low for the peer group members, lagging behind the shares of Manchester City (40.9%) and Arsenal (42.7%)1. Finally, the stadium of the peer club, Bayern Munich, that has the most similar to Real Madrid modern and multipurpose stadium is also characterized by a low share of broadcasting revenue.
One limitation to the cross-sectional approach used here is the selection of peers based on the top seven clubs generating revenue, which constitutes selection on the dependent variable (revenue); the multi-use venue peer, Tottenham Hotspur, is not part of this list and is thus excluded; a multi-season panel using Tottenham Hotspur as a peer is recommended for further studies.
Performance vs. Revenue (2018/19-2024/25)
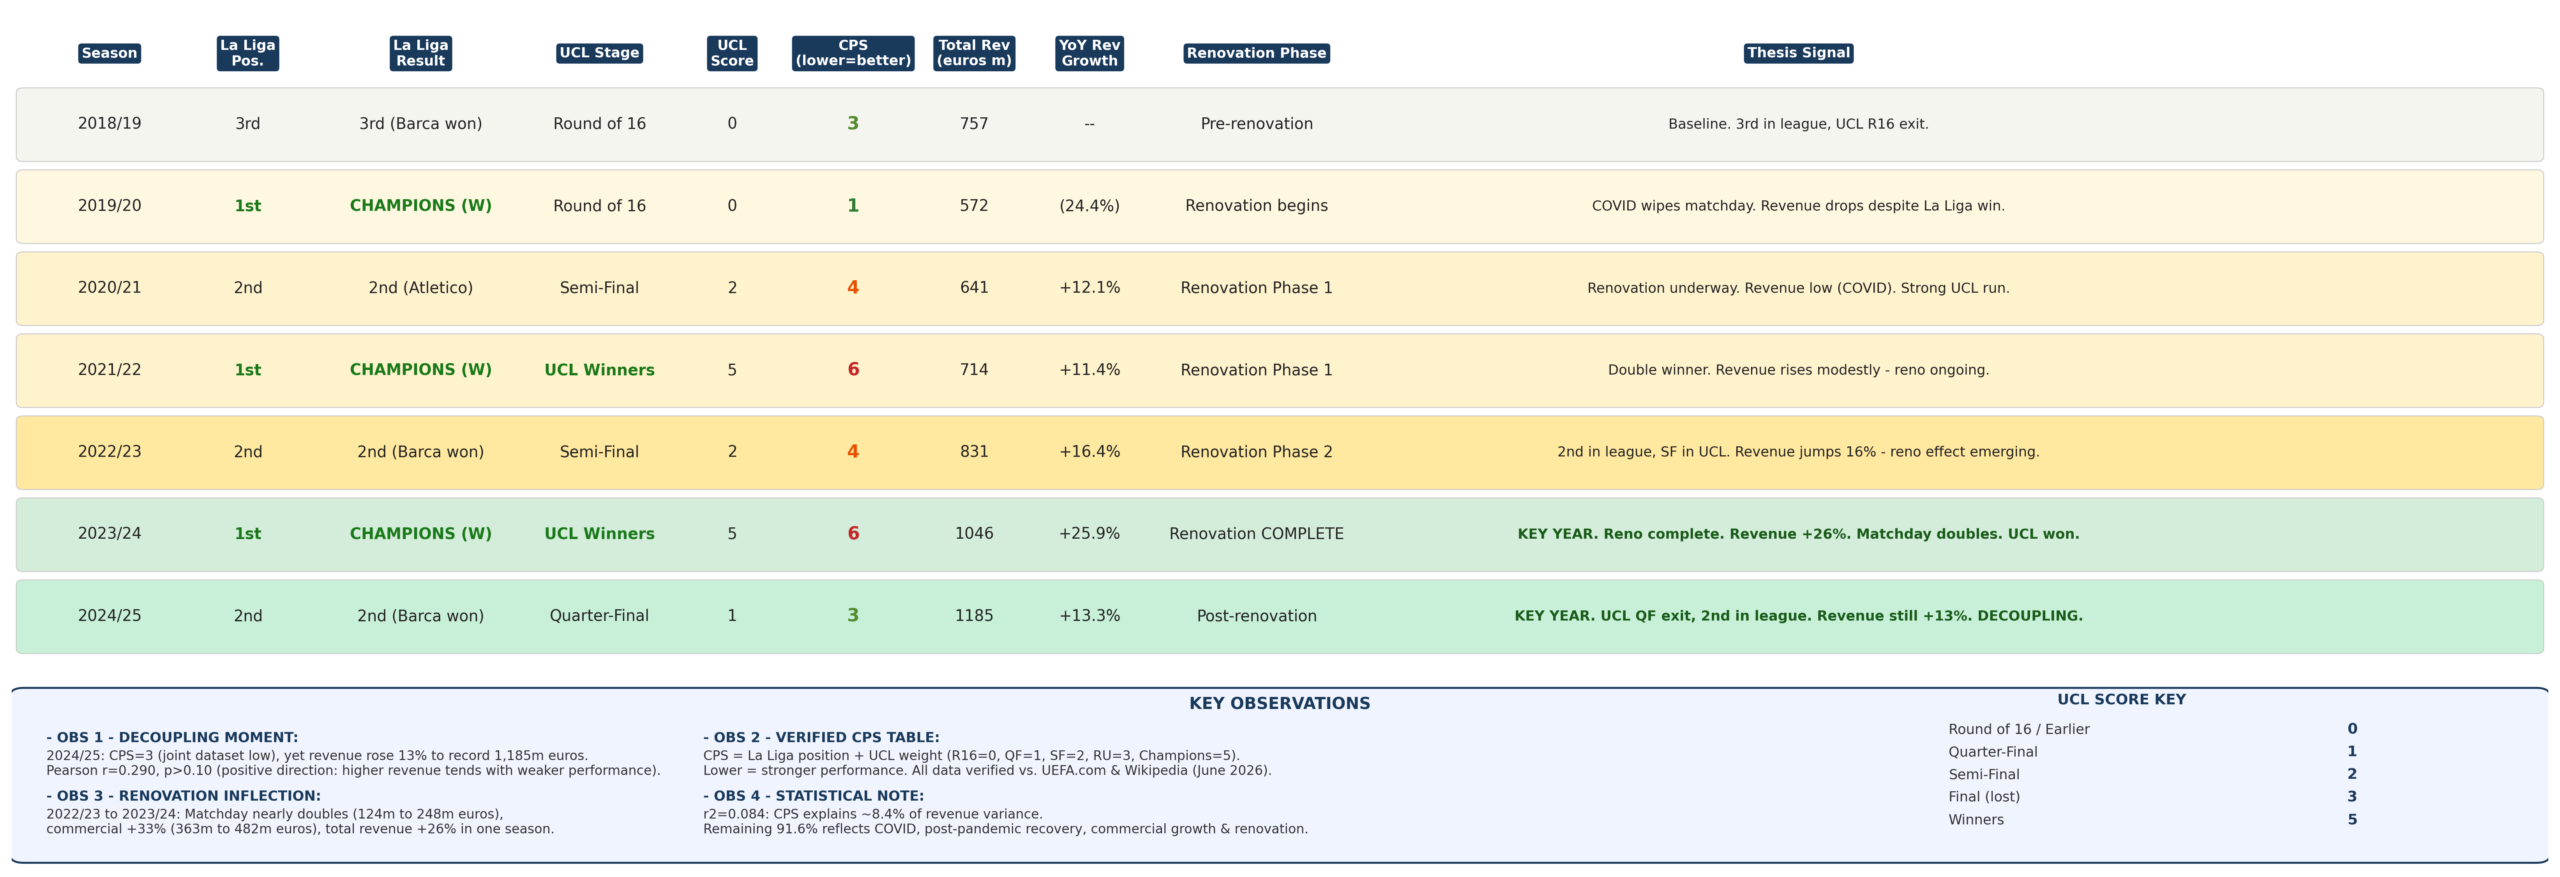
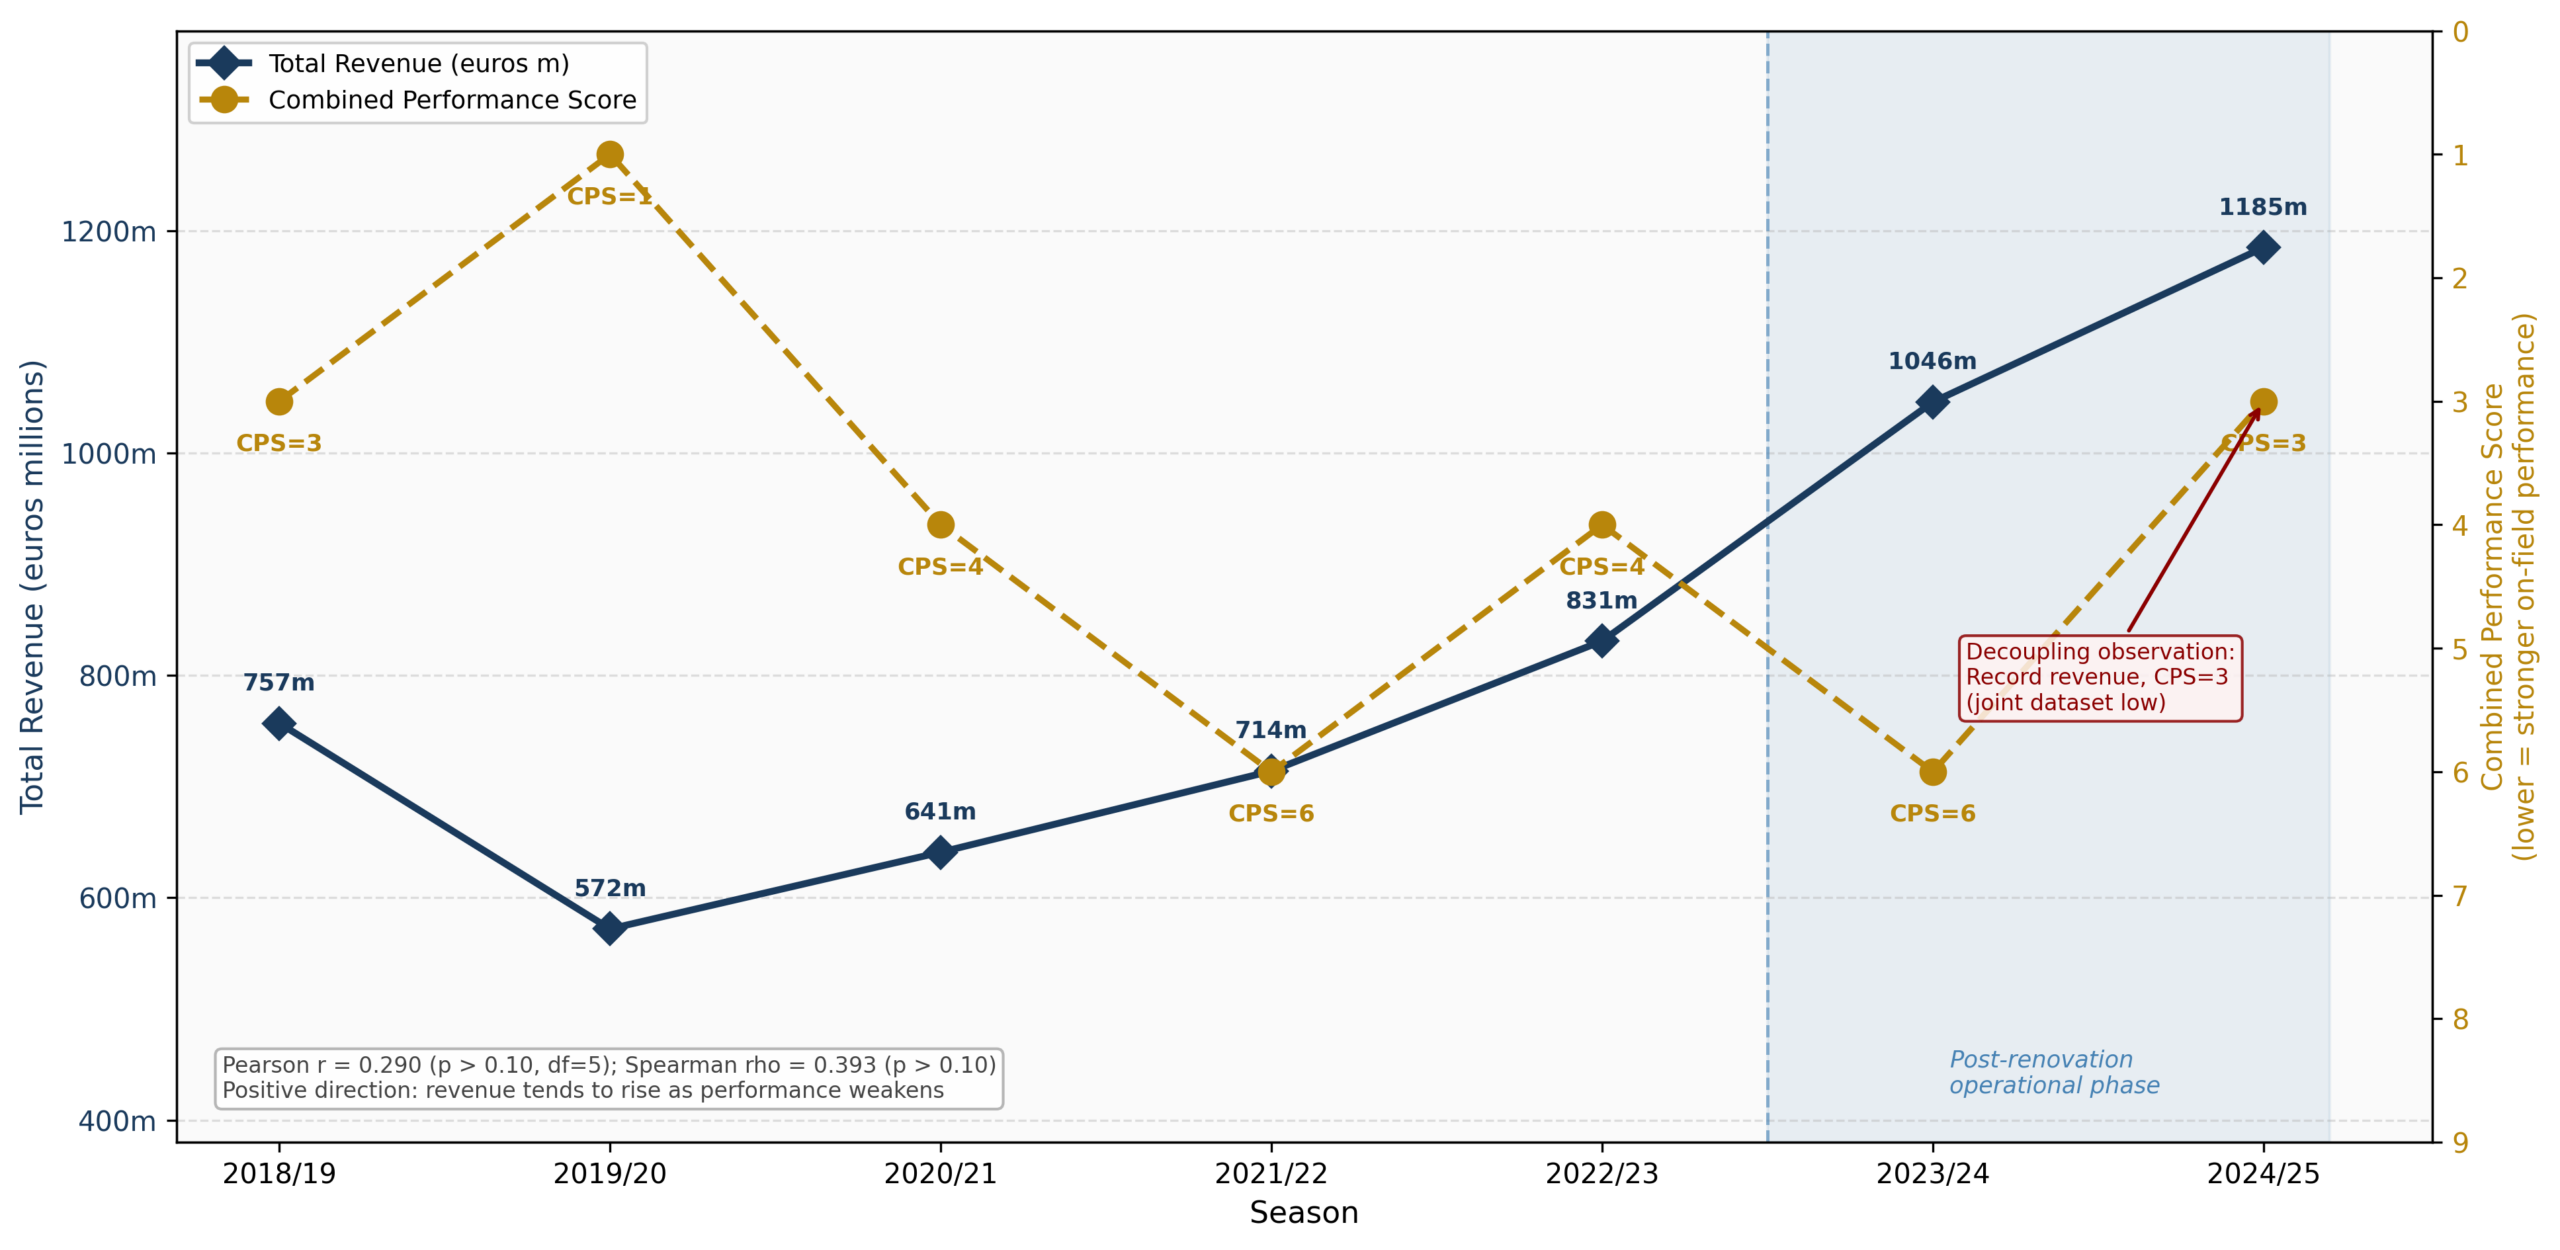
In Table 3 and Figure 2, the season CPS for each year is mapped against annual revenue over the seven-year period. The Pearson correlation coefficient between total revenue and CPS over the seven seasons is r = 0.290 (t = 0.677, df = 5, p > 0.10), while the Spearman rank correlation coefficient is rho = 0.393 (t = 0.955, df = 5, p > 0.10). Neither is statistically significant. The positive sign of both coefficients is worth highlighting: because lower CPS values denote stronger performance, a positive coefficient indicates that revenue was higher in the weaker seasons, reversing the conventional relationship. The coefficient of determination (r² = 0.084) indicates that the CPS accounts for approximately 8.4% of the variation in revenue across the sample. The pre-renovation sub-sample returns a similar positive but equally insignificant result (r = 0.386, df = 3).
One example from the COVID-19 season (2019/20) demonstrates this relationship. Real Madrid were La Liga champions (CPS = 1, highest performance score in the dataset) but earned the lowest revenues at 572 million euros without matchday income. This is not an example of a natural experiment in the econometric sense because there is no comparison group. This was simply a period when, due to the absence of matchday income, the pre-renovation revenue structure became especially clear.
In the 2023/24 season, both La Liga and Champions League success coincided with the full operational completion of the stadium (CPS = 6). The two variables are interlinked since the successful season had maximized broadcasting revenues and played all matches, while the renovation helped increase the number of matchdays. It is impossible to attribute the effect to one of the variables with the available data.
The 2024/25 season provides the most relevant data point. Real Madrid came second in La Liga and was knocked out of Champions League in the quarter-finals (by Arsenal 1-5 on aggregate), achieving CPS equal to 3 and the same as in the 2019/20 data set. Rather than reduced revenue due to lower competitive performance, the overall revenue increased by 13% to a new record of 1,185 million euros2. This observation fits the hypothesis of partial buffering of revenue from sporting achievements. At the same time, other factors like increasing revenues from business in general in football, recovery from the pandemic, and expansion of international cooperation should not be discounted. One data point is not a trend.
Discussion
Evidence for Structural Shift
The most obvious trend that can be discerned from the results is that Real Madrid’s income structure differs from the trend in elite football. Although there is a prevalence for revenue growth generally, what is unique about this trend is that dependence on broadcasting revenues decreased while other sources increased, reversing the industry-wide trend of growing dependence on media rights as noted by Morrow3 and reiterated in UEFA 2024 Club Finance report26.
This trend does not arise due to the fact that there is a decline in broadcasting revenues in absolute terms. Real Madrid’s broadcasting revenues were between 288 million euros and 358 million euros over the entire time period2. What has changed is the share, due to growing commercial and gate receipts. The fact that brand value and media exposure are independent income predictors, as noted by Garcia-del-Barrio and Pujol, explains this partially: Real Madrid’s established brand ensures income regardless of results16.
As shown by Quansah et al., clubs with diversified income sources tend to have higher financial resilience5. Empirical findings of Holzmayer and Schmidt in the context of the English Premier League also prove that business diversification leads to financially successful outcomes9. The split in revenues generated by Real Madrid after renovation in 2024/25 will be about 20% from matchday activities, 30% from broadcasting, and 50% from commercial activities.
The Bernabeu as Anchor Tenant Vehicle
The revenue structure of the Real Madrid shows some similarities to the theoretical foundation of the arena-driven growth model formulated by Barry, Mason, and Trzonkowski21. This framework argues that enhanced sports facilities can be seen as economic centers that provide regular foot traffic and branding effects that support multiple revenue streams regardless of the outcome of matches. Financial results at the Real Madrid observed after the 2019 season can be considered as practical application of the theory to revenue streams of the club, which represents an extension of the framework.
After 2019, enhancements of the stadium made multi-use possible. The retractable field allows the use of the stadium year-round for indoor activities, while the roof installed makes the stadium suitable for music events and NFL games. In 2023 and 2024, music events and an NFL game resulted in revenues, which were included in matchday category but were not related to club events. It is consistent with the logic of anchor tenants: various types of uses of the venue make the revenue streams less dependent on specific types of events.
Importantly, this analysis does not claim broader urban economic benefits from the renovation, a claim the literature does not support for publicly funded stadiums19. The focus here is narrowly on internal revenue architecture: how the club’s own income streams may have been restructured by physical upgrades to the facility it operates.
Emerging Decoupling: Evidence and Limits
The assumption in traditional football economics is that better performance leads to increased income from ticket sales, prize money, and television broadcasts14. The data analysis provides us with a descriptive explanation of this link – the correlation between total income and CPS during seven seasons equals r = 0.290 (p > 0.10), which means a positive correlation, so that the income increases when the team performs poorly, which contradicts the traditional assumption. This coefficient is not significant, which means that with n=7 only the values of r around 0.75 or above would be statistically significant.
Nevertheless, the use of the term “decoupling” assumes that there is no connection left between performance and income at all. However, it is not enough to prove such a statement based on the given evidence because we only know that one poor season failed to reduce revenue. On that evidence, “partial buffering” is the more accurate label.
A further point concerns measurement. While the CPS captures La Liga performance and Champions League outcome, the 2024/25 total income incorporates income from competitions not included in the CPS, such as the Copa del Rey final and the UEFA Super Cup, the FIFA Intercontinental Cup, and the FIFA Club World Cup semi-finals, along with increased sales of the PSL and new commercial deals. The partialness of one measure of performance and the broadness of another can create the impression of divergence that could partly be an artifact of measurement. Future research needs to make their performance measure cover all relevant competitions, or take the specific effects of each competition out of their revenue measure.
The finding of Shtudiner, Tohar, and Kantor that fan’s willingness to pay is partially independent of immediate sport performance17 serves as a behavioral explanation of partial revenue buffering: supporters with high team identification stick to the same purchase behavior even during seasons of poor performance.
Renovation Financing and Financial Risk
The cost of the renovation itself bears directly on the interpretation above. Higher revenue improves financial sustainability only if it is not offset by the debt raised to produce it.
The Bernabeu renovation was financed through three separate loans. The first loan of 575 million euros was taken in April 2019 for 30 years at an interest rate of 2.50%, thus resulting in yearly payments of around 29.5 million euros until 2049. Second loan of 225 million euros with interest rate of 1.53% for 27 years, thus leading to annual repayments of 10.5 million euros, covered costs associated with the moveable pitch system. The third loan of 370 million euros was taken in November 2023 for the purpose of completing acoustics, visualization and commercial systems. Total renovation expenses equaled 1.347 billion euros by June 2025, almost thrice as much as the initially planned 400 million euros in 2018.
However, servicing this debt involves financial risks. Real Madrid utilized the entire loan facility of 1.17 billion euros in the three tranches by November 2023 and, having initially been servicing the interest alone, started to repay the principal in 2023/24 at 15 million euros and 2024/25 at 23 million euros, thus leaving the balance of about 1.132 billion euros as of June 20252. Outside the loan facility from the banks, Real Madrid signed a 20-year partnership agreement with the US private equity firm Sixth Street, which invested 360 million euros in return for 30% of the commercial operations of the Bernabeu stadium, excluding season ticket sales. Legends, which is owned by Sixth Street since 2021, was engaged to run the non-football related business operations of the venue in exchange for revenue shares.
In light of such commitments, the club recorded a total of 1,185 million euros in income for the 2024/25 season, 24 million euros in net profits, and 598 million euros in equity. The club has always made profits in every financial year since 20002. Despite such figures, due to the fact that the debt repayments are expected to span several decades into the future, it is crucial for revenue generation to be sustainable, especially the one which is generated by non-matchday activities that depend on concert licenses and approval from the local authorities. It should be noted that as of mid-2025, the club has not yet resumed holding concerts at the venue due to some noise-related license issues with local authorities. This shows that even the innovative methods of generating revenue through the renovations have their risks of execution.
Implications for Financial Modelling
If the changes made at the Bernabeu stadium prove to be enduring and replicable, there may be a need to revise how club valuation techniques currently work in the footballing world. Traditional methods focus on making assumptions that matchday income depends on the seating capacity of the stadium, commercial income depends on global brand equity, and broadcast income depends on performance which is external to the club. Stadium which allows all year round programming will take away some dependence on the crowd income from the match schedule, which is assumed when doing traditional matchday valuations.
Tottenham Hotspur stadium, having been open since 2019, is the most structurally similar case in Europe and is the most suitable comparator for future multi-season panel studies. Espai Barca at Barcelona, upon completion, will serve as another comparator. In cases where people evaluate a club during renovations, they risk underestimating future profitability of the club due to using matchday valuations based on traditional models.
Overall, the increasing complexity of the revenue stream that is associated with venues calls for an addition of the conceptual fourth type of revenues within the Deloitte classification framework: venue-based revenues, which are revenues generated in proportion to the venue’s operational capacity as opposed to the team’s performance and broadcasting revenues. The figures from UEFA’s 2024 Club Finance prove that revenues generated commercially in top 20 clubs exceed domestic broadcasting distributions 1.9 times26.
Conclusion
This paper sought to ascertain if the post-2019 renovation of Santiago Bernabeu has caused any observable changes in Real Madrid’s revenue structure and whether such observations can be consistent with partial protection of the club’s financial performance from its sporting performance. The analysis of seven financial years, based on both descriptive approach and using the arena-driven growth model framework, provides results which are consistent with both possibilities but considering the limitations in the research methodological context.
Three observations should be highlighted here. Real Madrid had its revenue structure significantly changed from 2018/19 to 2024/25 with broadcasting revenues reduced from around 44% to 30%, match day revenues increased nearly twice and commercial revenues increasing by 92%, an observation which cannot be made at peer organizations which do not have similar renovations. Following the renovation of the arena, Santiago Bernabeu demonstrates operational attributes consistent with the idea of anchor tenant arena with year-round events within hospitality, entertainment and corporate categories. In the 2024/25 season when record revenues were registered, CPS was 3 (same as in the 2019/20 season dataset). This contrasts with the previous period when financial performances were more correlated with sporting performances.
There are important limitations to this analysis. For one, the operational post-renovation data sample consists of only two seasons. There is no counterfactual in place. The CPS is an ad hoc metric and has not been previously validated. The peer comparison does not consider Tottenham, which is the structurally relevant peer club. The Pearson correlation coefficient (r = 0.290, r2 = 0.084) means that the CPS explains approximately 8.4% of the variance in the revenue of the club. The renovation was funded using 1.347 billion euros of debt obligation until 2049 as well as revenue share agreements with Legends that include 30% of non-football events revenues; financial sustainability in the long-run will depend on revenue sources that cannot be tested in two seasons. No regressions, fixed effects, or econometrics analysis is carried out; all of the findings are exploratory in nature.
This has implications for other clubs as well. Other clubs undergoing similar renovations (such as Barcelona’s Espai Barca) might be under-estimated in value by analysts who use conventional matchday models in the period of renovation. In addition, the study shows that three categories revenue structure of football clubs should be supplemented by venue-related categories.
Watching closely from 2025/26 to 2028/29 and looking at data from seasons that include Tottenhams new stadium and Espai Barca once it opens would make our conclusions much stronger. I think if the changes seen at the Bernabeu can be repeated elsewhere they matter more than just one clubs finances; the numbers show a real change, in how one of the world’s biggest sports clubs makes money but it is still unclear whether this change will last throughout the full 25‑year period needed to pay back debt.
Acknowledgments
The author declares no conflicts of interest. No funding was received for this research. The author thanks the faculty of Modern School Barakhamba Road for encouragement in pursuing independent research.
References
- Deloitte. Deloitte football money league 2025. https://www.deloitte.com/uk/en/services/financial-advisory/analysis/deloitte-football-money-league.html, 2025. [↩] [↩] [↩] [↩] [↩] [↩] [↩]
- Real Madrid CF. Annual accounts. https://www.realmadrid.com/en-US/about-real-madrid/the-club/transparency/annual-accounts, 2022-2025. [↩] [↩] [↩] [↩] [↩] [↩] [↩] [↩] [↩] [↩]
- S. Morrow. Football’s ever-changing economics. In The People’s Game?, pg. 1-51, 2023, https://doi.org/10.1007/978-3-031-20932-1_1. [↩] [↩]
- L. Iaia, D. Busso, C. Devalle, F. Re. Globalisation of professional sport finance. Journal of Risk and Financial Management. Vol. 17, 2024, https://doi.org/10.3390/jrfm17050201. [↩] [↩]
- T. Quansah, B. Frick, M. Lang, K. Maguire. The importance of club revenues for player salaries and transfer expenses: how does the coronavirus outbreak (COVID-19) impact the English Premier League? Sustainability. Vol. 13, pg. 5154, 2021, https://doi.org/10.3390/su13095154. [↩] [↩] [↩]
- G. Bergantiños, J. D. Moreno-Ternero. Sharing the revenues from broadcasting sport events. Management Science. Vol. 66, pg. 2417-2431, 2020, https://doi.org/10.1287/mnsc.2019.3313. [↩]
- G. Wills, R. Tacon, F. Addesa. Uncertainty of outcome, team quality or star players? What drives TV audience demand for UEFA Champions League football? European Sport Management Quarterly. Vol. 22, pg. 876-895, 2022, https://doi.org/10.1080/16184742.2020.1836010. [↩]
- H. A. Solberg, C. Gratton. Broadcasting sports events: the economics of free TV and pay TV. In Handbook on the Economics of Sport, Edward Elgar, pg. 1-14, 2014, https://doi.org/10.4337/9781781004067. [↩]
- F. Holzmayer, S. L. Schmidt. Financial performance and corporate diversification strategies in professional football: evidence from the English Premier League. Sport, Business and Management: An International Journal. Vol. 10, pg. 291-315, 2020, https://doi.org/10.1108/SBM-03-2019-0019. [↩] [↩]
- F. Holzmayer, S. L. Schmidt. Dynamic managerial capabilities, firm resources, and related business diversification: evidence from the English Premier League. Journal of Business Research. Vol. 117, pg. 132-143, 2020, https://doi.org/10.1016/j.jbusres.2020.05.044. [↩]
- J. Fuhner, S. L. Schmidt, D. Schreyer. Are diversified football clubs better prepared for a crisis? First empirical evidence from the stock market. European Sport Management Quarterly. Vol. 21, pg. 350-373, 2021, https://doi.org/10.1080/16184742.2020.1862273. [↩]
- C. Philippou, K. Maguire. Assessing the financial sustainability of football. UK Department for Digital, Culture, Media and Sport, https://assets.publishing.service.gov.uk/media/62690039e90e07168e3fdc4a/Assessing_the_financial_sustainability_of_football__web_accessible_.pdf, 2022. [↩]
- T. Peeters, S. Szymanski. Financial fair play and financial crisis in European football. Economic Policy Fifty-eighth Panel Meeting. https://www.economic-policy.org/wp-content/uploads/2013/10/peeters-szymanski.pdf, 2013. [↩]
- M. Fan, X. Chen, B. Liu, F. Zhou, B. Gong, R. Tao. An analysis of financial risk assessment of globally listed football clubs. Heliyon. Vol. 9, pg. e22886, 2023, https://doi.org/10.1016/j.heliyon.2023.e22886. [↩] [↩]
- N. Atghia, A. Nazarian. Economic sustainability: a solution to the financial problems of football clubs. Sport, Business and Management. Vol. 14, 2023, https://doi.org/10.1108/sbm-03-2023-0024. [↩]
- P. Garcia-del-Barrio, F. Pujol. Performance and revenues in European football: clubs’ media visibility and brand value. International Journal of the Economics of Business. Vol. 29, pg. 357-385, 2022, https://doi.org/10.1080/13571516.2022.2095889. [↩] [↩]
- Z. Shtudiner, G. Tohar, J. Kantor. The effect of identification with a sports team and its performance on the willingness of fans to pay for team products. Managerial and Decision Economics. Vol. 43, pg. 607-615, 2022, https://doi.org/10.1002/mde.3405. [↩] [↩]
- Y. Lianopoulos, E. Tzoumaka, D. Stamnas, N. D. Theodorakis. Investigating fans’ social media engagement with their favourite football team: the role of sport involvement, team identification, and subjective perceptions of performance. International Journal of Sports Marketing and Sponsorship. 2025, https://doi.org/10.1177/10616934251383730. [↩]
- J. C. Bradbury, D. Coates, B. R. Humphreys. The economics of stadium subsidies: a policy retrospective. https://papers.ssrn.com/sol3/papers.cfm?abstract_id=4340483, 2023. [↩] [↩]
- J. C. Bradbury, D. Coates, B. R. Humphreys. The impact of professional sports franchises and venues on local economies: a comprehensive survey. Journal of Economic Surveys. Vol. 37, 2022, https://doi.org/10.1111/joes.12533. [↩]
- T. Barry, D. S. Mason, R. Trzonkowski. Arena-anchored urban development projects and the visitor economy. Frontiers in Sports and Active Living. Vol. 4, 2022, https://doi.org/10.3389/fspor.2022.912926. [↩] [↩]
- D. Plumley, R. Wilson, G. Ramchandani. Unintended consequences of financial fair play: an examination of competitive balance across five European football leagues. Sport, Business and Management: An International Journal. Vol. 7, pg. 175-191, 2017, https://doi.org/10.1108/SBM-03-2016-0009. [↩]
- N. Dunbar, T. Middleton. UEFA’s Financial Fair Play regulations: a good example of best practice governance by a sporting body? The International Sports Law Journal. Vol. 22, pg. 34-52, 2022, https://doi.org/10.1007/s40318-021-00207-w. [↩]
- J. Martin-Magdalena, S. De los Rios-Sastre, R. Redondo, D. Alaminos. Effectiveness of UEFA’s regulation for European football financial management: a comprehensive systematic review and meta-analysis. Heliyon. Vol. 10, pg. e39151, 2024, https://doi.org/10.1016/j.heliyon.2024.e39151. [↩]
- P. Garcia-del-Barrio, M. Rossi. How the UEFA Financial Fair Play regulations affect football clubs’ priorities and leagues’ competitive balance. European Journal of Government and Economics. Vol. 9, pg. 119-142, 2020, https://doi.org/10.17979/ejge.2020.9.2.5842. [↩]
- Union of European Football Associations. The European Club Finance and Investment Landscape 2024. UEFA, https://ecfil.uefa.com/2024, 2024. [↩] [↩] [↩]
- I. Chengappa. How different revenue streams, various regulations and practices impact the financial sustainability, growth and health of professional football sports teams in HDCs? https://doi.org/10.58445/rars.3171, 2025. [↩]
- A. Jafari. Strategic and financial dynamics of football ownership models: comparative evidence, gaps, and future directions in European club management. https://doi.org/10.5281/zenodo.17520267, 2025. [↩]