
Abstract
Presidential elections are heavily influenced by a combination of demographic, socioeconomic, and political factors. Recent developments in machine learning provide new opportunities to study whether or not demographic factors can be used to effectively classify individual voting behaviors that go beyond traditional approaches. This study compares Logistic Regression and Neural Network classifiers, using data from the 2020 American National Election Studies (ANES), to classify respondents’ reported 2020 U.S. presidential vote choices. Six demographic characteristics, state of residence, age, education level, race/ethnicity, gender, and family income, were used as predictors, whereas party identification and other political variables were excluded to isolate the predictive power of purely demographic information. Following preprocessing, the data sample consisted of 6,277 respondents who were classified as Biden, Trump, or Third-party/Other voters. Then, models were evaluated using an independent stratified holdout test set, five-fold cross-validation, class-specific performance metrics, and balanced measures of classification performance. The Neural Network achieved the highest overall holdout accuracy of 65.4% and weighted F1-score of 0.641, compared with a 49.1% accuracy and a 0.541 weighted F1-score for the Logistic Regression. However, Logistic Regression was able to achieve a higher balanced accuracy of 47.6% versus 43.5% from the Neural Network, reflecting a more even performance across vote-choice categories. Both models, however, performed significantly worse for the Third-party/Other class, suggesting that nonlinear models can capture predictive patterns in demographic data that are not fully captured by Logistic Regression, while demonstrating the importance of class-sensitive analysis when data are imbalanced.
Introduction
Voting behavior is shaped by a combination of demographic, socioeconomic, and political factors. Early research on American elections has established the importance of party identification and individual characteristics when shaping electoral behavior1. Fiorina later emphasized the role of retrospective evaluations in voting decisions, while Lewis-Beck and Stegmaier examined the relationship between the conditions of the economy and election outcomes2,3. Together, this research demonstrates how vote choice cannot be credited to a singular characteristic but instead reflects multiple influences on individual political behavior.
More recent research has also examined how demographic and social divisions show up in presidential elections. Mason found that the alignment of social and party identities can intensify political polarization4. Research based on the 2016 election further showed that differences in presidential vote choice were associated with factors including racial and gender views and socioeconomic status. For example, Schaffner et al. examined the roles of racial and gender views from the 2016 presidential election, while Mutz investigated the relationship between perceived social status and changes in candidate preference5,6. Cassese and Knuckey further studied the relationship between gender views and individual vote choice7,8. Similarly, research examining social class demonstrated the importance of how socioeconomic divisions are defined when studying presidential elections9,10. This demographic division in vote choice has since been extended specifically to the 2020 election cycle. For instance, Kim and Junn found that treating women voters as a single group obscures significant variation by race/ethnicity, showing that racial resentment and hostile sexism predicted support for Trump differently among Black, Asian American, Latina, and white women11. Related work by Nelson examined how racial resentment and both hostile and modern sexism shaped Democratic voters’ evaluations of candidates ahead of the 2020 election, finding that these attitudes tended to favor a white male candidate over a Black woman candidate12. Other research focused on groups absent from earlier demographic models of vote choice. One study identified the distinct role that racialized attention to the COVID-19 pandemic and Asian American descent played in shaping Asian American turnout and candidate preference in 202013. Additional research has shown that changes in racial attitudes over time are associated with presidential vote switching, suggesting that racial attitudes are constantly changing rather than a fixed demographic trait14. These studies illustrate how demographic patterns in election outcomes often coincide with differences in views and identities, making individual voting behavior fairly difficult to characterize using demographic factors alone.
Machine learning, however, offers another way to study these relationships, which is by focusing on how accurately combinations of characteristics can predict how new data will behave. Unlike more restrictive models, flexible machine learning approaches can represent both nonlinear relationships and interactions between predictors15. Montgomery and Olivella demonstrated the usefulness of machine learning methods for modeling complex relationships in political-science data16. However, too much model flexibility can also increase the risk of overfitting, prompting Neunhoeffer and Sternberg to emphasize the importance of properly including cross-validation when evaluating and selecting predictive models17. All of these considerations are extremely crucial when comparing models with different levels of complexity.
Machine learning methods have also been specifically applied to individual electoral behavior. Hare and Kutsuris, for example, used a supervised machine learning unit to estimate swing-voter tendencies from the 2012, 2016, and 2020 U.S. presidential elections18. Their study demonstrates how machine learning can be utilized to identify patterns in individual voting behaviors rather than just predicting election outcomes. This is important because predicting the winner of a future election is fundamentally different from determining whether or not a model is capable of correctly classifying held-out individuals from observed survey data.
Even more related to the present study, Kim and Zilinsky studied how accurately demographic characteristics could predict presidential vote choice and party identification using U.S. election surveys from 1952 to 202019. From their study, they found that demographic factors such as age, gender, race, education, and income all contained predictive information but were limited in their ability to separate individual voters. Furthermore, their analysis demonstrated how incorporating additional political information, specifically party identification, significantly increased the predictability of presidential vote choice19. This finding highlights an important difference between predicting voting behavior using political attitudes and determining how much predictive power demographic characteristics alone have.
The performance of demographic classification models must also be interpreted with the distribution of electoral outcomes in mind. U.S. presidential votes are heavily concentrated among two major parties, leaving substantially fewer observations for third-party or other parties. With that being said, the overall accuracy can overshadow the poor performance on a smaller party. Hence, a model that performs well on larger categories may achieve a relatively high overall accuracy despite rarely identifying members of a smaller category. Similarly, previous research on imbalanced classification emphasized that reliance on overall accuracy can provide a biased judgement of model performance when class distributions are unequal20. Therefore, examining balanced accuracy, class-specific precision and recall, and F1-scores in addition to overall accuracy provides a more complete evaluation of performance.
The choice between Logistic Regression and a Neural Network is one way to examine whether nonlinear predictive structure exists within demographic information. Logistic Regression determines outcome probabilities through linear combinations of predictors, whereas Neural Networks can represent more complex nonlinear relationships and interactions15. Therefore, a Neural Network may capture patterns among demographic characteristics that are not fully captured by a linear model. Greater complexity, however, does not always guarantee better performance outside of the sample data, making preprocessing, model selection, and validation necessary for a meaningful comparison17.
The present study examines this question using data from the 2020 American National Election Studies (ANES)21. Rather than predicting a future election, this study focuses on retrospectively classifying respondents’ reported vote choice during the 2020 election cycle. Six demographic and socioeconomic characteristics, such as state of residence, age, education level, race and ethnicity, gender, and family income, are used to distinguish among respondents who reported voting for Biden, Trump, or a Third-party/Other candidate. Party identification, ideology, and other clear political attitudes are intentionally left out so that the analysis assesses the predictive information contained in demographic characteristics alone. Logistic Regression and a Neural Network are compared using consistent preprocessing, training, validation, and evaluation procedures. By examining both overall and class-sensitive performance, this study evaluates whether the greater flexibility of a Neural Network captures predictive power in demographic characteristics that is not represented by Logistic Regression.
Methodology
Data Source
This study uses data from the 2020 American National Election Studies (ANES) Time Series Study21, a national election survey designed to study political attitudes, voting behavior, and demographic characteristics in the United States. Conducted during the 2020 presidential election cycle, the ANES provides a publicly available dataset for political behavior research containing demographic, socioeconomic, and electoral variables.
The complete ANES Time Series Study includes both pre-election and post-election interviews, but because the objective of this study was to classify respondents’ reported vote choice in the 2020 U.S. presidential election, respondents with valid responses to the presidential vote-choice variable were the ones included in the analysis. Observations containing missing, refused, or invalid responses for the outcome variable were excluded. After this process, the final sample consisted of 6,277 respondents.
The ANES sample provides substantial demographic and geographic variation, allowing the models to examine predictive relationships between respondent characteristics and reported presidential vote choice.
Outcome Variable
The dependent variable in this study was respondents’ reported vote choice in the 2020 U.S. presidential election, represented by ANES variable V202110x. The variable summarizes respondents’ reported presidential vote choice and was used to construct the multiclass classification outcome.
To simplify multiclass classification while maintaining sufficient observations within each category, vote choices were grouped into three exclusive classes: Biden, Trump, and Third-party/Other.
The Third-party/Other category included respondents who reported voting for Jo Jorgensen, Howie Hawkins, or any other presidential candidate. Combining these candidates into a single category increased the number of observations available for model training while still preserving the distinction between the major parties and the non-major parties.
Predictor Variables
Six demographic variables were selected as predictors: state of residence, age, education level, race and ethnicity, gender, and family income.
These variables were selected to examine whether demographic and socioeconomic characteristics alone had enough information to classify reported presidential vote choice. An important feature of the analysis was the intentional exclusion of party identification and other explicitly political attitudes from the predictor variables. These variables were left out because the objective of the present study was to evaluate classification using demographic characteristics alone. The present analysis therefore provides a restricted test of classification based on demographic characteristics rather than an attempt to maximize predictive accuracy using all the information available in ANES.
Data Preprocessing
Prior to model development, the dataset underwent several preprocessing steps to prepare the data for supervised machine learning. The ANES dataset uses negative numeric codes to represent missing responses, refusals, and “Don’t Know” responses. These values were, therefore, converted to missing values before model training.
Categorical variables, including state, education level, race and ethnicity, gender, and family income, were assigned using the most frequently observed category. After, these variables were transformed using one-hot encoding, allowing each categorical level to be represented as a binary feature that is more suitable for machine learning algorithms.
However, age was treated as a continuous numerical variable. Missing age values were assigned using the median value that was calculated from the training data. Then, the variable was standardized using StandardScaler, producing a mean of zero and unit variance. Standardization improves numerical stability during optimization, especially for neural networks, while still allowing coefficients within Logistic Regression to be estimated with efficiency.
All preprocessing operations were carried out within a unified machine learning process. Consequently, preprocessing factors, like imputation values, scaling factors, and one-hot encoding mappings, were estimated from the training dataset and applied to the testing dataset. Performing preprocessing within the model prevents information from the testing data from influencing model development and minimizes data leakage.
Model Development
Two supervised machine learning algorithms were utilized to compare linear and nonlinear approaches to multiclass classification.
Logistic Regression: Logistic Regression served as the baseline classification model due to its common use in political science and its high degree of understandability. Logistic Regression estimates the probability that an observation belongs to each outcome category using linear combinations of the predictor variables. Although the model assumes linear relationships between predictors and the outcome, it provides an appropriate standard when compared against more flexible machine learning methods. The Logistic Regression classifier was implemented using the scikit-learn library with a maximum of 3,000 iterations. To account for differences in class frequency, inverse-frequency class weighting (class_weight = “balanced”) was used during model training, assigning greater weight to observations from less frequent outcome categories.
Training and Validation
The dataset was randomly divided into training (80%) and testing (20%) using stratified sampling. Stratification was able to preserve the relative frequency of each vote-choice category in both divisions, making sure that the testing dataset accurately reflected the class distribution of the original sample. A fixed random seed (random_state = 42) was also used throughout to ensure reproducibility.
Hyperparameter optimization for the Neural Network was exclusively performed on the training dataset using five-fold stratified cross-validation, and during each fold, the training data were split into separate training and validation sets while preserving class proportions. The testing dataset remained isolated throughout the model development and used only for the final model evaluation and post hoc performance analyses. Maintaining an independent testing dataset reduces bias in performance and provides a more reliable test of how each classifier generalizes to new data17.
In addition to the training-only cross-validation used for the Neural Network model, both final classifiers were evaluated using five-fold stratified cross-validation across the full sample to assess the stability of model performance across alternative data divisions.
Performance Evaluation
Model performance was evaluated using several metrics to provide a comprehensive test of classification performance. The overall predictive accuracy measured the proportion of correctly classified observations across all vote-choice categories, but because the dataset contained significantly less Third-party/Other voters than Biden or Trump voters, balanced accuracy was also reported to evaluate model performance across classes while reducing the influence of class imbalance. Reporting multiple performance measures is essential for imbalanced classification problems, which overall accuracy alone may provide an incomplete representation of20.
Additional metrics included macro-averaged precision, macro-averaged recall, macro-averaged F1-score, and weighted F1-score. Macro-averaged metrics assign equal weight to each class regardless of sample size, while weighted F1-score accounts for the observed class distribution.
Confusion matrices were also generated for both classifiers to examine patterns of correct classifications and classification errors across individual vote-choice categories. To calculate uncertainty in model performance, 95% bootstrap confidence intervals for the overall classification accuracy were estimated using 2,000 bootstrap resamples of the testing dataset. Furthermore, the predictive performance of Logistic Regression and the Neural Network was compared using an exact McNemar test, which evaluates whether differences in paired classification outcomes between two classifiers are significant when evaluated on the same testing observations.
Finally, permutation feature importance was calculated for each model. This technique estimates the relative importance of each predictor by measuring the decrease in model performance after randomly permuting the values of an individual feature while leaving all other variables unchanged. Variables producing larger decreases in predictive performance were interpreted as contributing more to the classification task.
Software Environment
All analyses were conducted using Python. Data manipulation was performed using pandas and NumPy, while preprocessing, Logistic Regression, the Neural Network classifier (MLPClassifier), cross-validation, and evaluation metrics were implemented using scikit-learn22. Graphical outputs, including confusion matrices and feature-importance visualizations, were generated using Matplotlib, and a fixed random seed (random_state = 42) was applied throughout model development to support reproducibility.
Results
Descriptive Statistics
Following preprocessing and the removal of respondents with missing or invalid responses for the outcome variable, the final analytic sample consisted of 6,277 respondents. Among these respondents, 3,537 (56.35%) reported voting for Joseph R. Biden Jr., 2,582 (41.13%) reported voting for Donald J. Trump, and 158 (2.52%) reported voting for a third-party or other presidential candidate.
To preserve the distribution of vote-choice categories during model development, the dataset was divided using an 80:20 train-test split. The training dataset contained 2,829 Biden voters, 2,065 Trump voters, and 127 Third-party/Other voters, while the independent testing dataset contained 708 Biden voters, 517 Trump voters, and 31 Third-party/Other voters. The relatively small proportion of Third-party/Other voters indicates a substantial class imbalance within the dataset. Consequently, balanced accuracy and macro-averaged evaluation metrics were reported alongside the overall accuracy to provide a more complete assessment of classifier performance.
Classification Performance
The performance of the Logistic Regression classifier and Neural Network classifier was evaluated on the independent testing dataset and compared with two baseline classifiers: a majority-class baseline and a random baseline. Performance was assessed using an overall accuracy, balanced accuracy, macro-averaged precision, macro-averaged recall, macro-averaged F1-score, and weighted F1-score.
| Model | Accuracy | Balanced Accuracy | Macro Precision | Macro Recall | Macro F1 | Weighted F1 |
| Majority Baseline | 56.4% | 33.3% | 0.188 | 0.333 | 0.240 | 0.406 |
| Stratified Random Baseline | 49.0% | 32.9% | 0.328 | 0.329 | 0.329 | 0.491 |
| Logistic Regression | 49.1% | 47.6% | 0.441 | 0.476 | 0.396 | 0.541 |
| Neural Network | 65.4% | 43.5% | 0.430 | 0.435 | 0.431 | 0.641 |
Among all the evaluated models, the Neural Network achieved the highest overall classification accuracy of 65.4%, significantly outperforming both the Logistic Regression classifier, which had a 49.1% accuracy, and the baseline models. The Neural Network also achieved the highest weighted F1-score of 0.641, indicating a superior overall performance across the observed class distribution. In contrast, the Logistic Regression classifier produced the highest balanced accuracy of 47.6%, macro precision of 0.441, and macro recall of 0.476, suggesting a more constant performance across the three vote-choice categories despite a lower overall accuracy.
Additionally, bootstrap analysis estimated a 95% confidence interval of 62.7%–67.9% for the Neural Network’s overall accuracy and 46.3%–51.8% for Logistic Regression.
Cross-Validation Results
| Model | Mean (SD), Accuracy | Mean (SD), Balanced Accuracy | Macro F1, Mean (SD) | Weighted F1, Mean (SD) |
| Logistic Regression | 0.498 (0.013) | 0.472 (0.021) | 0.399 (0.008) | 0.546 (0.014) |
| Neural Network | 0.649 (0.010) | 0.438 (0.008) | 0.433 (0.007) | 0.641 (0.010) |
The cross-validation results matched closely to the performance observed on the independent testing dataset, indicating that both of the classifiers demonstrated a consistent performance across multiple training and validation divisions. The Neural Network consistently achieved a higher overall accuracy than Logistic Regression did, while Logistic Regression maintained a slightly higher balanced accuracy.
Class-Level Performance
Classification reports and confusion matrices were also examined to evaluate model performance for each vote-choice category.
| Model | Vote Choice | Precision | Recall | F1-Score | Support |
| Logistic Regression | Biden | 0.712 | 0.434 | 0.539 | 708 |
| Trump | 0.567 | 0.574 | 0.571 | 517 | |
| Third-Party/Other | 0.043 | 0.419 | 0.078 | 31 | |
| Neural Network | Biden | 0.678 | 0.766 | 0.719 | 708 |
| Trump | 0.612 | 0.540 | 0.573 | 517 | |
| Third-Party/Other | 0.000 | 0.000 | 0.000 | 31 |
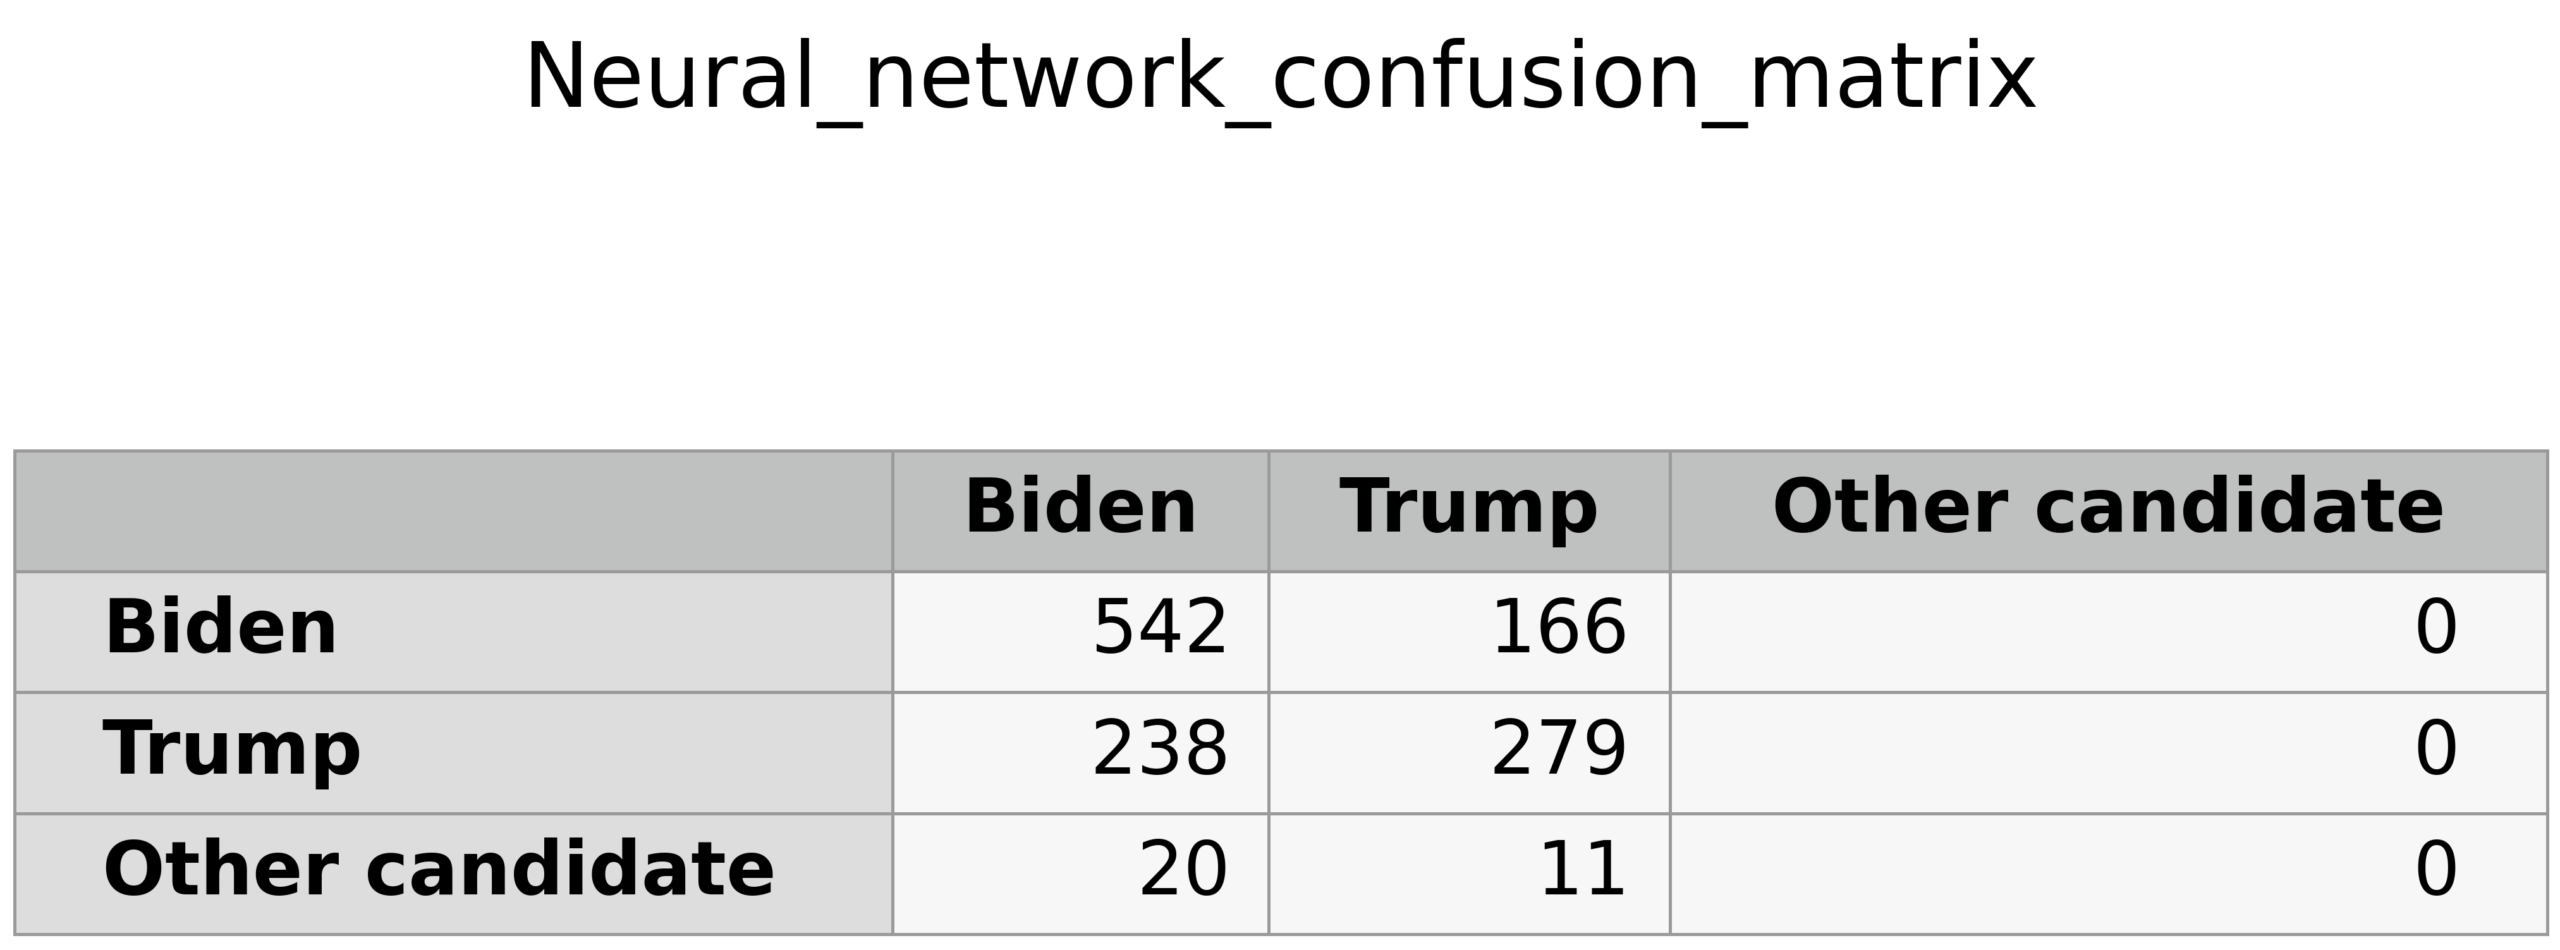
For the Neural Network, the precision, recall, and F1-score for the Biden class were 0.678, 0.766, and 0.719, respectively, and for the Trump class, the precision, recall, and F1-score were 0.612, 0.540, and 0.573. The classifier did not, however, correctly identify any Third-party/Other observations, resulting in the precision, recall, and F1-score values of 0.000 for that class.
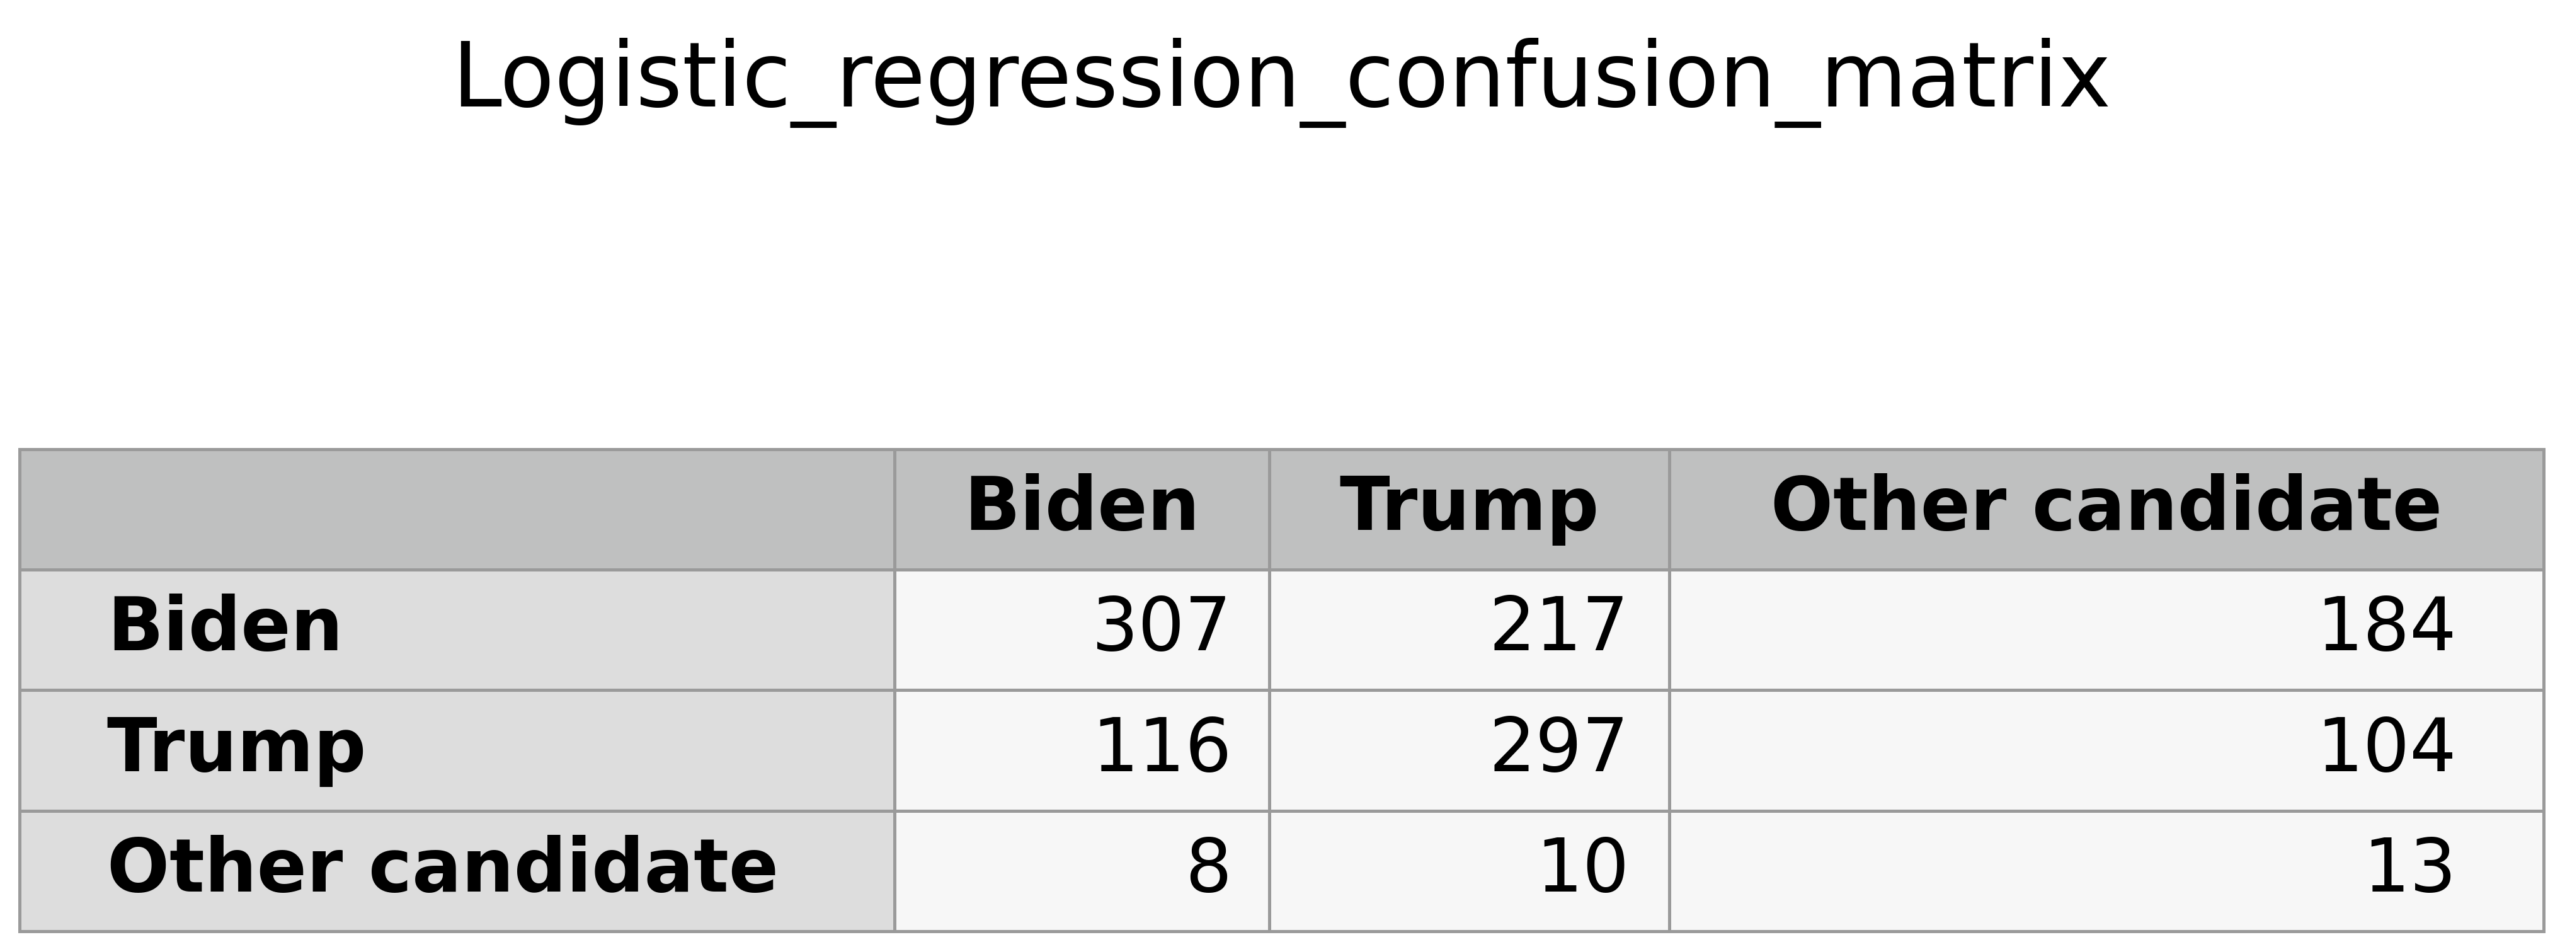
The Logistic Regression classifier produced a lower performance for the Biden class (precision = 0.712, recall = 0.434, F1 = 0.539) and a comparable performance for the Trump class (precision = 0.567, recall = 0.574, F1 = 0.571). Unlike the Neural Network, Logistic Regression correctly identified 13 of the 31 Third-party/Other observations, corresponding to a recall of 41.9%, although precision for this class remained low (4.3%).
The confusion matrices demonstrated how both classifiers performed substantially better for respondents who voted for the two major-party candidates than for respondents who selected a Third-party/Other candidate. The Neural Network correctly classified 542 Biden voters and 279 Trump voters, whereas Logistic Regression correctly classified 307 Biden voters, 297 Trump voters, and 13 Third-party/Other voters.
Feature Importance
Permutation feature importance was calculated to estimate the relative contribution of each demographic characteristic to model performance.
For the Logistic Regression classifier, age produced the largest decrease in predictive performance when permuted, followed by race/ethnicity, family income, education level, gender, and state of residence.
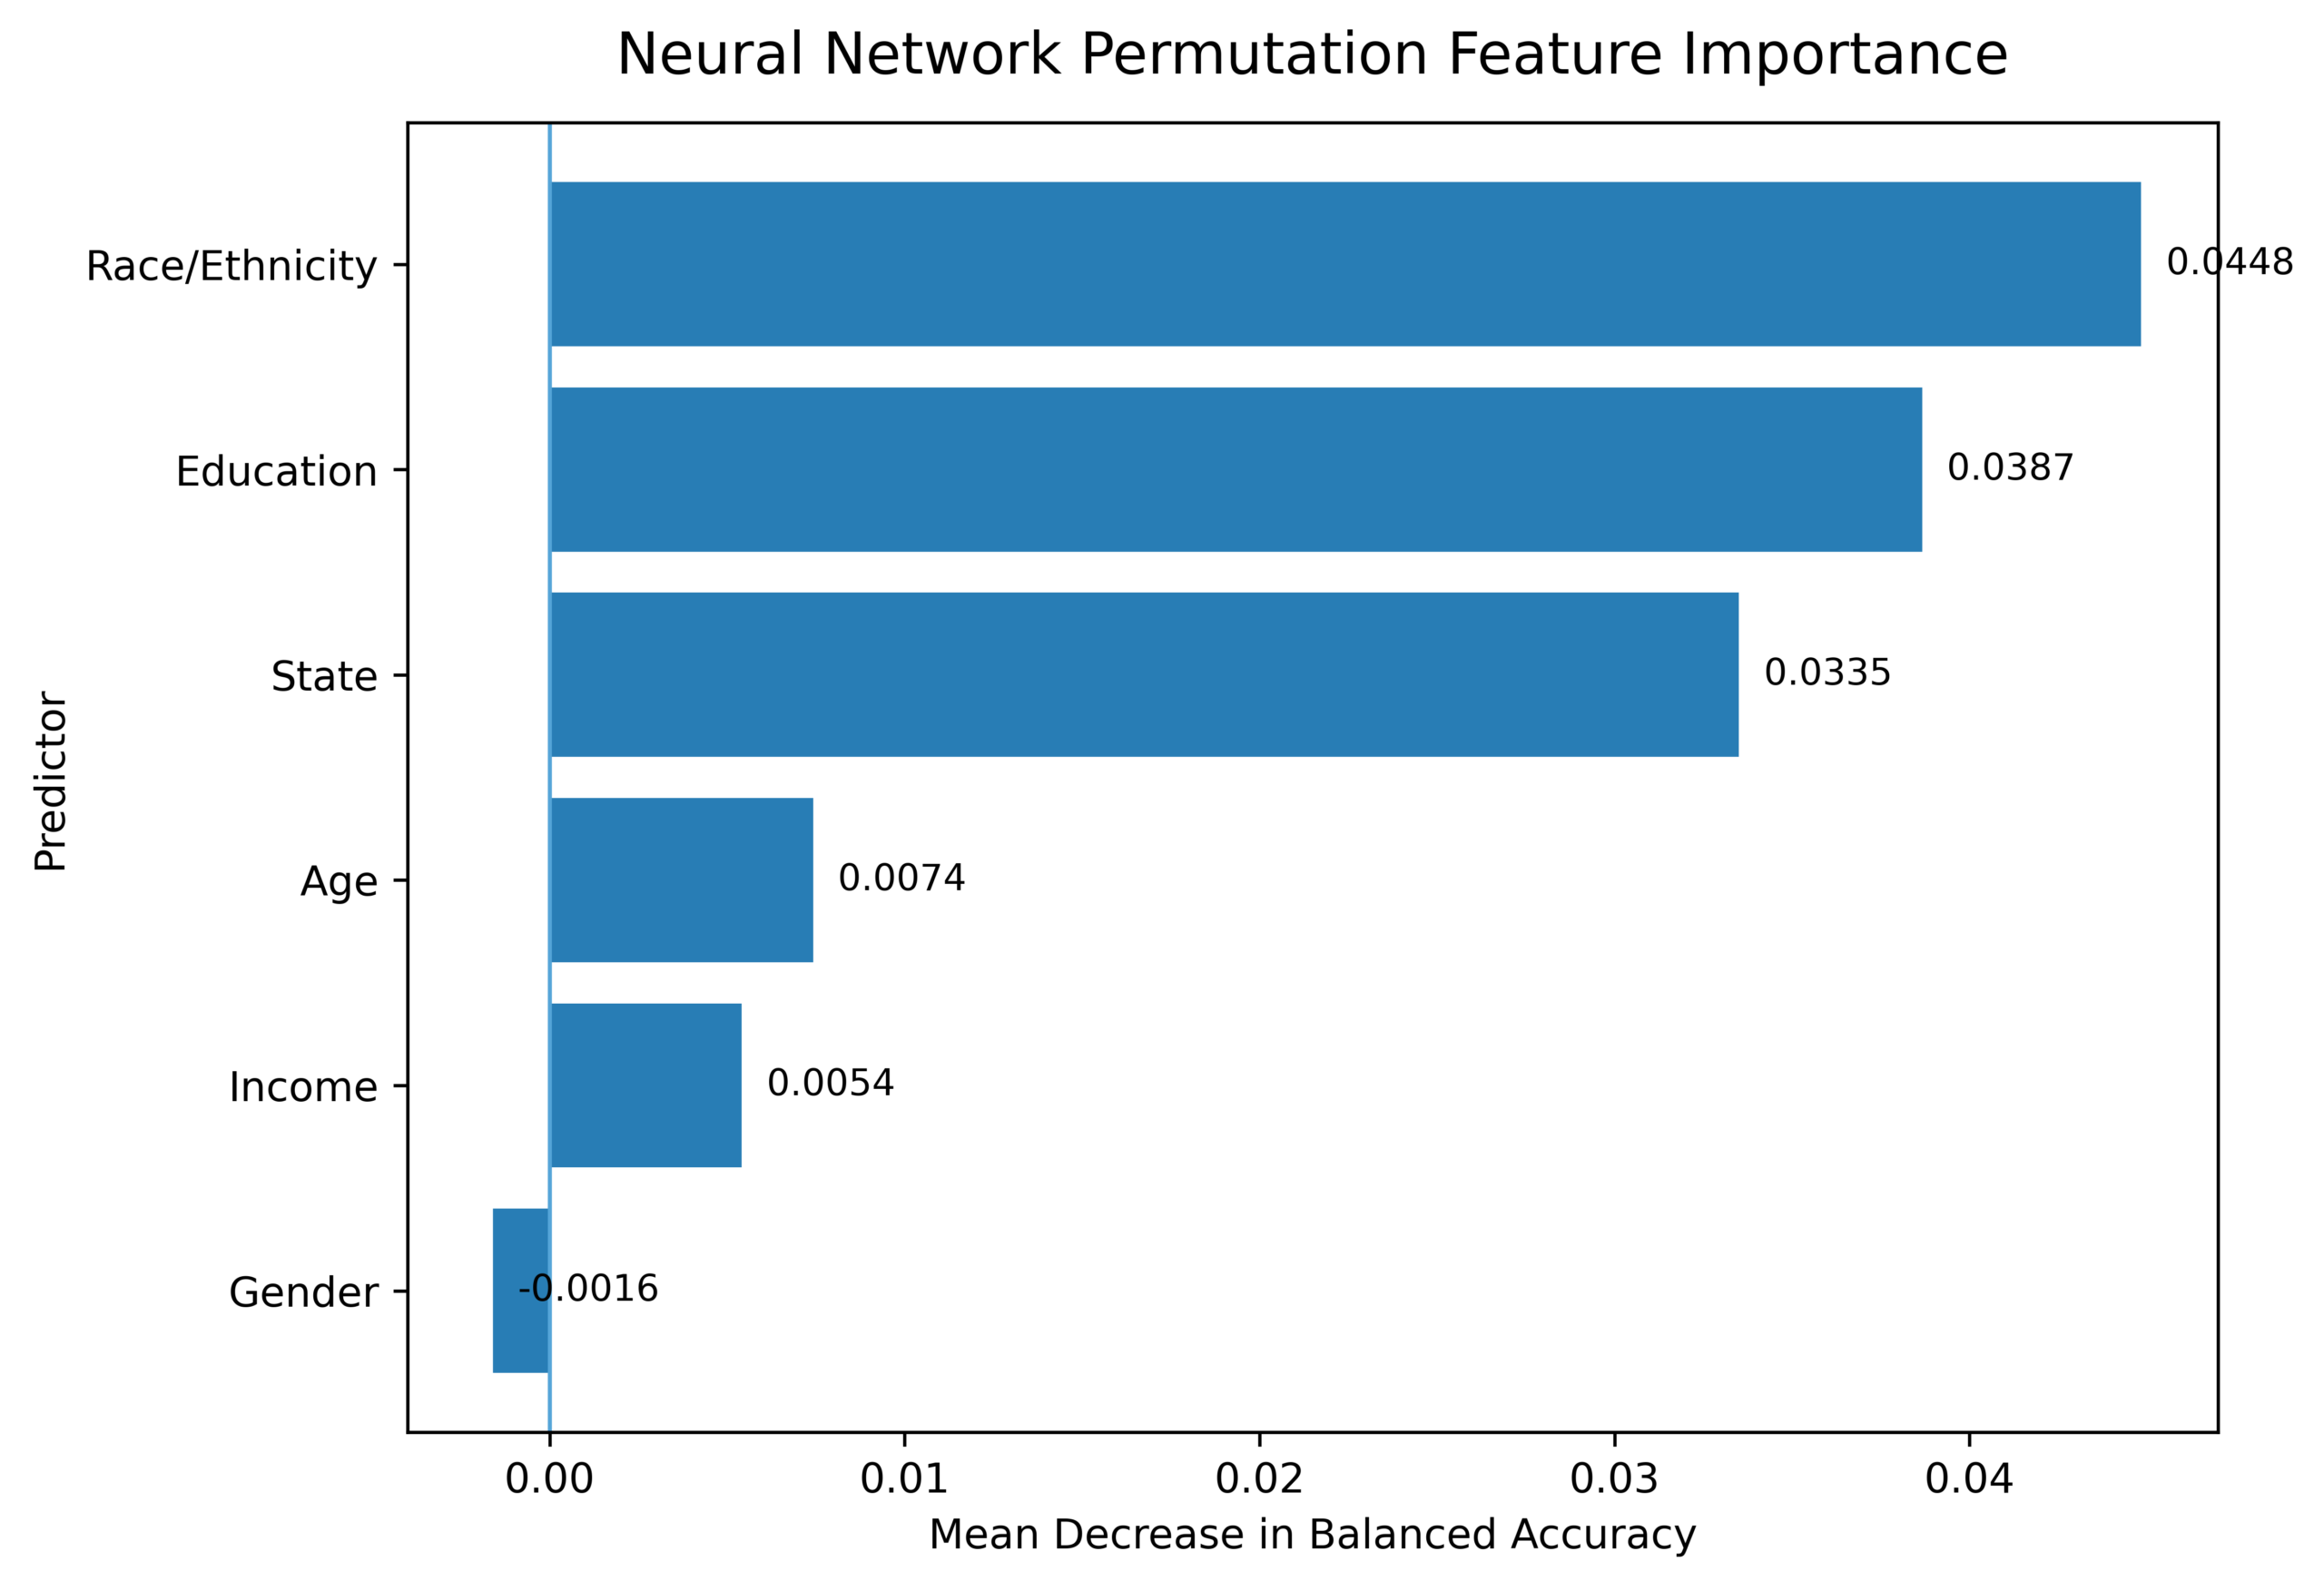
For the Neural Network classifier, race/ethnicity produced the largest permutation importance value, followed by education level, state of residence, age, family income, and gender. These findings indicate that the relative importance of demographic variables differed between the linear and nonlinear classification models.
An exact McNemar test was also conducted to compare the paired classification performance of Logistic Regression and the Neural Network on the independent holdout test set. The Neural Network correctly classified 288 observations that were incorrectly classified by Logistic Regression, whereas Logistic Regression correctly classified 84 observations that were incorrectly classified by the Neural Network. The difference in classification performance was significant (p < .001), indicating that the two classifiers differed substantially in their rates of correct classification on the same test observations.
Discussion
In conclusion, the findings show how demographic characteristics do contain meaningful information for classifying presidential vote choice, while also revealing the differences between linear and nonlinear machine learning models. The Neural Network was able to achieve a considerably higher overall accuracy than Logistic Regression, which suggests that the relationships among demographic characteristics and voting behavior may involve nonlinear patterns and interactions that are not fully captured by a linear classification model. Because Neural Networks are able to model more complex nonlinear relationships among predictors without needing specifications prior, the model may have captured combinations of demographic characteristics that Logistic Regression could not do as effectively15. However, these findings only reflect predictive associations and should not be taken as true evidence that any demographic characteristic directly causes an individual to support or vote for a particular candidate or party.
Although the Neural Network achieved the highest overall accuracy, its performance was not technically superior based on every evaluation metric. For example, Logistic Regression achieved a higher balanced accuracy and macro recall, indicating it reflected a more even performance across the three vote-choice categories. This distinction is particularly important because the dataset was highly imbalanced. Biden and Trump voters accounted for the overwhelming majority, while Third-party/Other voters represented only 2.52% of the sample. Consequently, the overall accuracy was primarily influenced by the performance of the two major-party classes.
The confusion matrices further demonstrate this tradeoff. The Neural Network, for example, performed relatively well when distinguishing Biden and Trump voters but failed to correctly classify any Third-party/Other voters. While Logistic Regression identified some Third-party/Other voters, its very low precision for this class indicates that many respondents predicted to belong to this category might have actually voted for one of the major-party candidates. Therefore, neither model performed well for Third-party/Other voters. The Neural Network’s higher overall accuracy should therefore be interpreted along with its lower balanced accuracy and poor performance for the smaller class rather than as proof of a universally superior form of classification.
The difficulty of classifying Third-party/Other voters likely reflects the severe imbalance in the available training data. Considering only 158 respondents in the sample belonged to this category, fewer observations were given to either model, making it difficult to learn distinguishing patterns. Furthermore, combining several smaller party candidates under a single category creates a diverse group whose voters may not share a consistent demographic profile. Ultimately, these results illustrate why the overall accuracy alone can be misleading when evaluating models on imbalanced data and emphasize the importance of reporting class-specific and balanced performance measures.
Additionally, the permutation feature importance also revealed differences in how the models relied on demographic information. For the Neural Network classifier, race/ethnicity produced the largest permutation importance value, followed by education level, state of residence, age, family income, and gender. The difference in feature rankings reflects the different ways in which the two algorithms represent relationships among predictors. Nevertheless, permutation importance should not be taken as a measure of influence. Demographic characteristics can intersect with social identities and political views associated with electoral behavior. Mason and Wronski, for example, found that overlapping social-group attachments can strengthen party identity, while Algara and Hale examined the relationship between racial attitudes and political cross pressures within the Republican Party during the Trump era23,24. These findings reinforce the importance of interpreting the demographic predictors in the present models as sources of predictive information rather than independent factors of vote choice.
The present results can also be considered alongside previous research that examines the predictability of individual voting behavior. Kim and Zilinsky found that demographic characteristics including age, gender, race, education, and income contained information about presidential vote choice but remained limited in their ability to separate individual voters19. The present results are roughly consistent with this conclusion. Although the Neural Network achieved 65.4% overall accuracy using demographic characteristics alone, its balanced accuracy was considerably lower at 43.5%, and it failed to correctly identify any Third-party/Other voters. Therefore, the difference between overall and class-sensitive performance illustrates an important limitation in the extent to which demographic characteristics alone can distinguish among individual voters.
An important feature of the present analysis was how party identification and other political attitudes were excluded from the predictor variables. Kim and Zilinsky found that incorporating clear political information, specifically party identification, significantly increased the predictability of presidential vote choice relative to demographic information alone19. These variables were left out from the present study primarily because the objective was specifically to evaluate the predictive information contained solely in demographic characteristics. The present analysis therefore represents a restricted classification task rather than an attempt to maximize accuracy using all the data provided by ANES.
However, the use of demographic information for electoral classification may raise both practical and ethical considerations. Although the present study evaluates model performance for research purposes, similar predictive methods can be used for political profiling and microtargeting of individuals. Previous research has identified potential concerns surrounding political microtargeting, including the use of personal data for profiling, privacy, and broader implications of targeted political communication for democratic processes25. The limitations observed in the present models are relevant in this context as classification errors were not distributed evenly across vote-choice groups, and demographic predictors represented statistical associations rather than direct explanations of political preferences. Using such predictions to characterize individuals could therefore reinforce assumptions about political behavior based on demographic characteristics. Consequently, electoral classification models should be interpreted with caution and attention to both predictive uncertainty and the potential implications of demographic profiling.
Several limitations should be considered when interpreting these findings. Most importantly, the class imbalance limited the models’ ability to classify Third-party/Other voters. The analysis was also restricted to six demographic predictors, excluding factors such as ideology, issue preferences, candidate evaluations, economic perceptions, and political engagement that may contribute to voting decisions. Research on the 2020 presidential election further demonstrates that political considerations beyond demographic characteristics can be associated with individual vote choice. Broockman and Kalla, for example, examined the relationship between candidate ideology and vote choice in the 2020 election26. Accordingly, the performance of the present models should not be interpreted as representing the full range of information associated with individual voting behavior.
Additional limitations arise from the data and study design. First, the ANES responses are self-reported, and respondents without a valid presidential vote-choice response were excluded from the analytic sample. The classification analysis also did not incorporate ANES survey weights; therefore, model performance describes the analytic sample and should not be interpreted as a population-weighted estimate of classification performance. State of residence also required one-hot encoding across numerous geographic categories, increasing the dimensionality of the predictor space. Although regularization, cross-validation, and independent holdout evaluation were used to reduce the risk of overfitting, some state-level patterns may reflect geographically specific relationships within the 2020 sample rather than relationships that would generalize across election cycles. Since the analysis was limited to a single election cycle, the performance within the 2020 sample does not establish that the same models or demographic relationships would generalize to other presidential elections. This limitation is important because previous machine-learning research has examined voting behavior across multiple election cycles, demonstrating the value of evaluating predictive models across elections rather than within a single electoral context18. Finally, the models identify statistical associations rather than causal relationships, meaning that permutation importance alone cannot establish that a demographic characteristic directly influenced an individual’s vote.
However, future research could address these limitations by evaluating models across multiple election cycles and comparing progressively richer sets of predictors. A demographic-only model could serve as a baseline against models incorporating party identification, ideology, issue preferences, candidate evaluations, and other political attitudes. Given previous evidence that additional political information can substantially increase the predictability of vote choice beyond demographic characteristics alone19, such comparisons could measure how much predictive information is provided specifically by demographic characteristics and how much is added by political variables. Future studies could also evaluate additional algorithms and methods designed for highly imbalanced multiclass data. These would provide a more complete understanding of both the potential and limitations of machine learning for analyzing individual electoral behavior.
Overall, the findings suggest that the Neural Network captured predictive structure in the demographic data that produced higher overall classification accuracy than Logistic Regression. However, the Neural Network’s failure to identify Third-party/Other voters and its lower balanced accuracy demonstrate that higher overall accuracy does not necessarily translate into better performance across all electoral groups. More broadly, the results support previous research suggesting that demographic characteristics contain information about individual vote choice but provide an incomplete basis for distinguishing among voters19. Evaluating machine-learning models using multiple performance measures and interpreting demographic predictors within the broader political context are therefore essential for producing a more complete and transparent assessment of electoral classification.
References
- A. Campbell, P. E. Converse, W. E. Miller, D. E. Stokes. The American voter. John Wiley & Sons, 1960. [↩]
- M. P. Fiorina. Retrospective voting in American national elections. Yale University Press, 1981. [↩]
- M. S. Lewis-Beck, M. Stegmaier. Economic determinants of electoral outcomes. Annual Review of Political Science. Vol. 3, pg. 183–219, 2000. DOI: 10.1146/annurev.polisci.3.1.183. [↩]
- L. Mason. A cross-cutting calm: How social sorting drives affective polarization. Public Opinion Quarterly. Vol. 80, pg. 351–377, 2016. DOI: 10.1093/poq/nfw001. [↩]
- B. F. Schaffner, M. MacWilliams, T. Nteta. Understanding white polarization in the 2016 vote for president: The sobering role of racism and sexism. Political Science Quarterly. Vol. 133, pg. 9–34, 2018. DOI: 10.1002/polq.12737. [↩]
- D. C. Mutz. Status threat, not economic hardship, explains the 2016 presidential vote. Proceedings of the National Academy of Sciences. Vol. 115, pg. E4330–E4339, 2018. DOI: 10.1073/pnas.1718155115. [↩]
- E. C. Cassese. Mobilizing sexism: The interaction of emotion and gender attitudes in the 2016 US presidential election. Public Opinion Quarterly. Vol. 82, pg. 799–821, 2018. DOI: 10.1093/poq/nfy003. [↩]
- J. Knuckey. “I just don’t think she has a presidential look”: Sexism and vote choice in the 2016 election. Social Science Quarterly. Vol. 100, pg. 342–358, 2019. DOI: 10.1111/ssqu.12547. [↩]
- J. N. Zingher. On the measurement of social class and its role in shaping white vote choice in the 2016 U.S. presidential election. Electoral Studies. Vol. 64, Article 102119, 2020. DOI: 10.1016/j.electstud.2020.102119. [↩]
- N. Carnes, N. Lupu. The white working class and the 2016 election. Perspectives on Politics. Vol. 19, pg. 55–72, 2021. DOI: 10.1017/S1537592720001267. [↩]
- C. Kim, J. Junn. Whitewashing women voters: Intersectionality and partisan vote choice in the 2020 U.S. presidential election. Politics & Gender. Vol. 20, pg. 701–726, 2024. DOI: 10.1017/S1743923X24000345. [↩]
- K. Nelson. You seem like a great candidate, but…: Race and gender attitudes and the 2020 Democratic primary. The Journal of Race, Ethnicity, and Politics. Vol. 6, pg. 642–666, 2021. DOI: 10.1017/rep.2020.53. [↩]
- N. Chan, J. H. Nguy, N. Masuoka. The Asian American vote in 2020: Indicators of turnout and vote choice. Political Behavior. Vol. 46, pg. 631–655, 2024. DOI: 10.1007/s11109-022-09844-9. [↩]
- L. P. Olson. Dynamic racial attitudes and presidential vote switching. The Journal of Race, Ethnicity, and Politics. pg. 1–16, 2026. DOI: 10.1017/rep.2026.10093. [↩]
- C. M. Bishop. Pattern recognition and machine learning. Springer, 2006. [↩] [↩] [↩] [↩]
- J. M. Montgomery, S. Olivella. Tree-based models for political science data. American Journal of Political Science. Vol. 62, pg. 729–744, 2018. DOI: 10.1111/ajps.12361. [↩]
- M. Neunhoeffer, S. Sternberg. How cross-validation can go wrong and what to do about it. Political Analysis. Vol. 27, pg. 101–106, 2019. DOI: 10.1017/pan.2018.39. [↩] [↩] [↩]
- C. Hare, M. Kutsuris. Measuring swing voters with a supervised machine learning ensemble. Political Analysis. Vol. 31, pg. 537–553, 2023. DOI: 10.1017/pan.2022.24. [↩] [↩]
- S. S. Kim, J. Zilinsky. Division does not imply predictability: Demographics continue to reveal little about voting and partisanship. Political Behavior. Vol. 46, pg. 67–87, 2024. DOI: 10.1007/s11109-022-09816-z. [↩] [↩] [↩] [↩] [↩] [↩]
- M. Owusu-Adjei, J. B. Hayfron-Acquah, T. Frimpong, G. Abdul-Salaam. Imbalanced class distribution and performance evaluation metrics: A systematic review of prediction accuracy for determining model performance in healthcare systems. PLOS Digital Health. Vol. 2, Article e0000290, 2023. DOI: 10.1371/journal.pdig.0000290. [↩] [↩]
- American National Election Studies. ANES 2020 Time Series Study Full Release [dataset and documentation]. February 10, 2022 version, 2021. [↩] [↩]
- F. Pedregosa, G. Varoquaux, A. Gramfort, V. Michel, B. Thirion, O. Grisel, M. Blondel, P. Prettenhofer, R. Weiss, V. Dubourg, J. Vanderplas, A. Passos, D. Cournapeau, M. Brucher, M. Perrot, É. Duchesnay. Scikit-learn: Machine learning in Python. Journal of Machine Learning Research. Vol. 12, pg. 2825–2830, 2011. [↩]
- L. Mason, J. Wronski. One tribe to bind them all: How our social group attachments strengthen partisanship. Political Psychology. Vol. 39, pg. 257–277, 2018. DOI: 10.1111/pops.12485. [↩]
- C. Algara, I. Hale. Racial attitudes & political cross-pressures in nationalized elections: The case of the Republican coalition in the Trump era. Electoral Studies. Vol. 68, Article 102207, 2020. DOI: 10.1016/j.electstud.2020.102207. [↩]
- F. J. Zuiderveen Borgesius, J. Möller, S. Kruikemeier, R. Ó Fathaigh, K. Irion, T. Dobber, B. Bodó, C. H. de Vreese. Online political microtargeting: Promises and threats for democracy. Utrecht Law Review. Vol. 14, pg. 82–96, 2018. DOI: 10.18352/ulr.420. [↩]
- D. Broockman, J. L. Kalla. Candidate ideology and vote choice in the 2020 US presidential election. American Politics Research. Vol. 52, 2024. DOI: 10.1177/1532673X231220652. [↩]