Abstract
Background/Objective: Repeated equestrian training is often associated with lower cardiovascular strain as riders and horses become more familiar with training demands. In routine hunter training, however, lesson content and demands are not always the same from one session to the next. As a result, physiological measures may not change in the same way over time. Against this background, the present study followed a single rider–horse dyad to investigate whether repeated hunter training produced different longitudinal patterns in sustained load, peak load, and autonomic regulation.
Methods: A longitudinal observational design was used to follow eleven routine hunter training sessions involving the same rider–horse pair. Heart rate (HR) data from both the rider and horse were synchronized with stage records and event annotations. Sustained load was represented by canter-phase HR, peak load by jump-phase HR and event-related peak responses (Δpeak), and autonomic regulation by horse heart rate variability (HRV) measures, including RMSSD and SDNN. Session-level measures were summarized descriptively, and Spearman rank correlations were used to evaluate their relationships with session order.
Results: Rider mean canter HR showed the clearest directional change across the eleven sessions, whereas rider peak canter HR changed little over time. In contrast, jump-stage HR showed different longitudinal patterns between the rider and the horse, whereas jump-specific Δpeak responses remained highly variable. Horse HRV measures (RMSSD and SDNN) also varied from session to session, with no obvious directional pattern across the training period.
Conclusions: Repeated hunter training was not associated with a uniform reduction in physiological load. Longitudinal change differed across physiological measures. Rider mean HR showed the clearest directional decrease across sessions, whereas peak HR responses, horse cardiovascular measures, and HRV exhibited greater variability and weaker longitudinal patterning. These findings support a task-stratified framework for interpreting rider-horse physiological responses under ecologically valid training conditions.
Keywords: equestrian training; rider–horse dyad; heart rate; heart rate variability; longitudinal cardiovascular patterns; sustained load; peak load; task-stratified framework
Introduction
Equestrian training requires close coordination between the rider and the horse. Performance depends on how effectively the two work together rather than on either individual alone. Posture, rein contact, leg aids, and timing are continuously adjusted between the two, and as lesson demands shift, both members of the dyad exhibit measurable physiological responses. Heart rate (HR) is commonly used to characterize physiological workload during equestrian exercise, whereas heart rate variability (HRV) provides complementary information on cardiac autonomic regulation1,2,3. Previous studies have shown that horseback riding imposes meaningful energetic and cardiovascular demands on riders, with workload increasing according to gait, riding task, and exercise intensity4,5,6,7. In horses, HR is widely used as a practical field measure of exercise intensity and cardiovascular response during discipline-specific exercise testing, training, and competition8,9,10,11,12. Equine RR recordings can be affected by motion and technical artifacts, making careful inspection and preprocessing important before HRV estimation2,3,13. More generally, beat-detection artifacts can materially distort HRV indices14.
Despite these advances, physiological responses during equestrian exercise are still commonly summarized using whole-session averages or broad activity categories. Although these approaches provide a useful overview of cardiovascular workload, they may not fully reflect the substantial variation in physiological demand that occurs across different riding tasks and exercise conditions. Previous studies have shown that show jumping elicits measurable cardiovascular and metabolic responses in horses15. Across studies of standardized jumping courses, track-based exercise tests, discipline-specific field tests, and competitions of different levels, equine physiological responses have varied with exercise format, course characteristics, testing protocol, and competition context9,10,11,12,16. Studies conducted in non-ridden human–horse interaction settings have reported temporal coherence and directional associations between human and equine cardiovascular signals17,18. Whether these forms of physiological coupling generalize to mounted training remains uncertain. However, such coupling does not necessarily imply that rider and horse responses are identical across all tasks or physiological measures. Together, these findings support the use of more task-specific analyses to distinguish sustained-load, peak-load, and event-related cardiovascular responses during routine hunter training.
This difference is more relevant when training is delivered over a series of sessions rather than being investigated during a single lesson. Hunter training typically combines flatwork and over-fences exercises, and lesson content is adjusted according to the rider’s progress and the horse’s condition. Under these circumstances, longitudinal cardiovascular changes are not expected to manifest uniformly across all physiological measures. Equine HR and HRV have been shown to vary across competition levels, exercise phases, and repeated jumping contexts12,16. During a jumping course, rider experience affected cardiac and stress responses more clearly in riders than in horses19, whereas rehearsal and public performance elicited different cardiac responses in riders and horses20. Longitudinal evidence indicates that equine HR and autonomic responses can change across training and recovery and may differ with age21, while cross-sectional evidence associates resting HR and HRV with age and activity level22. During a fatiguing 10-week programme in young Friesian stallions, physiological and gait measures also showed different patterns of change23. However, comparable longitudinal evidence describing both members of a rider–horse dyad during routine hunter training remains limited. If all high-demand training activities are treated as a single category, meaningful differences among physiological domains may be overlooked. This distinction is particularly relevant in hunter training, where performance depends not only on cardiovascular workload but also on rhythm, consistency, technical execution, and rider–horse coordination across different lesson tasks.
The current study focuses on longitudinal change within a rider – horse dyad, in the context of regular hunter training, and applies a task-stratified approach. Rather than treating all high-demand activities as a single category, the framework distinguishes sustained load (canter phases), peak load (jump phases and event-related Δpeak responses), and autonomic regulation using horse HRV. The present study was therefore designed as an exploratory longitudinal case report to describe cardiovascular response patterns in a single rider–horse dyad across repeated hunter training sessions. Specifically, it addressed three descriptive research questions: (1) Do sustained-load and peak-load variables exhibit similar or different longitudinal patterns across repeated training sessions? (2) Is directional change more evident in the rider, the horse, or both? (3) How do cardiovascular response patterns differ across physiological domains during repeated hunter training?
The study was designed to be small in scope. It studied one rider–horse pair seen in many repeated hunter lessons, where the content of the lessons was not standardized between lessons. This design maintained the structure of real-world training but restricted generalization at the population level. Accordingly, the findings should be interpreted as case-based evidence that supports structured description and hypothesis generation rather than population-level causal inference. Continuous rider and horse HR data were collected across 11 training sessions. The recordings were analysed according to stage annotations and event logs and subsequently summarized into four session-level outcome domains: canter-based sustained load, jump-based peak load, event-related cardiovascular reactivity (Δpeak), and horse HRV.
Methods
Study design and rider–horse dyad
A longitudinal observational case-study design was used, in which the physiological responses of a single rider–horse dyad were monitored across 11 routine hunter training sessions conducted between December 16, 2025, and January 19, 2026.
Throughout the observation period, the same rider–horse pair was followed. The rider was an adolescent hunter rider with about three years of riding experience and the horse was a 15 year-old gelding trained as a hunter. These sessions were analyzed shortly after a two-week familiarization period which was taken to allow the pair to get started with normal routine training conditions and to establish coordination between rider and horse. Since the dyad did not vary, the differences between sessions are interpreted as differences in training context and physiological responses, not differences in participants.
The data were gathered under the normal training circumstances. All sessions were conducted in the rider’s normal training environment, and no research-specific training was added to the program. There were variations in the structure of lessons between sessions such as flatwork sessions and sessions with over fence work. This variation is a consequence of normal hunter training, and was left in the analysis.
Session characteristics were summarized from the stage and event annotations. For each session, the total annotated training time, time spent in walk, trot, canter, and jump-work stages, numbers of canter and jump-work phases, number of annotated jump attempts, and lesson focus are reported in Table 1.
The observation period included all routine hunter training sessions available during the predefined monitoring period. The monitoring period was established before data collection according to the project schedule and was not based on statistical stopping criteria or interim inspection of the physiological results. The study was not terminated on the basis of interim results or observed physiological patterns. Instead, data collection ended when the predefined monitoring period concluded.
| Training Session | Start Time | End Time | Total Annotated Training Time (min) | Walk (min) | Trot (min) | Canter (min) | Jump-work (min) | Canter Phases (n) | Jump-work Phases (n) | Jump Attempts (n) | Jump Height (m) | Lesson Focus |
| 2025-12-16_A | 15:40:00 | 16:04:00 | 24 | 12 | 4 | 4 | 4 | 1 | 3 | 11 | NR | Mixed |
| 2025-12-18_A | 15:30:00 | 16:00:00 | 30 | 14 | 5 | 2 | 9 | 1 | 6 | 7 | NR | Mixed |
| 2025-12-19_A | 15:50:00 | 16:33:00 | 43 | 25 | 11 | 7 | 0 | 3 | 0 | 0 | NA | Flatwork |
| 2025-12-23_A | 14:34:00 | 15:12:00 | 38 | 26 | 6 | 0 | 6 | 0 | 4 | 12 | NR | Mixed |
| 2025-12-29_A | 15:37:00 | 16:06:00 | 29 | 9 | 7 | 9 | 4 | 2 | 1 | 6 | NR | Mixed |
| 2025-12-30_A | 15:38:00 | 16:27:00 | 49 | 27 | 5 | 3 | 14 | 1 | 4 | 16 | NR | Mixed |
| 2026-01-02_A | 15:38:00 | 16:20:00 | 43 | 24 | 1 | 5 | 13 | 1 | 3 | 11 | NR | Mixed |
| 2026-01-06_A | 15:29:00 | 15:57:00 | 27 | 14 | 7 | 6 | 0 | 2 | 0 | 0 | NA | Flatwork |
| 2026-01-13_A | 15:29:00 | 16:03:00 | 32 | 11 | 7 | 9 | 5 | 1 | 2 | 11 | NR | Mixed |
| 2026-01-16_A | 15:30:00 | 16:02:00 | 32 | 20 | 3 | 1 | 8 | 1 | 3 | 13 | NR | Mixed |
| 2026-01-19_A | 13:01:00 | 13:35:00 | 35 | 19 | 6 | 10 | 0 | 3 | 0 | 0 | NA | Flatwork |
Note. Annotated training time is the sum of all annotated stages and may differ from total lesson duration. Canter denotes cantering without obstacles; Jump-work denotes cantering while negotiating fences. Canter and Jump-work Phases are counts of distinct annotated segments; Jump Attempts is the number of annotated jump events. Lessons reflected routine hunter training and were not experimentally standardized. NR, not recorded (jump height was not prospectively documented and could not be reliably reconstructed); NA, not applicable (no jump work).
Data collection and lesson annotation
Physiological data were collected simultaneously from both members of the rider–horse dyad during each training session. Rider heart rate (HR) was recorded using a Polar H10 Heart Rate Sensor (firmware version 3.3.1; Polar Electro Oy, Kempele, Finland), paired with the Polar Flow mobile application (version 6.34.0). Horse HR and beat-to-beat RR intervals were recorded using a Polar Equine H10 Heart Rate Sensor for Riding (firmware version 3.3.1; Polar Electro Oy, Kempele, Finland), paired with a Polar Vantage M3 multisport watch (firmware version 4.3.0; Polar Electro Oy, Kempele, Finland). Rider and horse HR were recorded continuously at 1-s intervals throughout each session. For the horse, beat-to-beat RR intervals were recorded continuously, with each exported RR value representing one interbeat interval in milliseconds. The rider recording was used for HR analysis only, and rider RR intervals were not included in the exported dataset or subsequent analyses. Both sensors were fitted according to the manufacturer’s instructions. The rider Polar H10 chest strap was positioned around the lower thorax immediately below the pectoral muscles. The Polar Equine H10 sensor was attached using the manufacturer’s Polar Equine Belt in the standard riding configuration beneath the saddle to ensure stable electrode contact throughout each training session. Data from both systems were exported as CSV files through the Polar Flow web service for subsequent offline processing and analysis. In human participants, the Polar H10 has demonstrated good agreement with reference ECG for HR and RR-interval measurement during rest and incremental exercise24. In horses, Polar heart-rate monitoring systems have shown agreement with simultaneous ECG recordings for HR and time-domain HRV measures under non-exercising and groundwork conditions13,25.
Annotations were generated for each training session to characterize lesson structure. All annotations were performed manually and retrospectively by the rider (first author) through frame-by-frame review of the session video recordings, rather than during live riding; no automated annotation software was used. Stage annotations (walk, trot, canter, and jump work) and event annotations (e.g., jump attempts and coach cues) were first identified from the video recordings. The identified timestamps were then aligned with the corresponding Polar heart-rate recordings, allowing the start and end of each stage and the occurrence time of each annotated event to be linked directly to the physiological data. Stage records represented continuous periods of a specific riding activity (walk, trot, canter, or jump work), whereas event records represented discrete training events or coach signals, including individual jump attempts and instructional cues. Canter stages were defined as continuous periods during which the horse maintained a canter gait without negotiating obstacles. A canter stage began at the onset of a continuous canter gait following the transition from trot or walk and ended when the horse transitioned back to trot or walk or entered a jump-work segment. Jump-work stages were defined as periods of cantering while negotiating fences and included the approach, jump, and immediate departure associated with each obstacle sequence. Stage boundaries were determined by frame-by-frame video review using predefined gait-transition and obstacle-negotiation criteria to ensure consistent annotation across sessions. This stage-wise segmentation enabled the analysis of sustained cardiovascular responses across different riding tasks, whereas event annotations were used to quantify short-window acute cardiovascular responses (Δpeak).
All training sessions were conducted outdoors under routine environmental conditions. To characterize the environmental conditions associated with each session, daily weather data, including maximum temperature, minimum temperature, average wind speed, and precipitation, were obtained from archived NOAA daily climate records. These data are summarized in Supplementary Table S1. Relative humidity was not consistently available from the archived NOAA records for all training dates and was therefore not included. These variables represent daily meteorological conditions rather than on-site measurements recorded during individual training sessions. The start and end times of each training session are reported in Table 1 to document the time of day at which physiological measurements were obtained and to facilitate consideration of potential circadian influences. Throughout the observation period, the horse remained at the same training facility and followed the same routine management schedule across all eleven sessions. The horse was turned out daily from approximately 16:00 until 06:00 the following morning. Hay was provided in the stall at approximately 06:00 and again in the pasture at approximately 16:00, where the horse also had access to fresh pasture grass. A formulated concentrate feed was provided at approximately 10:00 and 15:00. The horse received no additional riding or structured exercise before any of the monitored training sessions. Routine grooming, tacking, and handling procedures were followed before each session. No session-specific deviations in turnout, feeding, prior exercise, housing, or handling occurred across the eleven sessions. The horse was ridden only by the study rider during the observation period.
Variables and derived measures
The analysis used a task-stratified framework to separate physiological demand into sustained-load, peak-load, and autonomic-regulation measures. Sustained load was represented by canter phases, reflecting continuous moderate-to-high cardiovascular demand during routine training. Peak load was represented by jump phases and event-related peak responses, reflecting shorter periods of heightened physiological demand. Cardiac autonomic modulation was assessed operationally using session-level horse HRV indices derived from cleaned RR intervals1, 2,3.
Stage-derived session-level measures. For each training session, canter and jump-work stages were summarized by rider mean HR, rider peak HR, horse mean HR, horse peak HR, and total stage duration. When multiple segments of the same stage category occurred within a session, all HR observations from those segments were pooled. Session-level mean HR was calculated as the arithmetic mean of all pooled observations, whereas session-level peak HR was defined as the highest HR value observed within the corresponding stage category during that session. Consequently, longer stage segments contributed proportionally more HR observations to the session-level summary values than shorter stage segments.
Event-related reactivity (Δpeak)
Acute cardiovascular responses to discrete training moments—such as jumps, corrections, or coach cues—were quantified using Δpeak, defined as the increase in HR following an event relative to a pre-event baseline:
where HRpeak is the maximum heart rate within 0–20 s after event onset, and HRbaseline
is the mean heart rate during the 30 s preceding the event. The 30-s baseline and 0–20-s response windows were specified a priori as short-window summaries intended to capture near-event cardiovascular changes. In jumper horses, Bazzano et al. recorded HR at 1-s resolution during standardized warm-up jumps followed by 20-s walking recovery periods and reported significantly higher HR during the recovery period than during the corresponding jumping phase26. Earlier continuous recordings averaged over 5-s intervals also showed HR peaks associated with individual practice jumps and a marked increase after clearing the first fence27. These findings provide indirect physiological support for examining a brief post-jump interval, but neither study established a universal 20-s time-to-peak for HR. Accordingly, the 0–20-s response window was treated as an exploratory approximation rather than a validated physiological time-to-peak interval. Δpeak values should therefore be interpreted as summaries of cardiovascular reactivity surrounding annotated events rather than as isolated physiological responses attributable to individual jumps.
This value was calculated separately for rider and horse. Session-level Δpeak summaries were generated for all valid events and, separately, for jump-classified events only.
Events were excluded when either the baseline window or the response window was incomplete. Events with complete baseline and response data were retained in the primary analysis even when neighbouring annotated events or gait transitions occurred within the predefined window because Δpeak was intended as an exploratory summary of cardiovascular reactivity surrounding routine training events rather than as an isolated physiological response to a single obstacle. Because these windows could span gait transitions and neighbouring riding activities, no single isolated stage context was assigned to each event window. Accordingly, overlapping event windows were not excluded from the primary analysis. This approach was adopted because closely spaced jump sequences are a characteristic feature of routine hunter training rather than an analytic artifact. Negative Δpeak values indicate that the maximum post-event HR did not exceed the pre-event baseline and therefore should not be interpreted as paradoxical physiological responses to obstacle negotiation.
Event-window overlap and sensitivity analyses. For the primary Δpeak analysis, each event window extended from 30 s before event onset through 20 s after onset. Session-level jump-event counts, median inter-jump intervals, overlap proportions, and numbers of non-overlapping (“clean”) events are summarized in Supplementary Table S2. To evaluate the robustness of the primary findings, additional sensitivity analyses were performed using shorter baseline/response windows (15 s/15 s and 10 s/10 s), together with a restricted analysis including only non-overlapping (“clean”) jump events.
Heart rate variability. Two standard time-domain HRV indices were calculated from cleaned horse RR (NN) intervals, using definitions established in general HRV standards and discussed in equine HRV methodological literature1,2’3: the root mean square of successive differences (RMSSD), commonly interpreted as a marker of vagally mediated modulation, and the standard deviation of NN intervals (SDNN), reflecting overall beat-to-beat variability.
where  is the
  -th cleaned RR (NN) interval retained after preprocessing,
  is the number of retained intervals, and
  is the mean of the retained cleaned RR intervals.
Prior to HRV calculation, RR interval preprocessing was performed using a predefined multistage quality-control workflow designed to reduce the influence of motion-related and technical artifacts while preserving physiological variability. The workflow was informed by published recommendations that RR artifacts should be identified and addressed before equine HRV analysis2,3. The specific screening thresholds and local-filter parameters used in the present study were defined a priori for this dataset and should not be interpreted as an established equine preprocessing standard. The same preprocessing algorithm was applied uniformly to all eleven training sessions without session-specific adjustment. RR intervals exported from the Polar Equine H10–Vantage M3 recording system were recorded in milliseconds (ms), and no unit conversion was required before preprocessing.
RR intervals recorded while the sensor was offline were first excluded. The remaining RR intervals were then subjected to a broad physiological plausibility screen (300–3000 ms), which served only as an initial quality screen to remove clearly implausible values rather than as the primary artifact-detection criterion.
Artifact detection was subsequently performed using a local-median–based relative rule. For each RR interval, the median RR value within a centered 11-beat moving window was calculated. RR intervals exceeding 1.75 times the local median or below 0.50 times the local median were classified as locally inconsistent and removed. Residual isolated artifacts were subsequently identified using a Hampel filter applied over the same 11-beat window, with the detection threshold defined as the greater of 3 × 1.4826 × the local median absolute deviation (MAD) or 150 ms.
RR intervals retained after all preprocessing steps were treated as cleaned normal-to-normal (NN) intervals. SDNN was calculated from all retained NN intervals across the complete recorded training session. RMSSD was calculated only from successive NN pairs that remained adjacent after preprocessing, thereby avoiding artificial inflation caused by intervals spanning removed artifacts.
For each training session, the numbers of raw RR intervals together with the numbers removed during offline screening, physiological range screening, local-median screening, and Hampel filtering were recorded as quality-control measures (Table 2 and Supplementary Table S3). Cleaned NN intervals were retained from all eleven sessions and used for whole-session HRV calculation. Representative examples of the preprocessing workflow are provided in Supplementary Figure S1.
One RMSSD value and one SDNN value were calculated for each complete training session and used as the primary HRV outcomes for longitudinal within-horse comparisons.
| Session | Raw RR intervals | Total removed intervals | Removal (%) | Final NN intervals | NN retention (%) |
| S1 | 2560 | 660 | 25.8 | 1900 | 74.2 |
| S2 | 2346 | 756 | 32.2 | 1590 | 67.8 |
| S3 | 3234 | 818 | 25.3 | 2416 | 74.7 |
| S4 | 2522 | 485 | 19.2 | 2037 | 80.8 |
| S5 | 2509 | 676 | 26.9 | 1833 | 73.1 |
| S6 | 3509 | 1117 | 31.8 | 2392 | 68.2 |
| S7 | 2967 | 572 | 19.3 | 2395 | 80.7 |
| S8 | 2359 | 486 | 20.6 | 1873 | 79.4 |
| S9 | 2519 | 564 | 22.4 | 1955 | 77.6 |
| S10 | 2266 | 738 | 32.6 | 1528 | 67.4 |
| S11 | 2924 | 841 | 28.8 | 2083 | 71.2 |
Note. RR interval preprocessing consisted of four sequential quality-control steps: (1) removal of offline recordings; (2) exclusion of RR intervals outside a broad physiological screening range (300–3000 ms); (3) removal of locally inconsistent RR intervals identified using a centered 11-beat local-median rule; and (4) removal of residual isolated artifacts detected using an 11-beat Hampel filter. The remaining intervals were retained as normal-to-normal (NN) intervals for HRV calculation. Detailed exclusion counts for each preprocessing step together with the residual artifact quality assessment are provided in Supplementary Table S3.
Data preprocessing and time alignment
For within-session comparison, the various types of recording streams (session dates, device clock times, elapsed times, and manually logged event times) were synchronized on a common absolute time axis. Across all source tables the session identifiers were first standardized, then rider and horse recordings were linked to the session dates to produce absolute timings and events/ stage timings were standardized to the same time scale with respect to the starting time of the session. The synchronization procedure enabled rider HR, horse HR, RR intervals, stage intervals, and event markers to be aligned on a common session-level time axis.
In the pre-processing phase, rows containing metadata/notes or documentation were deleted, and event records valid for analysis were kept. Any events not having a defined time duration were considered instantaneous and were given a time duration of one second for event-window analysis. The resulting dataset consisted of rider HR, horse HR, RR intervals, stage labels, and event markers aligned on a common session-level timeline.
RR interval preprocessing for HRV analysis was performed after synchronization. HRV preprocessing included removal of offline periods, exclusion of implausible RR intervals, artifact detection using a Hampel-style local median filter, and calculation of quality-control statistics before HRV indices were derived.
Statistical analysis
Data synchronization, RR interval preprocessing, HRV calculation, statistical analysis, and figure generation were performed using Python. The principal packages used were pandas, NumPy, Matplotlib, and statsmodels. The exact Python and package versions used during the original analysis were not prospectively recorded and could not be reliably reconstructed retrospectively.
The primary unit of analysis was the session-level summary. For each session, stage-level HR measures were first calculated by pooling all heart-rate observations within the same annotated stage category (e.g., canter or jump-work), after which session-level summary statistics were derived. Means and ranges were then calculated for each physiological domain (sustained load, peak load, event-related responses, and HRV). Spearman rank correlation coefficients were used to evaluate the associations between session order and selected physiological measures. Spearman correlation was chosen because it does not assume linearity and is appropriate for the small number of sessions (n = 8–11 per measure, depending on lesson composition) and the possibility of non-linear physiological responses. Selected variables were also summarized for the early and later sessions to facilitate descriptive comparison; these comparisons were exploratory and were not used for formal hypothesis testing. For descriptive purposes, the early phase comprised the first five sessions and the later phase comprised the remaining six sessions according to chronological session order.
Rider and horse variables were analysed separately where applicable. Because this was an exploratory longitudinal case report involving a single rider–horse dyad, Spearman ρ values are presented as descriptive indices of longitudinal patterning rather than inferential statistics. Accordingly, no p-values or confidence intervals are reported, and no population-level inference is intended.
Sensitivity analysis. To evaluate whether the longitudinal HRV findings depended on the use of complete training-session recordings, an additional sensitivity analysis was performed using standardized 5-minute stable walk windows extracted from eligible training sessions after application of the identical RR preprocessing algorithm. RMSSD and SDNN derived from these standardized windows were compared descriptively with the primary whole-session analysis. Because both approaches produced similar longitudinal conclusions, the whole-session analysis was retained as the primary analysis and the sensitivity analysis is presented in the Supplementary Material. Recording duration, retained NN intervals, and adjacent NN pairs for both the whole-session and standardized 5-minute analyses are summarized in Supplementary Table S4.
Ethical considerations
The study involved non-invasive physiological monitoring conducted during routine hunter training lessons. The rider participant was the student researcher and provided informed assent to participate. Parental permission was obtained before data collection. Permission for physiological monitoring of the horse during routine training sessions was obtained from the horse owner.
Data collection did not alter the normal training program. No additional riding tasks, experimental procedures, restraint, medication, or changes to the horse’s training, handling, or management were introduced for research purposes. Heart-rate monitoring was performed using commercially available Polar heart-rate monitoring systems worn during routine riding activities.
Because this project consisted solely of observational physiological monitoring during routine hunter training without experimental intervention or manipulation, no formal institutional review board (IRB) review was sought. Likewise, no institutional animal ethics or animal welfare review was sought because the study involved only non-invasive physiological monitoring during routine riding and did not modify the horse’s normal training, handling, management, or welfare. No personally identifiable information is included in this manuscript.
Results
Session-level metric availability
The availability of session-level metrics varied across the 11 training sessions according to lesson structure. Ten sessions included canter-based sustained-load measurements. Session 2025-12-23_A did not include a canter phase and therefore had no canter-specific values. Jump-stage metrics were available only for sessions that included jump-work, and jump-event response metrics were calculated only for sessions with annotated jump events that contained complete baseline and response windows (Table 1).
These missing values were not due to analytic failure but reflected differences in routine lesson composition. The longitudinal patterns described below therefore represent observations collected under naturally varying training contexts, ranging from flatwork to over-fences sessions, rather than repeated observations under an identical lesson protocol. The environmental conditions associated with each session are summarized in Supplementary Table S1.
Canter-stage cardiovascular responses
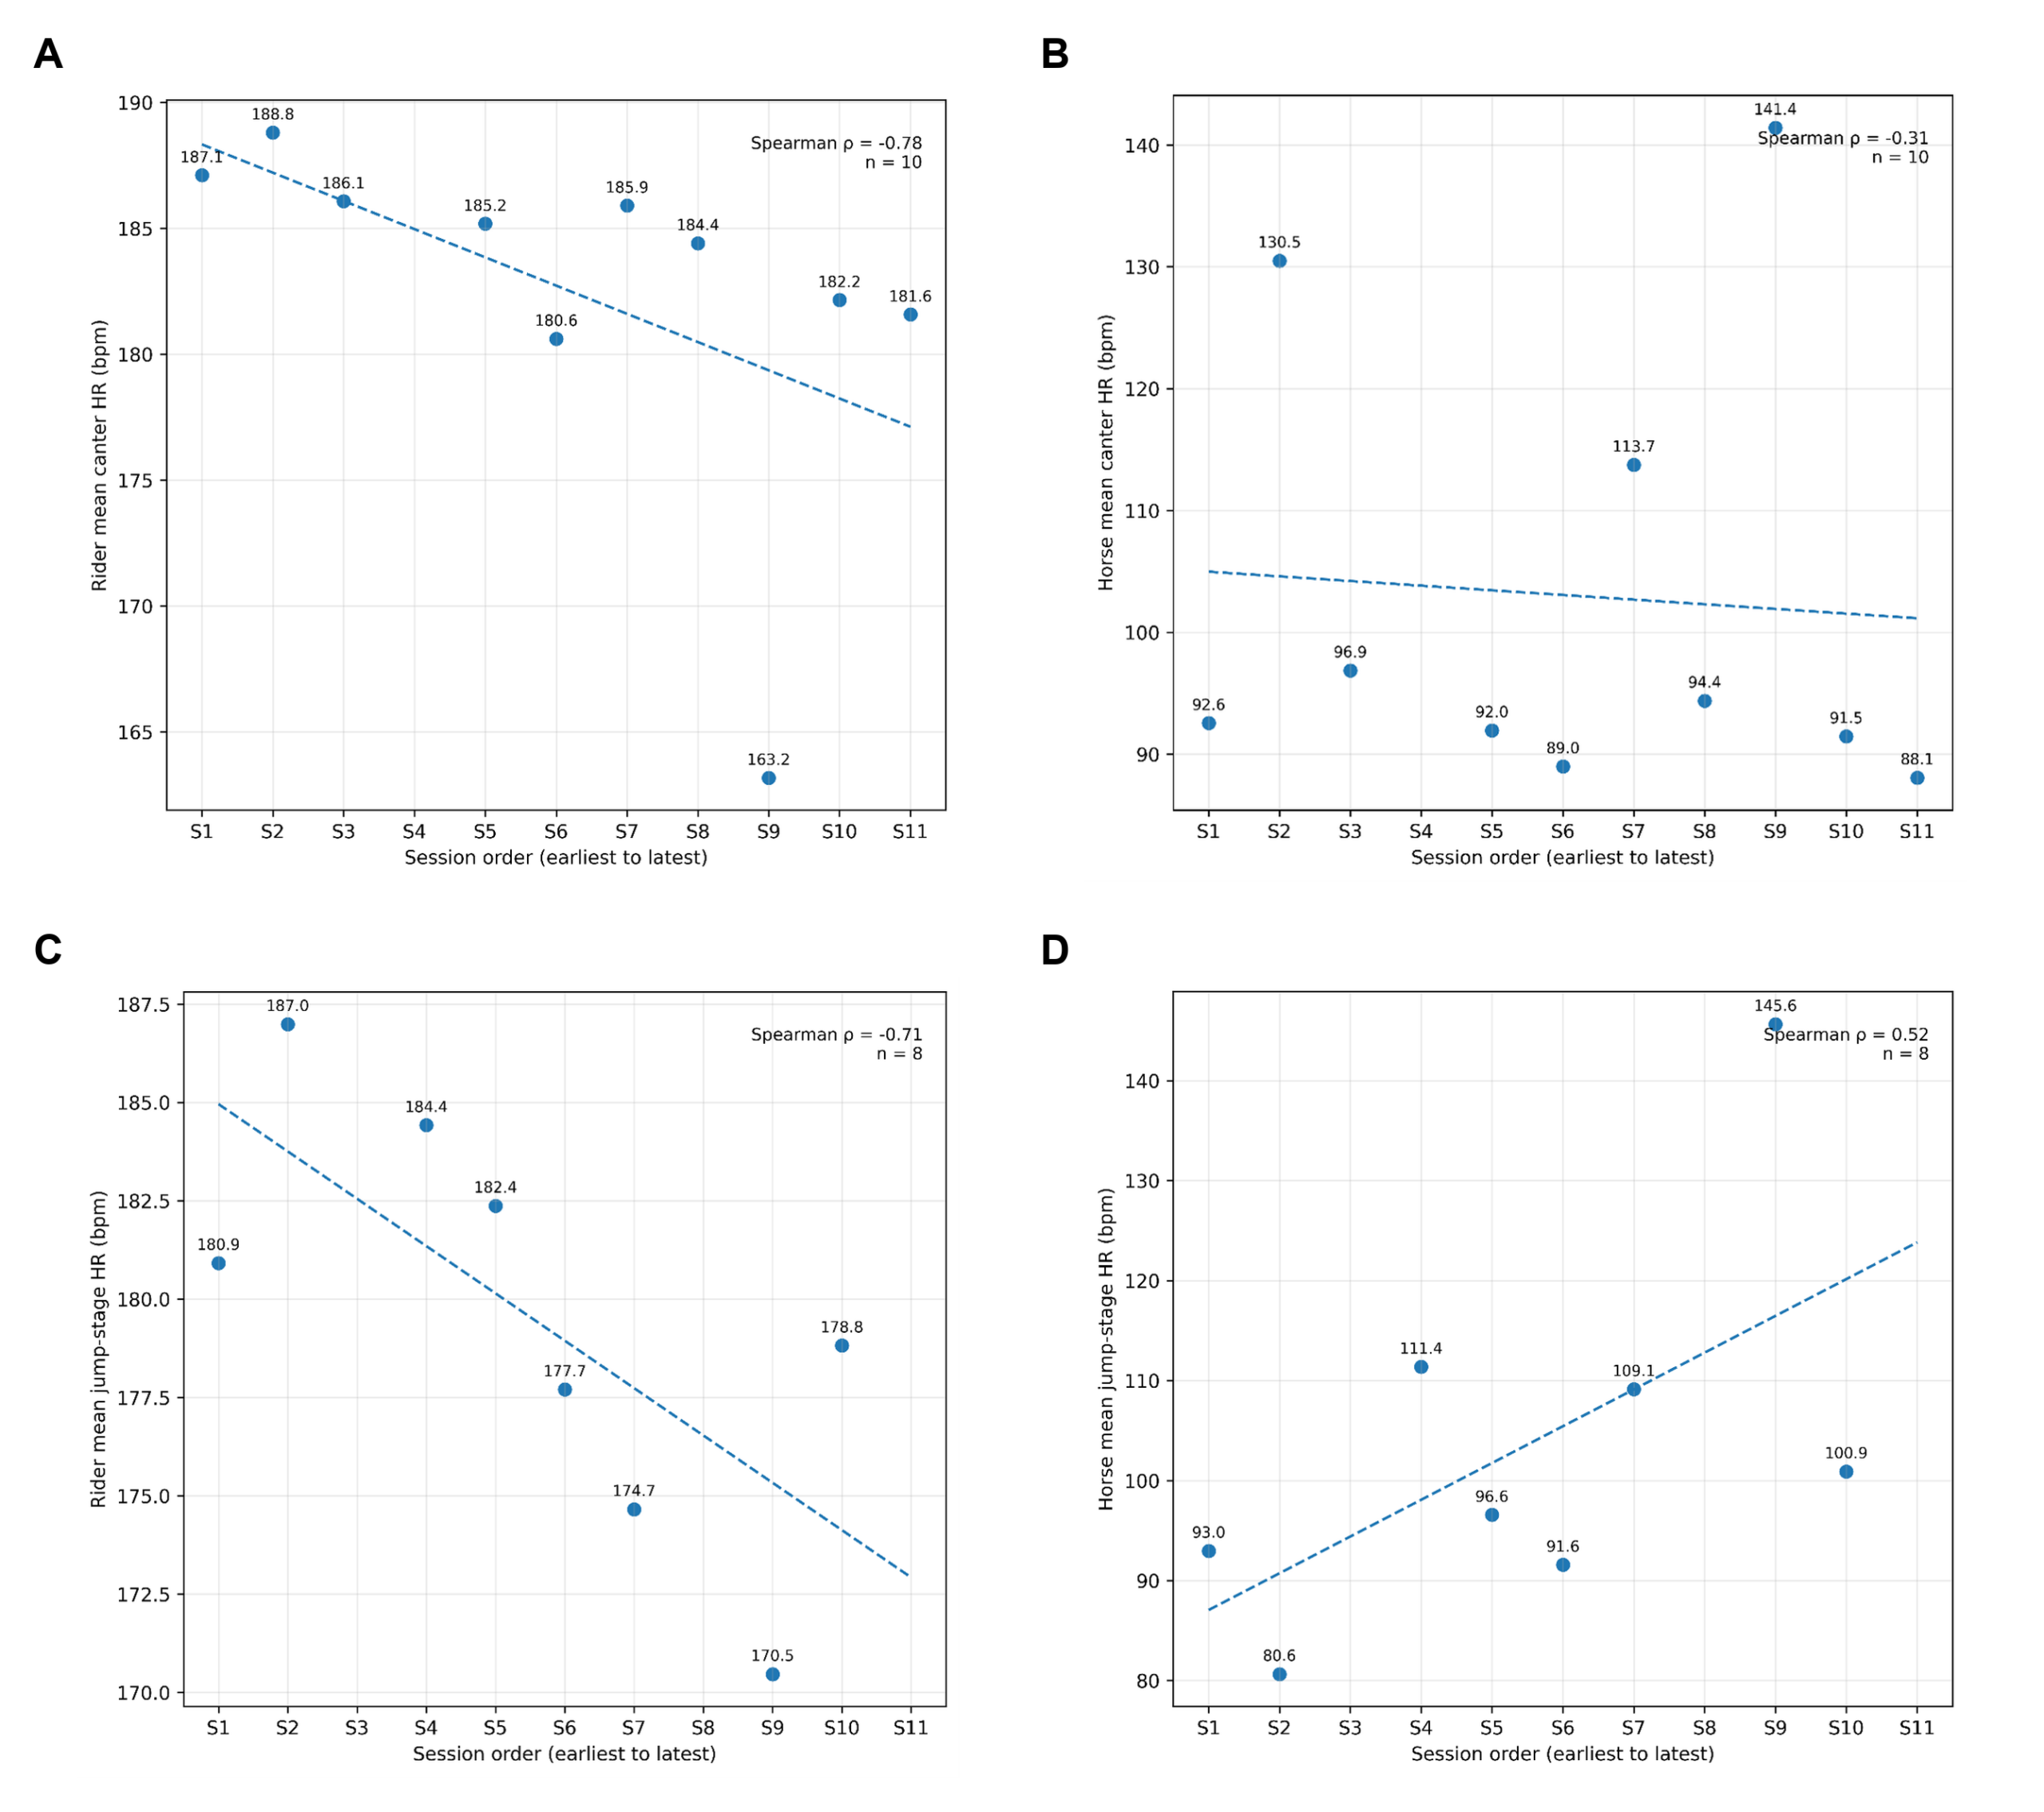
Across the ten sessions with canter activity, rider mean canter HR ranged from 163.2 to 188.8 bpm (overall mean 182.5 bpm) and showed the strongest monotonic association with session order among the examined variables (Spearman ρ = −0.78, n = 10). Rider mean canter HR decreased from 186.8 bpm in the early phase to 179.4 bpm in the later phase (Figure 1A). In contrast, rider peak canter HR remained within a relatively narrow range (184–195 bpm; mean 191.8 bpm).
Horse mean canter HR showed only a weak monotonic association with session order and remained more variable across sessions (Spearman ρ = −0.31, n = 10; Figure 1B).
Jump-stage cardiovascular responses
Jump-work represented the highest cardiovascular demand observed during the training sessions. Across the eight sessions that included jump-work, rider mean jump-stage HR ranged from 170.5to 187 bpm, with an overall mean of 179.5 bpm. Rider mean jump-stage HR showed a negative monotonic association with session order (Spearman ρ = −0.71, n = 8; Figure 1C). Early-to-late comparisons followed the same pattern, with the mean rider jump-stage HR being lower during later sessions than during earlier sessions (Figure 1C). Rider peak jump-stage HR also varied within a relatively narrow range throughout the observation period (194–202 bpm; mean 197.5 bpm).
Across the eight jump-work sessions, horse mean jump-stage HR averaged 103.6 bpm but varied considerably, from 80.6 to 145.6 bpm, showing greater between-session variation than the corresponding rider measure. It had a moderate positive monotonic association with session order (Spearman ρ = 0.52, n = 8; Figure 1D). Horse peak jump-stage HR ranged from 107 to 196 bpm, with a mean of 132.3 bpm.
Event-related Δpeak responses
Across the eleven sessions, rider mean Δpeak ranged from 0.91 to 9.57 bpm (overall mean 5.05 bpm), whereas horse mean Δpeak ranged from 4.10 to 25.77 bpm (overall mean 8.72 bpm). Horse responses were larger in most sessions. Neither rider nor horse mean Δpeak showed a strong monotonic association with session order (rider ρ = −0.08; horse ρ = −0.25; n = 11 for both). Session-level values are reported in Supplementary Table S5.
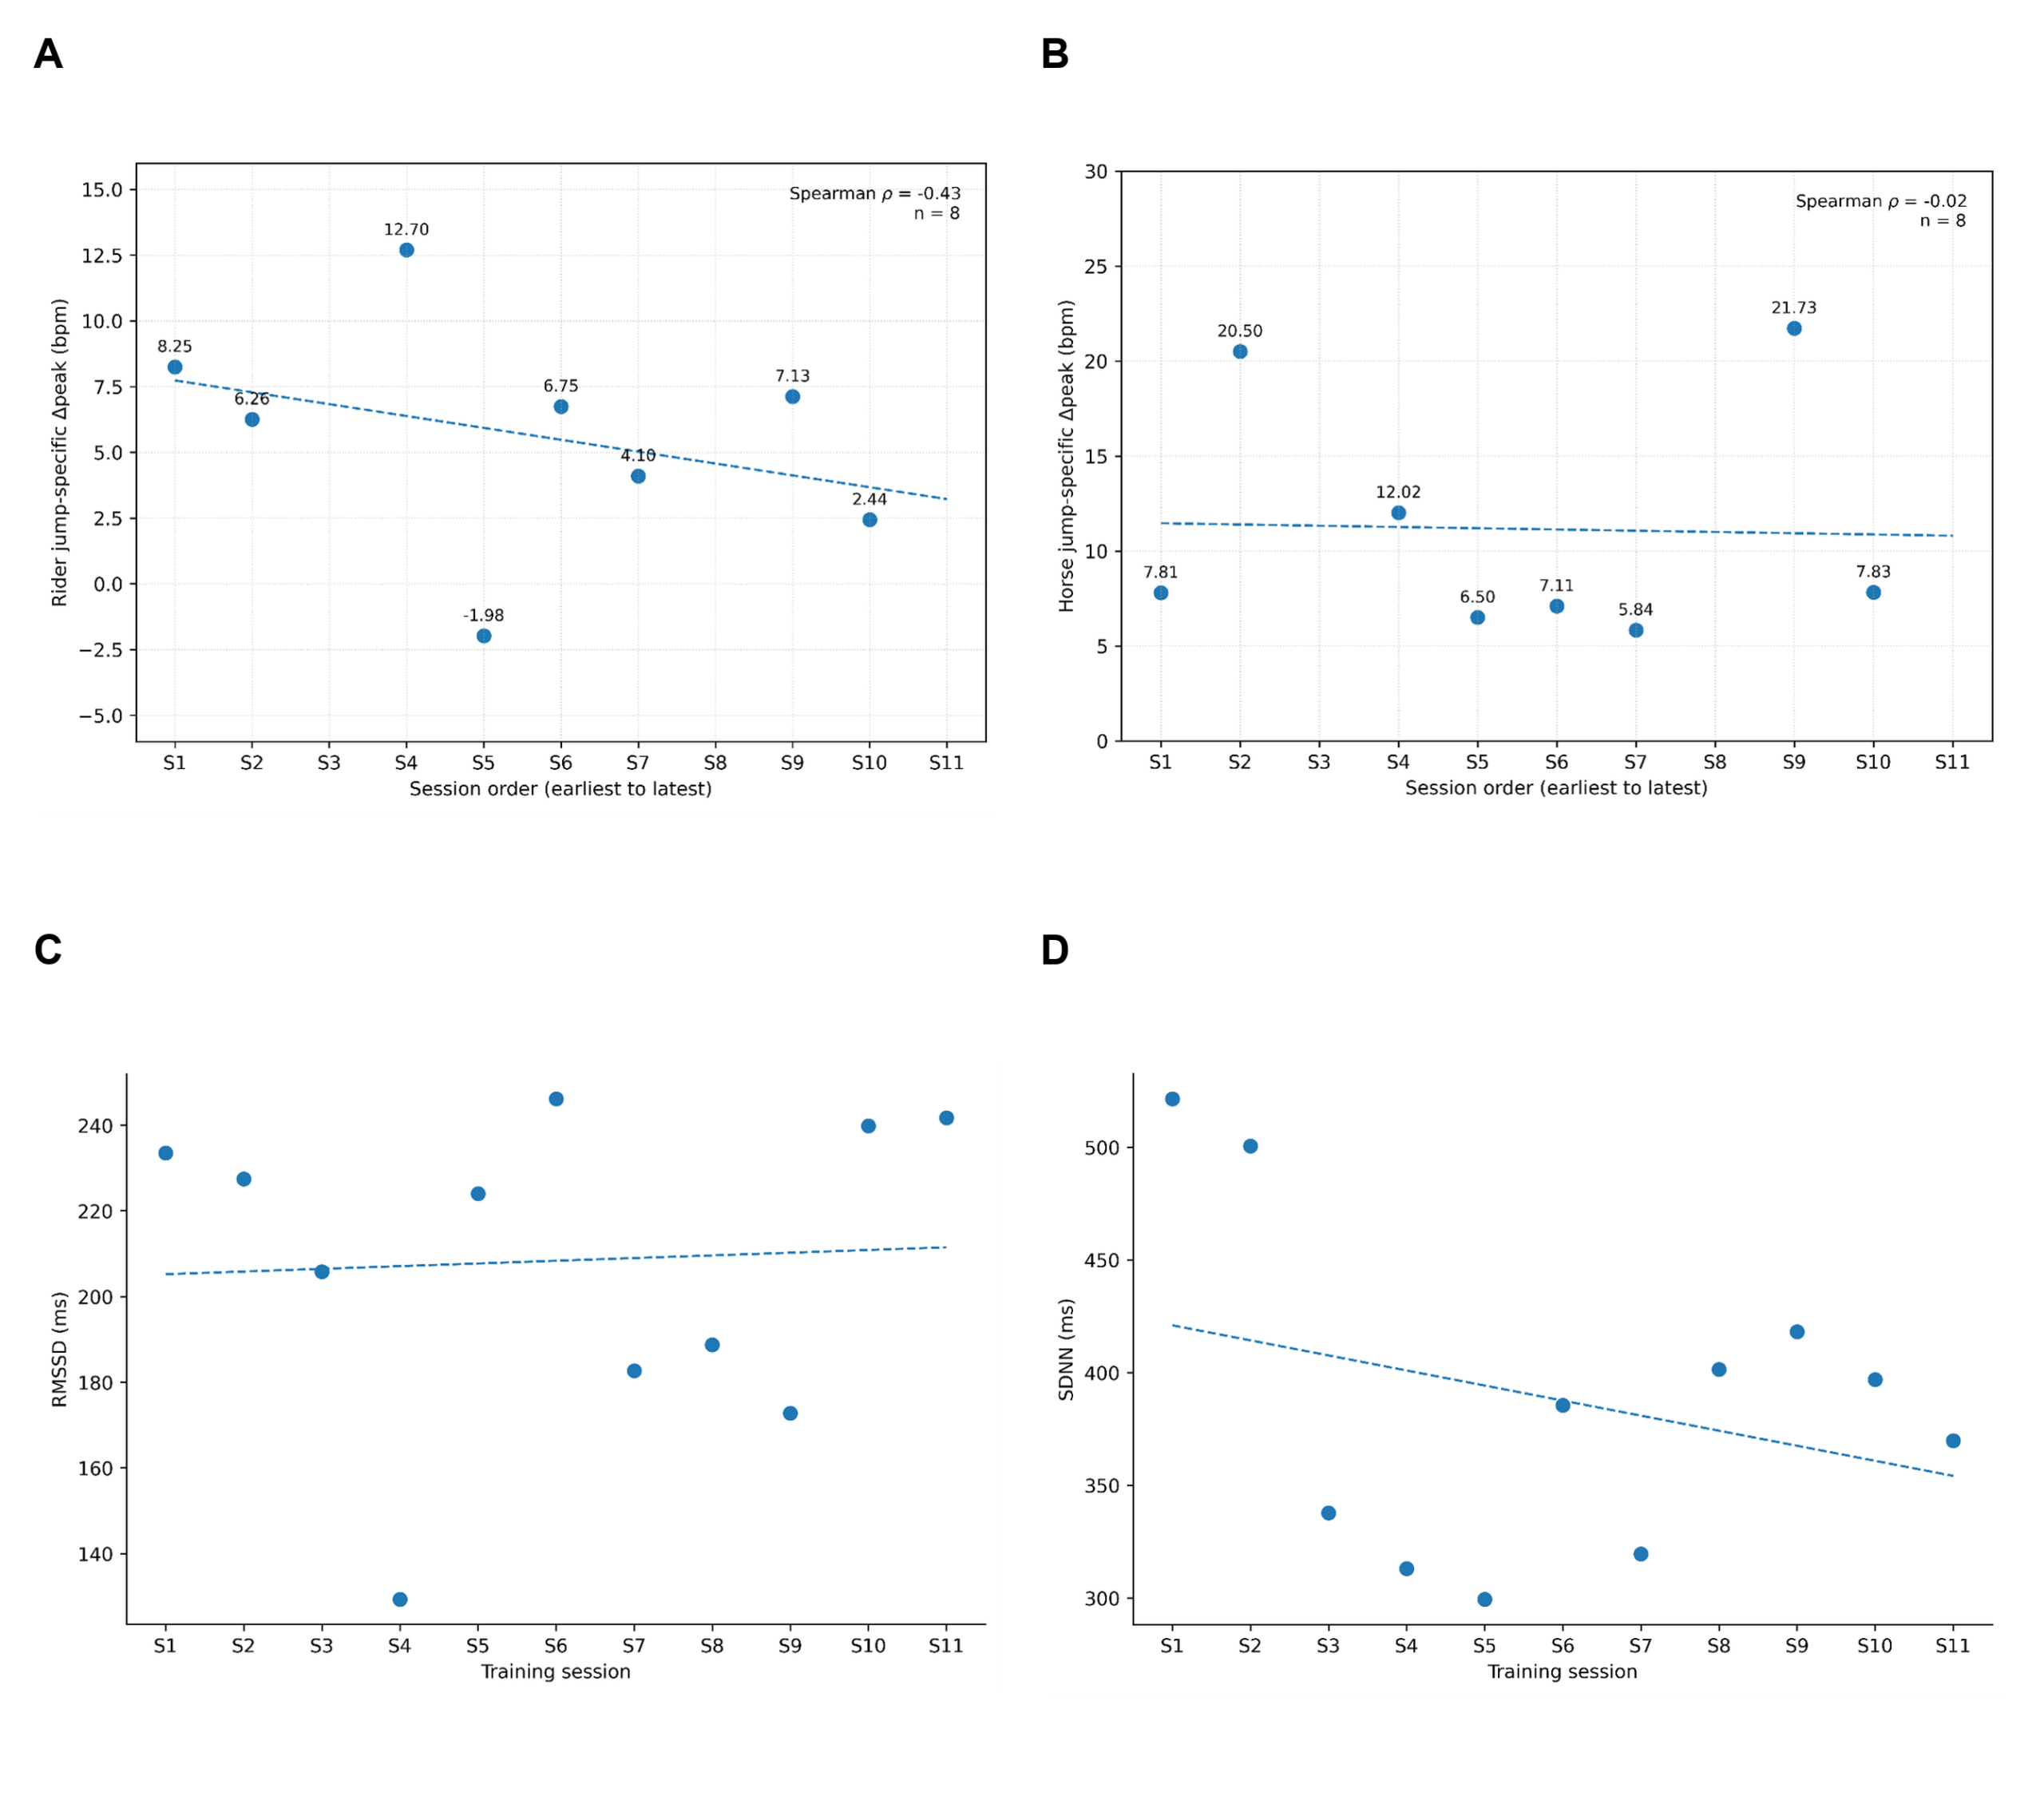
Restricting the event analysis to jump-specific events further highlighted the differences between rider and horse responses. Rider jump-specific Δpeak (available for eight sessions) ranged from −1.98 to 12.70 bpm (overall mean 5.71 bpm) and showed a modest negative monotonic association with session order (Spearman ρ = −0.43, n = 8; Figure 2A).
Compared with canter-stage and jump-stage measures, jump-specific Δpeak responses showed less consistent longitudinal patterns. Horse jump-specific Δpeak ranged from 5.84 to 21.73 bpm (overall mean 11.17 bpm) and showed almost no monotonic association with session order (Spearman ρ = −0.02, n = 8; Figure 2B), while remaining highly variable throughout the observation period.
Sensitivity analyses of jump-specific Δpeak showed that shortening the event windows did not materially alter the overall interpretation (Supplementary Figure S2). Under the primary 30-s baseline/20-s response definition, the association with session order was ρ = −0.43 for the rider and ρ = −0.02 for the horse. Corresponding values were −0.43 and −0.19 using the 15-s/15-s window, and −0.50 and −0.36 using the 10-s/10-s window, respectively. Across the 87 annotated jump events, 74 (85.1%) overlapped with another jump within the primary event window, leaving only 13 non-overlapping jump events distributed across six sessions (Supplementary Table S2). Consequently, restricting the analysis to non-overlapping (“clean”) events substantially reduced the available observations (13 events across six sessions) and produced unstable estimates. This restricted analysis was therefore interpreted as a diagnostic sensitivity assessment rather than as an alternative primary analysis.
For the session on 2025-12-29, the rider jump-specific Δpeak changed from −1.98 bpm under the primary 30-s baseline/20-s response definition to 0.27 bpm and 0.80 bpm using the 15-s/15-s and 10-s/10-s windows, respectively. Inspection of the synchronized event annotations indicated that the original negative value resulted from an elevated baseline carried over from a preceding jump sequence while heart rate was already declining during the subsequent response window, rather than from a paradoxical cardiovascular response to the jump itself.
Horse HRV measures
After application of the predefined multistage RR quality-control workflow, all eleven training sessions met the predefined quality-control criteria for HRV analysis (Table 2). Across the eleven sessions, 1,528–2,416 cleaned NN intervals were retained for whole-session HRV calculation, corresponding to retention rates of 67.4%–80.8%.
Whole-session RMSSD ranged from 129.3 to 246.1 ms and showed no consistent longitudinal trend across the training period (Spearman ρ = 0.109, n = 11; Figure 2C). Likewise, whole-session SDNN ranged from 299.3 to 521.4 ms and showed no consistent longitudinal trend across the training period (Spearman ρ = −0.118, n = 11; Figure 2D).
To evaluate whether the primary HRV findings depended on the use of complete training-session recordings, an additional sensitivity analysis was performed using standardized 5-minute stable walk windows. Nine of the eleven sessions contained eligible continuous walk segments of at least five minutes, whereas two sessions (S2 and S5) did not meet this criterion and were excluded from the sensitivity analysis (Supplementary Table S4). Stable-window RMSSD and SDNN showed no consistent longitudinal trends and produced conclusions comparable to those obtained from the primary whole-session analysis, indicating that the overall interpretation of the HRV results was robust to analysis-window selection.
Overall, horse HRV demonstrated moderate session-to-session variability but no consistent longitudinal trend across the eleven training sessions, and this conclusion remained unchanged in the standardized 5-minute sensitivity analysis.
Discussion
Summary of key findings
Using a task-stratified framework that separated sustained load, peak load, and autonomic regulation, we found that cardiovascular measures did not change in parallel across the observation period. Rider mean HR declined most clearly, particularly during canter, while rider peak HR remained comparatively stable. Horse responses varied more from session to session. Jump-stage HR remained relatively high, but jump-specific Δpeak responses were inconsistent, especially in the horse. Horse HRV also fluctuated without a consistent longitudinal trend. Alternative event windows produced similar results, although frequent overlap between consecutive jumps limited event-specific interpretation. Overall, mean HR, peak HR, Δpeak, and HRV captured different aspects of longitudinal change within the dyad.
Domain-specific physiological patterns
The divergence observed in this study was not limited to differences among physiological domains. It also appeared between the rider and the horse. The clearest directional changes were observed in rider mean HR measures, whereas rider peak HR measures remained comparatively stable and horse responses were generally more variable across sessions. Horse canter HR showed only a weak monotonic association with session order, whereas horse jump-stage HR demonstrated a positive monotonic association together with substantial between-session variability. Jump-specific Δpeak responses likewise remained highly variable across sessions. Occasional negative Δpeak values indicate that, for some annotated events, the maximum HR within the predefined post-event window did not exceed the pre-event baseline. Because the present training sessions included closely spaced obstacles and continuous riding sequences, neighbouring activities may have contributed to the predefined analysis windows.
One cautious interpretation is that the rider exhibited clearer directional decreases in mean HR across repeated training sessions, whereas the horse’s responses remained more closely tied to the specific requirements of individual training situations. Although obstacle characteristics were not formally quantified, these sessions represented the first month of training for a newly established rider–horse dyad, during which lesson content and technical demands were adjusted as part of routine hunter training. Consequently, variation in lesson content and task demands may have partially influenced cardiovascular responses during jump-work, contributing to the greater variability and positive monotonic association observed in horse jump-stage HR. This rider–horse asymmetry is consistent with previous reports indicating that physiological responses may not change in parallel between horses and riders19,20. It further suggests that the dyad may be better understood as two partially independent responding systems rather than as a single fully synchronized unit.
Across domains, the rider showed clearer directional changes than the horse.
HRV and autonomic regulation
Horse HRV provided a different perspective on autonomic regulation from the heart-rate measures. Prior studies have used HR and HRV, together with cortisol measures, to characterize physiological stress responses in sport horses during equestrian competition28. RMSSD and SDNN showed no clear pattern of increase or decrease across sessions, suggesting that autonomic state remained responsive to changing training conditions rather than gradually stabilizing over time.
Unlike the short, relatively stationary recordings commonly used for standard HRV assessment1,2, the HRV indices in the present study were calculated from cleaned normal-to-normal (NN) intervals across each entire training session. Because the HRV analysis included all routine lesson stages—including walk, trot, canter, and jump-work—rather than only high-intensity exercise, the reported RMSSD and SDNN values represent the autonomic characteristics of the complete training session and should not be interpreted as exercise-only HRV measures. HRV estimates are influenced by recording duration and analytical procedures1,2,3, while exercise intensity and recovery conditions also affect equine HRV29. The absolute RMSSD and SDNN values reported here should therefore be interpreted through longitudinal within-horse comparisons rather than compared directly with values derived from short resting recordings.
This interpretation is consistent with previous HRV research, which highlights both the physiological value of these measures and the need for caution when interpreting RR-derived indices in equine field settings, where motion artifact may affect signal quality2,3. In the present study, a predefined multistage RR quality-control workflow—including removal of offline recordings, broad physiological range screening (300–3000 ms), local-median–based artifact detection, and Hampel filtering—was applied before HRV calculation. The physiological range screen served only as an initial exclusion step, whereas the local-median rule and Hampel filtering constituted the primary artifact-detection procedures. Although the same preprocessing workflow was applied to all sessions, residual measurement uncertainty and session-specific differences in signal quality cannot be excluded. The observed HRV variability may therefore reflect a combination of physiological variation and residual measurement effects. Because jump-work stages included the approach, obstacle negotiation, and immediate departure rather than only the instantaneous fence-crossing period, mean jump-stage HR values should not be interpreted as peak heart rates during individual jumps.
A sensitivity analysis using standardized 5-minute stable-walk windows produced comparable descriptive conclusions, and the absence of a consistent HRV trend was not materially altered by the alternative analysis window (Supplementary Table S4).
In the present dataset, HRV showed greater session-to-session variability than the sustained-load measures. Equine HRV is sensitive to recording and preprocessing choices2,3, to jumping, exercise, and recovery context16,29, and to age, activity level, and longer-term training state21,22. Accordingly, session-to-session variability may reflect the broader physiological and activity context of each session rather than the workload of a single annotated phase.
Implications for training monitoring
From a practical perspective, these findings have implications for training-load monitoring in equestrian sport. Whole-session HR averages can mask differences between sustained and peak cardiovascular demands. Field-based HR monitoring has been used to assess training workload in horses30,31. Because track-based exercise and show-jumping courses impose different physiological demands, combining distinct exercise phases into a single session mean may obscure task-specific variation9,10. The results presented here indicate that separating sustained effort from short high-demand events may provide a more informative approach for monitoring physiological responses of both the rider and the horse during repeated training, consistent with prior work using horse HR as a basis for training evaluation and control31. The dyadic framing also underscores that cardiovascular responses in the rider and horse may not always change in parallel, suggesting that monitoring each member of the dyad separately may provide more informative physiological insights19,20.
Limitations and future directions
These implications need to be understood in the light of a number of limitations. The study considered only one rider–horse dyad, was conducted over a limited number of sessions, and had naturally varying lesson structures. In addition, environmental conditions varied among training sessions (Supplementary Table S1). These factors were not included as covariates because of the single-dyad observational design and the limited number of sessions, and their potential influence on cardiovascular responses therefore cannot be excluded. Lesson content was not consistent across sessions; therefore, the observed changes should not be attributed solely to any single factor. There were also some metrics that were unavailable for sessions that did not include the relevant training activity (e.g., jumping or canter). These features reduce the potential for population-level inference but reflect the ecologically valid training conditions that this observational study was intended to capture. Therefore, the longitudinal patterns described here should be interpreted as evidence from this case rather than as general causal or population-level conclusions.
Although the durations of walk, trot, canter, and jump-work were quantified, individual recovery periods between training exercises were not separately annotated. Because these sessions were routine training lessons, fence heights were selected and adjusted by the coach according to lesson needs rather than standardized for research purposes. Individual fence heights were not systematically measured or prospectively recorded during data collection and could not be reliably reconstructed retrospectively; they are therefore reported as not recorded for the relevant sessions in Table 1. In addition, although daily precipitation was included as an environmental variable (Supplementary Table S1), detailed footing characteristics (e.g., surface moisture, sand depth, or recent arena maintenance) were not systematically documented and therefore could not be incorporated into the analyses.
Expanding on these limitations, future studies could apply the same task-stratified analytical framework to larger groups of riders and horses. Comparisons across rider experience, horse training status, and lesson or competition structure may help clarify differences in sustained and peak cardiovascular responses under different training conditions12,16,19,20. More detailed event annotation (e.g., distinguishing technical jumping attempts, transitions, corrections, and coach-directed changes) may further improve interpretation of event-related cardiovascular responses. Extending the observation period and increasing the number of training sessions would also help determine whether the longitudinal patterns observed here persist, plateau, or change over time, as longer training periods may reveal changes in equine cardiac autonomic regulation that are not evident over shorter observations21,32. Future studies could also evaluate alternative baseline and response windows to determine whether different event-window definitions improve characterization of acute cardiovascular responses during routine hunter training.
Closing remarks
Overall, this case study indicates that physiological responses within the rider–horse dyad during repeated hunter training are better characterized by domain-specific patterns than by a single assessment of cardiovascular workload. The task-stratified framework provides a practical approach for interpreting longitudinal change by distinguishing sustained load, peak load, and autonomic regulation. Future studies should examine these patterns across different training settings, rider experience levels, and horse training status.
Data Availability
The datasets generated and analyzed during the current study are not publicly available because they contain identifiable training records and proprietary training annotations. De-identified data may be made available by the corresponding author upon reasonable request for academic research purposes.
Funding
This research received no external funding.
Conflict of Interest
The authors declare no conflict of interest.
Acknowledgments
The author thanks the riding instructor for conducting the training sessions, the horse owner for permitting physiological monitoring, the research mentor for methodological and editorial guidance, and her family for their continued support.
Author Contributions
The author conceived the study, collected the data, performed the analyses, interpreted the results, prepared the figures and tables, and wrote and revised the manuscript.
Supplementary Information
References
- Task Force of the European Society of Cardiology and the North American Society of Pacing and Electrophysiology. Heart rate variability: standards of measurement, physiological interpretation and clinical use. Circulation. Vol. 93, pg. 1043–1065, 1996, https://doi.org/10.1161/01.CIR.93.5.1043. [↩] [↩] [↩] [↩] [↩]
- E. von Borell, J. Langbein, G. Després, S. Hansen, C. Leterrier, J. Marchant-Forde, R. Marchant-Forde, M. Minero, E. Mohr, A. Prunier, D. Valance, I. Veissier. Heart rate variability as a measure of autonomic regulation of cardiac activity for assessing stress and welfare in farm animals—a review. Physiology & Behavior. Vol. 92, pg. 293–316, 2007, https://doi.org/10.1016/j.physbeh.2007.01.007. [↩] [↩] [↩] [↩] [↩] [↩] [↩] [↩] [↩]
- D. Stucke, M. Große Ruse, D. Lebelt. Measuring heart rate variability in horses to investigate the autonomic nervous system activity: pros and cons of different methods. Applied Animal Behaviour Science. Vol. 166, pg. 1–10, 2015, https://doi.org/10.1016/j.applanim.2015.02.007. [↩] [↩] [↩] [↩] [↩] [↩] [↩] [↩]
- M. F. Devienne, C. Y. Guezennec. Energy expenditure of horse riding. European Journal of Applied Physiology. Vol. 82, pg. 499–503, 2000, https://doi.org/10.1007/s004210000207. [↩]
- J. L. Douglas, M. Price, D. M. Peters. A systematic review of physical fitness, physiological demands and biomechanical performance in equestrian athletes. Comparative Exercise Physiology. Vol. 8, pg. 53–62, 2012, https://doi.org/10.3920/CEP12003. [↩]
- G. Sainas, S. Melis, F. Corona, A. Loi, G. Ghiani, R. Milia, F. Tocco, E. Marongiu, A. Crisafulli. Cardio-metabolic responses during horse riding at three different speeds. European Journal of Applied Physiology. Vol. 116, pg. 1985–1992, 2016, https://doi.org/10.1007/s00421-016-3450-7. [↩]
- C. O’Reilly, J. Zoller, D. Sigler, M. Vogelsang, J. Sawyer, J. Fluckey. Rider energy expenditure during high-intensity horse activity. Journal of Equine Veterinary Science. Vol. 102, pg. 103463, 2021, https://doi.org/10.1016/j.jevs.2021.103463. [↩]
- R. J. Williams, R. E. Chandler, D. J. Marlin. Heart rates of horses during competitive dressage. Comparative Exercise Physiology. Vol. 6, pg. 7–15, 2009, https://doi.org/10.1017/S1478061509303679. [↩]
- R. Léguillette, S. L. Bond, K. Lawlor, T. de Haan, L. M. Weber. Comparison of physiological demands in Warmblood show jumping horses over a standardized 1.10 m jumping course versus a standardized exercise test on a track. BMC Veterinary Research. Vol. 16, pg. 182, 2020, https://doi.org/10.1186/s12917-020-02400-9. [↩] [↩] [↩]
- K. Kirsch, C. Fercher, S. Horstmann, C. von Reitzenstein, J. Augustin, H. Lagershausen. Monitoring performance in show jumping horses: validity of non-specific and discipline-specific field exercise tests for a practicable assessment of aerobic performance. Frontiers in Physiology. Vol. 12, pg. 818381, 2022, https://doi.org/10.3389/fphys.2021.818381. [↩] [↩] [↩]
- A. M. Liedtke, H. Meijer, S. Horstmann, C. von Reitzenstein, I. Rump, K. Kirsch. Modelling energy demands of cross-country tests in 2-star to 5-star eventing competitions. Animals. Vol. 15, pg. 1775, 2025, https://doi.org/10.3390/ani15121775. [↩] [↩]
- C. Szabó, Z. Vizesi, A. Vincze. Heart rate and heart rate variability of amateur show jumping horses competing on different levels. Animals. Vol. 11, pg. 693, 2021, https://doi.org/10.3390/ani11030693. [↩] [↩] [↩] [↩]
- C. M. Kapteijn, T. Frippiat, C. van Beckhoven, H. A. van Lith, N. Endenburg, E. Vermetten, T. B. Rodenburg. Measuring heart rate variability using a heart rate monitor in horses (Equus caballus) during groundwork. Frontiers in Veterinary Science. Vol. 9, pg. 939534, 2022, https://doi.org/10.3389/fvets.2022.939534. [↩] [↩]
- J. A. Lipponen, M. P. Tarvainen. A robust algorithm for heart rate variability time series artefact correction using novel beat classification. Journal of Medical Engineering & Technology. Vol. 43, pg. 173–181, 2019, https://doi.org/10.1080/03091902.2019.1640306. [↩]
- T. Art, H. Amory, D. Desmecht, P. Lekeux. Effect of show jumping on heart rate, blood lactate and other plasma biochemical values. Equine Veterinary Journal Supplement. Vol. 9, pg. 78–82, 1990, https://doi.org/10.1111/j.2042-3306.1990.tb04740.x. [↩]
- T. Wonghanchao, O. Huangsaksri, K. Sanigavatee, C. Poochipakorn, S. Chanprame, S. Wongkosoljit, W. Chotiyothin, N. Rattanayanon, R. Kiawwan, M. Chanda. Autonomic regulation in athletic horses repetitively participating in two novice jumping classes on consecutive days. Frontiers in Veterinary Science. Vol. 11, pg. 1456733, 2024, https://doi.org/10.3389/fvets.2024.1456733. [↩] [↩] [↩] [↩]
- A. L. Callara, C. Scopa, L. Contalbrigo, A. Lanatà, E. P. Scilingo, P. Baragli, A. Greco. Unveiling directional physiological coupling in human-horse interactions. iScience. Vol. 27, pg. 110857, 2024, https://doi.org/10.1016/j.isci.2024.110857. [↩]
- A. Lanatà, A. Guidi, G. Valenza, P. Baragli, E. P. Scilingo. Quantitative heartbeat coupling measures in human–horse interaction. Proceedings of the 2016 38th Annual International Conference of the IEEE Engineering in Medicine and Biology Society (EMBC). pg. 2696–2699, 2016, https://doi.org/10.1109/EMBC.2016.7591286. [↩]
- N. Ille, M. von Lewinski, R. Erber, M. Wulf, J. Aurich, E. Möstl, C. Aurich. Effects of the level of experience of horses and their riders on cortisol release, heart rate and heart-rate variability during a jumping course. Animal Welfare. Vol. 22, pg. 457–465, 2013, https://doi.org/10.7120/09627286.22.4.457. [↩] [↩] [↩] [↩]
- M. von Lewinski, S. Biau, R. Erber, N. Ille, J. Aurich, J. M. Faure, E. Möstl, C. Aurich. Cortisol release, heart rate and heart rate variability in the horse and its rider: different responses to training and performance. The Veterinary Journal. Vol. 197, pg. 229–232, 2013, https://doi.org/10.1016/j.tvjl.2012.12.025. [↩] [↩] [↩] [↩]
- T. Wonghanchao, K. Sanigavatee, C. Poochipakorn, O. Huangsaksri, M. Chanda. Dynamic adaptation of heart rate and autonomic regulation during training and recovery periods in response to a 12-week structured exercise programme in untrained adult and geriatric horses. Animals. Vol. 15, pg. 1122, 2025, https://doi.org/10.3390/ani15081122. [↩] [↩] [↩]
- T. Wonghanchao, K. Sanigavatee, S. Petchdee, K. Chettaratanont, T. Thongyen, B. Wanichayanon, C. Poochipakorn, M. Chanda. Heart rate and heart rate variability are affected by age and activity level in athletic horses. Veterinary Sciences. Vol. 12, pg. 624, 2025, https://doi.org/10.3390/vetsci12070624. [↩] [↩]
- E. W. Siegers, J. I. M. Parmentier, M. M. Sloet van Oldruitenborgh-Oosterbaan, C. Munsters, F. M. Serra Bragança. Gait kinematics at trot before and after repeated ridden exercise tests in young Friesian stallions during a fatiguing 10-week training program. Frontiers in Veterinary Science. Vol. 12, pg. 1456424, 2025, https://doi.org/10.3389/fvets.2025.1456424. [↩]
- M. Schaffarczyk, B. Rogers, R. Reer, T. Gronwald. Validity of the Polar H10 sensor for heart rate variability analysis during resting state and incremental exercise in recreational men and women. Sensors. Vol. 22, pg. 6536, 2022, https://doi.org/10.3390/s22176536. [↩]
- N. Ille, R. Erber, C. Aurich, J. Aurich. Comparison of heart rate and heart rate variability obtained by heart rate monitors and simultaneously recorded electrocardiogram signals in non-exercising horses. Journal of Veterinary Behavior. Vol. 9, pg. 341–346, 2014, https://doi.org/10.1016/j.jveb.2014.07.006. [↩]
- M. Bazzano, E. Giudice, M. Rizzo, F. Congiu, A. Zumbo, F. Arfuso, S. Di Pietro, D. Bruschetta, G. Piccione. Application of a combined global positioning and heart rate monitoring system in jumper horses during an official competition: a preliminary study. Acta Veterinaria Hungarica. Vol. 64, pg. 189–200, 2016, https://doi.org/10.1556/004.2016.019. [↩]
- E. Barrey, J. P. Valette. Exercise-related parameters of horses competing in show jumping events ranging from a regional to an international level. Annales de Zootechnie. Vol. 42, pg. 89–98, 1993, https://doi.org/10.1051/animres:19930110. [↩]
- M. Becker-Birck, A. Schmidt, J. Lasarzik, J. Aurich, E. Möstl, C. Aurich. Cortisol release and heart rate variability in sport horses participating in equestrian competitions. Journal of Veterinary Behavior. Vol. 8, pg. 87–94, 2013, https://doi.org/10.1016/j.jveb.2012.05.002. [↩]
- A. Hammond, W. Sage, M. J. Hezzell, S. Smith, S. H. Franklin, K. J. Allen. Heart rate variability during high-speed treadmill exercise and recovery in Thoroughbred racehorses presented for poor performance. Equine Veterinary Journal. Vol. 55, pg. 727–737, 2023, https://doi.org/10.1111/evj.13908. [↩] [↩]
- J. K. Kingston, G. M. Soppet, C. W. Rogers, E. C. Firth. Use of a global positioning and heart rate monitoring system to assess training load in a group of Thoroughbred racehorses. Equine Veterinary Journal Supplement. Vol. 36, pg. 106–109, 2006, https://doi.org/10.1111/j.2042-3306.2006.tb05523.x. [↩]
- J. M. Aerts, F. Gebruers, E. Van Camp, D. Berckmans. Controlling horse heart rate as a basis for training improvement. Computers and Electronics in Agriculture. Vol. 64, pg. 78–84, 2008, https://doi.org/10.1016/j.compag.2008.05.001. [↩] [↩]
- Z. Nyerges-Bohák, R. M. Hegedüs, G. Bodó, N. Solymosi, P. Kabai, J. Reiczigel. Heart rate variability before and after 14 weeks of training in Thoroughbred horses and Standardbred trotters with different training experience. PLOS ONE. Vol. 16, pg. e0259933, 2021, https://doi.org/10.1371/journal.pone.0259933. [↩]