
Abstract
Network structure can alter how rapidly misinformation-like contagion spreads and which nodes are most valuable to protect. This study compared susceptible-infected-recovered-type diffusion on 1,000-node Erdős-Rényi (ER), Watts-Strogatz (WS), and Barabási-Albert (BA) networks. One hundred graph realizations per topology were analyzed without intervention, and eight structural-immunization strategies were tested at 1%, 5%, and 10% coverage: random, degree, approximate betweenness, PageRank, eigenvector, k-core, static collective influence, and community-bridge placement. The model separately recorded active-spreader area under the curve (AUC), unique directly exposed nodes, and infected-susceptible contact attempts. BA networks reached 10% and 50% infected fastest, ER networks were intermediate, and WS networks were slowest. Topology effects were large for time to 10% and 50% infection (η² = 0.739 and 0.918), but active-spreader AUC and total exposure attempts were not significant after Holm adjustment in the saturated baseline. At 5% coverage, strategy effects on final size were large in BA networks (partial η² = 0.845), moderate in ER networks (0.178), and smaller in WS networks (0.107). In BA networks, degree placement reduced mean final size from 0.942 under random placement to 0.886 and reduced exposure attempts by 11.6%; at 10% coverage, PageRank produced the smallest mean final size (0.752). Expanded sweeps showed that these rankings were regime-dependent. At β = 0.02, all tested topology-aware strategies prevented BA runs from reaching 50% infection, whereas 85% of random-placement runs reached that threshold. A further sweep crossing clustering, modularity, network size, and initial spreader count with all eight strategies found a persistent top-performing strategy in only 2 of 13 tested combinations, showing that ranking conditionality extends beyond transmission regime to structural and seed-count parameters. Heterogeneous sharing behavior changed the identity of the best strategy but preserved a clear targeting advantage in BA networks. These simulations support a robust conclusion about topology and diffusion speed, but only a conditional conclusion about intervention ranking. The intervention is structural immunization, not operational fact-checking, and the findings are limited to synthetic, static, undirected networks.
Keywords: misinformation diffusion, network topology, structural immunization, influence minimization, network intervention, computational simulation.
Introduction
False and misleading information travels through connections among accounts, groups, and information sources. False news has been observed to diffuse farther and faster than truthful news on Twitter1. Polarization and homogeneous community structure are associated with misinformation cascades2, while echo chambers have been documented more broadly across social-media information environments3. Social bots can disproportionately amplify low-credibility material4. Exposure to and sharing of low-credibility or untrustworthy content were concentrated among relatively small fractions of users5,6,7. At the broader information-ecosystem level, news represented a limited share of total media consumption among U.S. participants8. The aggregate impact of misleading content can also depend jointly on exposure and persuasive effect; on Facebook, unflagged vaccine-skeptical content had a substantially greater estimated impact on vaccine hesitancy than fact-checker-flagged misinformation9. These observations make misinformation simultaneously a content, behavioral, and network problem.
Network topology determines the paths available to a cascade. Random, small-world, and preferential-attachment models isolate degree homogeneity, clustering with shortcuts, and hub concentration, respectively10,11,12. Controlled graph models cannot reproduce every feature of a platform, but they allow structural properties to be varied while the diffusion rule remains fixed. Empirical studies document polarized communities and echo-chamber structure in online information environments2,3, while controlled experiments show that network clustering and reinforcing contacts can alter social diffusion13. Platform environments may additionally include directed and weighted interactions, recommendation systems, and temporal activity.
The network-intervention literature provides several competing rules for selecting important nodes. Degree targeting explicitly prioritizes connectivity14, while acquaintance immunization implicitly favors more highly connected nodes15; betweenness identifies nodes lying on many shortest paths16,17; PageRank assigns importance recursively through links from other important nodes18, while eigenvector centrality assigns greater centrality to nodes connected to other central nodes19; k-core identifies deeply embedded nodes20; and collective influence targets optimal-percolation structure21. Recent misinformation-minimization studies have also examined group disbanding, competing corrective campaigns, concern minimization, efficient truth-seed selection, and topology-aware search-space reduction22,23,24,25,26. Influence-optimization methods are defined relative to a specified network, diffusion model, seed set, and objective27; accordingly, no rule was assumed to dominate in every condition.
Operational fact-checking differs fundamentally from node immunization. Corrections are delayed, visibility is incomplete, users vary in acceptance, and corrective content may propagate as a competing cascade22,25. Accuracy prompts and inoculation can improve discernment or sharing decisions28,29,30,31, while professional fact-checking can improve belief accuracy32. These behavioral effects are not equivalent to permanently removing a node from diffusion. Moreover, an experiment with large-language-model-generated fact-check messages found that such messages could reduce headline discernment in some conditions33. The present study therefore uses the term structural immunization. Protected nodes are permanently non-susceptible barriers. This design represents an idealized preventive upper bound, not a direct model of professional fact-checking.
The primary question was how network topology affects misinformation spread speed. The first hypothesis was that BA networks would reach cumulative infection thresholds fastest because hubs provide short routes to many nodes, while WS networks would spread more slowly because local clustering can delay movement between neighborhoods. The secondary question was how topology changes the value of structural-immunization strategies. The second hypothesis was that topology-aware placement would outperform random placement most strongly in BA networks. The study also tests whether these conclusions survive near-threshold diffusion, alternative network parameters, nonrandom seed placement, and heterogeneous sharing behavior. Table 1 positions this design relative to empirical diffusion, behavioral correction, and influence-minimization research.
Relationship to Previous Studies
| Study | Network or data | Diffusion or intervention | Relevance to this study |
| Del Vicario et al.2 | Facebook interactions | Empirical cascades and polarization | Motivates community-sensitive diffusion. |
| Vosoughi et al.1 | Twitter cascades | Empirical true-versus-false diffusion | Motivates speed and reach outcomes. |
| Pastor-Satorras and Vespignani14 | Synthetic heterogeneous networks | Targeted immunization | Predicts strong hub-targeting effects. |
| Budak et al.22 | Directed social networks | Competing limiting campaign | Represents a more realistic correction mechanism than immunity. |
| Kitsak et al.20 | Synthetic and empirical networks | k-shell spreader ranking | Motivates k-core comparison. |
| Morone and Makse21 | Complex networks | Collective influence and optimal percolation | Motivates structural dismantling strategy. |
| Pennycook et al.28,29 | Online experiments | Accuracy prompts | Shows behavioral interventions differ from structural immunity. |
| Present study | Matched ER, WS, and BA graphs | Eight structural-immunization rules plus sensitivity analyses | Separates topology, direct exposure, mechanism, heterogeneity, and computational cost. |
| Zhu et al.23; Ni et al.24 | Directed social networks | Group disbanding and concern minimization | Recent network-based misinformation-control formulations. |
| DeVerna et al.33 | Randomized online experiment | LLM-generated fact checks | Shows automated fact checking can create unintended effects. |
| Ghoshal et al.26 | Empirical and synthetic networks | Topology-based misinformation minimization | Recent topology-aware comparison relevant to external validity. |
Methods
Experimental Design
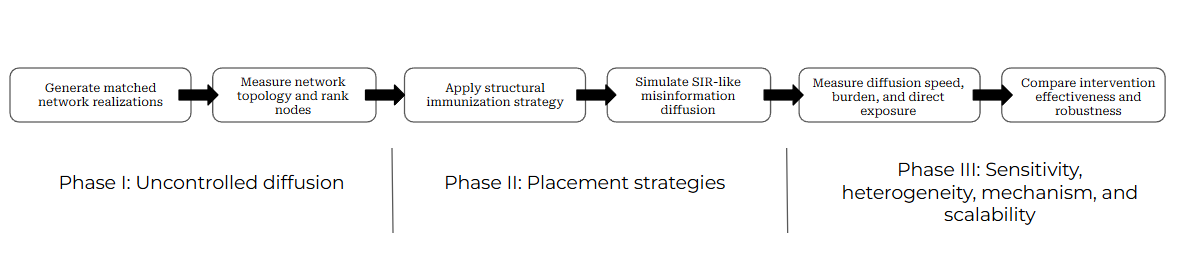
The study used three phases, summarized in Figure 1 and Table 2. Phase I compared uncontrolled diffusion across ER, WS, and BA networks. Phase II evaluated eight node-selection strategies at three coverage levels. Phase III tested sensitivity to diffusion parameters, network structure, seed placement, behavioral heterogeneity, and network size. The primary design used 100 graph realizations per topology. Each intervention strategy and coverage level was evaluated on the same set of graph realizations, creating graph-matched repeated measures. Diffusion random seeds differed across conditions, so matching controlled graph structure rather than every random transmission event. Abbreviations are listed in Supplementary Table S1..
Network Generation and Parameter Rationale
Every primary graph contained N = 1,000 nodes and mean degree near six. ER graphs used the Gilbert G(n,p) formulation-the equal-probability G(n,p) model is due to Gilbert and is conventionally termed Erdős-Rényi, whose original construction instead fixed the total edge count-with each possible edge included independently at probability p = 6/(N – 1)10. WS graphs used k = 6 nearest neighbors and rewiring probability 0.1011, and BA graphs used attachment parameter m = 3, producing mean degree near six12. The baseline used five initial spreaders, transmission probability β = 0.15 per infected-susceptible edge per time step, recovery probability γ = 0.05 per active spreader per step, and a 500-step limit. The SIR-like form follows network epidemic research34. The transmission-to-recovery ratio was also benchmarked against the quenched mean-field epidemic threshold for each topology, λc = 1/Λmax, where Λmax is the largest adjacency-matrix eigenvalue. Over 20 matched realizations at the primary structural settings, mean Λmax was 13.90 (SD = 0.62) in BA, 7.16 (SD = 0.12) in ER, and 6.15 (SD = 0.01) in WS, giving λc of 0.072, 0.140, and 0.163 respectively. At β = 0.15, the effective ratio (β/γ)/λc was 41.7 in BA, 21.5 in ER, and 18.5 in WS, placing all three topologies far above threshold and accounting for the near-saturation reported in Results. At β = 0.02, the ratio fell to 5.6 in BA, 2.9 in ER, and 2.5 in WS: every topology remained supercritical, but WS sat closest to its own threshold because its narrower, more homogeneous degree distribution yields a smaller Λmax, while hub-driven Λmax kept BA furthest above threshold even at the lowest tested β. This threshold-relative view, rather than a single borrowed rate pair, predicts the BA-ER-WS ordering observed near threshold directly from graph structure rather than merely describing it after the fact (Near-Threshold Regimes Changed Practical Conclusions section; the same ordering held under the additional structural variations in Supplementary Table S15). Prior epidemic-style misinformation modeling provides additional context for the order of magnitude of these parameters: Govindankutty and Gopalan modeled misinformation spread with a multi-compartment formulation in which the infection-type rate generally exceeds the recovery-type rate, consistent with misinformation propagating faster than it is corrected35, though those continuous-time, compartment-specific parameters are not directly interchangeable with the discrete per-edge probabilities used here, and no single empirically transferable β or γ exists for online misinformation because values depend on platform, content, observation window, and the meaning assigned to one simulation step. The primary β = 0.15 and γ = 0.05 values were therefore selected as a threshold-relative, high-transmission stress-test regime rather than a platform estimate. To prevent the conclusions from depending on this single pair, the study also evaluated β values from 0.005 to 0.15 and γ values of 0.05 and 0.10. The 500-step cap exceeded the longest observed primary run by a wide margin, while 1%, 5%, and 10% coverage were selected to represent low, moderate, and comparatively high resource budgets. Structural sensitivity varied network size among 500, 1,000, and 2,000 nodes; mean degree among 4, 6, and 10; Watts-Strogatz rewiring probability among 0.01, 0.10, and 0.50; Barabási-Albert attachment parameter among 2, 3, and 5; and mixing in a four-block stochastic block model (SBM) among 0.02, 0.10, and 0.30, each with 20 matched realizations per topology (Supplementary Table S15). Initial spreaders were selected randomly, from high-degree nodes, from bridge-like nodes, or from low-degree peripheral nodes (Supplementary Figure S3), and initial spreader count was varied among 1, 5, and 10 at β = 0.15 and at a near-threshold β = 0.02 (Supplementary Table S17). These baseline-diffusion extension families are interpreted as robustness analyses of uncontrolled spread rather than replacements for the 100-realization primary experiment (Supplementary Table S4). To test whether intervention rankings, not only the timing of uncontrolled diffusion, are stable under alternative structural parameters, a second sweep crossed Watts-Strogatz rewiring (0.01, 0.10, 0.50), stochastic-block-model mixing (0.02, 0.05, 0.15, 0.30), initial spreader count (1, 5, 10), and network size (500, 2,000) with all eight structural-immunization strategies at 5% coverage, at β = 0.15 and β = 0.02, using 20 matched realizations per setting (Supplementary Table S16; Supplementary Figure S7).
| Design element | Primary setting | Extension or rationale |
| Graph realizations | 100 per ER, WS, and BA topology | 20 per sensitivity setting. |
| Network size and density | N = 1,000; mean degree about 6 | N = 500, 1,000, 2,000; mean degree = 4, 6, 10. |
| Diffusion parameters | β = 0.15; γ = 0.05; five seeds | β = 0.005-0.15; γ = 0.05 or 0.10; 1, 5, or 10 seeds. |
| Coverage | 1%, 5%, and 10% | Same fractions across all primary strategies. |
| Primary records | 300 baseline; 7,200 intervention | Additional robustness, heterogeneity, and structural records in supplement. |
| Interpretive scope | Static, undirected, unweighted synthetic graphs | No claim of direct platform deployment or empirical calibration. |
| Structural and seed-count × strategy sensitivity | Not tested in primary design | 8 strategies × 5% coverage crossed with WS rewiring, SBM mixing, seed count (1, 5, 10), and N (500, 2,000) at β = 0.15 and 0.02 (Supplementary Tables S15-S17; Supplementary Figure S7). |
Diffusion Process and Exposure Measurement
Nodes began susceptible, infected, or recovered. Protected nodes were placed in the recovered state before seeds were selected and could never become infected. At each synchronous step, every active spreader attempted transmission to every neighbor that was susceptible at the beginning of the step. Each contact was one exposure attempt. A susceptible node receiving at least one such contact was counted as uniquely exposed, whether or not infection occurred. A successful transmission changed the target state at the end of the step. Each active spreader recovered independently with probability γ. Recovered nodes no longer transmitted.
Time to 10% and time to 50% measured when the cumulative number ever infected first crossed each fraction of all nodes. Peak active spreaders measured the maximum concurrently infected count. Final outbreak size was the fraction ever infected. Active-spreader AUC was the sum of active spreaders over time and therefore measured time-integrated transmitting burden, not exposure. Unique directly exposed fraction counted nodes receiving at least one infected-susceptible contact attempt. Total exposure attempts counted all such contacts, including repeated contacts to the same susceptible node. Trials that did not reach a threshold were recorded as censored for threshold analysis rather than assigned a time of zero. Detailed definitions and interpretive cautions are provided in Supplementary Table S3.
Structural-Immunization Strategies
Random placement used a uniformly randomized node ordering. Degree ranked nodes by direct connections. Approximate betweenness used 100 sampled source nodes to estimate shortest-path centrality. PageRank used damping parameter 0.85. Eigenvector centrality used power iteration. k-core ranked nodes by core number. Static collective influence used the radius-two collective-influence score on the intact graph; unlike the full adaptive dismantling algorithm, scores were not recomputed after every removal. Community-bridge placement detected greedy-modularity communities and ranked nodes by cross-community degree with total degree used for tie breaking. Coverage sets were nested within each ranking, so the 1% set was contained within the 5% and 10% sets.
Behavioral Heterogeneity and Structural Mechanisms
The homogeneous model assigned every active spreader the same transmission probability. Three extensions multiplied β by node-specific sharing propensities: moderate and strong lognormal heterogeneity, and a degree-correlated condition in which higher-degree nodes tended to have larger multipliers. Multipliers were normalized to mean one so that average transmission pressure remained comparable. Structural mechanism measures included the size of the largest remaining connected component, number of components, fraction of incident edges blocked by protected nodes, cross-community edges blocked, and an approximate post-removal path length based on a fixed node sample (Supplementary Figures S2 and S4).
Statistical Analysis
Baseline topology differences were tested with one-way analysis of variance (ANOVA) for eight outcomes. η² quantified effect size, and Holm adjustment controlled familywise error. Welch ANOVA and Kruskal-Wallis tests were reported as robustness checks when variance or distributional assumptions were questionable (Supplementary Table S6). At 5% and 10% coverage, one-factor repeated-measures ANOVA compared the eight strategies within each topology, with graph realization as the subject and partial η² as effect size. Because sphericity was not assumed, Greenhouse-Geisser-adjusted p values were calculated and Holm-adjusted across the 15 topology-by-outcome omnibus tests at each coverage level. Graph-matched targeted-versus-random comparisons used paired t tests, Cohen’s dz, Wilcoxon signed-rank tests, Holm adjustment, and 95% confidence intervals (CIs) for mean paired differences. Threshold distributions were compared with log-rank tests, using observed duration for censored runs (Supplementary Table S18; Supplementary Figure S8). Rather than retain a single Gaussian generalized-estimating-equation model across bounded, count-like, and burden outcomes, the final analysis used outcome-specific graph-matched tests whose effects are directly interpretable within each topology. For the structural- and seed-count-by-strategy sweep, ranking stability was defined before the sweep was run: within a topology, transmission regime, and varied parameter, a strategy was a stable winner only if it remained among the two lowest-mean-final-size strategies and remained significantly better than random placement (paired t test across matched graph realizations, Holm-adjusted p < .05) at every tested value of that parameter. Practical interpretation emphasized absolute and percentage changes, CIs, threshold probability, and stability across regimes rather than p values alone.
Computational Environment and Reproducibility
All simulations were executed using Python 3.13.5 with NetworkX 3.6.1, NumPy 2.3.5, pandas 2.2.3, SciPy 1.17.0, statsmodels 0.14.6, and Matplotlib 3.10.8. Computations were performed on a 64-bit Windows system equipped with an Intel Core i5-10400F processor (2.90 GHz), 16 GB of RAM, and eight worker processes for parallel execution. The primary experiments (300 baseline simulations and 7,200 intervention simulations) completed in approximately 3 min 39 s, while the robustness experiments, including parameter sensitivity, structural sensitivity, behavioral heterogeneity, seed-placement, and scalability analyses, completed in approximately 1 min 38 s. The additional structural- and seed-count-by-strategy sweep reported in Structural Parameters and Seed Count Bounded the Rankings (6,440 simulations: 3,200 structural, 2,880 seed-count, and 360 near-threshold seed-count baseline) was run in the same environment with eight worker processes and completed in approximately 2 min 39 s. The complete reproducibility package accompanying this study includes the executed notebooks, simulation and analysis scripts, parameter specifications, deterministic random-seed generation procedures, CSV outputs, statistical summaries, figures, and documentation required to reproduce every reported result.
Results
Topology Strongly Changed Diffusion Speed
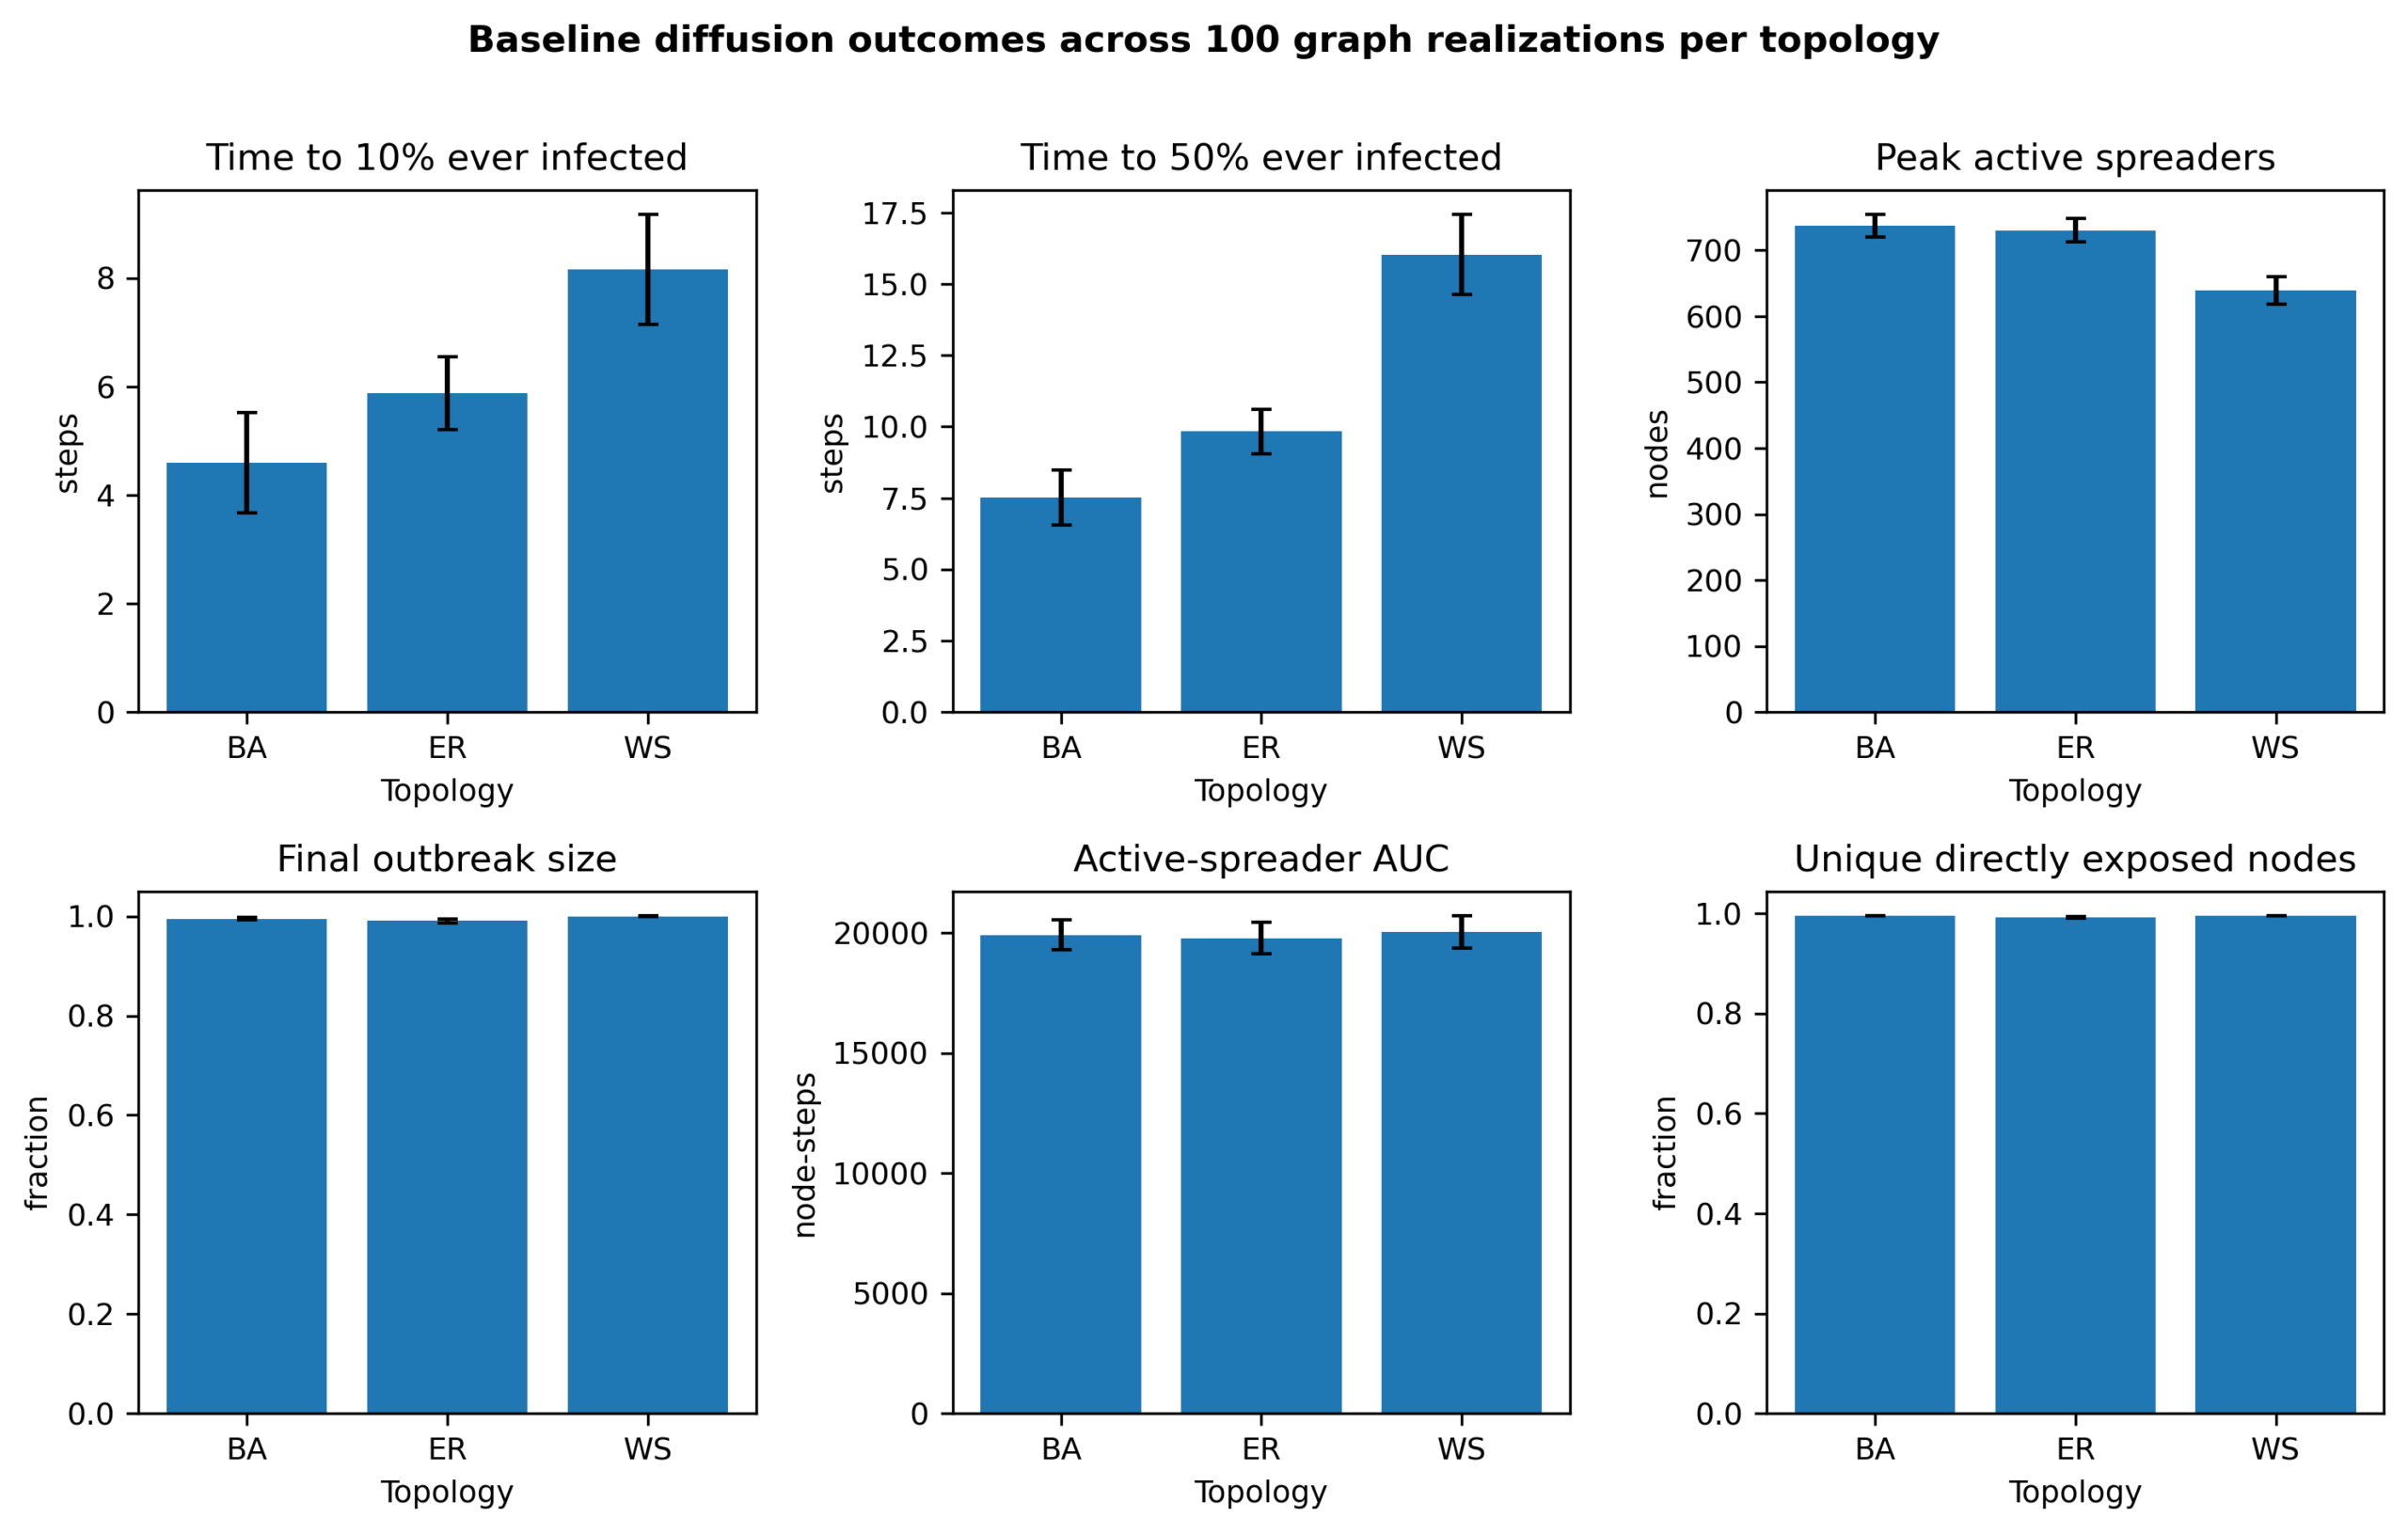
All high-transmission baseline trials reached both thresholds. BA networks reached 10% ever infected in 4.60 steps on average (SD = 0.92) and 50% in 7.51 steps (SD = 0.96). ER means were 5.88 (SD = 0.67) and 9.83 (SD = 0.78), while WS means were 8.16 (SD = 1.01) and 16.03 (SD = 1.40). Topology effects were large for time to 10% (F(2,297) = 419.90, Holm p < 0.001, η² = 0.739) and time to 50% (F(2,297) = 1665.40, Holm p < 0.001, η² = 0.918). Peak activity was highest in BA, slightly lower in ER, and substantially lower in WS (Figure 2; Supplementary Table S5; Supplementary Figure S6).
The baseline was near saturation. Mean final size was 0.995 in BA, 0.991 in ER, and 1.000 in WS. Active-spreader AUC differed only slightly (19,927, 19,785, and 20,039 node-steps), and the topology test was not significant after Holm adjustment (Holm p = 0.069, η² = 0.025). Total exposure attempts showed the same pattern (Holm p = 0.069, η² = 0.023). Unique directly exposed fraction was statistically different because ER was slightly below the other topologies, but all means exceeded 0.992. Thus, the high-transmission baseline provides strong evidence about timing and peak shape, not meaningful invariance of real-world exposure. Main-text values are rounded for readability; Supplementary Table S5 reports SDs and 95% CIs.
Intervention Performance Depended on Topology and Outcome
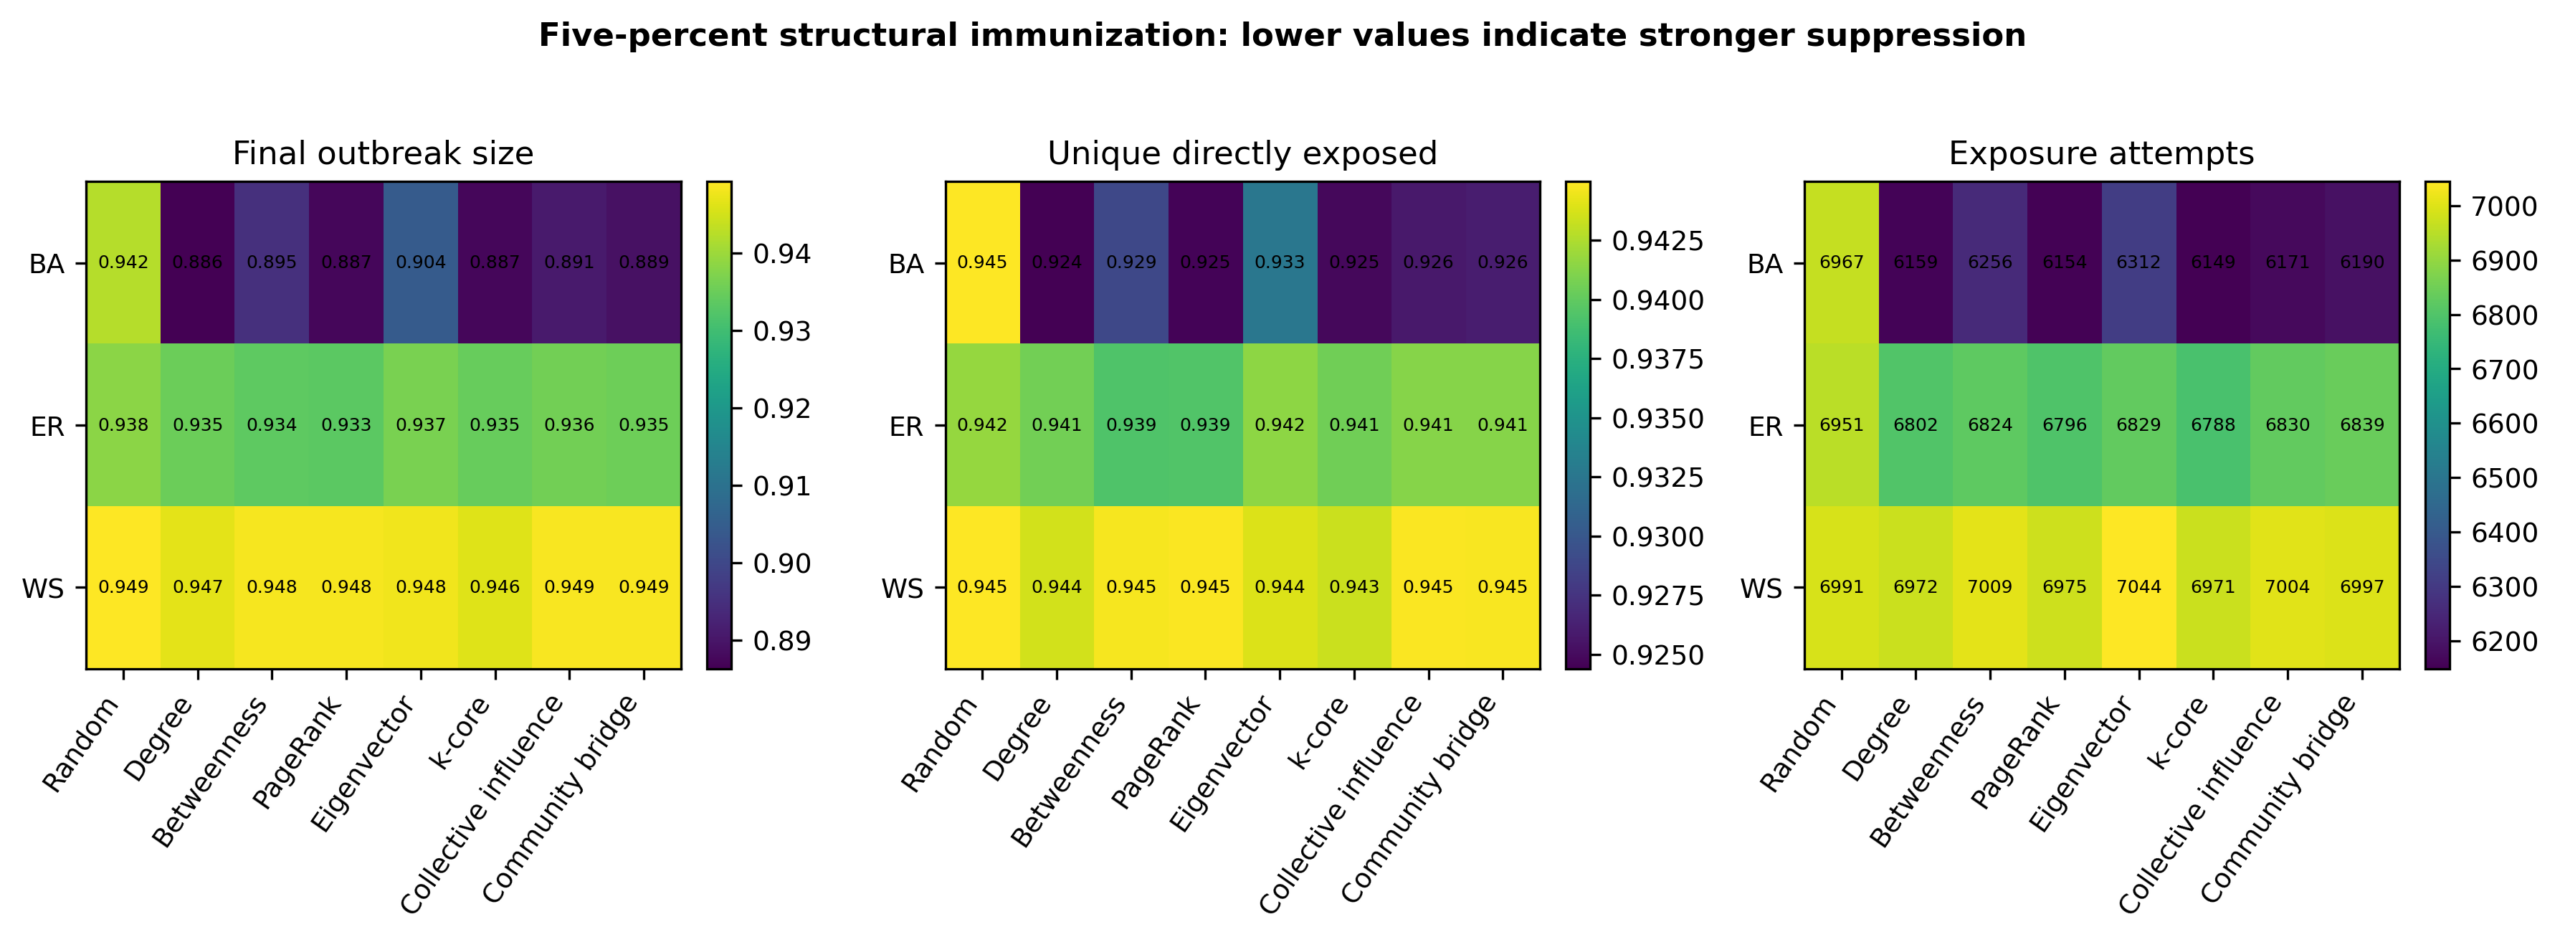
Because the uncontrolled baseline was near saturation, Phase II evaluated each outcome separately rather than assuming that intervention effects would track final size uniformly. At 5% coverage, placement strategy had a large effect on BA final size (F(7,693) = 541.25, Greenhouse-Geisser and Holm-adjusted p < 0.001, partial η² = 0.845), unique direct exposure (partial η² = 0.836), exposure attempts (0.716), and peak activity (0.882). Random BA placement produced mean final size 0.942, while degree, PageRank, k-core, collective influence, and community-bridge placement produced means from 0.886 to 0.891. Degree placement reduced final size by 5.9%, active-spreader AUC by 6.1%, unique direct exposure by 2.2%, exposure attempts by 11.6%, and peak active spreaders by 22.9% relative to random placement. These differences remained significant in paired t and Wilcoxon analyses after Holm adjustment (Figure 3; Supplementary Tables S7, S8, S11, and S20).
ER strategy effects were smaller. At 5% coverage, the final-size partial η² was 0.178, and the best mean final size was 0.933 under PageRank compared with 0.938 under random placement. WS strategy effects were also modest for final size (partial η² = 0.107) and negligible for active-spreader AUC (partial η² = 0.003, Holm-adjusted p = 0.942). Degree and k-core reduced WS peak activity and final size more consistently than other rules, but the absolute differences at β = 0.15 were small (Supplementary Tables S7-S8).
At 10% coverage, PageRank produced the smallest BA mean final size (0.752; 95% CI reported in Supplementary Table S9), closely followed by k-core (0.754), degree (0.757), community bridge (0.763), and collective influence (0.764), compared with 0.888 for random placement. The BA final-size strategy effect was very large (partial η² = 0.920, Greenhouse-Geisser and Holm-adjusted p < 0.001). In ER and WS, topology-aware strategies also differed statistically, but absolute differences remained much smaller than in BA. The expanded comparison therefore rejects a universal claim that degree or betweenness is always best. Several strategies form a near-tied group in BA, and the winner depends on metric and regime (Supplementary Tables S9-S11; Supplementary Figure S1). At 1% coverage, suppression was negligible in every topology (final-size reduction ≤ 1.1% in BA and ≤ 0.1% in ER and WS, with all runs still reaching 50% infected); these values are reported in Supplementary Table S19 and were therefore not carried into the 5% and 10% inferential comparisons.
Near-Threshold Regimes Changed Practical Conclusions
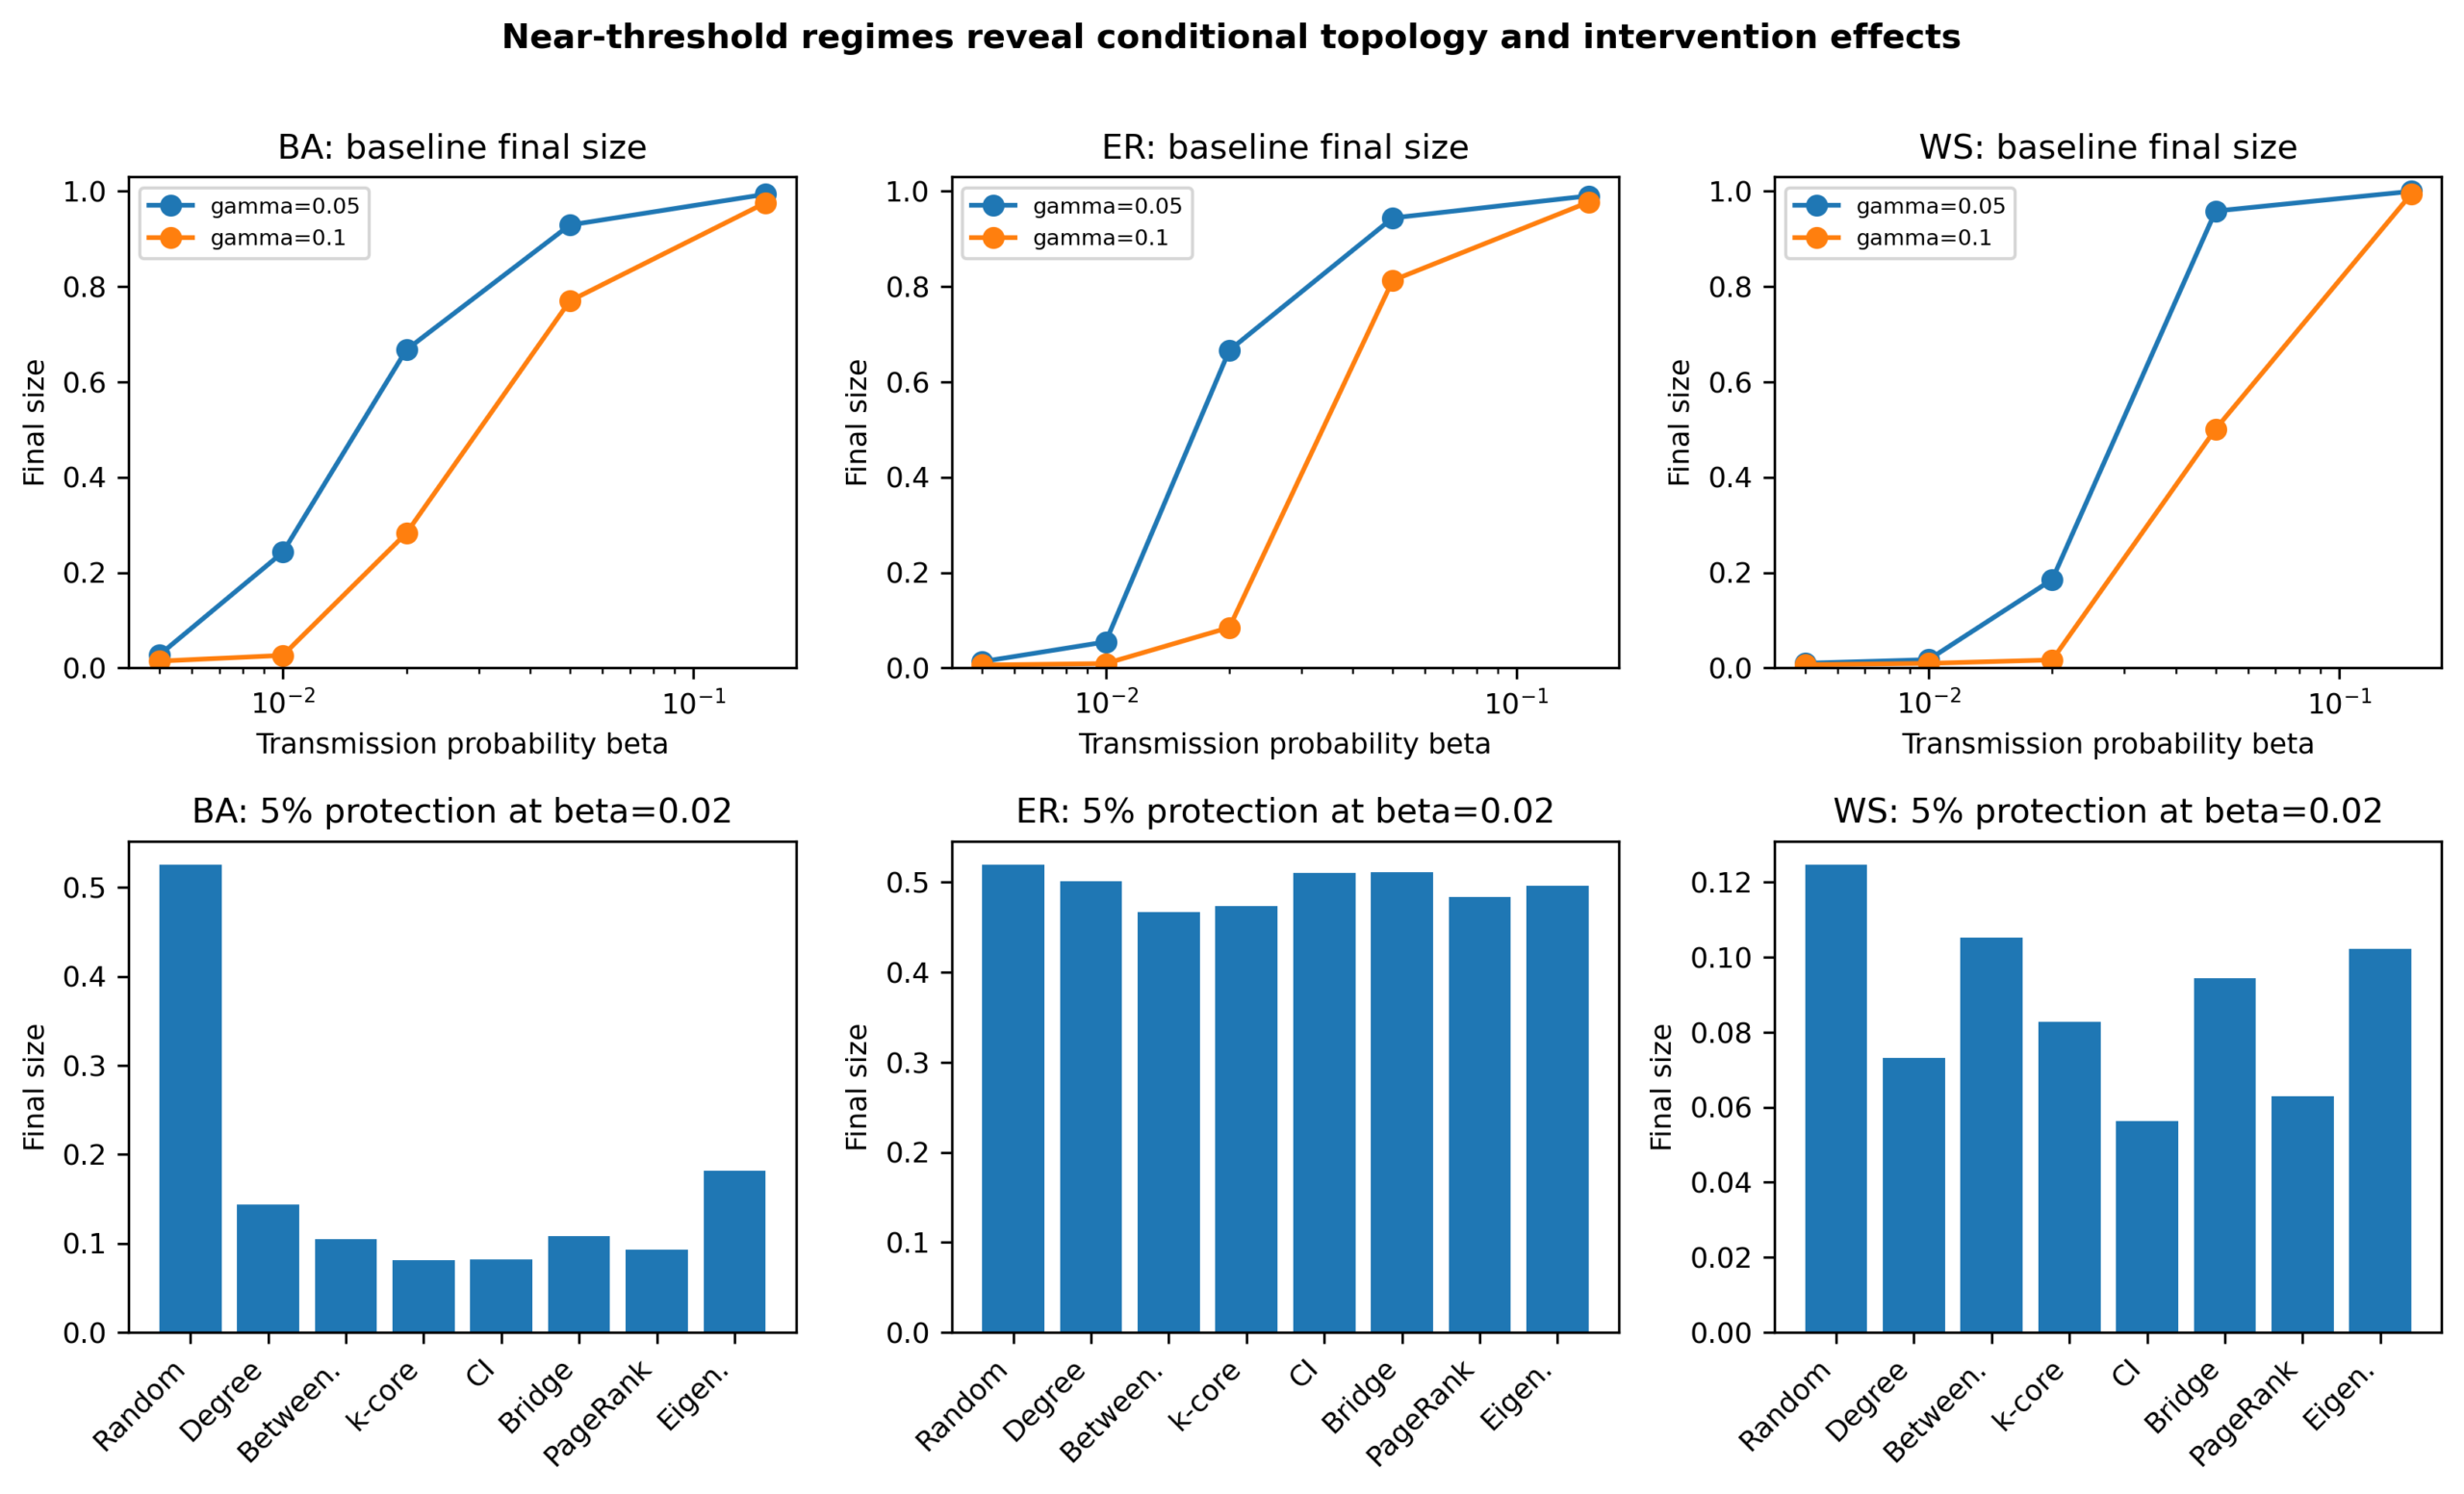
The expanded β-γ sweep showed that the BA-ER-WS ordering of early diffusion was most stable when outbreaks became large enough to cross 10%. However, final reach and threshold probability changed sharply near the diffusion boundary. At β = 0.02 and γ = 0.05 without intervention, BA and ER mean final sizes were both about 0.67, while WS mean final size was 0.19. BA reached 50% in every trial, ER in 95%, and WS in none. At β = 0.01, mean final size was 0.24 in BA, 0.06 in ER, and 0.02 in WS (Figure 4).
Near the threshold, topology-aware protection became much more consequential. At β = 0.02 and 5% coverage, random BA placement produced mean final size 0.526 and 85% of runs reached 50%. Every tested topology-aware strategy prevented all BA runs from reaching 50%; k-core and collective influence produced mean final sizes of 0.081 and 0.082. In ER, mean final sizes remained between 0.467 and 0.520 and no strategy dominated across all outcomes. In WS, collective influence produced the smallest mean final size (0.056) compared with 0.125 under random placement. These results show that ranking is conditional on topology and distance from the diffusion threshold (Supplementary Table S12). A log-rank comparison of time-to-50% distributions confirmed these threshold differences: under random placement 85% of Barabási-Albert runs crossed 50% infection whereas no run did so under any topology-aware strategy, and every strategy differed significantly from random (χ² = 25.1-38.4, Holm-adjusted p < 1 × 10⁻⁶); the Erdős-Rényi tests were likewise significant (χ² = 26.1-43.6), while in Watts-Strogatz no run reached 50% under any condition, leaving the test undefined (Supplementary Table S18; Supplementary Figure S8).
Structural Parameters and Seed Count Bounded the Rankings
Extending the uncontrolled-diffusion sweep to alternative network sizes, mean degrees, Watts-Strogatz rewiring, Barabási-Albert attachment, and stochastic-block-model mixing left the BA-ER-WS speed ordering intact in every one of 27 setting-by-topology cells tested (20 realizations each), and every cell still reached 50% infected in all trials at β = 0.15 (Supplementary Table S15). This confirms that the topology ordering reported above is not an artifact of the specific structural parameters used in the primary experiment, but it does not by itself establish that intervention rankings are equally robust.
A second sweep crossed Watts-Strogatz rewiring, stochastic-block-model mixing, initial spreader count, and network size with all eight structural-immunization strategies at 5% coverage, using the stability criterion pre-registered in Methods. Of the 13 family-by-topology-by-regime combinations tested, only two produced a stable winner: PageRank remained among the two lowest-final-size strategies and significantly better than random at every tested stochastic-block-model mixing value at β = 0.15 (mean final size 0.932-0.934 versus 0.938-0.939 under random placement), and degree remained the stable winner across initial spreader counts of 1, 5, and 10 in BA at β = 0.02. This BA/β = 0.02 seed-count family was generated from an independent realization set and RNG stream from the near-threshold intervention summary in Supplementary Table S12; at the one nominally overlapping condition (five seeds), the two tables give the same direction and a large magnitude of suppression under degree targeting (S12: random 0.526 to degree 0.143, a 72.8% reduction; Supplementary Table S16: random 0.604 to degree 0.062, an 89.8% reduction) but different point estimates, consistent with high between-sample variance in this bimodal, near-threshold regime rather than a substantive disagreement (Supplementary Table S16 note). In the remaining 11 combinations the top-ranked strategy changed identity as the structural or seed-count parameter varied (Supplementary Table S16; Supplementary Figure S7). For example, in WS at β = 0.02, betweenness was the best strategy at low rewiring (p = 0.01) but collective influence took over at moderate and high rewiring (p = 0.10 and 0.50); in BA at β = 0.02, the best strategy shifted from betweenness (N = 500) to k-core (N = 2,000). Random placement never left last place in any panel of Figure S7, so topology-aware placement remained better than no targeting throughout; what changed was which topology-aware rule was best.
Initial spreader count also changed whether outbreaks crossed the diffusion threshold at all. At β = 0.02 without intervention, BA and ER runs reached 50% infected in 45% and 50% of trials with a single seed, rising to 95%-100% with five or ten seeds; WS runs never reached 50% infected regardless of seed count (Supplementary Table S17). At the saturated β = 0.15 baseline, seed count changed only timing (time to 10% fell from about 8 steps with one seed to about 4 steps with ten seeds in BA), not threshold-crossing probability, which stayed at 1.00 across nearly all tested seed counts and topologies. These results confirm that findings depending on initial spreader count are real, but they are confined to the near-threshold regime; the saturated baseline used for the primary comparisons is materially unaffected by seed count.
Together, these results extend the conditional-ranking conclusion already stated in Discussion to two further design dimensions. Diffusion timing and topology ordering are robust to structural parameters and initial spreader count; the identity of the best structural-immunization strategy is not, and depends jointly on topology, structural regime (clustering, modularity, network size), transmission regime, and seed count.
Seed Placement and Heterogeneous Behavior Qualified the Rankings
High-degree and bridge seeds accelerated early spread. In the 20-realization seed-placement sensitivity family, BA high-degree and bridge seed sets reached 10% in approximately two steps, compared with 4.30 steps for random seeds; the corresponding 100-realization primary random-seed mean was 4.60 steps. The difference reflects the smaller matched sensitivity sample, not a change in the seed-count rule. ER peripheral seeds delayed the 10% threshold to 11.0 steps and reduced mean final size to 0.943; one of 20 runs failed to reach 50%. WS final size remained saturated across seed modes, although timing changed (Supplementary Figure S3).
Behavioral heterogeneity altered the identity of the strongest strategy but did not eliminate the BA targeting advantage. Under degree-correlated sharing, degree placement reduced BA mean final size from 0.931 under random placement to 0.808. Under strong lognormal heterogeneity, PageRank produced the lowest BA and ER final size, while degree was best in WS. All eight structural-immunization strategies were evaluated in both the near-threshold and heterogeneity families; PageRank, the strongest primary-condition performer, was the most frequent winner under heterogeneous sharing. Because these tests used stylized probability distributions rather than calibrated user data, they demonstrate sensitivity rather than behavioral realism (Supplementary Table S13; Supplementary Figure S2).
Structural Disruption Explained Much of the Intervention Effect
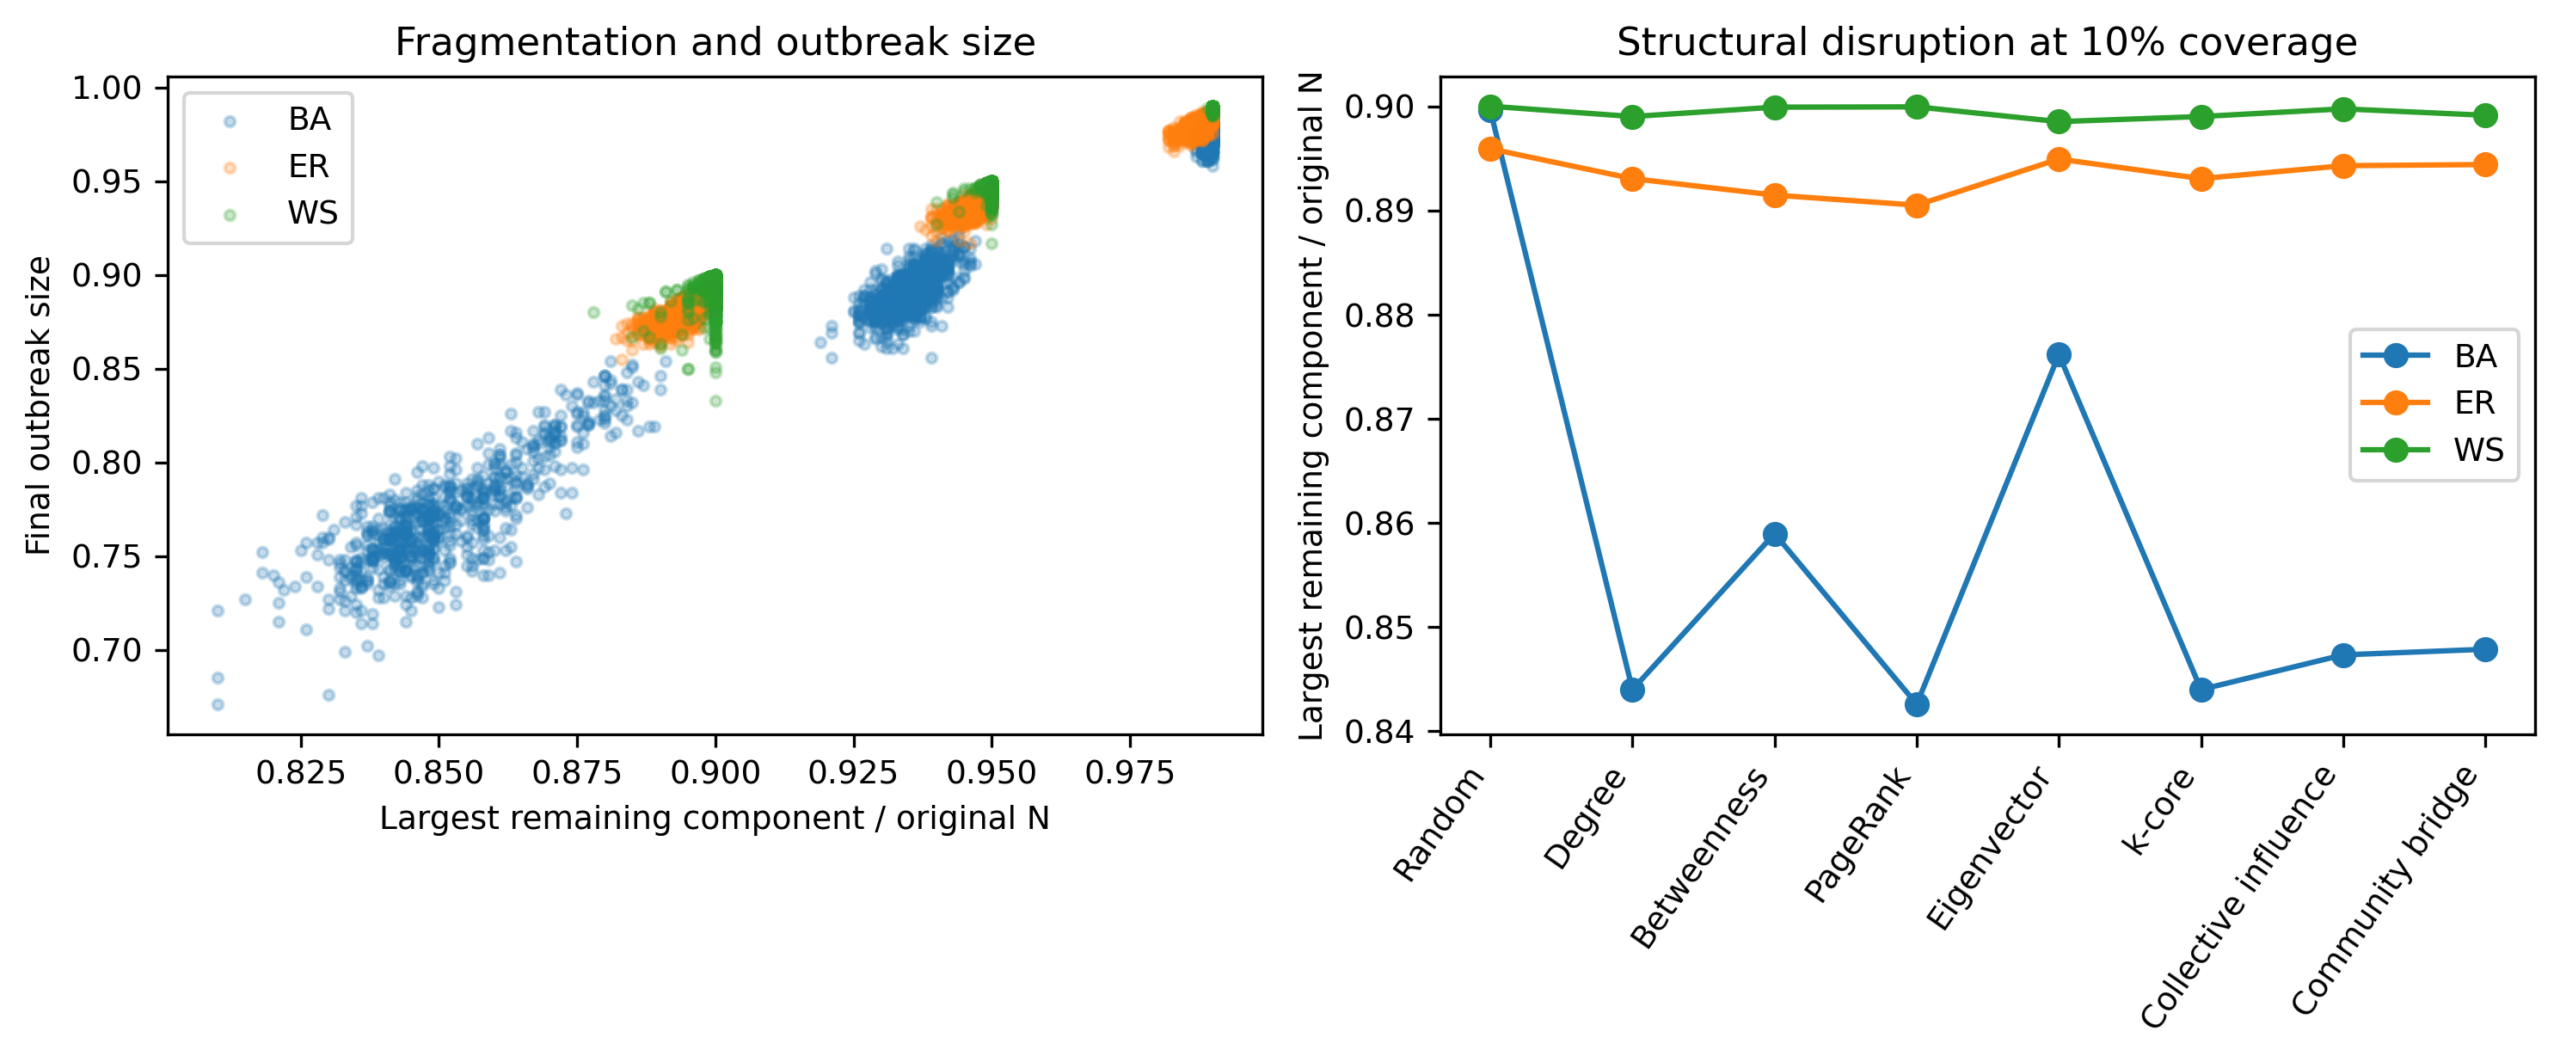
Across all strategies and coverage levels, the fraction of the original network remaining in the largest connected component was strongly correlated with final outbreak size (Pearson r = 0.983 in BA, 0.996 in ER, and 0.991 in WS). More components and a larger fraction of incident edges blocked were associated with smaller outbreaks. These correlations pool coverage levels and are descriptive rather than causal estimates, but they identify a plausible mechanism: effective strategies reduce the connected region available to a cascade. Matched-network visualizations show that degree, collective-influence, and community-bridge protection concentrate barriers in structurally central regions, while random protection leaves more continuous routes (Figure 5; Supplementary Figure S4). These structural measures – components remaining, largest-remaining-component fraction, fraction of incident edges blocked, cross-community edges blocked, and approximate post-removal path length – are reported by strategy, topology, and coverage in Supplementary Table S21.
Computational Cost Limited Some Strategies
At N = 1,000, median ranking time was 0.0007 seconds for degree, 0.0025 seconds for k-core, 0.0047 seconds for PageRank, 0.017 seconds for static collective influence, 0.085 seconds for eigenvector centrality, 0.318 seconds for sampled betweenness, and 0.699 seconds for the greedy community-bridge procedure. Benchmarks from N = 500 to 2,000 showed near-linear growth for degree and k-core and steeper growth for community detection and global centralities. Exact unweighted betweenness requires O(VE) time using Brandes’ algorithm17. The present implementation approximated betweenness by sampling 100 source nodes instead of using every node as a source. Degree and k-core were inexpensive at the tested scales and are, in principle, compatible with local or partial information, but platform-scale approximation was not tested. Betweenness and community-aware approaches may require sampling, parallelization, or local surrogates (Supplementary Table S14; Supplementary Figure S5). Extrapolating this measured N = 500-2,000 growth to platform scale-assuming sparse graphs with mean degree near six, a fixed 100-source betweenness sample, and the same single-threaded implementation-the near-linear local rankings remain inexpensive even at one million nodes: projecting from the 1,000-node medians, degree, k-core, and PageRank stay under five seconds (about 0.7, 2.5, and 4.7 s), while collective influence, eigenvector centrality, and sampled betweenness reach roughly 17 s, 1.5 min, and 5 min. The greedy community-bridge procedure grew markedly faster than linearly across the tested range (empirically close to the 1.5 power of N) and projects to several hours at one million nodes, and exact betweenness (O(VE), effectively quadratic on sparse graphs) is infeasible at that scale. Platform-scale deployment would therefore rely on the inexpensive local rankings or on the sampling, parallelization, and local-surrogate approximations noted above rather than on exact global centralities.
Discussion
Robust Conclusions
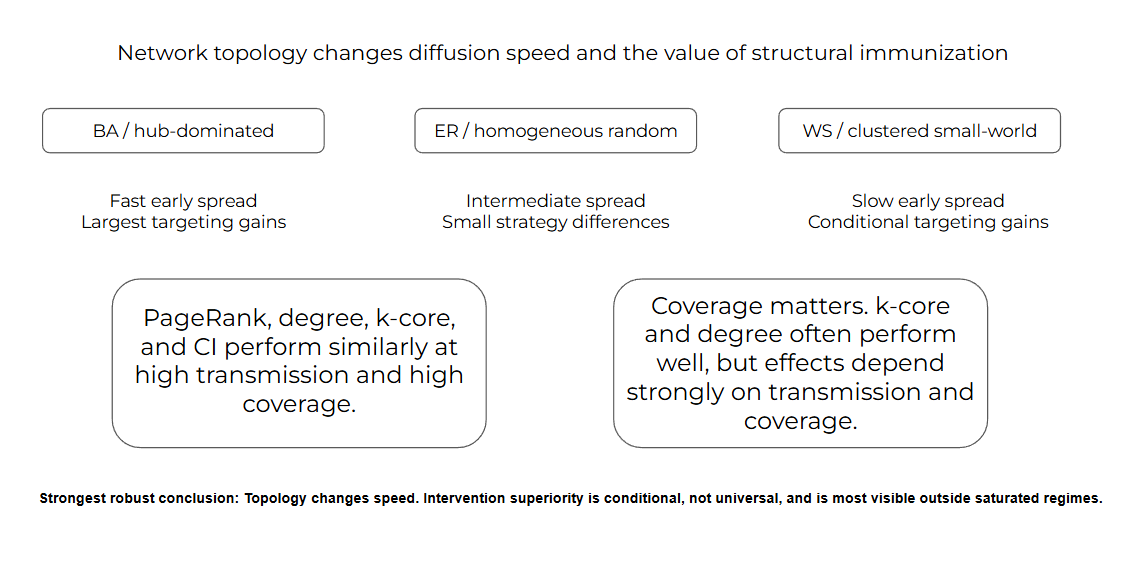
The most robust conclusion is that topology changes diffusion speed. BA networks consistently accelerated early spread because hubs connect many regions, ER networks were intermediate, and WS networks delayed large-scale growth. This ordering persisted across a broad range of transmission values whenever outbreaks crossed the measured thresholds. The large η² values for threshold timing are practically meaningful: in the high-transmission baseline, WS provided roughly twice as many time steps as BA before 50% of nodes had ever been infected. The same ordering held under the structural variations summarized in Supplementary Table S15.
A second robust conclusion is that saturation can hide meaningful differences. In the primary parameter regime, nearly every node was infected or directly exposed. Active-spreader AUC and exposure attempts differed little after multiplicity adjustment, but this does not imply that topology is irrelevant to exposure in general. It means that a near-saturated homogeneous SIR process leaves little room for total-reach differences. The near-threshold sweep revealed large differences in outbreak probability, final size, and intervention response that were invisible at β = 0.15. Distribution-robust checks for the saturated baseline are reported in Supplementary Table S6, and the near-threshold differences that saturation masked in Supplementary Table S12.
Conditional Intervention Conclusions
Topology-aware structural immunization was most valuable in BA networks, but no centrality was universally optimal. Degree, PageRank, k-core, collective influence, and community bridge often produced similar BA outcomes at high transmission. PageRank led the 10% BA primary condition, degree led several 5% outcomes, and k-core or collective influence led some near-threshold and heterogeneous conditions. ER networks showed much smaller differences, consistent with their narrower degree distribution. WS networks favored degree or k-core in several conditions, while collective influence performed best in one near-threshold final-size comparison. The appropriate conclusion is therefore conditional: topology-aware placement can outperform random placement, especially in hub-dominated networks and near threshold, but the best rule depends on topology, coverage, diffusion parameters, seeds, behavior, and outcome. The structural- and seed-count-by-strategy sweep reinforces this conclusion at a finer grain: crossing clustering, modularity, network size, and initial spreader count with all eight strategies produced a strategy that stayed a top-two, significantly-better-than-random performer across the full tested range in only 2 of 13 topology-by-regime combinations (Structural Parameters and Seed Count Bounded the Rankings; Supplementary Table S16). The best rule therefore depends on topology, coverage, diffusion parameters, structural regime, seed count, behavior, and outcome, and no single centrality can be recommended without specifying that context.
Practical Interpretation
The results do not establish a ready-to-deploy platform policy. They provide a structural hypothesis for allocating scarce preventive resources. Degree and k-core required relatively little computation at N ≤ 2,000 and are, in principle, approximable from local or partial network information, though that approximation was not tested here. PageRank, betweenness, and community-aware methods require broader graph access and raise privacy, fairness, and governance concerns. Any platform implementation would require empirical validation on real platform data, a detection system, a behavioral intervention such as a warning or prebunk, and monitoring for unequal impacts. Protecting a structural position should not be interpreted as labeling or penalizing a person. Measured ranking-time costs for all strategies are reported in Supplementary Table S14 and Supplementary Figure S5.
Potential users would face different constraints. Platform moderators could compute degree or k-core rankings frequently for triage, fact-checking organizations could use community and bridge information to prioritize outreach across groups, and policymakers or independent researchers could use slower global rankings for periodic audits rather than real-time decisions. These roles are conceptual because the present study did not test an operational moderation system.
Operational fact-checking should be modeled with delayed correction, incomplete visibility, heterogeneous acceptance, and a competing corrective cascade. The present permanent-immunity rule is useful as an upper-bound benchmark: if a strategy performs poorly even with perfect preemptive protection, it is unlikely to become stronger when protection is delayed and imperfect. Conversely, success under perfect structural immunity does not prove that fact-check labels or corrections will produce the same result. Recent work has begun to formalize several of these elements, including mitigation-policy optimization36, network-structured sanctioning and the ideological segregation of false news37,38, scalable influence-minimization algorithms39, and source-credibility and social-norm interventions40, offering complementary approaches to the structural-immunization framing used here.
Limitations
The graphs were synthetic, static, undirected, and unweighted. They did not include empirical community sizes, temporal interactions, recommendation algorithms, directed follower relationships, inactive users, or platform-specific exposure mechanisms. The stochastic block sensitivity analysis added modularity but did not substitute for validation on an empirical social-network dataset. Real-world applicability is therefore explicitly limited.
The model treated misinformation as a single contagion and did not represent content credibility, belief strength, repeated memory effects, strategic adversaries, or adaptive moderation. Behavioral heterogeneity was stylized rather than fitted to observations. Exposure was limited to infected-susceptible network contacts; it did not count recommendation-system impressions outside the graph, passive viewing without a modeled edge, or different levels of attention. The collective-influence implementation used static scores rather than full adaptive recomputation. Approximate betweenness may differ from exact rankings. Structural correlations pooled coverage and should not be interpreted as causal mediation estimates. Of the four node-level parameters that could in principle be made heterogeneous-susceptibility, transmission (sharing) probability, recovery probability, and sharing behavior-only the transmission/sharing multiplier was varied; susceptibility and recovery probability (γ) were held identical across nodes in every condition, as were node-level trust and content credibility. The heterogeneity analysis therefore establishes sensitivity along the sharing dimension rather than a full multi-parameter heterogeneity treatment.
The primary graphs contained 1,000 nodes, and the scalability benchmark ended at 2,000 nodes because its purpose was comparative profiling rather than platform-scale testing. Runtime measurements depend on hardware, implementation, graph density, and convergence. Accordingly, the measured execution times of 3 min 39 s for the primary experiments and 1 min 38 s for the robustness experiments apply specifically to the computational environment described in Methods rather than representing universal runtime requirements. Finally, repeated simulations improve precision within the model but do not overcome model misspecification. The results should be interpreted as computational evidence about controlled graph processes.
Future Research Directions
The next step is validation on anonymized empirical networks with directed, weighted, temporal, and community-labeled edges. Dynamic and multilayer models could represent cross-platform movement, recommendation exposure, and private versus public channels. A realistic correction process should allow misinformation and corrective information to compete, as in limiting-campaign and truth-seed models22,25. Correction delays, heterogeneous acceptance, source trust, and repeated-exposure effects should be modeled separately and calibrated empirically; professional fact-checking experiments can inform belief-correction effects32, while studies of large-language-model-generated fact-check messages motivate explicit testing for unintended effects33. Adaptive interventions that re-rank nodes as a cascade evolves remain a proposed extension beyond the static group-, concern-, and topology-based methods considered in prior work23,24,26. Empirical calibration should estimate user activity, susceptibility, recovery, and sharing heterogeneity from platform or survey data. Graph neural network and content-classification models may provide detection signals41,42,43,44, while repositories such as FakeNewsNet provide content, social-context, and spatiotemporal data for developing and evaluating such systems45. Future work should evaluate whether prediction errors and fairness constraints change the benefit of structural targeting. Larger benchmarks should compare exact and approximate centralities, memory use, distributed computation, and performance under incomplete network observation.
Conclusion
Network topology strongly affected the speed and shape of simulated misinformation diffusion. BA networks spread fastest, ER networks were intermediate, and WS networks spread most slowly. Topology-aware structural immunization substantially outperformed random placement in BA networks, while strategy differences were smaller in ER and WS networks under the saturated baseline. Expanded sensitivity analyses showed why broad claims would be misleading: intervention advantages were often much larger near the diffusion threshold, seed placement and initial spreader count altered timing, reach, and ranking stability, structural parameters such as clustering, modularity, and network size left a persistent top-performing strategy in only 2 of 13 tested combinations, and behavioral heterogeneity changed the best-performing rule. The evidence therefore supports topology-aware allocation as a conditional structural principle, not a universal strategy and not a direct model of operational fact-checking (Figure 6).
Supplementary Material
References
- S. Vosoughi, D. Roy, S. Aral. The spread of true and false news online. Science. Vol. 359, pg. 1146-1151, 2018, https://doi.org/10.1126/science.aap9559. [↩] [↩]
- M. Del Vicario, A. Bessi, F. Zollo, F. Petroni, A. Scala, G. Caldarelli, H. E. Stanley, W. Quattrociocchi. The spreading of misinformation online. Proceedings of the National Academy of Sciences. Vol. 113, pg. 554-559, 2016, https://doi.org/10.1073/pnas.1517441113. [↩] [↩] [↩]
- M. Cinelli, G. De Francisci Morales, A. Galeazzi, W. Quattrociocchi, M. Starnini. The echo chamber effect on social media. Proceedings of the National Academy of Sciences. Vol. 118, pg. e2023301118, 2021, https://doi.org/10.1073/pnas.2023301118. [↩] [↩]
- C. Shao, G. L. Ciampaglia, O. Varol, K. C. Yang, A. Flammini, F. Menczer. The spread of low-credibility content by social bots. Nature Communications. Vol. 9, pg. 4787, 2018, https://doi.org/10.1038/s41467-018-06930-7. [↩]
- N. Grinberg, K. Joseph, L. Friedland, B. Swire-Thompson, D. Lazer. Fake news on Twitter during the 2016 U.S. presidential election. Science. Vol. 363, pg. 374-378, 2019, https://doi.org/10.1126/science.aau2706. [↩]
- A. Guess, J. Nagler, J. Tucker. Less than you think: prevalence and predictors of fake news dissemination on Facebook. Science Advances. Vol. 5, pg. eaau4586, 2019, https://doi.org/10.1126/sciadv.aau4586. [↩]
- A. M. Guess, B. Nyhan, J. Reifler. Exposure to untrustworthy websites in the 2016 US election. Nature Human Behaviour. Vol. 4, pg. 472-480, 2020, https://doi.org/10.1038/s41562-020-0833-x. [↩]
- J. Allen, B. Howland, M. Mobius, D. Rothschild, D. J. Watts. Evaluating the fake news problem at the scale of the information ecosystem. Science Advances. Vol. 6, pg. eaay3539, 2020, https://doi.org/10.1126/sciadv.aay3539. [↩]
- J. Allen, D. J. Watts, D. G. Rand. Quantifying the impact of misinformation and vaccine-skeptical content on Facebook. Science. Vol. 384, pg. eadk3451, 2024, https://doi.org/10.1126/science.adk3451. [↩]
- E. N. Gilbert. Random graphs. The Annals of Mathematical Statistics. Vol. 30, pg. 1141-1144, 1959, https://doi.org/10.1214/aoms/1177706098. [↩] [↩]
- D. J. Watts, S. H. Strogatz. Collective dynamics of small-world networks. Nature. Vol. 393, pg. 440-442, 1998, https://doi.org/10.1038/30918. [↩] [↩]
- A. L. Barabasi, R. Albert. Emergence of scaling in random networks. Science. Vol. 286, pg. 509-512, 1999, https://doi.org/10.1126/science.286.5439.509. [↩] [↩]
- D. Centola. The spread of behavior in an online social network experiment. Science. Vol. 329, pg. 1194-1197, 2010, https://doi.org/10.1126/science.1185231. [↩]
- R. Pastor-Satorras, A. Vespignani. Immunization of complex networks. Physical Review E. Vol. 65, pg. 036104, 2002, https://doi.org/10.1103/PhysRevE.65.036104. [↩] [↩]
- R. Cohen, S. Havlin, D. ben-Avraham. Efficient immunization strategies for computer networks and populations. Physical Review Letters. Vol. 91, pg. 247901, 2003, https://doi.org/10.1103/PhysRevLett.91.247901. [↩]
- L. C. Freeman. A set of measures of centrality based on betweenness. Sociometry. Vol. 40, pg. 35-41, 1977, https://doi.org/10.2307/3033543. [↩]
- U. Brandes. A faster algorithm for betweenness centrality. Journal of Mathematical Sociology. Vol. 25, pg. 163-177, 2001, https://doi.org/10.1080/0022250X.2001.9990249. [↩] [↩]
- S. Brin, L. Page. The anatomy of a large-scale hypertextual web search engine. Computer Networks and ISDN Systems. Vol. 30, pg. 107-117, 1998, https://doi.org/10.1016/S0169-7552(98)00110-X. [↩]
- P. Bonacich. Power and centrality: a family of measures. American Journal of Sociology. Vol. 92, pg. 1170-1182, 1987, https://doi.org/10.1086/228631. [↩]
- M. Kitsak, L. K. Gallos, S. Havlin, F. Liljeros, L. Muchnik, H. E. Stanley, H. A. Makse. Identification of influential spreaders in complex networks. Nature Physics. Vol. 6, pg. 888-893, 2010, https://doi.org/10.1038/nphys1746. [↩] [↩]
- F. Morone, H. A. Makse. Influence maximization in complex networks through optimal percolation. Nature. Vol. 524, pg. 65-68, 2015, https://doi.org/10.1038/nature14604. [↩] [↩]
- C. Budak, D. Agrawal, A. El Abbadi. Limiting the spread of misinformation in social networks. Proceedings of the 20th International Conference on World Wide Web. pg. 665-674, 2011, https://doi.org/10.1145/1963405.1963499. [↩] [↩] [↩] [↩]
- J. Zhu, P. Ni, G. Wang, Y. Li. Misinformation influence minimization problem based on group disbanded in social networks. Information Sciences. Vol. 572, pg. 1-15, 2021, https://doi.org/10.1016/j.ins.2021.04.086. [↩] [↩] [↩]
- P. Ni, J. Zhu, Y. Gao, G. Wang. Minimizing the misinformation concern over social networks. Information Processing & Management. Vol. 61, pg. 103562, 2024, https://doi.org/10.1016/j.ipm.2023.103562. [↩] [↩] [↩]
- T. Sakiyama, K. Nakajima, M. Aida. Efficient intervention in the spread of misinformation in social networks. IEEE Access. Vol. 12, pg. 133489-133498, 2024, https://doi.org/10.1109/ACCESS.2024.3459830. [↩] [↩] [↩]
- A. K. Ghoshal, N. Das, S. Das, S. Dhar. Minimizing spread of misinformation in social networks: a network topology based approach. Social Network Analysis and Mining. Vol. 15, pg. 15, 2025, https://doi.org/10.1007/s13278-025-01433-y. [↩] [↩] [↩]
- D. Kempe, J. Kleinberg, E. Tardos. Maximizing the spread of influence through a social network. Proceedings of the Ninth ACM SIGKDD International Conference on Knowledge Discovery and Data Mining. pg. 137-146, 2003, https://doi.org/10.1145/956750.956769. [↩]
- G. Pennycook, J. McPhetres, Y. Zhang, J. G. Lu, D. G. Rand. Fighting COVID-19 misinformation on social media: experimental evidence for a scalable accuracy-nudge intervention. Psychological Science. Vol. 31, pg. 770-780, 2020, https://doi.org/10.1177/0956797620939054. [↩] [↩]
- G. Pennycook, Z. Epstein, M. Mosleh, A. A. Arechar, D. Eckles, D. G. Rand. Shifting attention to accuracy can reduce misinformation online. Nature. Vol. 592, pg. 590-595, 2021, https://doi.org/10.1038/s41586-021-03344-2. [↩] [↩]
- J. Roozenbeek, S. van der Linden. Fake news game confers psychological resistance against online misinformation. Palgrave Communications. Vol. 5, pg. 65, 2019, https://doi.org/10.1057/s41599-019-0279-9. [↩]
- R. Maertens, J. Roozenbeek, M. Basol, S. van der Linden. Long-term effectiveness of inoculation against misinformation: three longitudinal experiments. Journal of Experimental Psychology: Applied. Vol. 27, pg. 1-16, 2021, https://doi.org/10.1037/xap0000315. [↩]
- E. Porter, T. J. Wood. The global effectiveness of fact-checking: evidence from simultaneous experiments in Argentina, Nigeria, South Africa, and the United Kingdom. Proceedings of the National Academy of Sciences. Vol. 118, pg. e2104235118, 2021, https://doi.org/10.1073/pnas.2104235118. [↩] [↩]
- M. R. DeVerna, H. Y. Yan, K. C. Yang, F. Menczer. Fact-checking information from large language models can decrease headline discernment. Proceedings of the National Academy of Sciences. Vol. 121, pg. e2322823121, 2024, https://doi.org/10.1073/pnas.2322823121. [↩] [↩] [↩]
- R. Pastor-Satorras, C. Castellano, P. Van Mieghem, A. Vespignani. Epidemic processes in complex networks. Reviews of Modern Physics. Vol. 87, pg. 925-979, 2015, https://doi.org/10.1103/RevModPhys.87.925. [↩]
- S. Govindankutty, S. P. Gopalan. Epidemic modeling for misinformation spread in digital networks through a social intelligence approach. Scientific Reports. Vol. 14, pg. 19100, 2024, https://doi.org/10.1038/s41598-024-69657-0. [↩]
- D. J. Butts, S. A. Bollman, M. S. Murillo. Mathematical modeling of disinformation and effectiveness of mitigation policies. Scientific Reports. Vol. 13, pg. 18735, 2023, https://doi.org/10.1038/s41598-023-45710-2. [↩]
- M. I. Jones, S. D. Pauls, F. Fu. Containing misinformation: modeling spatial games of fake news. PNAS Nexus. Vol. 3, pg. pgae090, 2024, https://doi.org/10.1093/pnasnexus/pgae090. [↩]
- J. Stein, M. Keuschnigg, A. van de Rijt. Network segregation and the propagation of misinformation. Scientific Reports. Vol. 13, pg. 917, 2023, https://doi.org/10.1038/s41598-022-26913-5. [↩]
- P. Ni, J. Zhu, G. Wang. Misinformation influence minimization by entity protection on multi-social networks. Applied Intelligence. Vol. 53, pg. 6401-6420, 2023, https://doi.org/10.1007/s10489-022-03798-5. [↩]
- T. Prike, L. H. Butler, U. K. H. Ecker. Source-credibility information and social norms improve truth discernment and reduce engagement with misinformation online. Scientific Reports. Vol. 14, pg. 6900, 2024, https://doi.org/10.1038/s41598-024-57560-7. [↩]
- T. Bian, X. Xiao, T. Xu, P. Zhao, W. Huang, Y. Rong, J. Huang. Rumor detection on social media with bi-directional graph convolutional networks. Proceedings of the AAAI Conference on Artificial Intelligence. Vol. 34, pg. 549-556, 2020, https://doi.org/10.1609/aaai.v34i01.5393. [↩]
- Y. Dou, K. Shu, C. Xia, P. S. Yu, L. Sun. User preference-aware fake news detection. Proceedings of the 44th International ACM SIGIR Conference on Research and Development in Information Retrieval. pg. 2051-2055, 2021, https://doi.org/10.1145/3404835.3462990. [↩]
- Q. Chang, X. Li, Z. Duan. Graph global attention network with memory: a deep learning approach for fake news detection. Neural Networks. Vol. 172, pg. 106115, 2024, https://doi.org/10.1016/j.neunet.2024.106115. [↩]
- A. Malik, D. K. Behera, J. Hota, A. R. Swain. Ensemble graph neural networks for fake news detection using user engagement and text features. Results in Engineering. Vol. 24, pg. 103081, 2024, https://doi.org/10.1016/j.rineng.2024.103081. [↩]
- K. Shu, D. Mahudeswaran, S. Wang, D. Lee, H. Liu. FakeNewsNet: a data repository with news content, social context, and spatiotemporal information for studying fake news on social media. Big Data. Vol. 8, pg. 171-188, 2020, https://doi.org/10.1089/big.2020.0062. [↩]