
Abstract
Aging is a biological process that induces many changes within an organism, including changes in protein expression. G-Protein Coupled Receptors, one of the largest family of human proteins that regulate a vast majority of physiological processes, may also be affected by aging, which could, in turn, be causative of various physiological changes. To investigate this potential correlation between aging and changes in orphan GPCR mRNA transcription, this paper focuses on the impact of aging on certain orphan GPCRs. To this end, publicly accessible transcriptomic data on the Genotype-Tissue Expression Project (GTEx) database was used to study the correlational relationship between aging and transcript abundance. Overall, the analysis did not indicate a general decrease or increase in protein expression based on age, but rather any changes in mRNA transcription based on age seemed to be tissue-dependent. GPCR expression is governed by a variety of biological factors, and this study numerically suggests that some variation in GPCR transcript expression can be attributed to aging. While this is a quantitative study correlating aging with general changes in gene transcription, future research will shed further light on this complex relationship.
Introduction
As the population ages, more people are impacted by age-related disorders such as neurodegeneration, cancer, and genetic frailty. Despite the years of prior research conducted on GPCRs and aging, there are some gaps in information within this topic. There are studies linking GPCR expression changes in specific tissues to lifespan changes. These will be discussed extensively in the literature review section of this paper. While general GPCR aging is a known area and has many published studies on it, many orphan GPCRs and cross-tissue age transcription changes of orphan GPCRs are not as covered. In order to better understand whether aging contributes to changes in orphan GPCR gene transcription, this study analyzes transcriptomic expression data from the Genotype-Tissue Expression (GTEx) database across multiple human tissues, allowing for evaluation of age-associated trends in receptor mRNA transcription. This can also potentially be linked to age-associated trends in GPCR expression, as mRNA transcription is one of the major steps of gene expression, but this study focuses on transcript expression, as the GTEx data points are measured in TPM (transcripts per million). Specifically, this study aims to determine whether aging is associated with consistent changes in orphan GPCR transcript expression across tissues or whether these expression patterns are tissue-dependent. If they are tissue-dependent, this study aims to analyze trends within tissues and within orphan GPCRs. By quantitatively evaluating age-associated correlations in orphan GPCR mRNA transcription, this work seeks to identify broader expression trends and highlight receptors or tissue contexts that may warrant further biological investigation. This work will also provide numerical values for changes in orphan GPCR mRNA transcription as age increases, including percent changes in transcription, as well as which tissues survived FDR correction, which will be further covered in the methods of the study. One limitation that will also be discussed is the fact that this study uses publicly accessible data from the GTEx project, so age is shown in ranges of ten years rather than one year (ex. A 43 year-old subject is identified as 40-49, and is entered in the code script as the midpoint of the age range, 45).
Literature Review
G-Protein Coupled Receptors, or GPCRs, are the largest family of human membrane proteins, encoded by roughly 1000 genes in the human genome1. GPCRs are primarily characterized by seven transmembrane alpha-helixes1. As shown in Figure 1, these alpha helices sense extracellular signals and then trigger an intracellular response through a signal transduction pathway by coupling G Proteins1. GPCRs convert extracellular cues into changes in their corresponding second messengers (such as cAMP), ion channel activity, kinase cascades, and gene expression2. These extracellular cues include light, odorants, neurotransmitters, hormones, lipids, and peptides1. GPCRs are a common drug target and play a fundamental role in human physiology3. They participate in the control of almost all bodily functions, including neurotransmission, hormone release, heart contractility, and immune responses3.
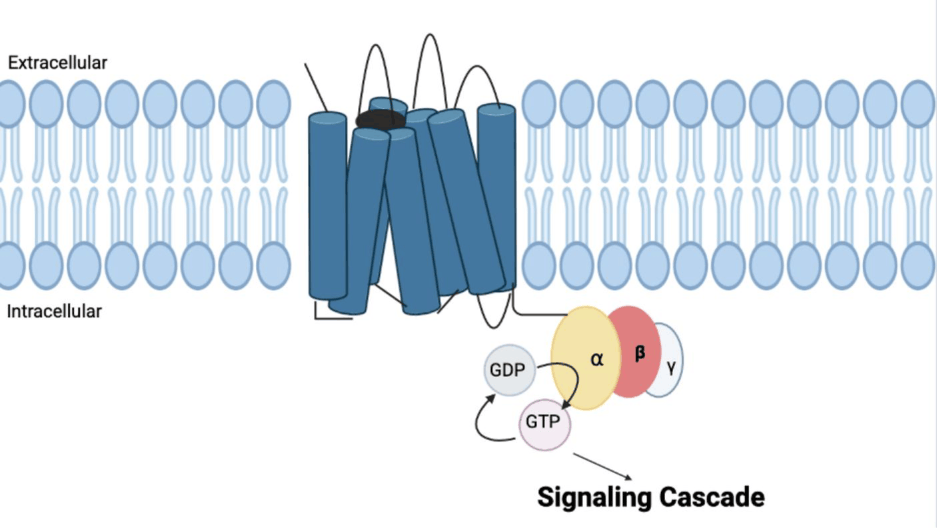
Despite their prevalence as the largest receptor family, a significant number of GPCRs remain orphans4. This means that they lack identified endogenous ligands, or activators4. Deorphanization is the process of validating one or more endogenous ligands that activate a specific GPCR4. Functionally, orphan GPCRs are the same as deorphanized GPCRs, but their physiological roles and signaling partners are often poorly characterized4. At least some orphan GPCRs, such as GPR19, have been linked to aging-related pathways5.
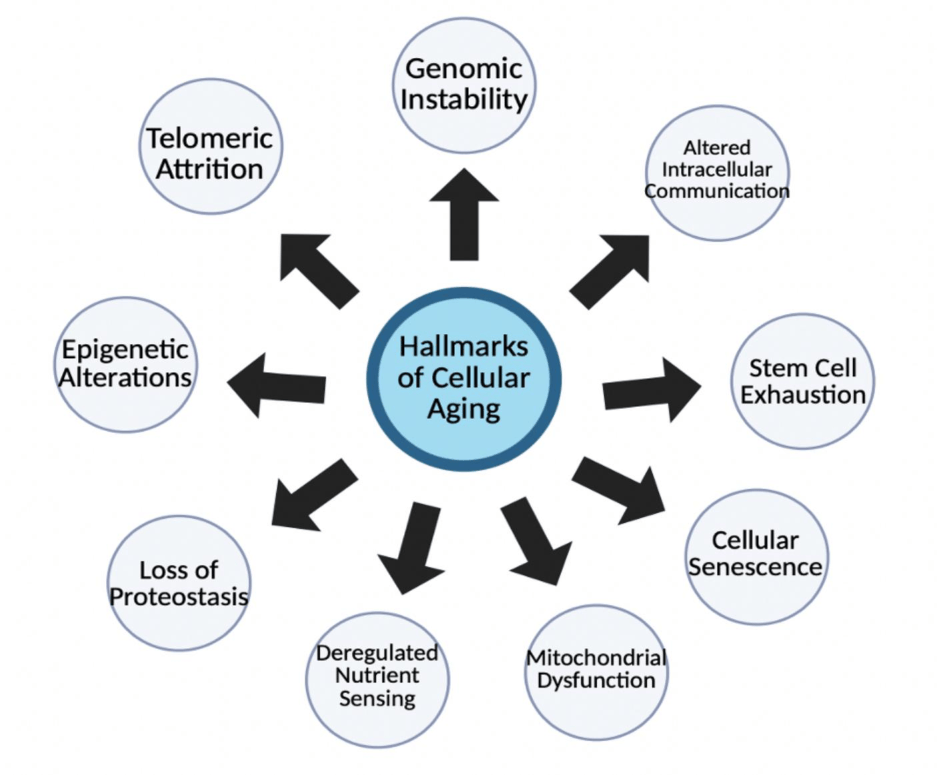
To better characterize GPCRs, this paper is investigating whether orphan GPCRs and their expression levels are linked to the biological process of aging. While aging is the overall loss of physiological integrity, biological aging is specifically the progressive decline in cellular function over time6. This decline is driven by accumulated molecular damage and dysregulated maintenance processes6. Figure 2 outlines the nine common denominators, or hallmarks, of cellular aging: genomic instability, telomeric attrition, epigenetic alterations, loss of proteostasis, deregulated nutrient-sensing, mitochondrial dysfunction, cellular senescence, stem cell exhaustion, and altered intercellular communication6. López-Otín et al. also frames aging as the convergence of multiple biological faults that interact with each other, rather than a single cause6.
Large-scale proteomic studies show that many proteins change abundance with chronological age, oftentimes in a tissue-specific manner7. Changes in protein levels reflect altered synthesis, degradation, post-translational modification, cellular composition shifts, and inflammation with age8. Most protein changes seen with aging occurred in waves, with peaks around 34, 60, and 78 years old9. Some of the proteins found in these age peaks had previously been associated with age-related disorders, including GDF15, SOST, ARFIP2, MMP12, and CHRDL19. These fluctuations in protein quality and amount can be attributed to the cellular hallmarks of aging as mentioned previously – factors like errors in protein synthesis, degradation, and removal all play roles in molecular aging9.
There are many mechanisms that cause age-related protein changes. The first mechanism is a loss of proteostasis, which refers to a cell’s declining ability to maintain a stable, functioning proteome10,11. Multiple interrelated molecular mechanisms drive this decline. Firstly, errors in protein synthesis accumulate with increasing age11. The translational machinery such as ribosomes, tRNAs, and others become less accurate, leading to an increased frequency of mistranslated or misfolded proteins12. These faulty proteins will interfere with cellular functions if not removed11. Secondly, the quality-control systems in a cell that refold or degrade abnormal proteins lose their efficiency over time11. This further causes damaged proteins to accumulate11. Thirdly, alterations in post-translational modifications, such as phosphorylation, acetylation, and glycosylation, affect protein stability13. These modification patterns shift with age, as enzymes express differently and cofactor availability changes13.
Orphan GPCRs are increasingly implicated in aging-relevant biology, yet direct, multi-tissue evidence that many orphan GPCR genes change expression with age is limited. The GPCR superfamily is the most intensely studied drug target family, yet a very small minority is explored therapeutically5. Furthermore, about 140 GPCRs are currently orphans, highlighting the vast number of underappreciated molecular targets5. Since these undiscovered drug targets have such a high potential, further research to understand the molecular functions of these receptors is necessary. A 2024 Frontiers review summarized orphan GPCR classification, de-orphanization criteria, and functional/therapeutic interest4. It provides a useful background in arguing why orphan GPCRs are promising aging candidates4. Additionally, another review by Frontiers in 2024 studied Class A orphan GPCRs (rhodopsin-like receptors) and their links to neuronal survival and signaling pathways implicated in neurodegeneration14. This related the GPCRs to brain biology in the context of aging, as changes in neuron-related signaling directly impacts brain function14.
Studies in the past have covered parts of cross-tissue aging and its effects on gene transcription and protein expression, and some have also used the GTEx database. For example, a study published in 2015 by Yang et al. used GTEx transcriptomic data across nine human tissues to investigate whether aging produces coordinated gene expression changes throughout the body15. The authors identified a set of age-associated genes that changed in a synchronized manner across multiple tissues, suggesting that some molecular features of aging are shared systemically rather than occurring independently in each organ15. At the same time, they observed substantial tissue-specific variation, indicating that aging affects tissues differently depending on biological context15. This is the closest conceptual precedent to this work, as it uses GTEx for cross-tissue age-correlational transcriptomic analysis15. Also, in 2022, Yamamoto et al. published a study quantifying how much aging versus genetics contributes to gene expression variation across 27 human tissues using GTEx data from 948 individuals16. The authors found that the effect of aging on gene expression was strongly tissue-dependent, with some tissues showing much larger age-related transcriptomic changes than others16. Overall, the study emphasized that aging does not affect all tissues uniformly and instead acts through tissue-specific molecular remodeling16. Furthermore, in 2020, Zeng et al. published a study using GTEx data to distinguish between healthy aging (aging without major disease burden) and common aging (aging in the broader population, including disease influences)17. The study concluded that not all age-associated gene expression changes are inherently harmful and that disease burden substantially shapes aging-associated molecular profiles17. Additionally, in 2018, Jia et al. published a work that systematically identified age-associated genes from GTEx transcriptomic datasets by correlating gene expression with chronological age18. The authors identified 1,573 age-related genes, dividing them into genes that increased expression with age and genes that decreased expression with age18. This methodologically precedes this work, as it validates the broader idea that correlating GTEx expression data with age is a meaningful approach. Finally, in 2019, Chatsirisupachai et al. analyzed transcriptomic patterns across multiple GTEx tissues to investigate how aging-related gene expression overlaps with pathways involved in cancer and cellular senescence19. The authors found that aging-associated transcriptional changes were highly tissue-specific, and the relationship between aging and cancer was more complex than expected19. The study reinforced the idea that aging is not characterized by a single universal transcriptional program but rather by heterogenous and tissue-dependent molecular changes19. Together, these findings highlight the complex nature of age-associated transcriptomic remodeling while underscoring a gap in understanding how orphan GPCR expression may vary with age across human tissues.
Methods
The Genotype-Tissue Expression Project, or GTEx database, is a public resource for researchers who are studying cell and tissue gene expression and regulation across individuals20. The database compiles both open and private data from three National Institute of Health projects. Samples on GTEx were collected across about 54 non-diseased tissue sites, and about 1000 adult individuals across various demographics were represented in the data20. Donors were aged 20-70, with over 19,000 samples in the final version of data20. With nine versions of open access data, GTEx has bulk tissue expression Transcripts per Million (TPM) files, TPM by tissue, metadata, haplotypes, exon read counts, and much more available for download20.
This correlational study uses GTEx version 10 data. Three files were used: Gene Expression Transcripts Per Million (TPM), the de-identified Sample Attributes file, and the de-identified Subject Phenotypes file. Since only public data was available, age was categorized in ranges of 10 years (ex. A 43 year-old subject is identified as 40-49). However, since the sample attribute and subject phenotype files were separate, a correlation could not be found between age and protein mRNA transcription unless the Sample IDs were linked to Subject IDs. In order to link subject phenotype to their respective TPMs, a joint file merging the Sample IDs and the Subject IDs was created, therefore matching subjects with their tissue samples. Python and a JupyterLab notebook were used to write a comprehensive Python script and to read the files given and generate log2 (TPM+1) expression change per decade (used to calculate percent change per decade), r-squared values, p-values, mean/median TPM values, and FDR correction for 16 orphan GPCRs across 50 tissues. The code that was written and used can be found in Appendix A. The equation used to calculate percent change using log2(TPM+1) values is presented below as equation 1, where beta is the age coefficient from the regression model using log2(TPM+1)-transformed expression values.
The equation used to calculate percent change in transcription per decade using the log2(TPM+1)-transformed expression values.
Slope values represent the relationship between age and GPCR mRNA transcription within each tissue analyzed. Transcript abundance values were log2(TPM+1) transformed prior to regression analysis, so slope estimates represent changes in log-transformed transcript expression rather than raw TPM values and are therefore reported as log2(TPM+1) expression change per decade. This allows for calculation of percent changes in expression by tissue, as all proteins have different baseline values. Percent change values can be found in the tables in the results section. The r-squared values represent the percent of variation in transcription that can be attributed to a change in age. The p-values represent the probability of getting the same results as those in the study, assuming age had no effect on mRNA transcription A low p-value (under 0.05) implies validity and statistical significance, as the results are extremely unlikely to be due to chance.
In addition to estimated percent transcript expression change per decade, standardized regression coefficients (β) are reported to provide a scale-independent measure of effect size. Unlike unstandardized regression coefficients, standardized β values account for differences in the variability of both age and transcript expression, allowing the relative strength of age-associated expression changes to be compared across different orphan GPCRs and tissues.
To evaluate age-associated changes in orphan GPCR transcript expression, multivariate linear regression models were performed independently for each receptor-tissue pair. Age was modeled as a continuous variable using midpoint values assigned to GTEx age ranges (20-29 = 25 years, 30-39 = 35 year, etc.). To account for potential confounding effects, models included sex as a required covariate and incorporated one additional available donor-level covariate, Hardy death classification (DTHHRDY). Non-numeric covariates were encoded as categorical variables using dummy-variable transformation prior to analysis.
Because a large number of receptor-tissue comparisons were conducted, p-values associated with the age coefficient were adjusted for multiple hypothesis testing using the Benjamini-Hochberg false discovery rate (FDR) procedure. Associations with an FDR-adjusted q-value < 0.05 were considered statistically significant, while nominal associations not surviving FDR correction were interpreted as exploratory trends.
GTEx TPM values quantify mRNA transcript abundance rather than protein abundance. Therefore, the findings of this study should be interpreted as age-associated changes in orphan GPCR transcriptional expression and not direct measures of receptor protein levels. Future studies incorporating proteomic or receptor-level validation may further clarity whether transcriptomic changes correspond to altered GPCR protein abundance or function.
GPCRs were chosen to test based on prior functional research, as well as their potential relevance in aging-related physiology. Disease associations and tissue information were derived from peer-reviewed primary literature cited in the reference list. Table 1 outlines background information on each of the 16 orphan GPCRs tested, including reasons for their selection and their relevance in processes related to aging.
| GPCR | Linked Diseases | Tissue Expression | Reason for Selection |
|---|---|---|---|
| GPR3 | Alzheimer’s disease biology, amyloid-β regulation, reproductive aging21. | CNS/brain, ovary, adipocytes, liver21. | GPR3 has strong links to neuronal signaling and has relevance to neurodegenerative disorders such as Alzheimer’s disease (risk factors increase with age)21. |
| GPR17 | Oligodendrocyte maturation, remyelination, multiple sclerosis, white matter inflammation22. | Oligodendrocyte precursor cells, oligodendroglial cells, CNS white matter23. | GPR17 is linked to CNS myelination/remyelination and neurodegenerative aging processes24. |
| GPR21 | Obesity, insulin resistance, type 2 diabetes-related metabolism and inflammation25. | Metabolic tissues including liver/adipose in mouse studies25. | GPR21 has been linked to glucose homeostasis and inflammatory metabolic phenotypes through deletion studies26. |
| GPR22 | Cardiac injury, myocardial infarction, heart failure susceptibility27. | Heart/cardiomyocytes, coronary arteries, brain27. | GPR22 loss of expression increases susceptibility to heart failure, which relates to cardiovascular decline with aging28. |
| GPR27 | Deletion alters acylcarnitine metabolism, glucose tolerance, insulin levels29. | Pancreas, skeletal muscle, adipose tissue29. | GPR27 has a reported role in metabolic tissues and insulin regulation, which is relevant to metabolic decline with age29. |
| GPR39 | Zinc sensing, epithelial repair, intestinal barrier function30. | Broadly expressed, but mostly in endocrine and metabolic tissues (liver, pancreas, GI tract31. | GPR39 functions in zinc sensing and epithelial repair, which are relevant in tissue maintenance with age30. |
| GPR50 | Lipid metabolism, insulin resistance, cancer aggressiveness, TGF- β signaling, mental disorders32. | Brain, pituitary gland, hypothalamus, tanycytes33. | GPR50 has relevance in energy homeostasis, psychiatry, and cancer, all of which are pertinent to aging34. |
| GPR52 | Neuropsychiatric disease associations, such as Huntington’s disease35. | Brain, most notably the striatum35. | GPR52 has links to the CNS and neurodegenerative diseases, both of which are affected by aging36. |
| GPR75 | Obesity and metabolic homeostasis37. | Brain, adipose tissue38. | Mutations in GPR75 influence body-weight regulation, which changes with age37. |
| GPR85 | Schizophrenia vulnerability, brain size, neural plasticity, potential links to autism spectrum disorder39. | Brain40. | GPR85 has a role in neural development, including neural development as age increases39. |
| GPR88 | Neuropsychiatric disorders, behavioral regulation41. | Brain striatum41. | GPR88 is striatum-specific, and it can influence behavioral decline with age41. |
| GPR135 | Diabetes42. | Expressed in many tissues, but expression is modified with diabetes42. | GPR135 has been linked to participate in the cardiovascular complications associated with diabetes, which is relevant in aging as susceptibility to these complications increases with age42. |
| GPR142 | Pathogenesis and development of diabetes or inflammatory diseases43. | Pancreatic β-cells and immune cells43. | GPR142 is involved in inflammatory and glucose metabolism pathways that significantly affect lifespan and metabolic aging44. |
| GPR161 | Triple-negative breast cancer, Hedgehog/ciliary signaling45. | Primary cilia and basal breast cancer cells46. | Ciliary signaling and breast cancer relevance connect GPR161 to aging-associated disease mechanisms45. |
| GPR182 | Cancer immunity, chemokine scavenging, immunotherapy resistance47. | Microvascular and lymphatic endothelial cells across organs, liver sinusoidal endothelium48. | GPR182 is implicated in cancer resistance and the tumor microenvironment, which are relevant to aging and cancer biology47. |
| GPRC5B | Obesity-associated inflammation, type 2 diabetes biology, β-cell/metabolic regulation49. | Brain, adipose tissue, pancreatic β cells49. | GPRC5B is linked to diet-induced obesity and type 2 diabetes, which are relevant in healthy aging and inflammatory processes49. |
Results
Overall Analysis
A total of 800 receptor-tissue regression models were evaluated across 16 orphan GPCRs using GTEx transcriptomic data. Age-associated changes in transcript expression were assessed using multivariable linear regression controlling for sex and cause of death (Hardy scale). Effect sizes are reported as standardized regression coefficients (β) and transcript abundance is reported as estimated percent expression change per decade derived from log2(TPM+1)-transformed expression values. Statistical significance was determined using Benjamini-Hochberg false discovery rate (FDR) correction.
Age-Associated Transcript Expression Following FDR Correction
Following multiple-testing correction, seven receptor-tissue pairs remained statistically significant (FDR q < 0.05) (Table 2).
| GPCR | Tissue | Mean Transcript Abundance (TPM) | Estimated Percent Change per Decade | R-squared value (rounded to five decimal places) | Standardized β (unitless) | FDR q-value (rounded to five decimal places) | Sample size (N) |
|---|---|---|---|---|---|---|---|
| GPR22 | Venous Blood | 2.8541 | +8.12% | 0.17543 | 0.101657 | 0.00785 | 1901 |
| GPR161 | Thyroid Gland | 6.4993 | -10.27% | 0.05062 | -0.164958 | 0.01681 | 713 |
| GPR27 | Dorsolateral Prefrontal Cortex | 24.0935 | -13.23% | 0.04525 | -0.211484 | 0.01681 | 372 |
| GPR3 | Dorsolateral Prefrontal Cortex | 3.4452 | -11.4% | 0.08415 | -0.19115 | 0.04452 | 372 |
| GPR85 | Venous Blood | 2.149 | +4.52% | 0.26348 | 0.078742 | 0.04452 | 1901 |
| GPR22 | Dorsolateral Prefrontal Cortex | 4.1305 | -16.72% | 0.04161 | -0.189145 | 0.04452 | 372 |
| GPR88 | Hypothalamus | 1.0948 | +13.85% | 0.05709 | 0.208986 | 0.04452 | 302 |
Exploratory Receptor-Tissue Associations
In addition to statistically significant findings, several receptor-tissue pairs demonstrated nominal age-associated trends that did not remain significant following FDR correction. These associations are presented as exploratory observations only and should not be interpreted as statistically confirmed findings. 84 tissues had a p-value less than 0.05, but to avoid subjective selection bias, exploratory findings were chosen objectively as the receptor–tissue pairs with the lowest nominal p-values among those not meeting the FDR significance threshold (Table 3).
| GPCR | Tissue | Mean Transcript Abundance (TPM) | Estimated Percent Change per Decade | R-squared value (rounded to five decimal places) | Standardized β (unitless) | FDR q-value (rounded to five decimal places) | p-value (rounded to five decimal places) | Sample size (N) |
|---|---|---|---|---|---|---|---|---|
| GPR3 | Venous Blood | 2.7668 | +4.36% | 0.09729 | 0.081232 | 0.07089 | 0.00061 | 1901 |
| GPR52 | Nucleus Accumbens | 0.3495 | -5.66% | 0.04366 | -0.19466 | 0.07089 | 0.00067 | 311 |
| GPR85 | Anterior Cingulate Cortex | 4.7679 | -12.46% | 0.06926 | -0.217852 | 0.07089 | 0.00073 | 243 |
| GPR161 | Fibroblast cell line | 4.3826 | -7.44% | 0.07928 | -0.149963 | 0.07089 | 0.00074 | 562 |
| GPR75 | Stomach | 2.2121 | -4.85% | 0.03375 | -0.172615 | 0.10502 | 0.00139 | 379 |
| GPR88 | C1 – Cervical Spinal Cord | 1.5572 | +15.34% | 0.05110 | 0.223259 | 0.11257 | 0.00159 | 202 |
| GPR22 | Nucleus Accumbens | 0.5282 | -7.23% | 0.03216 | -0.179233 | 0.11395 | 0.00182 | 311 |
| GPR161 | Venous Blood | 4.0305 | -3.85% | 0.02750 | -0.076675 | 0.11395 | 0.00183 | 1901 |
| GPR75 | Esophagus Squamous Epithelium | 2.038 | -4.07% | 0.04851 | -0.132879 | 0.11545 | 0.00217 | 601 |
| GPR27 | Ascending Aorta | 4.3361 | -8.49% | 0.02571 | -0.162431 | 0.11545 | 0.00221 | 397 |
| GPR182 | Esophagus Squamous Epithelium | 1.3155 | -5.92% | 0.02044 | -0.134377 | 0.11545 | 0.00225 | 601 |
| GPR22 | Thyroid Gland | 1.2043 | +7.39% | 0.01436 | 0.12209 | 0.12205 | 0.00253 | 713 |
| GPR182 | Ascending Aorta | 1.7795 | +9.24% | 0.02657 | 0.158312 | 0.12940 | 0.00283 | 397 |
| GPR22 | Substantia Nigra | 2.1095 | -14.13% | 0.05112 | -0.227984 | 0.16242 | 0.00385 | 173 |
| GPR39 | Hypothalamus | 0.3756 | -6.12% | 0.04499 | -0.166592 | 0.16242 | 0.00398 | 302 |
Discussion
Overall, the results suggest that aging is not associated with a universal increase or decrease in orphan GPCR transcript expression. Instead, age-associated transcriptional changes appear to be highly tissue-dependent, with different receptors exhibiting distinct expression patterns across individual tissues.
After correction for multiple hypothesis testing, seven receptor-tissue pairs remained statistically significant. Of those seven, three were in the dorsolateral prefrontal cortex, two were in venous blood, and two were GPR22 receptor-tissue pairs. This indicates that the dorsolateral prefrontal cortex cells and venous blood cells may see the most change in orphan GPCR transcription with age, and those tissues may be the most impacted with age. Although the magnitude and direction of expression changes different among those receptors, the persistence of significance following FDR correction demonstrates that aging is associated with altered transcript expression for a subset of orphan GPCRs. Furthermore, notably, several of the significant associations occurred within neural tissues, including the dorsolateral prefrontal cortex and hypothalamus, supporting previous evidence that GPCR signaling is particularly important in the aging nervous system14. Within the tissues that survived FDR correction, GPR85 in the venous blood cells saw the highest r-squared value, with 26.3% of the variation in GPR85 transcription being due to aging. GPR22 in the dorsolateral prefrontal cortex saw the largest percent change per decade in transcript expression, as it saw a decrease of 16.7% expression per decade.
Several exploratory associations also occurred in endocrine and metabolically active tissues, including the thyroid gland, adrenal gland, liver, stomach, adipose tissue, and gastrointestinal tract. Table 1 outlines previous investigations that have linked several orphan GPCRs in this study, including GPR21, GPR27, GPR75, GPR142, and GPR39 to glucose metabolism, obesity, insulin signaling, and inflammatory regulation. Although a lot of these associations did not survive FDR correction, their occurrence within metabolically relevant tissues supports the hypothesis that age-related transcriptional regulation of orphan GPCRs may contribute to broader metabolic changes observed during aging. From the exploratory findings, GPR3 in venous blood saw the lowest p-value and the highest r-squared value, with 9.7% of the variation in GPR3 transcript expression being attributed to aging. Furthermore, GPR88 in the C1 cervical spinal cord saw the largest percent change in transcript expression, with an increase of 15.34% per decade.
Similarly, exploratory associations identified in vascular and connective tissues, such as venous blood, ascending aorta, tibial artery, fibroblast cell lines, and adipose tissue, suggest that aging-related transcriptional changes may extend beyond the nervous system. Altered transcript expression of orphan GPCRs within these tissues may therefore reflect broader systemic adaptations rather than isolated tissue-specific effects.
An important finding of this study is the apparent absence of a consistent directional trend across receptors. Some orphan GPCRs demonstrated increased transcript expression with advancing age, whereas others demonstrated decreased expression. Furthermore, the same receptor frequently exhibited different directions of association across tissues. This observation suggests that aging does not globally upregulate or suppress orphan GPCR transcription. Instead. transcriptional regulation appears to depend upon the local physiological environment and specific regulatory networks within tissues. These findings emphasize that orphan GPCRs are very tissue specific and transcriptional regulation with age is a complex process.
Several limitations should be considered when interpreting these findings. First, GTEx transcriptomic data quantify mRNA abundance rather than protein expression. Therefore, observed changes represent alterations in transcript expression and cannot be assumed to directly reflect receptor protein abundance or functional activity. Second, publicly accessible data on GTEx provides age in ranges of ten years20, which limits the validity of the results. This leaves room for error within decades, and the error is hidden in the data. Third, despite adjustment for sex and available donor-level covariates, additional biological and environmental factors that influence gene transcription may remain unaccounted for. Finally, although numerous nominal associations were identified, most did not remain significant after correction for multiple testing and should therefore be interpreted as exploratory observations requiring independent validation.
Despite these limitations, this study provides a systematic cross-tissue evaluation of orphan GPCR transcript changes with age in humans. By integrating transcriptomic data across multiple tissues and applying multivariable regression with false discovery rate correction, this work establishes a quantitative framework for identifying orphan GPCRs whose transcription may be altered during aging. These findings also provide a prioritized set of receptor-tissue pairs that may serve as candidates for future mechanistic investigation using proteomic analyses and functional validation.
Conclusion
In conclusion, while only a limited number of receptor–tissue pairs remained significant following correction for multiple testing, the findings indicate that aging is associated with tissue-specific changes rather than global changes in orphan GPCR transcript expression. The predominance of associations within neural, endocrine, metabolic, and vascular tissues further suggests that orphan GPCRs may contribute to several physiological systems known to undergo age-related remodeling.
Although the present analysis is correlational and limited to transcript abundance, it provides a systematic framework for identifying orphan GPCRs that warrant further investigation. Future studies will be necessary to determine whether the transcriptional changes identified here translate into altered receptor abundance or biological activity. Collectively, these findings contribute to a growing understanding of orphan GPCR biology and identify potential targets for future research into the molecular mechanisms of human aging.
Appendix A
import pandas as pd
import numpy as np
import os
import statsmodels.api as sm
from statsmodels.stats.multitest import multipletests

# =====================
# INPUT FILES
# =====================
gct_file = "/Users/kyrannasaurous/Downloads/GTEx/GTEx_Analysis_2022-06-06_v10_RNASeQCv2.4.2_gene_tpm_non_lcm.gct"
sample_attr_file = "/Users/kyrannasaurous/Downloads/GTEx/sample_SAMPID_SUBJID_attributes.xlsx"
subject_file = "/Users/kyrannasaurous/Downloads/GTEx/GTEx_Analysis_v10_Annotations_SubjectPhenotypesDS.txt"

out_dir = "/Users/kyrannasaurous/Documents/orphan_gpcr_slopes_multivariate_FDR_with_TPM_context_standardized_beta"
os.makedirs(out_dir, exist_ok=True)
orphan_gpcrs = [
    "GPR3","GPR27","GPR50","GPR52","GPR85","GPR88","GPRC5B","GPR75",
    "GPR142","GPR148","GPR182","GPR39","GPR21","GPR135","GPR22","GPR63",
    "GPR171","GPR150","GPR161","GPR17"
]

# =====================
# LOAD METADATA
# =====================
print("Loading metadata files...")
samples = pd.read_excel(sample_attr_file)
subjects = pd.read_csv(subject_file, sep="\t", low_memory=False)

samples.columns = samples.columns.str.strip()
subjects.columns = subjects.columns.str.strip()

age_map = {
    "20-29": 25,
    "30-39": 35,
    "40-49": 45,
    "50-59": 55,
    "60-69": 65,
    "70-79": 75,
    "80+": 85
}

subjects["AGE_YEARS"] = subjects["AGE"].astype(str).map(age_map)

# =====================
# IDENTIFY AVAILABLE COVARIATES
# =====================
candidate_covariates = ["SEX", "BMI", "DTHHRDY", "COD"]
available_covariates = [c for c in candidate_covariates if c in subjects.columns]

print("Available subject covariates:", available_covariates)

if "SEX" not in available_covariates:
    raise ValueError("SEX was not found in the subject phenotype file.")

covariates = ["SEX"]

for c in ["BMI", "DTHHRDY", "COD"]:
    if c in available_covariates:
        covariates.append(c)
        break

if len(covariates) < 2:
    raise ValueError("Need sex plus at least one additional covariate, but none was found.")

print("Using covariates:", covariates)

# =====================
# MERGE SAMPLE + SUBJECT METADATA
# =====================
meta_cols = ["SUBJID", "AGE_YEARS"] + available_covariates

samples = samples.merge(
    subjects[meta_cols],
    on="SUBJID",
    how="left",
    suffixes=("", "_subject")
)

for col in ["AGE_YEARS", "SEX", "BMI", "DTHHRDY", "COD"]:
    if col not in samples.columns and f"{col}_subject" in samples.columns:
        samples[col] = samples[f"{col}_subject"]

needed_cols = ["SAMPID", "SUBJID", "SMTSD", "AGE_YEARS"] + covariates
missing_cols = [c for c in needed_cols if c not in samples.columns]

if missing_cols:
    print("Columns available in samples:")
    print(samples.columns.tolist())
    raise KeyError(f"Missing required columns after merge: {missing_cols}")

samples = samples.dropna(subset=["AGE_YEARS", "SMTSD"] + covariates)

print(f"Samples with usable metadata: {len(samples)}")

# =====================
# READ GCT HEADER
# =====================
print("Reading GCT header...")
with open(gct_file) as f:
    next(f)
    nrows, ncols = map(int, f.readline().strip().split())
    header = f.readline().strip().split("\t")

sample_ids = header[2:]

print(f"Header read: {len(sample_ids)} samples")

# =====================
# MODEL FUNCTION
# =====================
def run_multivariate_model(df, covariates):
    y = df["Expression"]

    X = df[["AGE_YEARS"] + covariates].copy()

    X = pd.get_dummies(X, drop_first=True)
    X = X.apply(pd.to_numeric, errors="coerce")

    model_df = pd.concat([y, X], axis=1).dropna()

    if model_df.shape[0] < 10:
        return None

    y_clean = model_df["Expression"]
    X_clean = model_df.drop(columns=["Expression"])

    if X_clean.shape[0] <= X_clean.shape[1] + 2:
        return None

    # Calculate standardized beta for age:
    # standardized beta = unstandardized beta * SD(age) / SD(expression)
    sd_age = X_clean["AGE_YEARS"].std()
    sd_expression = y_clean.std()

    X_clean = sm.add_constant(X_clean)

    model = sm.OLS(y_clean, X_clean).fit()

    age_beta = model.params.get("AGE_YEARS", np.nan)

    if sd_age == 0 or sd_expression == 0 or pd.isna(sd_age) or pd.isna(sd_expression):
        standardized_beta_age = np.nan
    else:
        standardized_beta_age = age_beta * (sd_age / sd_expression)

    return {
        "Age_Beta_log2_per_year": age_beta,
        "Standardized_Beta_Age": standardized_beta_age,
        "Age_SE": model.bse.get("AGE_YEARS", np.nan),
        "Age_p_value": model.pvalues.get("AGE_YEARS", np.nan),
        "Model_R2": model.rsquared,
        "N": int(model.nobs),
        "Covariates": ",".join(covariates)
    }

# =====================
# PROCESS GENES
# =====================
all_results = []

for gene in orphan_gpcrs:
    print(f"\nProcessing {gene}...")

    gene_row = None

    with open(gct_file) as f:
        for _ in range(3):
            next(f)

        for line in f:
            parts = line.rstrip("\n").split("\t")

            if parts[1] == gene:
                gene_row = [float(x) for x in parts[2:]]
                break

    if gene_row is None:
        print(f"{gene} not found. Skipping.")
        continue

    gene_tpm = pd.Series(gene_row, index=sample_ids)

    for tissue, group in samples.groupby("SMTSD"):

        group_samples = [
            s for s in group["SAMPID"]
            if s in gene_tpm.index
        ]

        if len(group_samples) < 10:
            continue

        tmp = group[group["SAMPID"].isin(group_samples)].copy()
        tmp = tmp.set_index("SAMPID").loc[group_samples].copy()

        raw_tpm_values = gene_tpm[group_samples].astype(float)

        mean_tpm = raw_tpm_values.mean()
        median_tpm = raw_tpm_values.median()

        tmp["Expression"] = np.log2(raw_tpm_values + 1)

        result = run_multivariate_model(tmp, covariates)

        if result is None:
            continue

        age_beta_per_year = result["Age_Beta_log2_per_year"]
        age_beta_per_decade = age_beta_per_year * 10

        estimated_percent_change_per_decade = (
            (2 ** age_beta_per_decade) - 1
        ) * 100

        result.update({
            "Gene": gene,
            "Tissue": tissue,
            "Mean_TPM": round(mean_tpm, 4),
            "Median_TPM": round(median_tpm, 4),
            "Age_Beta_log2_per_decade": round(age_beta_per_decade, 6),
            "Estimated_Percent_Change_Per_Decade": round(
                estimated_percent_change_per_decade, 2
            ),
            "Standardized_Beta_Age": round(result["Standardized_Beta_Age"], 6)
        })

        all_results.append(result)
# =====================
# FDR CORRECTION
# =====================
results_df = pd.DataFrame(all_results)

if results_df.empty:
    print("No valid models were run.")
else:
    results_df = results_df.dropna(subset=["Age_p_value"])

    rejected, qvals, _, _ = multipletests(
        results_df["Age_p_value"],
        alpha=0.05,
        method="fdr_bh"
    )

    results_df["FDR_q_value"] = qvals
    results_df["FDR_significant_0.05"] = rejected

    results_df = results_df.sort_values(["FDR_q_value", "Age_p_value"])

    combined_file = os.path.join(
        out_dir,
        "all_orphan_GPCR_age_multivariate_FDR_results_with_TPM_context_standardized_beta.csv"
    )

    results_df.to_csv(combined_file, index=False)

    print(f"\nCombined FDR-corrected results saved to: {combined_file}")

    for gene, df_gene in results_df.groupby("Gene"):
        out_file = os.path.join(
            out_dir,
            f"{gene}_multivariate_age_FDR_results_with_TPM_context_standardized_beta.csv"
        )
        df_gene.to_csv(out_file, index=False)

    sig_df = results_df[results_df["FDR_significant_0.05"]]

    print("\nSignificant after FDR q < 0.05:")
    print(sig_df[[
        "Gene",
        "Tissue",
        "Mean_TPM",
        "Median_TPM",
        "Age_Beta_log2_per_year",
        "Age_Beta_log2_per_decade",
        "Estimated_Percent_Change_Per_Decade",
        "Standardized_Beta_Age",
        "Age_SE",
        "Age_p_value",
        "FDR_q_value",
        "N",
        "Covariates"
    ]])
Supplementary Information
References
- M. Zhang, T. Chen, X. Lu, X. Lan, Z. Chen. G protein-coupled receptors (GPCRs): advances in structures, mechanisms and drug discovery. Signal Transduction Target Therapy Vol. 9,, pg. 88, 2024, https://doi.org/10.1038/s41392-024-01803-6. [↩] [↩] [↩] [↩]
- D. Calebiro, Z. Koszegi, Y. Lanoiselée, T. Miljus, S. O’Brien. G protein-coupled receptor-G protein interactions: a single-molecule perspective. Physiological Reviews. Vol. 101, pg. 857–906, 2021, https://doi.org/10.1152/physrev.00021.2020. [↩]
- S. Liu, P. J. Anderson, S. Rajagopal, R. J. Lefkowitz, H. A. Rockman. G protein-coupled receptors: a century of research and discovery. Circulation Research. Vol. 135, pg. 174–197, 2024, https://doi.org/10.1161/CIRCRESAHA.124.323067. [↩] [↩]
- A. Jobe, R. Vijayan. Orphan G protein-coupled receptors: the ongoing search for a home. Frontiers in Pharmacology. Vol. 15, pg. 1349097, 2024, https://doi.org/10.3389/fphar.2024.1349097. [↩] [↩] [↩] [↩] [↩] [↩]
- S. Maudsley, D. Walter, C. Schrauwen, N. Van Loon, İ. Harputluoğlu, J. Lenaerts, P. McDonald. Intersection of the orphan G protein-coupled receptor, GPR19, with the aging process. International Journal of Molecular Sciences. Vol. 23, pg. 13598, 2022, https://doi.org/10.3390/ijms232113598. [↩] [↩] [↩]
- C. López-Otín, M. A. Blasco, L. Partridge, M. Serrano, G. Kroemer. The hallmarks of aging. Cell. Vol. 153, pg. 1194–1217, 2013, https://doi.org/10.1016/j.cell.2013.05.039. [↩] [↩] [↩] [↩]
- Y. Ding, Y. Zuo, B. Zhang, Y. Fan, G. Xu, Z. Cheng, S. Ma, S. Fang, A. Tian, D. Gao, X. Xu, Q. Wang, Y. Jing, M. Jiang, M. Xiong, J. Li, Z. Han, S. Sun, S. Wang, F. He, J. Yang, J. Qu, W. Zhang, G.-H. Liu. Comprehensive human proteome profiles across a 50-year lifespan reveal aging trajectories and signatures. Cell. Vol. 188, pg. 5763–5784.e26, 2025, https://doi.org/10.1016/j.cell.2025.06.047. [↩]
- A. A. Kliuchnikova, E. V. Ilgisonis, A. I. Archakov, E. A. Ponomarenko, A. A. Moskalev. Proteomic markers of aging and longevity: a systematic review. International Journal of Molecular Sciences. Vol. 25, pg. 12634, 2024, https://doi.org/10.3390/ijms252312634. [↩]
- B. Lehallier, D. Gate, N. Schaum, T. Nanasi, S. E. Lee, H. Yousef, P. Moran Losada, D. Berdnik, A. Keller, J. Verghese, S. Sathyan, C. Franceschi, S. Milman, N. Barzilai, T. Wyss-Coray. Undulating changes in human plasma proteome profiles across the lifespan. Nature Medicine. Vol. 25, pg. 1843–1850, 2019, https://doi.org/10.1038/s41591-019-0673-2. [↩] [↩] [↩]
- C. López-Otín, M. A. Blasco, L. Partridge, M. Serrano, G. Kroemer. The hallmarks of aging. Cell. Vol. 153, pg. 1194–1217, 2013, https://doi.org/10.1016/j.cell.2013.05.039. [↩]
- J. Labbadia, R. I. Morimoto. The biology of proteostasis in aging and disease. Annual Review of Biochemistry. Vol. 84, pg. 435–464, 2015, https://doi.org/10.1146/annurev-biochem-060614-033955. [↩] [↩] [↩] [↩] [↩]
- J. Llewellyn, S. J. Hubbard, J. Swift. Translation is an emerging constraint on protein homeostasis in ageing. Trends in Cell Biology. Vol. 34, pg. 646–656, 2024, https://doi.org/10.1016/j.tcb.2024.02.001. [↩]
- S. K. Nanda, S. Vollmer, A. B. Perez-Oliva. Posttranslational regulation of inflammasomes, its potential as biomarkers and in the identification of novel drugs targets. Frontiers in Cell and Developmental Biology. Vol. 10, pg. 887533, 2022, https://doi.org/10.3389/fcell.2022.887533. [↩] [↩]
- D. Öz-Arslan, M. Yavuz, B. Kan. Exploring orphan GPCRs in neurodegenerative diseases. Frontiers in Pharmacology. Vol. 15, pg. 1394516, 2024, https://doi.org/10.3389/fphar.2024.1394516. [↩] [↩] [↩]
- J. Yang, T. Huang, F. Petralia, Q. Long, B. Zhang, C. Argmann, Y. Zhao, C. Mobbs, E. Schadt, J. Zhu, Z. Tu. Synchronized age-related gene expression changes across multiple tissues in human and the link to complex diseases. Scientific Reports. Vol. 5, pg. 15145, 2015, https://doi.org/10.1038/srep15145. [↩] [↩] [↩] [↩]
- R. Yamamoto, R. Chung, J. M. Vazquez, H. Sheng, P. Steinberg, N. Ioannidis, P. Sudmant. Tissue-specific impacts of aging and genetics on gene expression patterns in humans. Nature Communications. Vol. 13, pg. 5803, 2022, https://doi.org/10.1038/s41467-022-33509-0. [↩] [↩] [↩]
- L. Zeng, J. Yang, S. Peng, J. Zhu, B. Zhang, Y. Suh, Z. Tu. Transcriptome analysis reveals the difference between “healthy” and “common” aging and their connection with age-related diseases. Aging Cell. Vol. 19, pg. e13121, 2020, https://doi.org/10.1111/acel.13121. [↩] [↩]
- K. Jia, C. Cui, Y. Gao, Y. Zhou, Q. Cui. An analysis of aging-related genes derived from the Genotype-Tissue Expression project (GTEx). Cell Death Discovery. Vol. 4, pg. 91, 2018, https://doi.org/10.1038/s41420-018-0093-y. [↩] [↩]
- G. A. Dos Santos, K. Chatsirisupachai, R. A. Avelar, J. P. de Magalhães. Transcriptomic analysis reveals a tissue-specific loss of identity during ageing and cancer. BMC Genomics. Vol. 24, pg. 644, 2023, https://doi.org/10.1186/s12864-023-09756-w. [↩] [↩] [↩]
- GTEx Consortium. The Genotype-Tissue Expression (GTEx) project. Nature Genetics. Vol. 45, pg. 580–585, 2013, https://doi.org/10.1038/ng.2653. [↩] [↩] [↩] [↩] [↩]
- B. D. Feng, J. Y. Qin, Q. Q. Qin, Z. C. Xu, H. Q. Zhang. GPR3 in neuro-metabolic-immune-reproductive nexus – a potential therapeutic target for multi-system diseases. Annals of Medicine. Vol. 58, pg. 2619216, 2026, https://doi.org/10.1080/07853890.2026.2619216. [↩] [↩] [↩]
- G. T. Coppolino, D. Marangon, C. Negri, G. Menichetti, M. Fumagalli, P. Gelosa, L. Dimou, R. Furlan, D. Lecca, M. P. Abbracchio. Differential local tissue permissiveness influences the final fate of GPR17-expressing oligodendrocyte precursors in two distinct models of demyelination. Glia. Vol. 66, pg. 1118–1130, 2018, https://doi.org/10.1002/glia.23305. [↩]
- J. Angelini, D. Marangon, S. Raffaele, D. Lecca, M. P. Abbracchio. The distribution of GPR17-expressing cells correlates with white matter inflammation status in brain tissues of multiple sclerosis patients. International Journal of Molecular Sciences. Vol. 22, pg. 4574, 2021, https://doi.org/10.3390/ijms22094574. [↩]
- Y. Chen, H. Wu, S. Wang, H. Koito, J. Li, F. Ye, J. Hoang, S. S. Escobar, A. Gow, H. A. Arnett, B. D. Trapp, N. J. Karandikar, J. Hsieh, Q. R. Lu. The oligodendrocyte-specific G protein-coupled receptor GPR17 is a cell-intrinsic timer of myelination. Nature Neuroscience. Vol. 12, pg. 1398–1406, 2009, https://doi.org/10.1038/nn.2410. [↩]
- O. Osborn, D. Y. Oh, J. McNelis, M. Sanchez-Alavez, S. Talukdar, M. Lu, P. Li, L. Thiede, H. Morinaga, J. J. Kim, J. Heinrichsdorff, S. Nalbandian, J. M. Ofrecio, M. Scadeng, S. Schenk, J. Hadcock, T. Bartfai, J. M. Olefsky. G protein-coupled receptor 21 deletion improves insulin sensitivity in diet-induced obese mice. Journal of Clinical Investigation. Vol. 122, pg. 2444–2453, 2012, https://doi.org/10.1172/JCI61953. [↩] [↩]
- D. M. Riddy, H. L. Kammoun, A. J. Murphy, S. Bosnyak-Gladovic, R. De la Fuente Gonzalez, J. Merlin, M. Ziemann, S. Fabb, T. L. Pierce, N. Diepenhorst, P. Rueda, A. El-Osta, J. F. Gautier, N. Venteclef, W. N. Charman, A. Christopoulos, P. M. Sexton, R. J. Summers, M. A. Febbraio, P. Delerive, C. J. Langmead. Deletion of GPR21 improves glucose homeostasis and inhibits the CCL2-CCR2 axis by divergent mechanisms. BMJ Open Diabetes Research & Care. Vol. 9, pg. e002285, 2021, https://doi.org/10.1136/bmjdrc-2021-002285. [↩]
- J. W. Adams, J. Wang, J. R. Davis, C. Liaw, I. Gaidarov, J. Gatlin, N. D. Dalton, Y. Gu, J. Ross Jr., D. Behan, K. Chien, D. Connolly. Myocardial expression, signaling, and function of GPR22: a protective role for an orphan G protein-coupled receptor. American Journal of Physiology-Heart and Circulatory Physiology. Vol. 295, pg. H509–H521, 2008, https://doi.org/10.1152/ajpheart.00368.2008. [↩] [↩]
- C. C. Chang, C. H. Chen, S. Y. Hsu, S. Leu. Cardiomyocyte-specific overexpression of GPR22 ameliorates cardiac injury in mice with acute myocardial infarction. BMC Cardiovascular Disorders. Vol. 24, pg. 287, 2024, https://doi.org/10.1186/s12872-024-03953-5. [↩]
- A. K. Nath, J. Ma, Z. Z. Chen, Z. Li, M. D. C. Vitery, M. L. Kelley, R. T. Peterson, R. E. Gerszten, J. J. Yeh. Genetic deletion of gpr27 alters acylcarnitine metabolism, insulin sensitivity, and glucose homeostasis in zebrafish. FASEB Journal. Vol. 34, pg. 1546–1557, 2020, https://doi.org/10.1096/fj.201901466R. [↩] [↩] [↩]
- L. Cohen, I. Sekler, M. Hershfinkel. The zinc sensing receptor, ZnR/GPR39, controls proliferation and differentiation of colonocytes and thereby tight junction formation in the colon. Cell Death & Disease. Vol. 5, pg. e1307, 2014, https://doi.org/10.1038/cddis.2014.262. [↩] [↩]
- A. Laitakari, L. Liu, T. M. Frimurer, B. Holst. The zinc-sensing receptor GPR39 in physiology and as a pharmacological target. International Journal of Molecular Sciences. Vol. 22, pg. 3872, 2021, https://doi.org/10.3390/ijms22083872. [↩]
- S. Wojciech, R. Ahmad, Z. Belaid-Choucair, A. S. Journé, S. Gallet, J. Dam, A. Daulat, D. Ndiaye-Lobry, O. Lahuna, A. Karamitri, J. L. Guillaume, M. Do Cruzeiro, F. Guillonneau, A. Saade, N. Clément, T. Courivaud, N. Kaabi, K. Tadagaki, P. Delagrange, V. Prévot, O. Hermine, C. Prunier, R. Jockers. The orphan GPR50 receptor promotes constitutive TGFβ receptor signaling and protects against cancer development. Nature Communications. Vol. 9, pg. 1216, 2018, https://doi.org/10.1038/s41467-018-03609-x. [↩]
- Z. Yao, J. Meng, J. Long, L. Li, W. Qiu, C. Li, J. V. Zhang, P. G. Ren. Orphan receptor GPR50 attenuates inflammation and insulin signaling in 3T3-L1 preadipocytes. FEBS Open Bio. Vol. 13, pg. 89–101, 2023, https://doi.org/10.1002/2211-5463.13516. [↩]
- P. K. Biswas, S. R. Park, J. An, K. M. Lim, A. A. Dayem, K. Song, H. Y. Choi, Y. Choi, K. S. Park, H. J. Shin, A. Kim, M. Gil, S. K. Saha, S. G. Cho. The orphan GPR50 receptor regulates the aggressiveness of breast cancer stem-like cells via targeting the NF-kB signaling pathway. International Journal of Molecular Sciences. Vol. 24, pg. 2804, 2023, https://doi.org/10.3390/ijms24032804. [↩]
- H. Song, H. Li, S. Guo, Y. Pan, Y. Fu, Z. Zhou, Z. Li, X. Wen, X. Sun, B. He, H. Gu, Q. Zhao, C. Wang, P. An, S. Luo, Y. Hu, X. Xie, B. Lu. Targeting Gpr52 lowers mutant HTT levels and rescues Huntington’s disease-associated phenotypes. Brain. Vol. 141, pg. 1782–1798, 2018, https://doi.org/10.1093/brain/awy081. [↩] [↩]
- Y. Yao, X. Cui, I. Al-Ramahi, X. Sun, B. Li, J. Hou, M. DiFiglia, J. Palacino, Z. Y. Wu, L. Ma, J. Botas, B. Lu. A striatal-enriched intronic GPCR modulates huntingtin levels and toxicity. eLife. Vol. 4, pg. e05449, 2015, https://doi.org/10.7554/eLife.05449. [↩]
- Y. Jiang, Y. Xun, Z. Zhang. Central regulation of feeding and body weight by ciliary GPR75. Journal of Clinical Investigation. Vol. 134, pg. e182121, 2024, https://doi.org/10.1172/JCI182121. [↩] [↩]
- S. Hossain, E. Villegas, C. Liapes, N. Sultana, D. Krasniqi, D. Diegisser, A. Castro, C. Williams, A. Gruzdev, D. C. Zeldin, V. Garcia, M. L. Schwartzman. Gpr75 deletion in adipocytes protects from diet-induced obesity: changes in glucose homeostasis and inflammatory responses. FASEB Journal. Vol. 40, pg. e71579, 2026, https://doi.org/10.1096/fj.202504597R. [↩]
- M. Matsumoto, R. E. Straub, S. Marenco, K. K. Nicodemus, S. Matsumoto, A. Fujikawa, S. Miyoshi, M. Shobo, S. Takahashi, J. Yarimizu, M. Yuri, M. Hiramoto, S. Morita, H. Yokota, T. Sasayama, K. Terai, M. Yoshino, A. Miyake, J. H. Callicott, M. F. Egan, A. Meyer-Lindenberg, L. Kempf, R. Honea, R. K. Vakkalanka, J. Takasaki, M. Kamohara, T. Soga, H. Hiyama, H. Ishii, A. Matsuo, S. Nishimura, N. Matsuoka, M. Kobori, H. Matsushime, M. Katoh, K. Furuichi, D. R. Weinberger. The evolutionarily conserved G protein-coupled receptor SREB2/GPR85 influences brain size, behavior, and vulnerability to schizophrenia. Proceedings of the National Academy of Sciences of the United States of America. Vol. 105, pg. 6133–6138, 2008, https://doi.org/10.1073/pnas.0710717105. [↩] [↩]
- E. Fujita-Jimbo, Y. Tanabe, Z. Yu, K. Kojima, M. Mori, H. Li, S. Iwamoto, T. Yamagata, M. Y. Momoi, T. Momoi. The association of GPR85 with PSD-95-neuroligin complex and autism spectrum disorder: a molecular analysis. Molecular Autism. Vol. 6, pg. 17, 2015, https://doi.org/10.1186/s13229-015-0012-5. [↩]
- G. Chen, J. Xu, A. Inoue, M. F. Schmidt, C. Bai, Q. Lu, P. Gmeiner, Z. Liu, Y. Du. Activation and allosteric regulation of the orphan GPR88-Gi1 signaling complex. Nature Communications. Vol. 13, pg. 2375, 2022, https://doi.org/10.1038/s41467-022-30081-5. [↩] [↩] [↩]
- A. Ruiz-Hernández, R. Romero-Nava, F. Huang, E. Hong, S. Villafaña. Altered function and expression of the orphan GPR135 at the cardiovascular level in diabetic Wistar rats. Journal of Receptors and Signal Transduction. Vol. 38, pg. 484–491, 2018, https://doi.org/10.1080/10799893.2019.1597116. [↩] [↩] [↩]
- M. Murakoshi, H. Kuwabara, M. Nagasaki, Y. M. Xiong, J. D. Reagan, H. Maeda, F. Nara. Discovery and pharmacological effects of a novel GPR142 antagonist. Journal of Receptors and Signal Transduction. Vol. 37, pg. 290–296, 2017, https://doi.org/10.1080/10799893.2016.1247861. [↩] [↩]
- Y. Ueda, H. Iwakura, T. Ensho, M. Bando-Shimizu, A. Doi, N. Matsutani, S. Morita, H. Inaba, H. Ariyasu, N. Fukuda, K. Hayata, T. Ojima, M. Nishi, T. A. Matsuoka, H. Yamaue, T. Akamizu. Tryptophan-sensing receptor GPR142 expression levels are directly regulated by proinflammatory cytokines in ghrelin-producing cells. FEBS Open Bio. Vol. 15, pg. 763–772, 2025, https://doi.org/10.1002/2211-5463.13973. [↩]
- M. E. Feigin, B. Xue, M. C. Hammell, S. K. Muthuswamy. G-protein-coupled receptor GPR161 is overexpressed in breast cancer and is a promoter of cell proliferation and invasion. Proceedings of the National Academy of Sciences of the United States of America. Vol. 111, pg. 4191–4196, 2014, https://doi.org/10.1073/pnas.1320239111. [↩] [↩]
- S.-H. Hwang, B. N. Somatilaka, K. White, S. Mukhopadhyay. Ciliary and extraciliary Gpr161 pools repress hedgehog signaling in a tissue-specific manner. eLife. Vol. 10, pg. e67121, 2021, https://doi.org/10.7554/eLife.67121. [↩]
- R. J. Torphy, Y. Sun, R. Lin, A. Caffrey-Carr, Y. Fujiwara, F. Ho, E. N. Miller, M. D. McCarter, T. Lyons, R. D. Schulick, R. M. Kedl, Y. Zhu. GPR182 limits antitumor immunity via chemokine scavenging in mouse melanoma models. Nature Communications. Vol. 13, pg. 97, 2022, https://doi.org/10.1038/s41467-021-27658-x. [↩] [↩]
- A. Le Mercier, R. Bonnavion, W. Yu, M. W. Alnouri, S. Ramas, Y. Zhang, Y. Jäger, K. A. Roquid, H. W. Jeong, K. K. Sivaraj, H. Cho, X. Chen, B. Strilic, T. Sijmonsma, R. Adams, T. Schroeder, M. A. Rieger, S. Offermanns. GPR182 is an endothelium-specific atypical chemokine receptor that maintains hematopoietic stem cell homeostasis. Proceedings of the National Academy of Sciences of the United States of America. Vol. 118, pg. e2021596118, 2021, https://doi.org/10.1073/pnas.2021596118. [↩]
- Y. J. Kim, T. Sano, T. Nabetani, Y. Asano, Y. Hirabayashi. GPRC5B activates obesity-associated inflammatory signaling in adipocytes. Science Signaling. Vol. 5, pg. ra85, 2012, https://doi.org/10.1126/scisignal.2003149. [↩] [↩] [↩]