Abstract
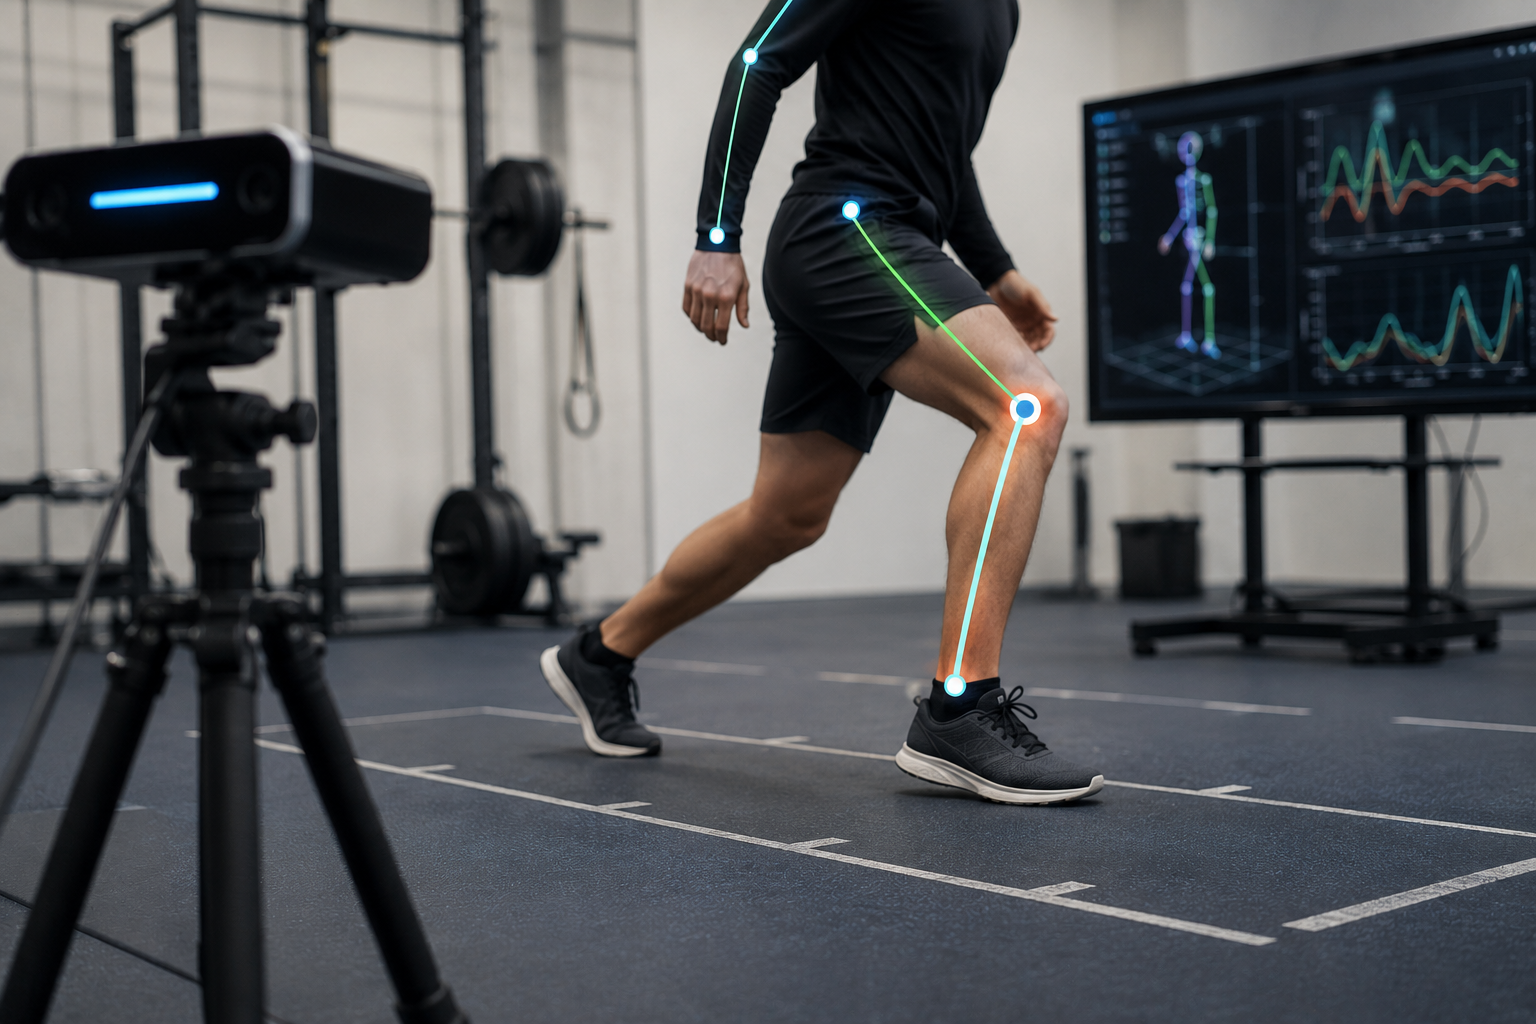
Background/Objective: There are about 200,000 ACL injuries sustained per annum by athletes in the U.S., and the conventional techniques for screening these costs in excess of $100,000 and require specialized lab space. This paper develops a proof-of-concept technique using YOLO pose estimation and a normal web camera to assess risk of ACL injury while drop vertical jumping.
Methods: This system calculates five measures of injury risk (knee valgus motion, knee flexion change, bilateral symmetry, trunk inclination, and stability time) based on the application of trigonometric calculations to skeletal points identified through video. A four-phase state machine segments each jump and isolates the 200-millisecond window after ground contact when most ACL injuries occur. The classification accuracy of 150 drop vertical jump trials was investigated using a single subject repeated measures design in the safe and deliberate valgus collapse conditions. The ground truth classification was determined by visually inspecting the data; inter-rater reliability testing for a random sample of 30 trials resulted in 96.7% agreement ( = 0.93).
Results: Out of 142 retained trials, the total accuracy of classification was 87.3% (CI: 80.8%-92.1%) with sensitivity of 90.1% for the detection of risky mechanics. The peak knee valgus angle was different by 9.2° between two conditions (d = 3.26). This value is comparable in terms of absolute value to the difference reported by Hewett et al. of 8.4° in their prospective study on injured athletes. Processing speed was 34.2 FPS with 29.3 ms latency.
Conclusions: Biomechanical screening using webcams for ACL injury prevention is possible from a technical standpoint when motion analysis in a lab setting is not available. This research paper proves feasibility only. Full measurement validity would require future validation on multiple subjects compared to the gold standard of motion capture.
Keywords: ACL injury prevention, dynamic knee valgus, markerless motion capture, pose estimation, biomechanical analysis, real-time screening, YOLO, computer vision
Introduction
Research Motivation
Approximately 1 in 3,500 athletes tears their anterior cruciate ligament (ACL) per competitive season, and female athletes sustain the injury at 2 to 8 times the rate of males1,2. Most ACL tears are non-contact injuries that happen during decelerating, cutting, pivoting, or landing in sports like basketball, soccer, and volleyball3, and the consequences extend well beyond the initial event: rehabilitation takes 9 to 12 months, re-injury rates remain high, and 50 to 70% of these athletes go on to develop knee osteoarthritis within two decades4. The annual cost in the United States exceeds $2 billion.
Video analysis of actual ACL tears has established that the injury typically occurs within 17 to 50 ms of ground contact, during which the knee collapses inward while the leg is near full extension, a pattern called valgus collapse5,6. If athletes who demonstrate this pattern during training could be identified before injury, prevention programs could be directed at them specifically. The problem is that identifying valgus collapse currently requires three-dimensional motion capture systems that cost over $100,000 and depend on a dedicated laboratory, body-mounted reflective markers, synchronized camera arrays, and trained operators7.
Approximately 62% of ACL tears occur during practice, not games, in settings where no screening technology is in use2. This study was designed to address that gap by building a proof-of-concept biomechanical screening system that runs on a consumer webcam and a laptop.
Research Objectives
This study had three goals, each building on the last. The first task was to develop this system itself, which consists of a real-time pipeline that applies YOLO pose estimation to evaluate the biomechanics based on a regular webcam video feed and performs the trigonometry to calculate the dynamic knee valgus and four additional risk factors, all of which are structured in a state machine and separate the jump into stages, including the landing stage. With the existence of the system, the second objective involved using actual evidence for its risk cut-offs based on data collected from prospectively measured athlete’s movements prior to being injured, not just making assumptions about the cut-off point. The third and last goal was to see if this whole process would work, to be more precise, testing the proof of concept classification of the system with ground-truthing labels.
Background
Dynamic Knee Valgus as Injury Predictor
Much of the evidence linking landing mechanics to ACL injury comes from a 2005 prospective study by Hewett et al1 The study recruited 205 female athletes in basketball, soccer, and volleyball, recorded three-dimensional motion capture data during standardized drop vertical jumps before the competitive seasons began, and then followed the cohort for 1.5 seasons. Nine athletes tore their ACLs during follow-up. Comparing their pre-injury landing data to uninjured athletes revealed that the injured group landed with approximately 8.4 degrees more knee valgus at initial ground contact and experienced 2.5 times greater knee abduction moment1. Both differences reached statistical significance.
Subsequent cadaveric work confirmed the mechanism: applying physiologic valgus torques to knee specimens increased anterior tibial translation and ACL loading several-fold1,8. Valgus loading variables of the frontal plane were major indicators of the risk of injury; conversely, sagittal plane variables were unable to predict injury risk1. Female athletes, on average, demonstrate more valgus during landing and more bilateral asymmetry than males, and both patterns have been associated with higher injury rates2,9. A systematic review of documented in-sport ACL injuries further links stiff landings, reduced core stability, and dynamic knee valgus to injury occurrence10.
The discriminative ability of a video-based tool for landing assessment was shown by Petushek et al. (2021) to be moderate, indicating that laboratory-independent screening methods are suitable11. According to Myer et al. (2010), targeted neuromuscular interventions can help reduce biomechanical risk factors that are being measured by these tools, with varied effects based on initial risk levels12.
Markerless Motion Capture Technology
Pose estimation algorithms based on deep learning use convolutional neural networks trained on large annotated image datasets to locate body joints in video without physical markers13. Nakano et al. (2020) benchmarked markerless accuracy against a marker-based reference and reported that 47% of joint position estimates fell within 20 mm of the reference values, with 80% within 30 mm13. Markerless capture systematic reviews state that concurrent validation is still required before its implementation to the clinical settings14.
For knee valgus screening specifically, Numata et al. (2018) prospectively analyzed dynamic knee valgus from two-dimensional frontal-plane video during single-leg drop jumps in 291 female high school athletes and found that greater dynamic valgus distinguished athletes who went on to sustain non-contact ACL injury over a three-year follow-up, supporting frontal-plane 2D analysis as a screening approach15. Other two-dimensional video analyses during single-leg drop jumps have likewise identified athletes at prospective risk of non-contact knee injury9.
Machine Learning in Sports Injury Prediction
In systematic reviews of machine learning techniques used for predicting sports injuries, there has been an observation regarding the lack of standardized open-source databases and prospective validations, which prevent definite inferences about its effectiveness16,17. This context motivates the use of explainable trigonometric methods in the present system, where angle outputs in degrees are directly comparable to published clinical thresholds.
Methods
Participant
A single healthy male participant (age 17 years, 175 cm, 68 kg, 5 years of basketball experience, no prior injury history) performed all trials. Parental consent was obtained prior to testing. Given that this was a proof-of-concept study involving one subject, it was impossible to obtain any formal ethics approval from the institution; all experiments were performed following principles of voluntary consent and participant well-being. The sample size of n=1 is acknowledged as one of the main drawbacks of the current research.
System Architecture
Video from a USB webcam (30 to 60 FPS, depending on hardware) is fed through a six-layer pipeline (Figure 1). YOLO11n is a compact version of the YOLO model, which was chosen due to the fact that it performs an inference for each frame with just one forward pass through the convolutional neural network. In each frame, YOLO11n detects 17 key anatomical landmarks (i.e., nose, eyes, ears, shoulders, elbows, wrists, hips, knees, and ankles), along with their x-y coordinates and confidence value. The output from each pipeline step is independent of others; therefore, changing YOLO11n to any other recent pose estimator algorithm will not affect the downstream code.

State Machine Implementation
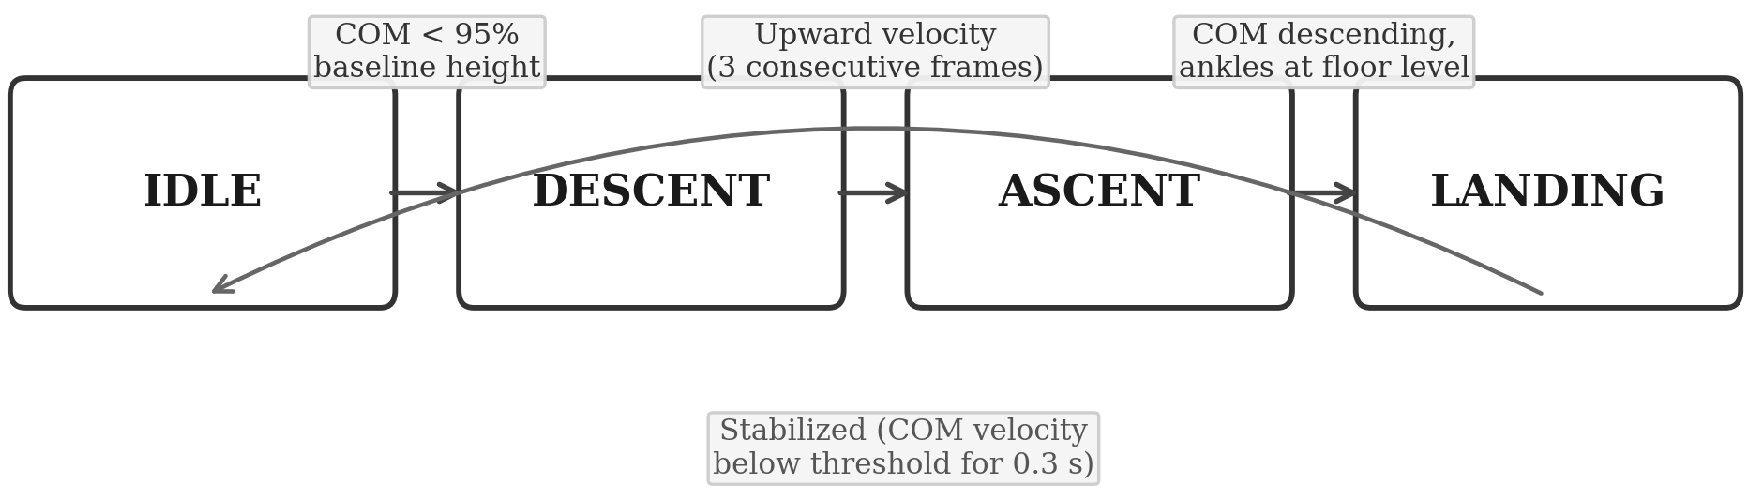
A four-phase state machine segments each jump into discrete phases (Figure 2). Transitions are triggered by the vertical position of the center of mass, estimated as the midpoint between the two hip keypoints.
IDLE State: A baseline standing height is calculated by averaging center-of-mass position over a 0.5-second calibration window. When center-of-mass height drops below 95% of baseline, the state machine transitions to DESCENT.
DESCENT State: Vertical velocity is monitored as the athlete loads their legs in the countermovement. Once upward movement is detected for three consecutive frames, the state transitions to ASCENT.
ASCENT State: The upward flight from push-off through the apex is tracked, and the maximum jump height is recorded. When the center of mass reverses direction and the ankle keypoints approach the floor baseline, the state transitions to LANDING.
LANDING State: ACL injuries occur in the first 17 to 50 ms after ground contact5, so the state machine opens a 200-ms analysis window upon entering this phase. All the five biomechanical measures are calculated at each frame during the time interval. After the stabilization of the athlete, when the velocity of the center of mass is less than the threshold velocity for 0.3 seconds, the state machine returns to the IDLE state. It should be noted that the 200-ms interval is the capture interval that relates to the landing event.
Biomechanical Metrics
Five indicators were selected due to their previously established connection to ACL injuries in prospective studies. Warning and danger criteria for all five indicators were derived from studies that monitored athletes’ movements prior to ACL injury. (Table 1).
| Metric | Method | Warning | Danger |
| Dynamic Knee Valgus | Frontal hip-knee-ankle angle | 9-13 deg | >13 deg |
| Knee Flexion Gain | Sagittal flexion change | <15 deg | <10 deg |
| Bilateral Asymmetry | Bilateral valgus difference | >10 deg | >15 deg |
| Trunk Lean | Lateral deviation from vertical | >10 deg | >15 deg |
| Stabilization Time | Duration to static balance | >0.4 s | >0.5 s |
Dynamic Knee Valgus is the angle formed by the hip, knee, and ankle in the frontal plane. Thresholds of 9 to 13 degrees (warning) and above 13 degrees (danger) were derived from Hewett et al1
Knee Flexion Gain refers to the disparity between the knee flexion at impact and the peak knee flexion during the landing process. Knee flexion gains less than 10 degrees suggest stiff landing technique and high ACL injury risk18.
Bilateral Asymmetry captures the valgus-angle difference between the two knees, where large discrepancy suggests poorer neuromuscular control on one side1,2.
Trunk Lean records lateral tilt of the torso during landing, which shifts the ground reaction force vector relative to the knee joint center and contributes to valgus loading19.
Stabilization Time is how long it takes the athlete to reach quiet standing after landing, with longer times indicating poorer dynamic balance2.
Classification Decision Rule
A trial was deemed to be unsafe in case any one parameter crossed the threshold for danger during the 200 ms period from landing onset: Dynamic Knee Valgus > 13°; Knee Flexion Gain < 10°; Bilateral Asymmetry > 15°; Trunk Lean > 15°, or Stabilization Time > 0.5 sec. If none of the danger thresholds were crossed, then the trial was deemed to be safe. The reason for using the any-threshold criteria is the clinical belief that if any one dangerous factor is crossed, then the risk of injury is increased.
Trigonometric Calculations
Joint angles are calculated using the law of cosines for vectors between neighboring keypoints. The angle  for frontal plane knee valgus is determined using the hip (H), knee (K), and ankle (A) coordinates:
Only the coordinates of x and y axes are employed, thus forming a two-dimensional front-plane view. Prior to computing the angles, the exponential moving average (smoothing factor 0.3) is employed for smoothing the coordinates of keypoints to address frame-to-frame noise, where the value was selected to provide the right tradeoff between sensitivity to fast changes during the landing and excessive smoothing, resulting in an effective time constant of 80 ms. Those keypoints whose confidence is below 0.5, which is the decision threshold of the algorithm itself, are not considered during this particular frame. Two-dimensional approaches have proven their validity in prospective detection of athletes with risk of knee injury9,15.
Experimental Protocol
A single-subject repeated-measures design was used. The drop vertical jump (DVJ) protocol followed Hewett’s standardized methodology1: standing up on a platform that is 31 cm high, with feet placed 35 cm apart, dropping straight down and immediately jumping to achieve maximum jump height. Video was taken using the MacBooks built-in 1080p FaceTime HD Camera (30 FPS), which was placed 2.5 meters away from the subject at a height of 0.6 meters, orthogonal to the frontal plane. All video processing was done on the MacBook using an Apple M4 Chip with 16 GB Unified Memory.
There were 150 trials carried out in three sessions of 50 each, with 75 trials in each condition in sets of 5. There were 15-second rest periods between each jump, and five-minute breaks every 25 trials. Condition A is where the participant jumped in safe conditions for 75 trials, landing in a position where the knees were over the toes with soft flexion and equal load bearing. Condition B is where the participant jumps in unsafe conditions for 75 trials.
Ground Truth Labeling and Inter-Rater Reliability
Ground truth class labels were determined via visual inspection of video recordings of the trials by the investigator at 0.25x speed frame-by-frame, using the classification criterion as discussed earlier. The investigator had knowledge of the intended landing condition for each trial; therefore, there is the possibility that this can introduce bias into the labels.
Reliability testing of the ground truth labeling method was performed by having a second rater (a professor from the same university who had no previous experience with biomechanics) rate a random subset of 30 trials using the same binary classification, being unaware of the labels assigned by the researcher, the targeted landing type, and the system output.
Consistency between the investigator and the blinded rater was 96.7% (29 out of 30 trials). Cohen’s kappa statistic was = 0.93, and is considered “almost perfect” according to Landis and Koch (1977) convention20. Only one instance of inconsistency happened between the investigator who marked a trial as “safe,” and the blinded rater who deemed it “unsafe.” These statistics confirm the consistency of the visual labeling protocol despite the fact that the ground truth is subjective.
Statistical Analysis
In view of the repeated-measures nature of the study, inferential statistical methods were used in a descriptive manner and could not be applied beyond this participant. The paired t-tests method was employed to compare mean values of the metric variables in the two groups. Effect sizes were determined using Cohen’s d. Confidence intervals for proportions were computed using the Wilson Score CI.
Results
Trial Completion and Data Quality
Of the 150 trials, 142 (94.7%) were kept for analysis. Eight of the trials were not analyzed because of failure of pose estimation due to motion blur at touchdown or limb occlusion. There were equal numbers of excluded trials in each condition (4 safe and 4 unsafe) and in each session.
Classification Performance
Of 142 trials that were evaluated, 124 were correctly classified with an accuracy of 87.3% (95% confidence interval: 80.8% to 92.1%). The sensitivity of detecting unsafe landings was 90.1% (64 out of 71 were correctly detected; 95% CI: 80.7% to 95.9%), while the specificity of detecting safe landings was 84.5% (60 out of 71; 95% CI: 74.0% to 92.0%). The positive predictive value (PPV) was 85.3% (95% CI: 75.3% to 92.4%), and the negative predictive value (NPV) was 89.6% (95% CI: 79.7% to 95.7%). Full performance metrics are shown in Table 2 and the confusion matrix in Table 3.
| Metric | Value | 95% CI |
| Overall Accuracy | 87.3% | 80.8-92.1% |
| Sensitivity | 90.1% | 80.7-95.9% |
| Specificity | 84.5% | 74.0-92.0% |
| Positive Predictive Value (PPV) | 85.3% | 75.3-92.4% |
| Negative Predictive Value (NPV) | 89.6% | 79.7-95.7% |
| Pred. Unsafe | Pred. Safe | |
| Actual Unsafe (n=71) | 64 (TP) | 7 (FN) |
| Actual Safe (n=71) | 11 (FP) | 60 (TN) |
Biomechanical Measurements
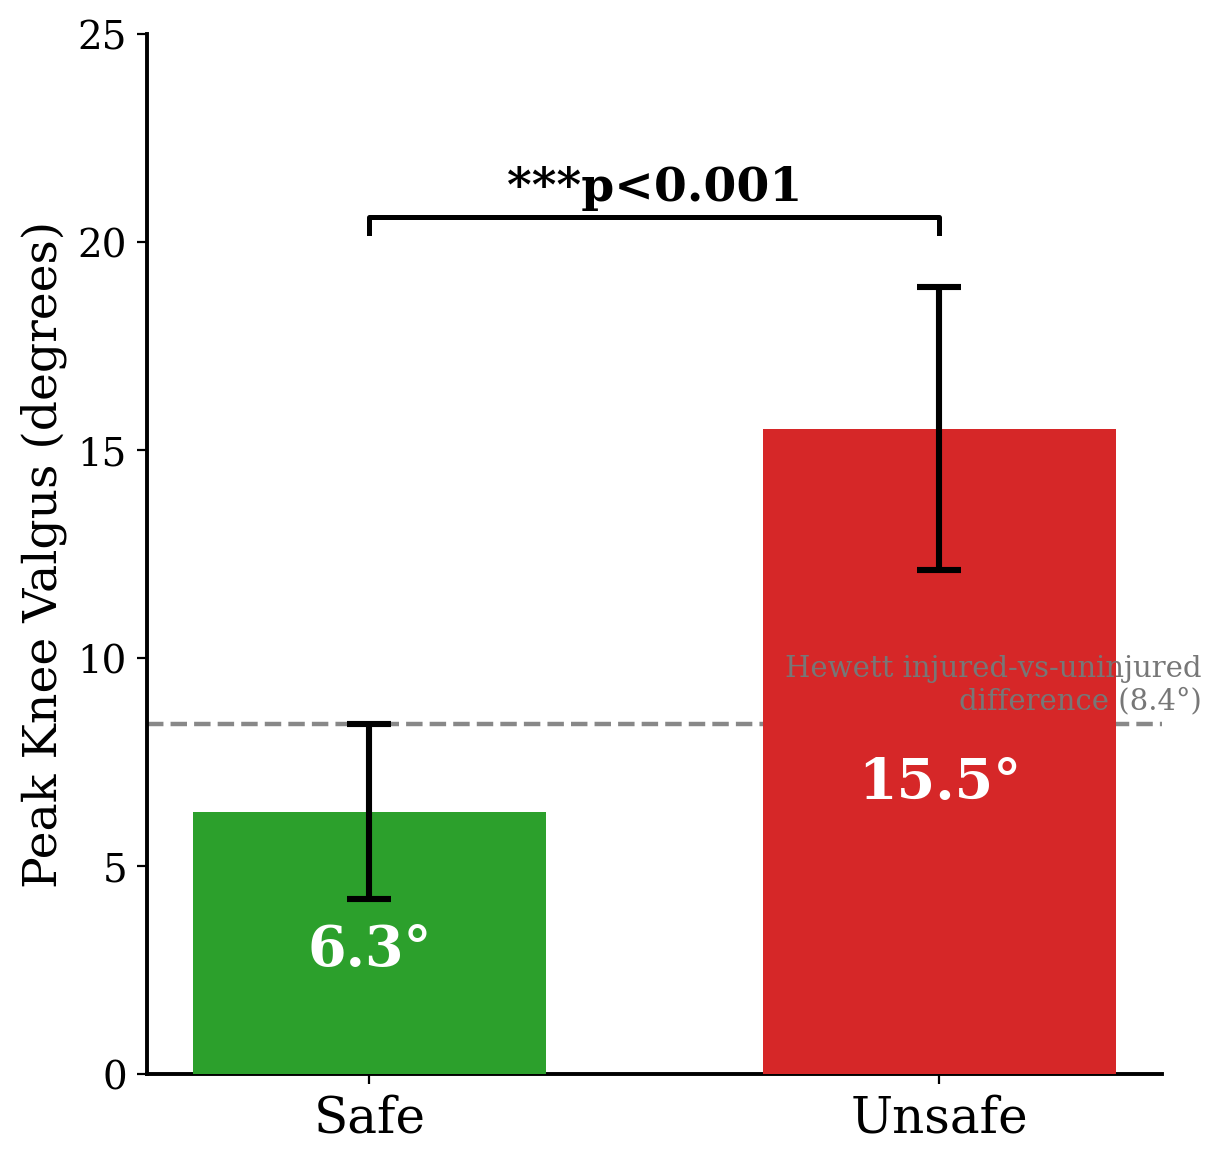
The mean peak knee valgus angle for the safe condition was 6.3° (SD = 2.1; range = 3.1 to 10.8°) and that for the unsafe condition was 15.5° (SD = 3.4; range = 10.2 to 22.7°) with a mean difference of 9.2° (t = 19.4, p < 0.001, Cohen’s d = 3.26). The distribution is shown in Figure 3. The prospective study by Hewett et al. reported an 8.4-degree valgus difference between athletes who later sustained ACL injuries and those who did not, measured using three-dimensional laboratory motion capture in a female athletic cohort1. However, the current process has registered a variation of 9.2 degrees using a webcam with 2D projection. The results are in line with the values recorded by the other studies but cannot be compared due to different parameters of measurement.
Table 4 depicts all five measures according to the condition. The knee flexion gain was significantly reduced in unsafe landings (24.6 vs. 38.2 degrees, p < 0.001, Cohen’s d = 1.77) as expected due to stiff landing related to ACL tears18. Bilateral asymmetry was elevated (7.8 vs. 3.4 degrees, p < 0.01, Cohen’s d = 1.69). Stabilization time was longer in the unsafe condition (0.48 vs. 0.31 seconds, p < 0.001, Cohen’s d = 1.64), and trunk lean was greater (8.9 vs. 4.2 degrees, p < 0.01, Cohen’s d = 1.58).
| Metric | Safe | Unsafe | p | Cohen’s d |
| Peak Knee Valgus (deg) | 6.3 ± 2.1 | 15.5 ± 3.4 | <0.001 | 3.26 |
| Knee Flexion Gain (deg) | 38.2 ± 6.8 | 24.6 ± 8.3 | <0.001 | 1.77 |
| Bilateral Asymmetry (deg) | 3.4 ± 1.9 | 7.8 ± 3.2 | <0.01 | 1.69 |
| Trunk Lean (deg) | 4.2 ± 2.3 | 8.9 ± 3.1 | <0.01 | 1.58 |
| Stabilization Time (s) | 0.31 ± 0.08 | 0.48 ± 0.12 | <0.001 | 1.64 |
System Performance
Average Frame Rate = 34.2 FPS. It is important to mention here that the webcam takes the inputs at 30 FPS; therefore, the system processing rate of 34.2 FPS indicates the speed at which the pipeline analyses the frames, and since the speed is higher than the speed at which frames come, there is no backlog in processing the frames and no delay. Average Latency = 29.3 ms, Pose Detection Success = 95.0%, State Machine Detection Success = 150 times.
Discussion
Interpretation of Results
With an overall accuracy of 87.3%, the system incorrectly identified one out of eight cases. While most of the mistakes are from false positives rather than false negatives, which is the ideal way for a screening tool to make mistakes because a false positive athlete will be unnecessarily assessed and a false negative athlete will miss being assessed.
The biomechanical measurements are more informative than the binary classification for assessing system capability. The present system measured a 9.2-degree valgus difference between conditions using a webcam and 2D projection. Hewett et al. identified an 8.4-degree difference between prospectively injured and uninjured female athletes using three-dimensional laboratory motion capture1. These values are similar in magnitude, suggesting the measurement approach has adequate resolution for detecting differences of clinically relevant size. However, the populations, measurement methods, and contexts differ substantially and a direct comparison cannot be drawn.
Inter-Rater Reliability and Ground Truth
The blinded inter-rater reliability study ( = 0.93) confirms the consistency of the visual labeling system. Nevertheless, both the raters used the same subjective visual criteria; neither was calibrated using any objective biomechanical criterion. The investigator who performed the trials also established the ground truth labels with knowledge of the intended landing condition. While the inter-rater test shows that a naïve blinded rater achieved virtually identical classification results, it is still possible that both raters may have been responding to the same visual cues from the manipulation. It will take a validation test against lab-quality motion capture to overcome this drawback.
Clinical and Practical Implications
Three-dimensional motion capture remains the gold standard for kinematic analysis, but cost and facility requirements limit screening to a narrow slice of the athletic population7,21. Webcam-based technology will redefine accessibility in terms of youth and recreational sports. Screening becomes important since ACL injuries can be prevented through specific training interventions that reduce the risk of severe knee injuries in high-risk female athletes by 62%2,22, and evidence suggests targeted intervention is most effective in athletes who demonstrate poor dynamic knee stability at baseline11,12. Meta-analytic evidence likewise supports the effectiveness of neuromuscular training programs in reducing ACL injury incidence among female athletes23.
Technical Design Considerations
Angle calculation using trigonometry was favored over machine learning classification since the results are easily interpretable by coaches and practitioners since an angle can be easily compared with Hewett et al.’s reference angles or any other published standards. It has been observed from systematic reviews of injury prediction using machine learning that there is no standardized dataset or prospective validation16,17, which made a purely data-driven approach difficult to justify for a proof-of-concept study.
Due to the dependence of the system on a sole frontal-camera, the influence of the misalignment of the camera on the accuracy of the calculated hip-knee-ankle valgus angle was evaluated using geometrical estimation. Considering the rotation of the camera as a scaling of the mediolateral coordinate by the cosine function, the rotation of the camera of ±5 degrees with respect to the frontal plane results in less than 0.05 degrees of error in the calculation of the valgus angle, while the rotation of ±10 degrees results in less than 0.15 degrees of error. These values are much smaller than the 9-degree alarm limit, thus showing the robustness of the measurement with respect to small setup errors.
Limitations and Future Directions
Limitations of the study include the following. First, the fact that all trials were performed by one subject makes it impossible to predict how subjects with other body dimensions, skill levels, or sport backgrounds would perform. Second, the intentional control of the hazardous condition by the subject poses a confounding factor not seen in a true population of screeners. Third, the method of capturing data in two dimensions limits the ability to track out-of-plane movement of the knee joint. Fourth, the drop vertical jump test in its own right has demonstrated little in the way of predictive value for ACL injuries within elite athlete populations24, and thus the current study may be better viewed as a controlled biomechanical comparison.
Further research should focus on concurrent validation with lab-based motion capture systems, evaluation on multiple participants from various athletic backgrounds, and feasibility studies in a field setting. Other inexpensive sensing technologies such as the use of inertial measurement units25, may also extend screening beyond the single-camera frontal plane.
Conclusion
This ACL injury risk assessment prototype was developed through YOLO pose detection using joint angle calculation via trigonometry. Classification accuracy from 142 trials of the protocol conducted by one participant is 87.3%, while the sensitivity is 90.1%. The 9.2-degree valgus angle discrepancy is similar in size to the 8.4-degree discrepancy noted in studies on ACL injuries, although there is little to no direct comparison due to differences in methodologies. At 34.2 FPS with 29.3 ms latency, this proves that it is feasible to use in real time on commercial machines. The blinded inter-rater reliability of the procedure to generate the ground truth labeling was high ( = 0.93). This current study demonstrates feasibility, while validity needs to be tested on other participants.
Acknowledgments
The author thanks the faculty mentor at Cheongna Dalton School for guidance on the project and for serving as the blinded rater in the inter-rater reliability analysis.
References
- T. E. Hewett, G. D. Myer, K. R. Ford, R. S. Heidt Jr, A. J. Colosimo, S. G. McLean, A. J. van den Bogert, M. V. Paterno, P. Succop. Biomechanical measures of neuromuscular control and valgus loading predict ACL injury risk in female athletes. American Journal of Sports Medicine. Vol. 33, pg. 492-501, 2005. [↩] [↩] [↩] [↩] [↩] [↩] [↩] [↩] [↩] [↩]
- K. R. Ford, G. D. Myer, T. E. Hewett. Valgus knee motion during landing in high school female and male basketball players. Medicine & Science in Sports & Exercise. Vol. 35, pg. 1745-1750, 2003. [↩] [↩] [↩] [↩] [↩] [↩]
- O. E. Olsen, G. Myklebust, L. Engebretsen, R. Bahr. Injury mechanisms for anterior cruciate ligament injuries in team handball. American Journal of Sports Medicine. Vol. 32, pg. 1002-1012, 2004. [↩]
- L. S. Lohmander, P. M. Englund, L. L. Dahl, E. M. Roos. The long-term consequence of anterior cruciate ligament and meniscus injuries. American Journal of Sports Medicine. Vol. 35, pg. 1756-1769, 2007. [↩]
- T. Krosshaug, A. Nakamae, B. P. Boden, L. Engebretsen, G. Smith, J. R. Slauterbeck, T. E. Hewett, R. Bahr. Mechanisms of anterior cruciate ligament injury in basketball: video analysis of 39 cases. American Journal of Sports Medicine. Vol. 35, pg. 359-367, 2007. [↩] [↩]
- H. Koga, A. Nakamae, Y. Shima, J. Iwasa, G. Myklebust, L. Engebretsen, R. Bahr, T. Krosshaug. Mechanisms for noncontact anterior cruciate ligament injuries. American Journal of Sports Medicine. Vol. 38, pg. 2218-2225, 2010. [↩]
- L. Mundermann, S. Corazza, T. P. Andriacchi. The evolution of methods for the capture of human movement leading to markerless motion capture. Journal of NeuroEngineering and Rehabilitation. Vol. 3, pg. 1-11, 2006. [↩] [↩]
- Y. Fukuda, S. L. Woo, J. C. Loh, E. Tsuda, P. Tang, P. J. McMahon, R. E. Debski. A quantitative analysis of valgus torque on the anterior cruciate ligament: a human cadaveric study. Journal of Orthopaedic Research. Vol. 21, pg. 1107-1112, 2003. [↩]
- B. Dingenen, B. Malfait, S. Nijs, K. H. Peers, S. Vereecken, S. M. Verschueren, F. F. Staes. Can two-dimensional video analysis during single-leg drop vertical jumps help identify non-contact knee injury risk? A one-year prospective study. Clinical Biomechanics. Vol. 30, pg. 781-787, 2015. [↩] [↩] [↩]
- J. Larwa, C. Stoy, R. S. Chafetz, M. Boniello, C. Franklin. Stiff landings, core stability, and dynamic knee valgus: a systematic review on documented anterior cruciate ligament ruptures in male and female athletes. International Journal of Environmental Research and Public Health. Vol. 18, pg. 3826, 2021. [↩]
- E. Petushek, D. Sugimoto, M. Stoolmiller, G. Smith, G. D. Myer. Evidence-based best-practice guidelines for preventing anterior cruciate ligament injuries in young female athletes: a systematic review and meta-analysis. Journal of Orthopaedic & Sports Physical Therapy. Vol. 51, 2021, https://doi.org/10.2519/jospt.2021.10170. [↩] [↩]
- G. D. Myer, K. R. Ford, J. L. Brent, T. E. Hewett. Differential neuromuscular training effects on ACL injury risk factors in high-risk versus low-risk athletes. British Journal of Sports Medicine. 2010, doi:10.1136/bjsm.2010.072843. [↩] [↩]
- N. Nakano, T. Sakura, K. Ueda, L. Omura, A. Kimura, Y. Iino, S. Fukashiro, S. Yoshioka. Evaluation of 3D markerless motion capture accuracy using OpenPose with multiple video cameras. Frontiers in Sports and Active Living. Vol. 2, pg. 50, 2020. [↩] [↩]
- S. L. Colyer, M. Evans, D. P. Cosker, A. I. T. Salo. A review of the evolution of vision-based motion analysis and the integration of advanced computer vision methods towards developing a markerless system. Sports Medicine – Open. Vol. 4, pg. 24, 2018. [↩]
- H. Numata, J. Nakase, K. Kitaoka, Y. Shima, T. Oshima, Y. Takata, K. Shimozaki, H. Tsuchiya. Two-dimensional motion analysis of dynamic knee valgus identifies female high school athletes at risk of non-contact anterior cruciate ligament injury. Knee Surgery, Sports Traumatology, Arthroscopy. Vol. 26, pg. 442-447, 2018. [↩] [↩]
- A. Amendolara, D. Pfister, M. Settelmayer, M. Shah, V. Wu, S. Donnelly, B. Johnston, R. Peterson, D. Sant, J. Kriak, K. Bills. An overview of machine learning applications in sports injury prediction. Cureus. Vol. 15, pg. e46170, 2023. [↩] [↩]
- H. Van Eetvelde, L. D. Mendonca, C. Ley, R. Seil, T. Tischer. Machine learning methods in sport injury prediction and prevention: a systematic review. Journal of Experimental Orthopaedics. Vol. 8, pg. 27, 2021. [↩] [↩]
- M. Leppanen, K. Pasanen, U. M. Kujala, T. Vasankari, P. Kannus, S. Ayramo, T. Krosshaug, R. Bahr, J. Avela, J. Perttunen, J. Parkkari. Stiff landings are associated with increased anterior cruciate ligament injury risk in young female basketball and floorball players. American Journal of Sports Medicine. Vol. 45, pg. 386-393, 2017. [↩] [↩]
- B. T. Zazulak, T. E. Hewett, N. P. Reeves, B. Goldberg, J. Cholewicki. Deficits in neuromuscular control of the trunk predict knee injury risk. American Journal of Sports Medicine. Vol. 35, pg. 1123-1130, 2007. [↩]
- J. R. Landis, G. G. Koch. The measurement of observer agreement for categorical data. Biometrics. Vol. 33, pg. 159-174, 1977. [↩]
- J. L. Whittaker, N. Booysen, S. de la Motte, L. Dennett, C. L. Lewis, D. Wilson, C. McKay, M. Warner, D. Padua, C. A. Emery, M. Stokes. Predicting sport and occupational lower extremity injury risk through movement quality screening: a systematic review. British Journal of Sports Medicine. Vol. 51, pg. 580-585, 2017. [↩]
- T. E. Hewett, T. N. Lindenfeld, J. V. Riccobene, F. R. Noyes. The effect of neuromuscular training on the incidence of knee injury in female athletes. American Journal of Sports Medicine. Vol. 27, pg. 699-706, 1999. [↩]
- D. Sugimoto, G. D. Myer, J. M. McKeon, T. E. Hewett. Evaluation of the effectiveness of neuromuscular training to reduce anterior cruciate ligament injury in female athletes: a critical review of relative risk reduction and numbers-needed-to-treat analyses. British Journal of Sports Medicine. Vol. 46, pg. 979-988, 2012. [↩]
- T. Krosshaug, K. Steffen, E. Kristianslund, A. Nilstad, K. M. Mok, G. Myklebust, T. E. Andersen, I. Holme, L. Engebretsen, R. Bahr. The vertical drop jump is a poor screening test for ACL injuries in female elite soccer and handball players. American Journal of Sports Medicine. Vol. 44, pg. 874-883, 2016, https://doi.org/10.1177/0363546515625048. [↩]
- H. J. Luinge, P. H. Veltink. Measuring orientation of human body segments using miniature gyroscopes and accelerometers. Medical & Biological Engineering & Computing. Vol. 43, pg. 273-282, 2005. [↩]