
Abstract
This study investigates the sensitivity of popular vote outcomes to random vote flips, aiming to quantify the probability that an election result changes when a fixed number of votes are flipped at random. We hypothesized that there exists an exact combinatorial formula that can be used to calculate this probability. To test this, we conducted Monte Carlo simulations to empirically estimate this probability. We used combinatorial analysis to identify the desired closed-form expression for the probability P(n,k), or in other words, the probability that flipping k votes changes the winner in an election with n total voters. The resulting formula was followed by approximations that can be applied in large-n environments. These results describe the influence of a group of vote changes in election outcomes, expressing this relationship in the form of a probability. Notably, the approximation shows that this probability depends on only one quantity, namely the proportion of votes flipped.
Keywords: Combinatorics, Probability, Elections, Voting
Introduction
Elections are central to democratic decision-making, and understanding how changes in votes affect election outcomes is critical for evaluating the strength of voting systems1,2. Popular voting systems are widely used in both governmental and organizational contexts1,3. While much attention has been given to strategic voting and individual influence4,5, we quantify the impact on outcomes of multiple, randomly chosen vote flips. This impact is measured as the probability that flipping a given number of votes changes the overall winner. This probability directly reflects how stable or unstable a given election result is.
Early work on voting power includes the finding that under majority rule, the probability that a single vote is decisive is proportional to  where n is the number of voters, one of the first quantitative results linking electorate size to voting power6. Building on this, the probability was estimated directly for the 2008 U.S. presidential election, finding it to be at most 1 in 10 million in the most competitive states and 1 in 60 million on average nationally2. These results highlight how rare individual influence becomes at scale, but leave open the question of how larger groups of votes can affect outcomes. Taking a different angle, Monte Carlo simulation under the impartial culture assumption was used to estimate the probability that all weighted scoring rules pick the same winner. It found that this probability is 0.535 for three-candidate elections but drops sharply as the number of candidates increases7. Further analysis of election outcomes as the number of voters grows large, applying the central limit theorem, shows that certain outcome patterns become increasingly unlikely in large electorates, which motivates the large-n scenario that the approximation of P(n,k) operates within3. Exact election outcome probabilities in five-candidate elections have also been computed using polytope volume methods, demonstrating that exact combinatorial approaches remain feasible even in complex settings8. Additionally, a closed-form expression has been derived for each candidate’s winning probability as a function of current support rates and the rate at which information is revealed to voters9, providing precedent for the combinatorial and closed-form approach we take here.
More directly related to the work in this paper is the question of how election outcomes change when multiple votes are altered. It has been shown that for many standard voting rules, changing just one voter’s preference ranking can replace an entire elected committee, illustrating how sensitive outcomes can be to small changes10. Along similar lines, polynomial-time sampling algorithms have been derived to estimate the margin of victory, defined as the smallest number of vote changes needed to flip the winner, showing this quantity can be estimated without examining every ballot11. This is closely related to P(n,k), which quantifies the probability that k randomly chosen vote changes do flip the winner. Studies on the hierarchical voting systems where voters elect representatives in groups of three have found that information accuracy falls off predictably with each added level of hierarchy12, a striking similarity to our tournament voting extension. Equilibria in plurality voting has been characterized when voters are lazy or truth-biased, showing that strategic behavior shifts outcome probabilities in predictable ways relative to sincere voting13, further motivating a formal probabilistic treatment of vote changes. On the simulation side, Bayesian inference combined with Monte Carlo simulation has been applied to estimate seat distribution probabilities in proportional elections14, and agent-based simulation across 100 runs per configuration has been applied to forecast vote shares in the 2020 Taiwan and U.S. elections, achieving prediction errors below 1%. Both support the reliability of the simulation-based approach we use to estimate P(n,k) empirically15.
Consider n voters and 2 candidates, one of which is represented by the value 1 and the other of which is represented by the value -1. We define the ballots to be the set  , where integer xi is the value that represents the ith vote. We define a voting system V to be a function whose domain is all such sets Vb and range is {-1,1}. The output of the function under a given input is considered the winner Vw1.
We define a popular voting system  with n voters, where
  is an odd positive integer, such that the input is ballots
  and the winner
  is sgn
  .
.
Define  to be the probability that the result of a popular voting system with total voters changes when
  randomly chosen votes are flipped.
The objective of this study is to express in a closed-form formula, because such a formula would reveal patterns that are useful for close approximations as the total number of voters grows larger.
We used Monte Carlo simulations to empirically estimate , as detailed in Methods. Following this, we used combinatorial analysis to derive a far more exact expression for and proposed efficient approximations in large- environments.
As an extension, we analyze the tournament voting system to identify patterns and form a particular conjecture.
A tournament voting system  is defined with
  voters for a nonnegative integer (here, need not be odd; unlike the used for popular voting systems above, instead denotes the number of tournament rounds), such that the input is ballots
  . The winner
  of is
of is  if
if  and otherwise is the winner of the tournament voting system with ballots
  where
where  is the winner of the popular voting system with ballots
  12.
12.
Define  to be the probability that the result of a tournament voting system with total voters changes when randomly chosen votes are flipped.
Furthermore, using the same simulation procedure as the popular voting system, we conducted simulations for pairs  that ran 100,000 trials of the tournament voting system of voters and vote flips and recorded the proportion of trials in which the result changes as the empirical value of .
As a further extension, we disprove a corollary of prior work on coalition voting.
Methods
Monte Carlo Simulation Procedure:
A popular voting system trial was run for a given number of voters and number of flipped votes k. In each of these trials, each vote was randomly and independently assigned to one of the two candidates; a uniformly random subset of k votes were flipped, and the outcome was recorded. The proportion of trials in which the result changed was used as the empirical estimate of P(n,k)7.
To determine the number of trials for each combination, we consider each trial as a Bernoulli outcome because the election outcome either changes or it does not. Each empirical estimate  has a standard error of
 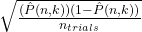 . We require our estimates to be accurate to within 0.005 of the true probability at 95% confidence. This precision was selected because it is small enough to meaningfully validate agreement with the exact formula derived in Results while remaining computationally efficient across the full range of pairs tested. At 95% confidence, recall that
  . In the worst-case scenario
  , it follows that the margin of error satisfies
Therefore, 100,000 trials were run for each  pair since
  , giving an actual margin of error of
For the popular voting system, this procedure was applied for each  and each
  . For the tournament voting system, the same procedure was applied with voters for each
  and each
  .
.
From these results, a pattern emerged that motivated extending the tournament voting simulation to =(5,15), (6,31), (7,63), (8,127).
Simulations were implemented in Python 3.11 using NumPy 1.26.2. All code was self-generated and is publicly available on GitHub for verification and reproducibility.
Results
Model Dependent
To begin the investigation, we recorded the empirical estimates of as described in the methodology. Across the tested values of , the empirical curves for displayed consistent structural patterns. For both  and
and  , the curves suggested that
  for odd . This result contradicts the intuitive expectation that increases strictly with (Figure 1a).
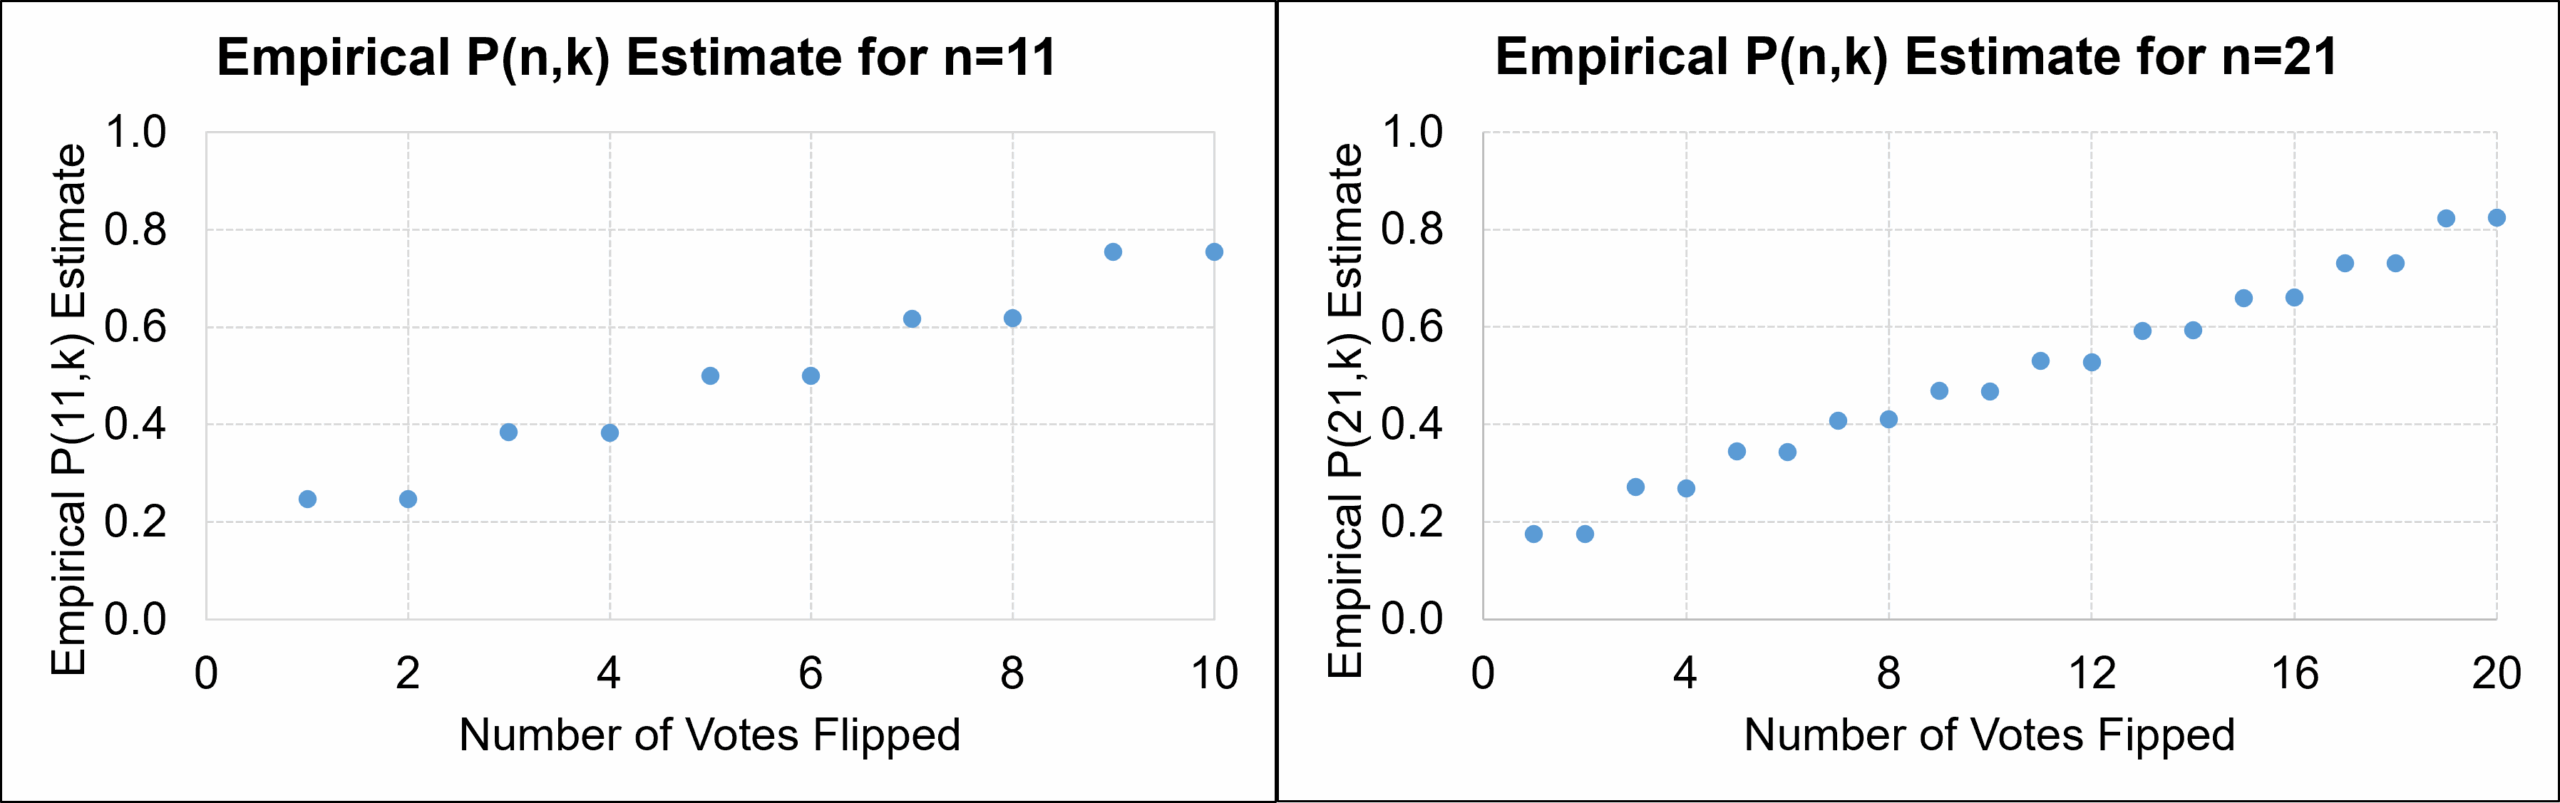
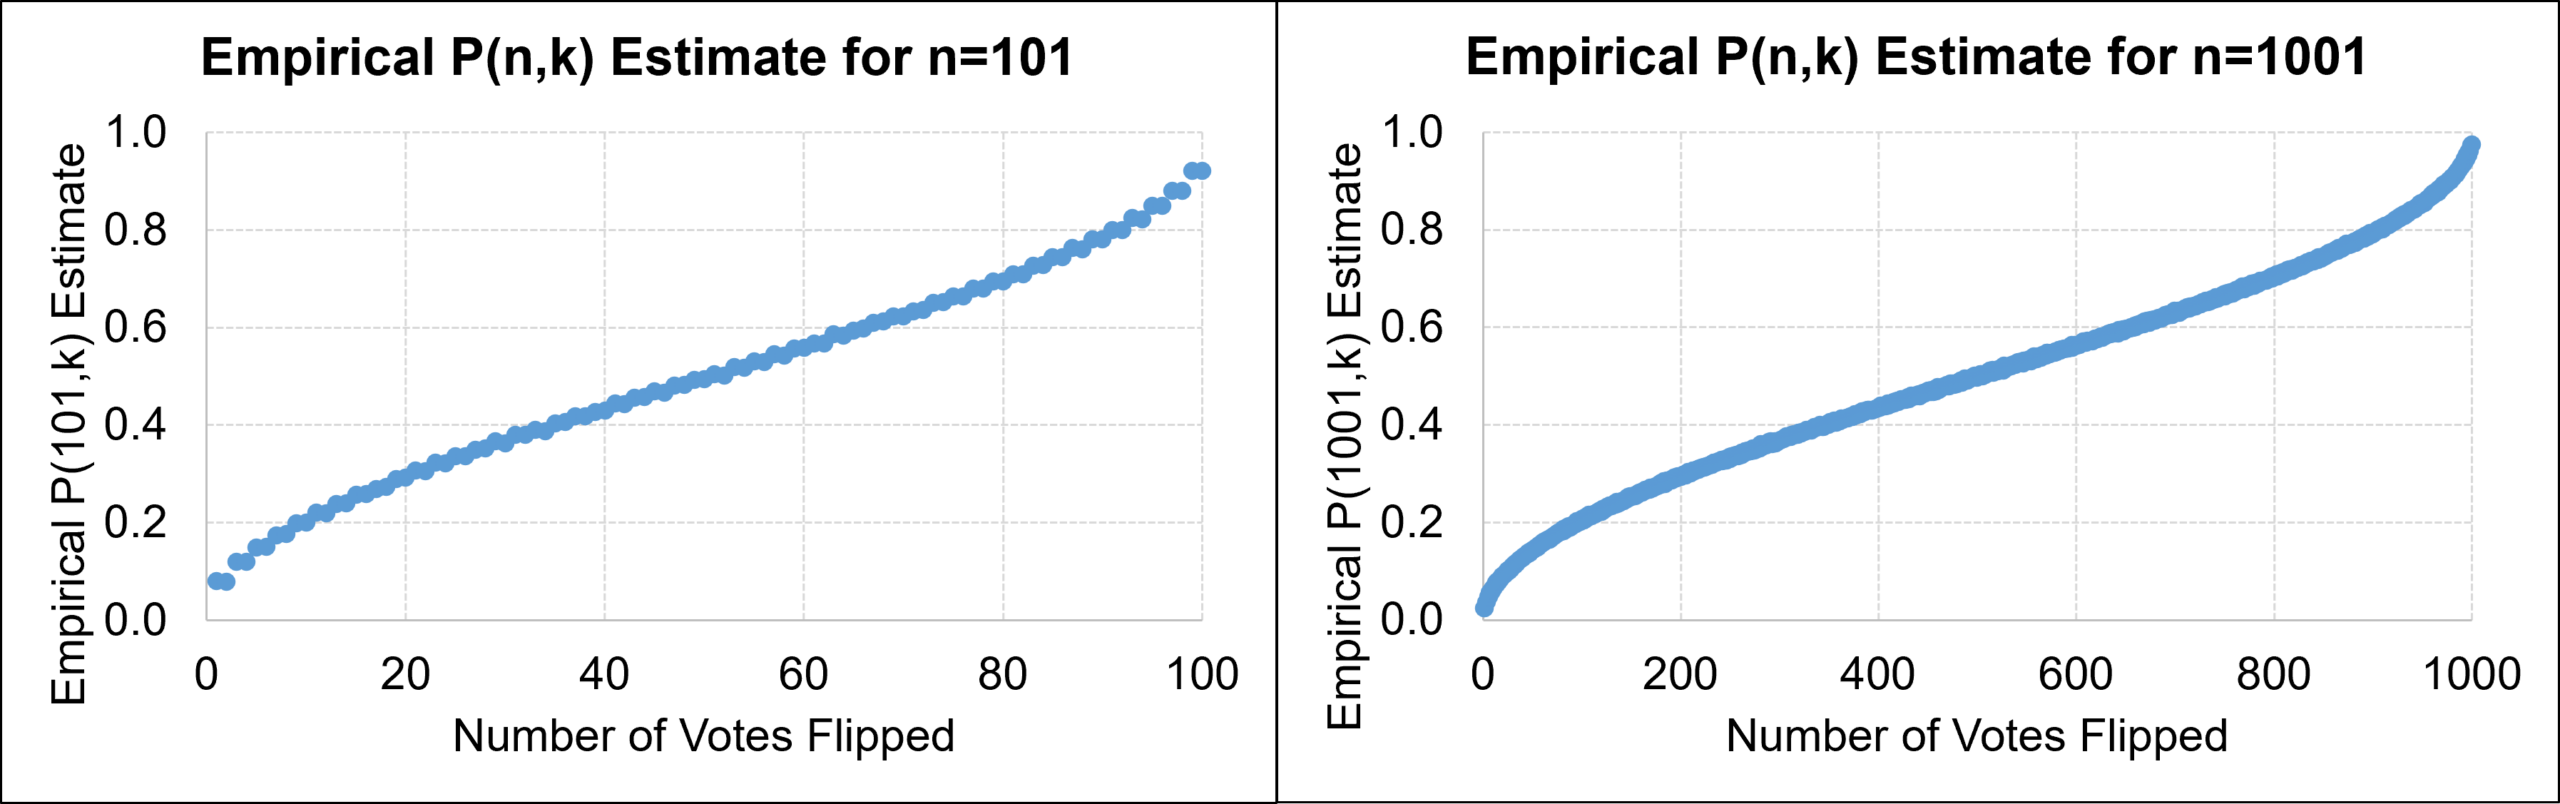
For  , the curve still showed this pairing, but the overall shape began to resemble a smooth trigonometric wave, suggesting that such a closed-form expression or approximation for may exist. At
  , the sensitivity curve followed a similar trigonometric pattern (Figure 1b).
Rigorous Proof Dependent
Having observed these empirical patterns, we derive mathematically. Since n must be odd in a popular voting system, we may let  for
for  . Consider a 2-candidate popular voting system with
  total voters in which votes are flipped. Here,
  is the integer for which
  is the number of votes needed for either candidate to secure a strict majority.
Let the candidates in this election be A and B.
We seek a closed-form expression for  . To derive this, we condition on the number of votes each candidate receives before and after the flip.
Assume without loss of generality that the original loser of this election is A. We will multiply the resulting probability by 2 to account for the symmetric case in which B is the original loser.
By the construction in Methods, each ballot is independently and uniformly assigned to A or B, and the set of flipped votes is chosen uniformly at random from the votes, independently of the ballots’ original values. Let  denote the number of the flipped votes that were originally cast for
  . Let
. Let  denote the number of non-flipped votes that were cast for . Since each of the ballots are independently or
  with probability
  , it follows that
  and
and  , where
  denotes a binomial distribution with trials and a probability of success
  . Hence,
Since I of the flipped votes were originally for A and  for B, after flipping, A’s vote total changes by net amount
  . Since A was the original loser, A needs this net gain to overtake B. In particular, for A to have any chance of winning, we require
wins post-flip if and only if ‘s final total exceeds out of the  votes. ‘s final total is
  , implying that we require
loses before votes are flipped if and only if ‘s original total does not exceed out of the votes. ‘s original total is  , implying that we require
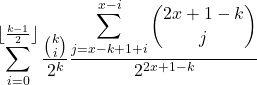
Hence, it follows that for a fixed value of , the probability that after votes are flipped the original loser wins the election is 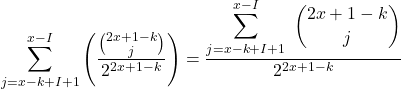 . Since ranges from 0 to
  , inclusive, as shown above, the overall probability that loses the original election and wins after votes are flipped is
  .
.
By symmetry, since both and are equally likely to be the original loser, and these events are disjoint, the probability  is twice the probability computed under the assumption that is the loser. Hence,
We now simplify this sum to obtain the desired closed-form expression.
Claim: For all integers 
Proof: We proceed to prove this with strong induction on k.
Base Case: When k=1, both formulas give  .
.
Inductive Hypothesis: Assume that the claim is true for all integers k≤m for some integer m≥1. Notice that m denotes the value of k at the current step of induction. We use m rather than k to distinguish the induction variable from the fixed parameter k in the statement being proven.
Inductive Step: We will consider the cases with m odd and m even separately.
Case 1: m is odd
We wish to show that 
Recall that Pascal’s Identity states that for integers  and
and  ,
,
Combinatorially, this reflects partitioning the  subsets of size
  into those that exclude a fixed element (counted by
  ) and those that include it (counted by
  ). In the context of this election, this partitioning is determined by whether or not the
  th non-flipped vote was for or .
We may now expand each binomial coefficient using Pascal’s Identity to achieve the following
We now apply Pascal’s Identity a second time, in the form  to condense the binomial coefficients and achieve the following
Case 2: m is even
We wish to show that
As described in the previous case, we may now expand each binomial coefficient using Pascal’s Identity to achieve the following
Once again, we may now condense the binomial coefficients using Pascal’s Identity to achieve the following
Hence,
Hence, we conclude  .
.
Having established this exact formula, we now derive a computationally efficient approximation that captures its essential behavior for large . To simplify the complexity of the expression within the summation above, we may find an approximation for  as follows.
Recall that the Central Binomial Coefficient  can be approximated as shown below16.
Hence,
By Stirling’s series, this approximation has relative error
Hence, the relative error is  as grows without bound16,17,18.
Let 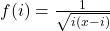
The following is a corollary of the Euler-Maclaurin Formula19
The error of this sum-to-integral approximation is bounded by the leading Euler-Maclaurin correction term 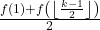 , which for is
  and therefore vanishes as approaches infinity19.
Notice that
Thus,
Hence, it follows that
For large values of , both  and
and 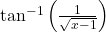 are extremely close to 0 .
Thus,
Therefore,
Consider the expression that is contained within the  function of this approximation. This expression may be rewritten as
 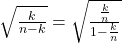 . Hence, the approximation of may be rewritten as
  . This modification suggests that can be approximated given just the ratio
  , or in other words, the proportion of votes in a popular voting system that are flipped. Furthermore, it follows that flipping the same proportion of votes in two popular voting systems, each with a sufficiently large, although not the same, number of votes, results in approximately equal values of .
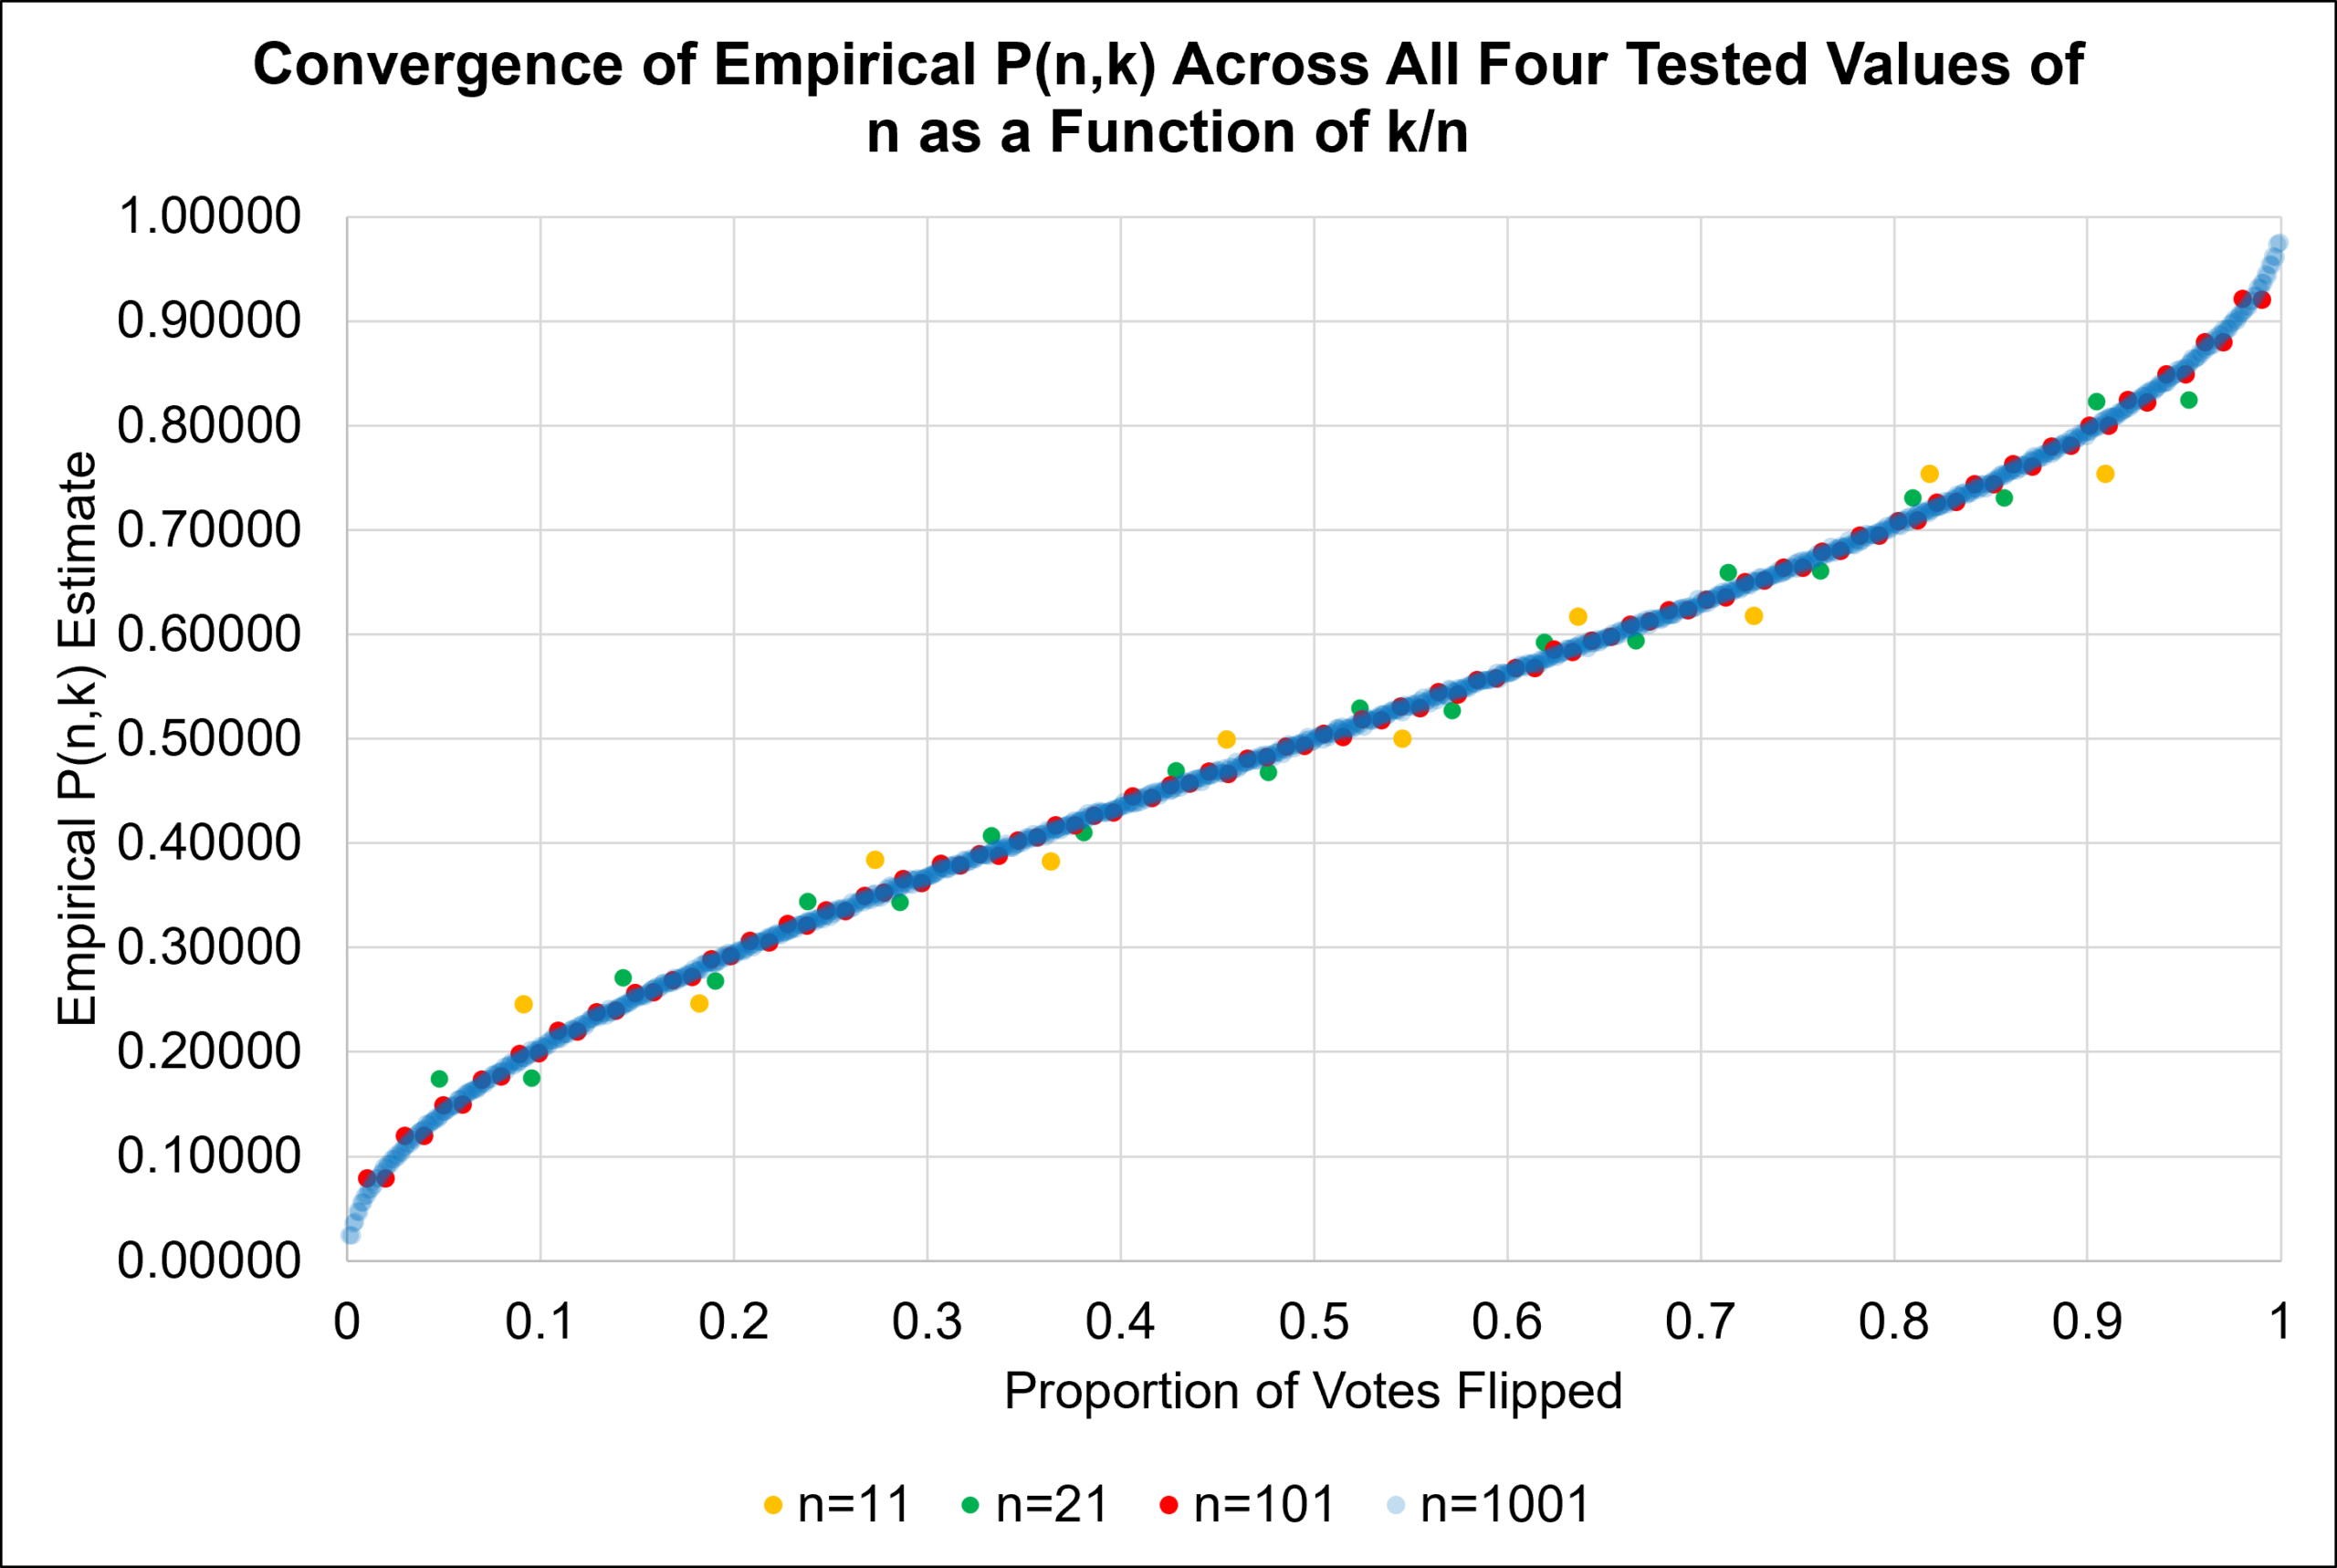
To test this interpretation systematically, we plot the empirical estimates of against for every tested pair. The resulting points increasingly collapse onto a single common curve as increases. The and datasets align closely across nearly the entire domain of while the and datasets, corresponding to much smaller elections, show visibly more scatter around this common curve. This is consistent with depending asymptotically only on the ratio , with the approximation to a single limiting curve improving as grows. This decreasing scatter is consistent with the theoretical error bounds derived above: the  error of the central binomial coefficient approximation and the
  Euler-Maclaurin correction term become insignificant as grows large (Figure 2).
We now turn to the tournament voting system extension. From the tournament voting system simulations, empirical values of for cases with  were
were  ,
,  ,
,  ,
,  ,
,  ,
,  . Hence, we conjecture that
  for all
  .
.
 can be found to be by going through all
  possibilities of 3 votes with one of the votes being flipped.
 is the product of two probabilities, namely the probability that a single vote flip changes the result of a tournament voting system with
  total votes and the probability that this result change affects the last round of the tournament voting process. It follows that
  for all
  and therefore
  for all
  .
.
Furthermore, prior work has considered the concept of coalitions of voters in popular voting systems. A coalition of m voters for an odd integer  is a subset of voters
  where each
  is 1 or
  , such that each of the
  votes is replaced with sgn(
 ) before executing the popular voting system1,20,6. Gelman et al. showed that for
  and any fixed , the value of is maximum with no coalitions1.
Finally, we disprove the conjecture that for any fixed  and fixed
  , the value of
  is maximum with no coalitions. Consider two popular voting systems, each with
  and
and  , such that one of them has no coalitions and the other has a single coalition of 5 voters. In the popular voting system with no coalitions, the probability simply comes out to
  . In the popular voting system with a coalition of 5 voters, the majority within the coalition becomes the overall result of the popular voting system. Hence, we need the probability that the majority within the coalition changes when 2 of the 9 votes are flipped. When neither of the votes are in the coalition, the probability for the result to flip is 0 . In the
  probability that exactly one of the two votes is in the coalition, there is a
  probability that the majority within the coalition flips. In the
  probability that both votes are in the coalition, there is a
  probability that the majority within the coalition flips. Hence, the desired overall probability is
and the conjecture is disproven.
Discussion
We quantified the probability that flipping votes in a random two-candidate election with voters changes the outcome. We now examine the implications of these results, assess limitations of the experimental design, and outline directions for further study. We found the exact formula to match the simulation results across all tested values of and . We also introduced an approximation to simplify evaluation in large- regimes.
The exact formula provides an immediate explanation of the empirically observed pairing  for odd . For different values of , the maximum value of
  in the summation of the exact formula varies. For odd integers , it follows that
 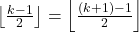 . Hence, the exact formula confirms the prior conjecture for odd .
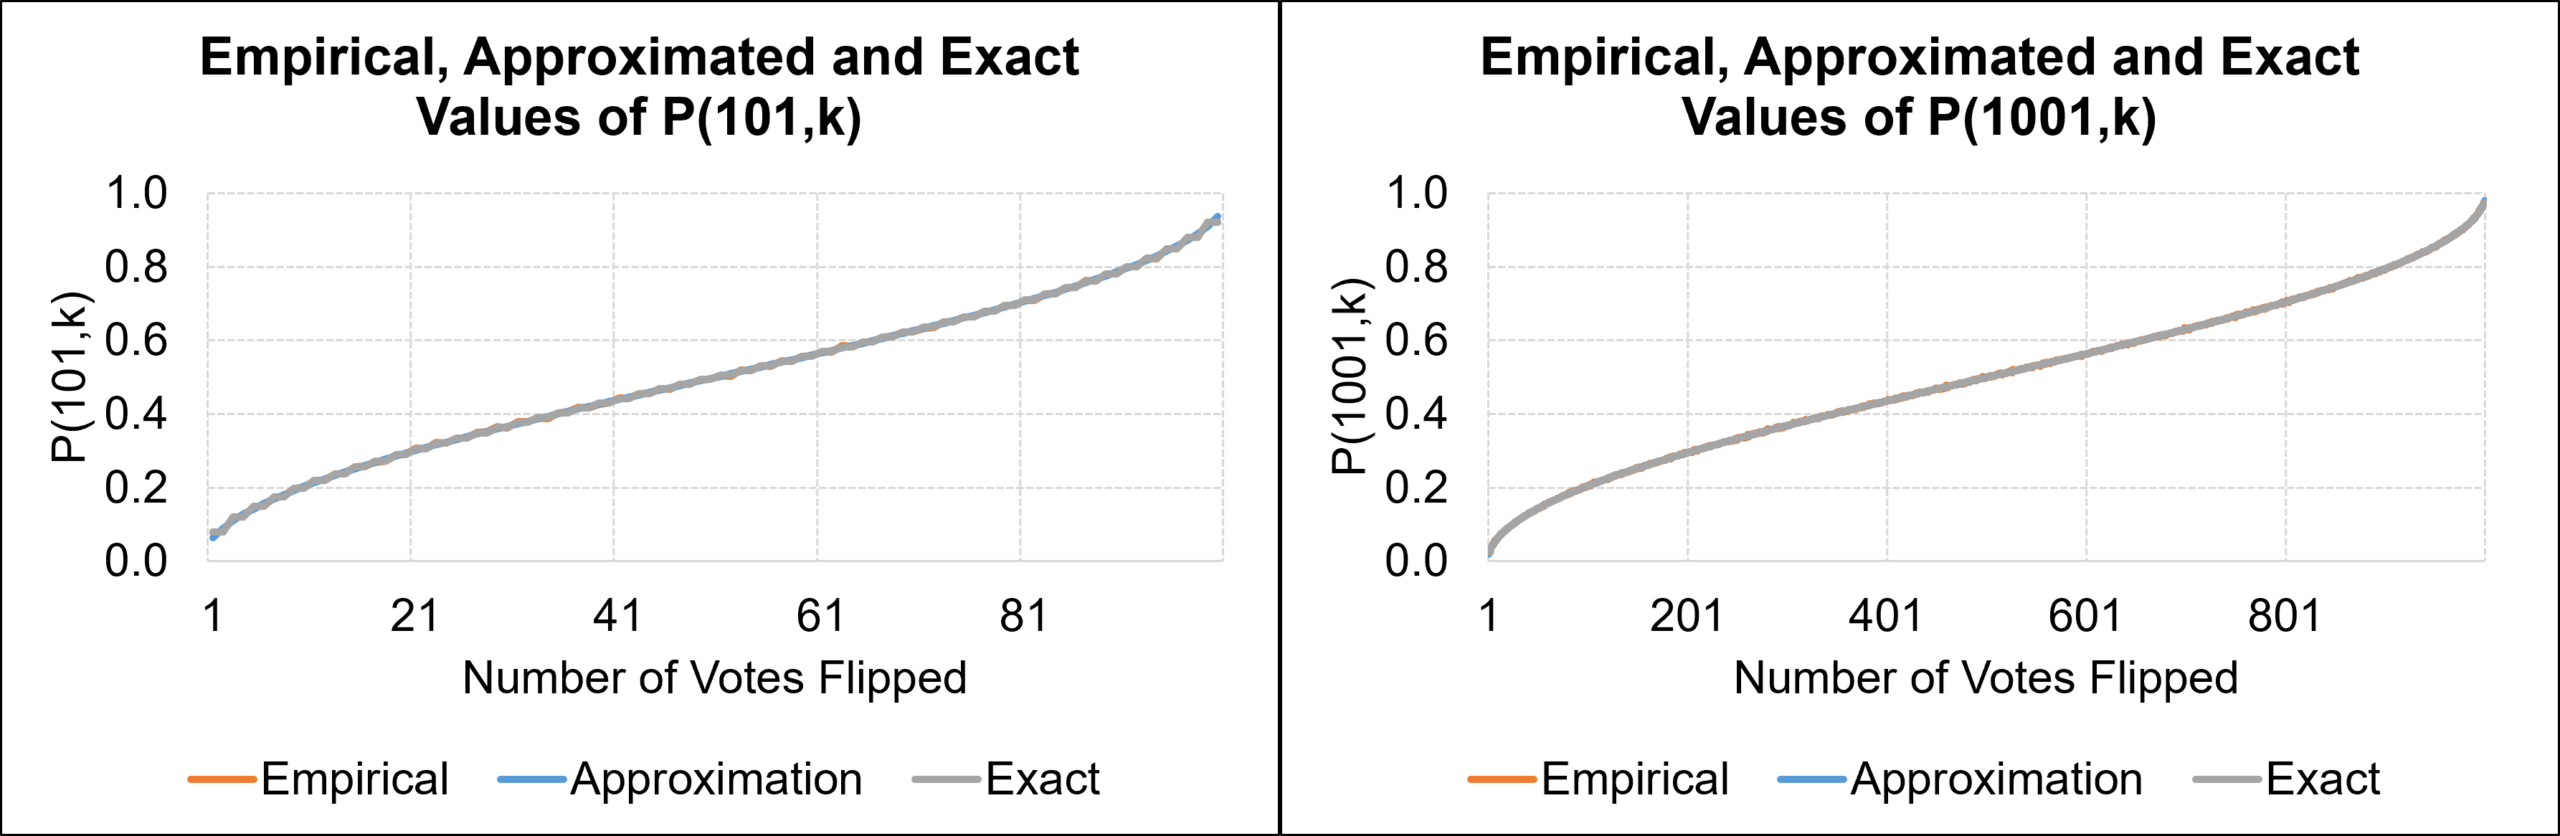
We plotted the empirical, exact, and approximate values of together on the same graph for each . In all graphs, the empirical curve is visually indistinguishable from the exact formula, indicating that simulation-based estimates converge to the evaluated results across the full domain of . This agreement confirms that the Monte Carlo procedure provides a reliable estimate of the true probability across the full domain of (Figure 3a).
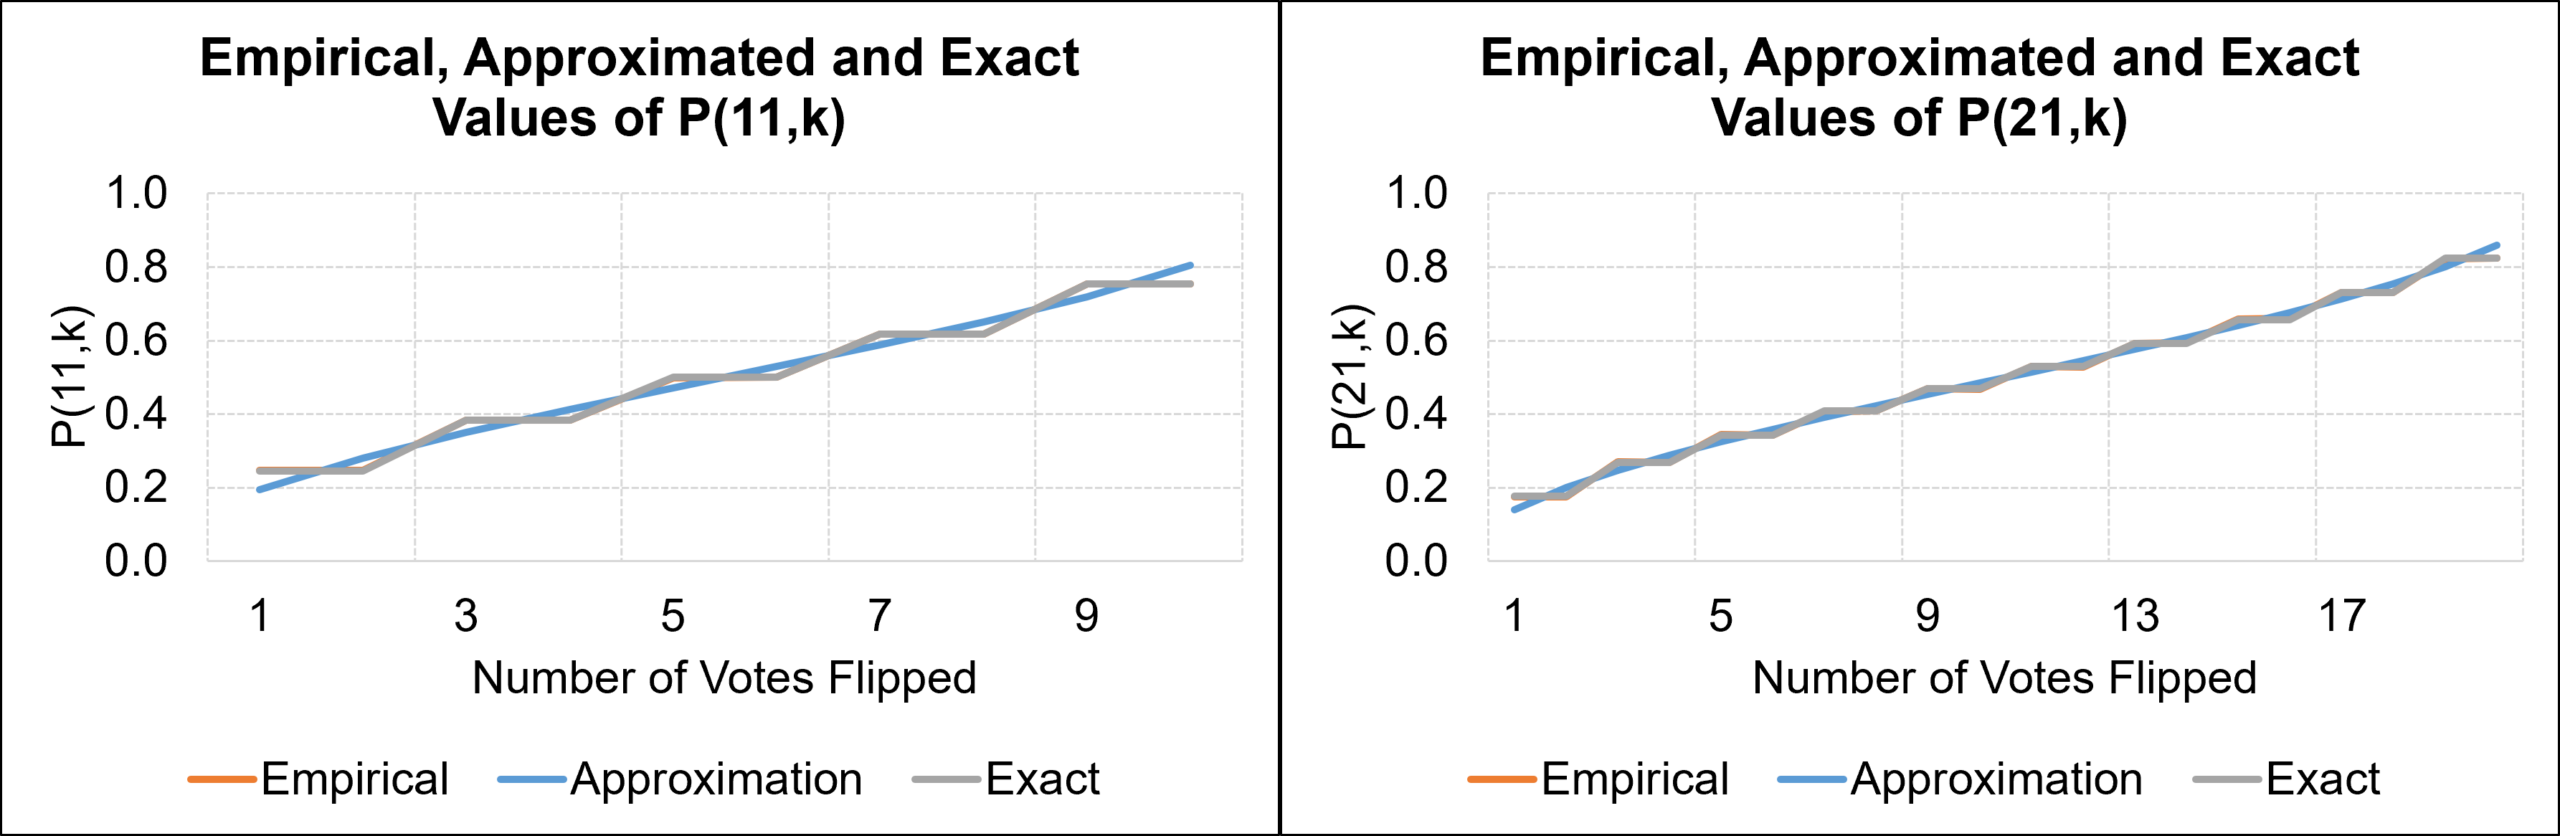
Furthermore, for both and , the approximated curve is also visually indistinguishable from the exact curve. This overlap implies that the error between the approximation and the exact formula is insignificant as n becomes significantly large (Figure 3b).
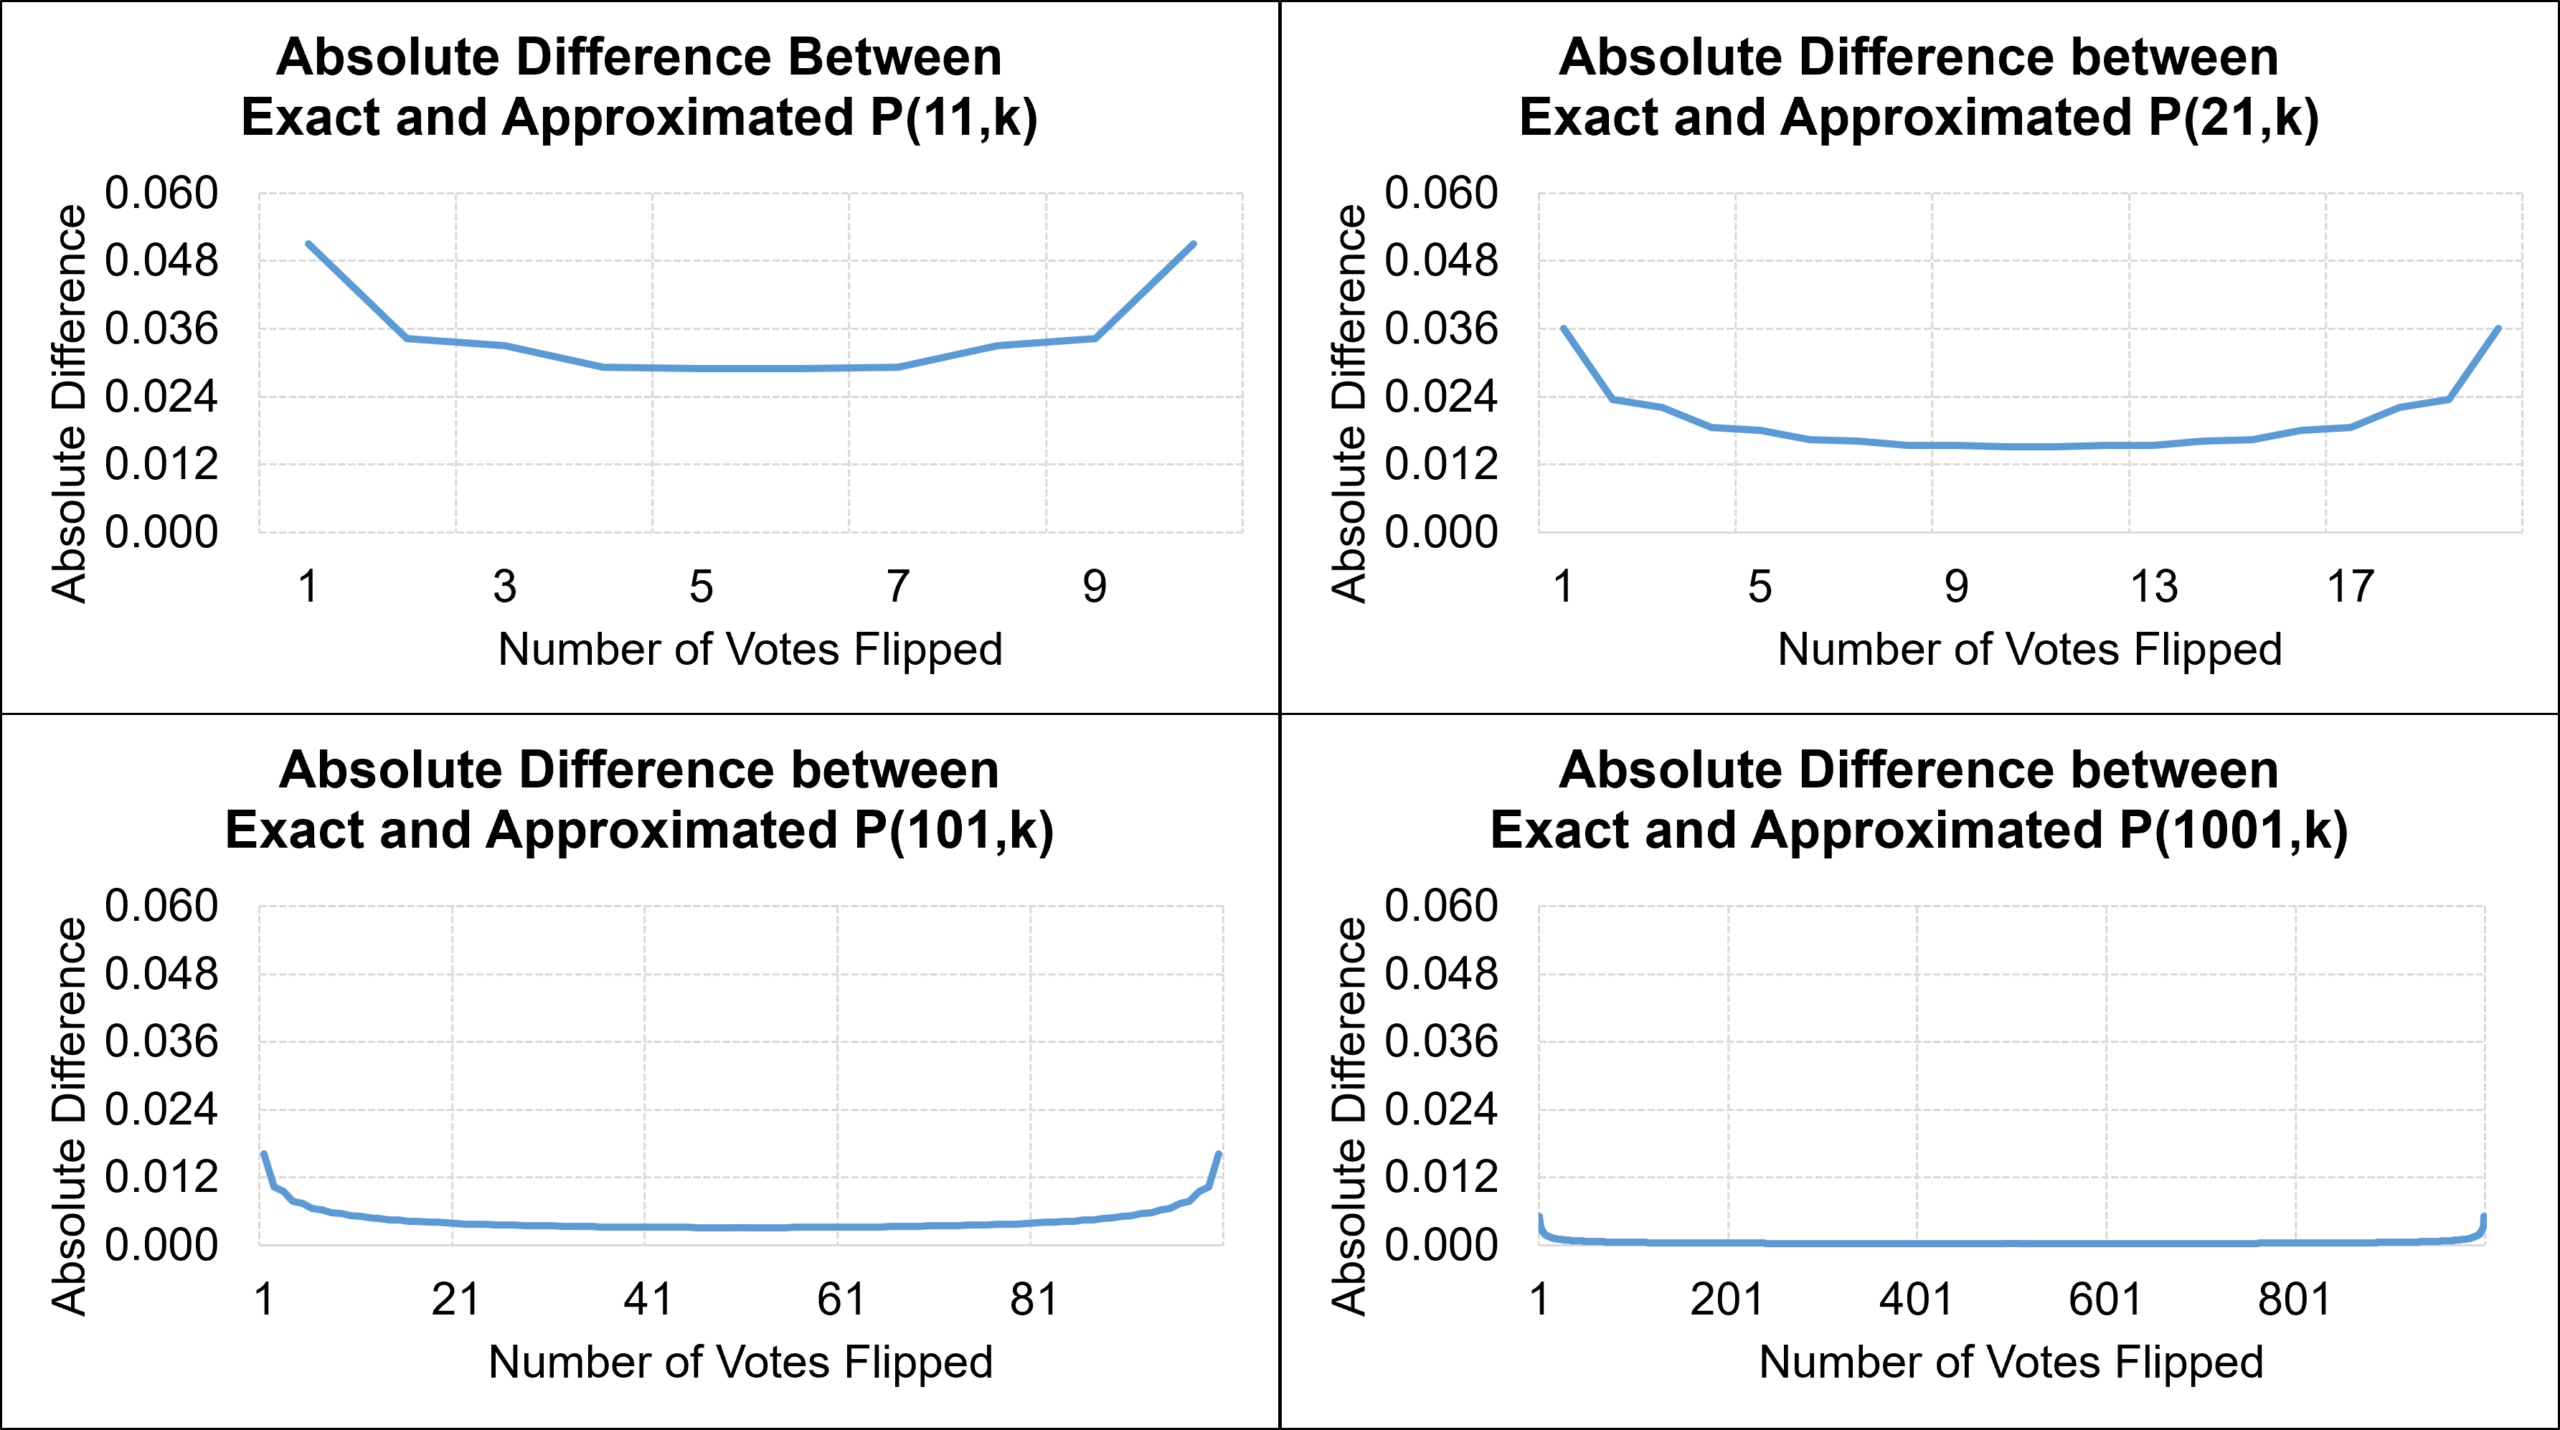
In fact, the maximum error drops from approximately 0.05 at to 0.005 at , indicating that the approximation becomes far more accurate in larger elections. Hence, these observations validate both the accuracy of the exact formula for , as well as the use of the approximation when exact evaluation is inefficient (Figure 4).
These current formulas and approximations are limited to 2-candidate voting systems and model only popular voting, where outcomes are determined by direct aggregation of individual votes. The present model does not accommodate multi-candidate elections or alternate voting systems, each of which would introduce additional combinatorial conclusions and alter the probability for a voting system winner to change under random vote flips. Future work may be extended to alternative voting systems such as the tournament voting system discussed previously or multi-candidate elections.
Furthermore, the exact formula for remains without a combinatorial proof, despite its correctness being supported both algebraically and through simulation. A combinatorial proof may provide an alternative perspective when approaching extensions and future works. This open problem may be approached by considering combinatorial interpretations for the quantities  and
and  for values of ranging from 0 to , inclusive, likely calling for a casework argument on the value of where the first
  votes are considered separately from
  other votes.
While this work is purely mathematical, the quantities derived here have implications for both election security and potential misuse, from which ethical considerations arise. On one hand, and its approximation could in principle21,22 inform an adversary seeking to manipulate an election outcome by altering or coercing a target number of votes23, since it quantifies precisely how many votes would need to be flipped to have a given probability of changing the result. Notably, our finding that this probability depends asymptotically only on the ratio , not on itself, implies that large elections are not inherently more resistant, in relative terms, to a fixed proportion of compromised votes than small elections. This result should inform, rather than discourage, efforts to secure elections at every scale. On the other hand, the same formula is directly useful for election security as it provides a principled way to quantify how many ballots would need to be audited or how small a margin of victory should be considered significant to detect or rule out manipulation at a given confidence level. This connects naturally to existing work on risk-limiting audits in election administration24,25, where the central question, how many ballots must be checked to be statistically confident the reported outcome is correct, is closely related to the quantities we derive here.
We emphasize that this work concerns idealized, randomly-flipped votes under a simplified two-candidate model, and does not constitute a practical attack. Real-world election manipulation involves substantial additional constraints such as detection risk, verification procedures, and physical/digital security that are not modeled here.
References
- A. Gelman, J. N. Katz, F. Tuerlinckx. The Mathematics and Statistics of Voting Power. Statistical Science. Vol. 17, pg. 420-425, 2002, http://doi.org/10.1214/ss/1049993201. [↩] [↩] [↩] [↩] [↩]
- A. Gelman, N. Silver, A. Edlin. What is the probability your vote will make a difference? Economic Inquiry. Vol. 50, pg. 321-326, 2012, http://doi.org/10.1111/j.1465-7295.2010.00272.x. [↩] [↩]
- M. Harrison-Trainor. An analysis of random elections with large numbers of voters. Mathematical Social Sciences. Vol. 116, pg. 68-84, 2022, https://doi.org/10.1016/j.mathsocsci.2022.01.002. [↩] [↩]
- S. Cho, J. Jun. Flip-flopping and valence in two-candidate competition. Journal of Theoretical Politics. Vol. 38, pg. 3-27, 2025, https://doi.org/10.1177/09516298251334320. [↩]
- P. Klimek, A. Aykaç, S. Thurner. Forensic analysis of the Turkey 2023 presidential election reveals extreme vote swings in remote areas. PLOS ONE. Vol. 18, pg. 1-15, 2023, https://doi.org/10.1371/journal.pone.0293239. [↩]
- L. S. Penrose. The elementary statistics of majority voting. Journal of the Royal Statistical Society. Vol. 109, pg. 53-57, 1946, https://doi.org/10.1111/j.2397-2335.1946.tb04638.x. [↩] [↩]
- W. V. Gehrlein, D. Lepelley. The probability that all weighted scoring rules elect the same winner. Economics Letters. Vol. 66, pg. 191-197, 2000, https://doi.org/10.1016/S0165-1765(99)00224-4. [↩] [↩]
- W. Bruns, B. Ichim. Computations of volumes in five candidates elections. Scientific Reports. Vol. 13, pg. 13266, 2023, https://doi.org/10.1038/s41598-023-39656-8. [↩]
- D. C. Brody, T. Yuasa. Three-candidate election strategy. Royal Society Open Science. Vol. 10, pg. 230584, 2023, https://doi.org/10.1098/rsos.230584. [↩]
- R. Bredereck, P. Faliszewski, A. Kaczmarczyk, R. Niedermeier, P. Skowron, N. Talmon. Robustness among multiwinner voting rules. Artificial Intelligence. Vol. 290, pg. 103403, 2021, https://doi.org/10.1016/j.artint.2020.103403. [↩]
- A. Bhattacharyya, P. Dey. Predicting winner and estimating margin of victory in elections using sampling. Artificial Intelligence. Vol. 296, pg. 1-23, 2021, https://doi.org/10.1016/j.artint.2021.103476. [↩]
- L. Böttcher, G. Kernell. Examining the limits of the Condorcet jury theorem: Tradeoffs in hierarchical information aggregation systems. SAGE Open. Vol. 12, pg. 1-12, 2022, https://doi.org/10.1177/26339137221133401. [↩] [↩]
- E. Elkind, E. Markakis, S. Obraztsova, P. Skowron. Equilibria of Plurality Voting: Lazy and Truth-biased Voters. Symposium on Algorithmic Game Theory. Vol. 8, pg. 1-27, 2015, https://doi.org/10.1007/978-3-662-48433-3_9. [↩]
- G. H. V. Brunello, E. Y. Nakano. Bayesian inference on proportional elections. PLOS ONE. Vol. 10, pg. 1-11, 2015, https://doi.org/10.1371/journal.pone.0116924. [↩]
- M. Gao, Z. Wang, K. Wang, C. Liu, S. Tang. Forecasting elections with agent-based modeling: Two live experiments. PLOS ONE. Vol. 17, pg. 1-11, 2022, https://doi.org/10.1371/journal.pone.0270194. [↩]
- I. Mortici. A substantial improvement of the Stirling formula. Applied Mathematics Letters. Vol. 24, pg. 1-4, 2011, https://doi.org/10.1016/j.aml.2011.03.008. [↩] [↩]
- R. P. Brent, J. H. Osborn, W. D. Smith. Asymptotic approximation of central binomial coefficients with rigorous error bounds. Open Journal of Mathematical Sciences. Vol. 4, pg. 261-275, 2021, https://doi.org/10.30538/oms2021.0173. [↩]
- N. Elezović. Asymptotic expansions of central binomial coefficients and Catalan numbers. Journal of Integer Sequences. Vol. 17, pg. 1-16, 2014, https://cs.uwaterloo.ca/journals/JIS/VOL17/Elezovic/elezovic5.pdf. [↩]
- F. Dubeau. On Euler–Maclaurin formula. Journal of Computational and Applied Mathematics. Vol. 296, pg. 649-660, 2016, https://doi.org/10.1016/j.cam.2015.10.023. [↩] [↩]
- S. J. Brams, P. C. Fishburn. Coalition voting. Mathematical and Computer Modelling. Vol. 16, pg. 15-26, 1992, https://doi.org/10.1016/0895-7177(92)90084-X. [↩]
- M. Zhang, R. M. Alvarez, I. Levin. Election forensics: Using machine learning and synthetic data for possible election anomaly detection. PLOS ONE. Vol. 14, pg. 1-14, 2019, https://doi.org/10.1371/journal.pone.0223950. [↩]
- A. Rozenas. Detecting election fraud from irregularities in vote-share distributions. Political Analysis. Vol. 25, pg. 41-56, 2017, https://doi.org/10.1017/pan.2016.9. [↩]
- J. Gilbert, I. Laurenceau, J. Louis. A Study of Ballot Anomaly Detection with a Transparent Voting Machine. Interactions. Vol. 28, pg. 57-61, 2021, http://doi.org/10.1145/3484937. [↩]
- J. Jaffe, J. R. Loffredo, S. Baltz, A. Flores, C. Stewart III. Trust in the count: Improving voter confidence with post-election audits. Public Opinion Quarterly. Vol. 88, pg. 585-607, 2024, https://doi.org/10.1093/poq/nfae029. [↩]
- P. Klimek, Y. Yegorov, R. Hanel, S. Thurner. Statistical detection of systematic election irregularities. Proceedings of the National Academy of Sciences. Vol. 109, pg. 1-5, 2012, https://doi.org/10.1073/pnas.1210722109. [↩]