Abstract
This paper explores how local climate is related to the creation of urban cycling systems. We examine an international sample of cities to establish whether such elements as temperature and precipitation are related to the degree of committed bike infrastructure. With the help of OpenStreetMap data, in the form of the OSMnx, and climate data in each city, we determined the proportion of the road network of each city composed of cycleways (percent cycleway). We then made correlation and regression analyses to examine climate-infrastructure relationships. There is an overall pattern, based on the results that suggest that cities in the colder climates (usually at lower temperatures) are more likely to have a high proportion of cycleways, whereas in many warmer, older tropical cities, the level of cycling infrastructure is relatively low. The annual precipitation was less negatively related. Nonetheless, it is highly varied and overlapped implying that climate is not a single determining factor. Although climate seems to have a certain impact on the urban bicycle infrastructure, other sources like economic development, the urban planning policies, and cultural attitudes may be of a great importance. The study adds new quantitative knowledge on the relationship between environmental conditions and cycling-friendly infrastructure to guide urban planners and policymakers who want to facilitate sustainable transportation among various climatic conditions.
Keywords: cycling infrastructure; urban climate; Köppen–Geiger; comparative cities; regression
Introduction
We aim at answering the question of: Is climate associated with the share of cycling infrastructure in cities? It is of significance to know how the climate factors may be associated with the cycling infrastructure in order to plan sustainable transportation. Expansion of bicycle roads and bicycle use would lessen our reliance on automobiles, hence it is essential to investigate ways that various climates may be associated with investment in bicycle lanes and ways cities can adjust to bike lanes in the future since climatic change is changing weather patterns.
Beyond climate considerations, cycling infrastructure delivers well-established public health and environmental benefits, including reduced air pollution, lower carbon emissions, and improved cardiovascular health among urban populations1,2.In this study, percentage cycleway refers to the proportion of a city’s road network dedicated to cycleways. We calculate this by dividing the total length of all cycleway paths by the total length of all roads in the city, then multiplying by 100. This metric provides a consistent way to compare cycling infrastructure across cities of varying sizes and networks.
There have been studies conducted on weather and traveling behavior, particularly bicycling. As an illustration, Ahmed et al. performed a quantitative study of the number of cyclists in Melbourne to investigate the relationship between daily weather changes and the amounts of cycling and found that cyclists of different categories (commuters and recreational) react to changes in weather differently3,4. A problem with this type of studies is the frequency of data, weather data is available within one hour whereas bicycles usage data are usually sparse (with occasional counts or surveys). In Brussels, Khattak and de Palma5 discovered that 54 per cent of commuter respondents changed their travel behaviour (mode, timing or route) due to bad weather. Likewise, Nankervis6 found a reduction in bicycle commuting in winter in Melbourne with heavy rain being the number one deterrent with 67 percent of cyclists not willing to ride in heavy rain6. Guo et al.7 conducted a study in Chicago and found that high wind speeds and rainfall reduced bus ridership (and rainfall reduced rail use), but that small positive changes in temperature increased transit ridership. These articles demonstrate that bad weather tends to discourage active commuting, but the extent of effect may also depend on the situation. These behavioral responses to weather suggest that climate shapes not only day-to-day cycling decisions but may also influence longer-term political and investment appetite for cycling infrastructure — the focus of the present study.
There are benefits beyond short-term weather effects, city characteristics and policies influence cycling infrastructure. Reggiani et al.8 examined how city size and network structure relate to bicycle infrastructure availability across 47 cities, using OpenStreetMap data and scaling analyses. They identified distinct “classes” of bike network development (from lower-bound to upper-bound networks) and noted a bias in available data toward developed cities (which often have more comprehensive mapping and similar street patterns). Prior studies have generally found that cities with larger, well-connected bicycle networks tend to have higher cycling mode share, whereas fragmented or piecemeal networks can discourage cycling by reducing safety and continuity9,10.
Wadud11 modeled future bicycle flows in London using regression with climate model data. The projections suggested only a modest overall increase (~0.5%) in cycling activity by 2050 due to warmer temperatures, with seasonal differences: slightly higher cycling in summer and winter, but a decrease in spring. Hotter summers could particularly affect leisure cycling, projected to rise by ~7% on weekends by 204111. On the infrastructure side, some studies have evaluated the impact of new bike lanes on ridership. Xiao et al.12 conducted an interrupted time series analysis in Paris and Lyon, finding that installing new cycling infrastructure did not immediately boost cycling counts beyond existing trends, suggesting that infrastructure is necessary but may not be the only fact in getting large increases in ridership. They highlight the importance of context and other factors, noting that many interventions lacked control comparisons or suffered from bias– especially towards the global North countries– highlighting the need for more evaluation of cycling policies and infrastructure.
In summary, the current literature indicates that while unfavorable weather tends to reduce cycling in the short term, cities with strong cycling cultures and infrastructure can still achieve high cycling levels even in challenging climates. This study adds on this background by attempting to assess whether cities in different climatic zones exhibit different levels of cycling infrastructure, and subsequently discussing what this implies for planning in an era of climate change.
Methods
To have a wide sample we gathered a list of 119 cities in the world (all the continents except Antarctica). Data on total road network length, total cycleway length, climate indicators, and other variables were collected concerning each city.
The computation of percent cycleway was manually carried out on a small number of cities using quantum GIS. We downloaded all cycleway and road features (in selected four pilot cities in the Netherlands, Amsterdam, Rotterdam, the Hague and Utrecht, and two South East Asian megacities, Hong Kong and Singapore) and calculated the sum of the road length and cycleway length using field calculations with the QuickOSM plugin. This gave a visual interpretation of the distribution of cycleways in a city in comparison to all roads. This however was very time-consuming in terms of efficiency to do to a large number of cities so we went to an automated Python workflow. We then repeated the same six-city subset (Amsterdam, Rotterdam, The Hague, Utrecht, Hong Kong, and Singapore) in the automated Python pipeline and confirmed that the resulting cycleway and total-road lengths matched the QGIS values within rounding tolerance, providing internal validation of the automated method.
In order to scale the analysis, we developed Python scripts using OSMnx (v1.x) and GeoPandas. For each city, the full street network was downloaded using ox.graph_from_place(city_name, network_type=’all’), which retrieves all OSM edge types including roads, paths, and dedicated infrastructure. Where this query failed (e.g. timeout or boundary issues), a fallback query used ox.features_from_place() with explicit highway tags: motorway, trunk, primary, secondary, tertiary, residential, and cycleway. Edges were projected to the local UTM zone (computed from the city centroid) to ensure length calculations in metric units. A cycleway was defined as any edge where the OSM highway tag equals “cycleway” — this captures dedicated off-road cycling paths but does not capture on-street bike lanes tagged differently (e.g. cycleway=lane on a road edge). This is a known limitation discussed further below. Total road length and cycleway length were summed from edge geometries, and percent cycleway was computed as (cycleway length / total road length) × 100. Climate data were retrieved from the Meteostat API using the nearest weather station to each city’s geocoded centroid (via Nominatim/GeoPy), covering the calendar year 2018 as the reference period. Annual average, maximum, and minimum temperatures and total precipitation were derived from daily records. GDP per capita (country level) was sourced from the World Bank API. Köppen–Geiger classifications were assigned using a custom classify_koppen() function following standard threshold rules13. The threshold distinguishing hot summers from warm summers under the Köppen scheme is the standard criterion of an average temperature of at least 22°C in the warmest month.
As noted based on the literature review, the access to publicly available data constrained us, in particular in the cities in developing regions that may not have the complete coverage of the OpenStreetMap or incomplete records on climate leading to the subrepresentation or inaccuracy of such regions. As an example, when a query of data had given 0 mm of annual precipitation at London, then that city was eliminated as clearly invalid. In spite of these shortcomings, the data obtained is adequate in broad analysis of climate and cycling infrastructure.
We have chosen a very diverse range of cities on purpose to get various kinds of climates, geographies and levels of development. Table 1 provides the selection criteria and the examples of the cities in each category. This favored both hot and cold climates, flat and hilly landscapes, high-income and developing cities, an assortment of city sizes (small towns and megacities), and culture that favors bicycles and culture that favors cars. We then compiled the data and checked the results against anomalies. Clearly outliers were eliminated or examined in case of data errors. As an illustration, when the weather data of a city indicated a zero precipitation (which occurred in one of the sources of London), we used the values of the city and filtered them out in a case where we could not verify the information. Where any one of the variables was zero or unrealistic, we did more research in order to establish whether it was an error or an extreme real value in an attempt to enhance the accuracy.
| Characteristic | Reasoning | Example cities in Data Set |
| Cold Climate | Cycling is an outdoor, unprotected mode of transport. Therefore, weather will largely influence cycling decisions and a city’s encouragement of it. | Helsinki, Oslo, and Calgary |
| Hot/Tropical Climate | Hot and tropical-climate cities introduce heat-stress and humidity barriers, helping isolate whether infrastructure investment scales down where conditions are physiologically harder for cyclists. | Ahmedabad, Buenos Aires and Singapore |
| Oceanic Climate | Oceanic-climate cities pair mild temperatures with frequent precipitation, isolating the role of rainfall — distinct from temperature — in shaping cycling provision. | Dublin, Wellington and Vancouver |
| Flat Terrain | Flat terrain is inherently more favorable for cycling, so the terrain can affect cycle flow. | Copenhagen, Bordeaux, and Groningen |
| Hilly Terrain | Cities with significant grades raise the physical barrier to commuter cycling, helping separate terrain effects from climate effects. | Edinburgh, Lisbon, and Medellin |
| High Income Cities | Income affects cycle networks, infrastructure and also convenience. | Amsterdam, Zurich, and Cologne |
| Mixed Development Cities: | Middle-income cities reveal how cycling provision evolves where wealth, governance, and policy capacity are growing but uneven. | Santiago, Warsaw, and Budapest |
| Megacities (population of 10 million or more) | Cycling is influenced by city density, size, commuting distance and convenience. Small cities provide information about cycling for short distances and less congestion; Mid-sized cities are often where the most ambitious cycling policies are, while balancing immense urbanisation; Larger cities have a range of different commute options and routes. | Seoul, Paris, and New York |
| Large Cities (population of 1 million to 10 million) | Large cities often pilot the most ambitious cycling policies while balancing dense central districts and sprawling outskirts. | Vienna, Barcelona, and Toronto |
| Mid-sized Cities (population of 250 thousand to 1 million) | Mid-sized cities frequently lead in per-capita cycling investment thanks to manageable scale and active local policy. | Geneva, Valencia, and Graz |
| Small Cities (population of less than 250 thousand) | Small cities surface short-distance cycling use and lower congestion, providing a baseline for car-light contexts. | Oulu, Launceston, and Hobart |
| Strong Cycling Traditions and Policies | The culture and traditions of a city also affects the people’s decision making in terms of transport. | Paris, Coppenhagen, and Eindhoven |
| Car-dominant Culture | Cities historically planned around private vehicles serve as a counterpoint to cycling-tradition cities and isolate the cultural dimension from climate and wealth. | Denver, Madison, and Geelong |
| Located in Europe | It is important to consider to get a holistic understanding of the proportions of cycling globally, so that the findings are more transferable and generalisable. | Toulouse, Manchester, and Venice |
| Located in North America | North America captures car-centric urban form, sprawl, and a wide climate range from cold prairies to subtropical southern cities. | Toronto, Chapel Hill, Ann Arbor |
| Located in South America | South America highlights tropical and high-altitude cities at moderate income levels, where cycling investment is rapidly evolving. | Pasto, Montevideo, and Santiago |
| Located in Asia | Asia captures megacities with mixed climates and a wide income spread, including cities with strong public-transport cultures and varied cycling histories. | Surat, Busan, and Sapporo |
| Located in Oceania | Oceania captures isolated, English-speaking, car-influenced cities across temperate and tropical climates. | Wollongong, Christchurch, and Townsville |
| Located in Africa | Africa includes lower-income tropical and arid cities where OSM coverage is weakest — important for testing the geographic generalisability of the findings. | Nairobi, Dakar, and Maputo |
All data were obtained via public APIs and databases. We used the Overpass API through OSMnx to retrieve street networks and bike paths for each city. City location (latitude/longitude) was determined using the Nominatim API (via GeoPy) given city and country names. Climate data (average temperatures, precipitation) were pulled from the Meteostat API (via the Meteostat Python library), which provides historical climate normals for weather stations near each city. Economic data (GDP per capita) for each city’s country came from the World Bank API (by downloading the relevant indicators as CSV). OSM data were retrieved via the Overpass API between 2024 and 2025, and Meteostat climate data correspond to the calendar year 2018 reference period.
After data collection, the final dataset included each city’s percent cycleway, climate metrics, climate zone classification, and other context variables. Table 2 summarizes the distribution of cities by Köppen–Geiger climate categories in our sample, to illustrate the climate diversity covered.
| Köppen Code | Climate Zone Name | Number of Cities |
| Af | Tropical rainforest | 3 |
| Am | Tropical monsoon | 6 |
| Aw | Tropical savanna (dry winter) | 6 |
| Bsh | Steppe, hot | 3 |
| BSk | Steppe, cold (semi-arid) | 1 |
| BWh | Desert, hot | 4 |
| BWk | Desert, cold (arid) | 16 |
| Cfa | Humid subtropical, hot summer | 23 |
| Cfb | Oceanic, warm summer | 29 |
| Csa | Mediterranean, hot summer | 5 |
| Csb | Mediterranean, warm summer | 4 |
| Cwa | Humid subtropical, dry winter | 6 |
| Cwb | Subtropical highland, dry winter | 4 |
| Dfa | Humid continental, hot summer | 3 |
| Dfb | Humid continental, warm summer | 4 |
| Dwa | Humid continental, dry winter, hot summer | 1 |
| Dwb | Humid continental, dry winter, warm summer | 1 |
Results
We can observe from Figure 1 that the cities with higher percentage cycleways (around yellow or green colors) are in Northeastern Europe, Western Europe, and Canada. As expected, developed countries.
There seems to be a much higher percentage cycleway in Bogota (~4%) than in the rest of Colombia (~1%). This may be because of increased investment and availability of cycling infrastructure in the capital city, and also because the average temperature (13.89°C) is significantly less than the other four cities (18.37°C – 28.7°C), a pattern consistent with the observation that cycling provision tends to be higher in cooler cities even though all cities are in a tropical climate14.
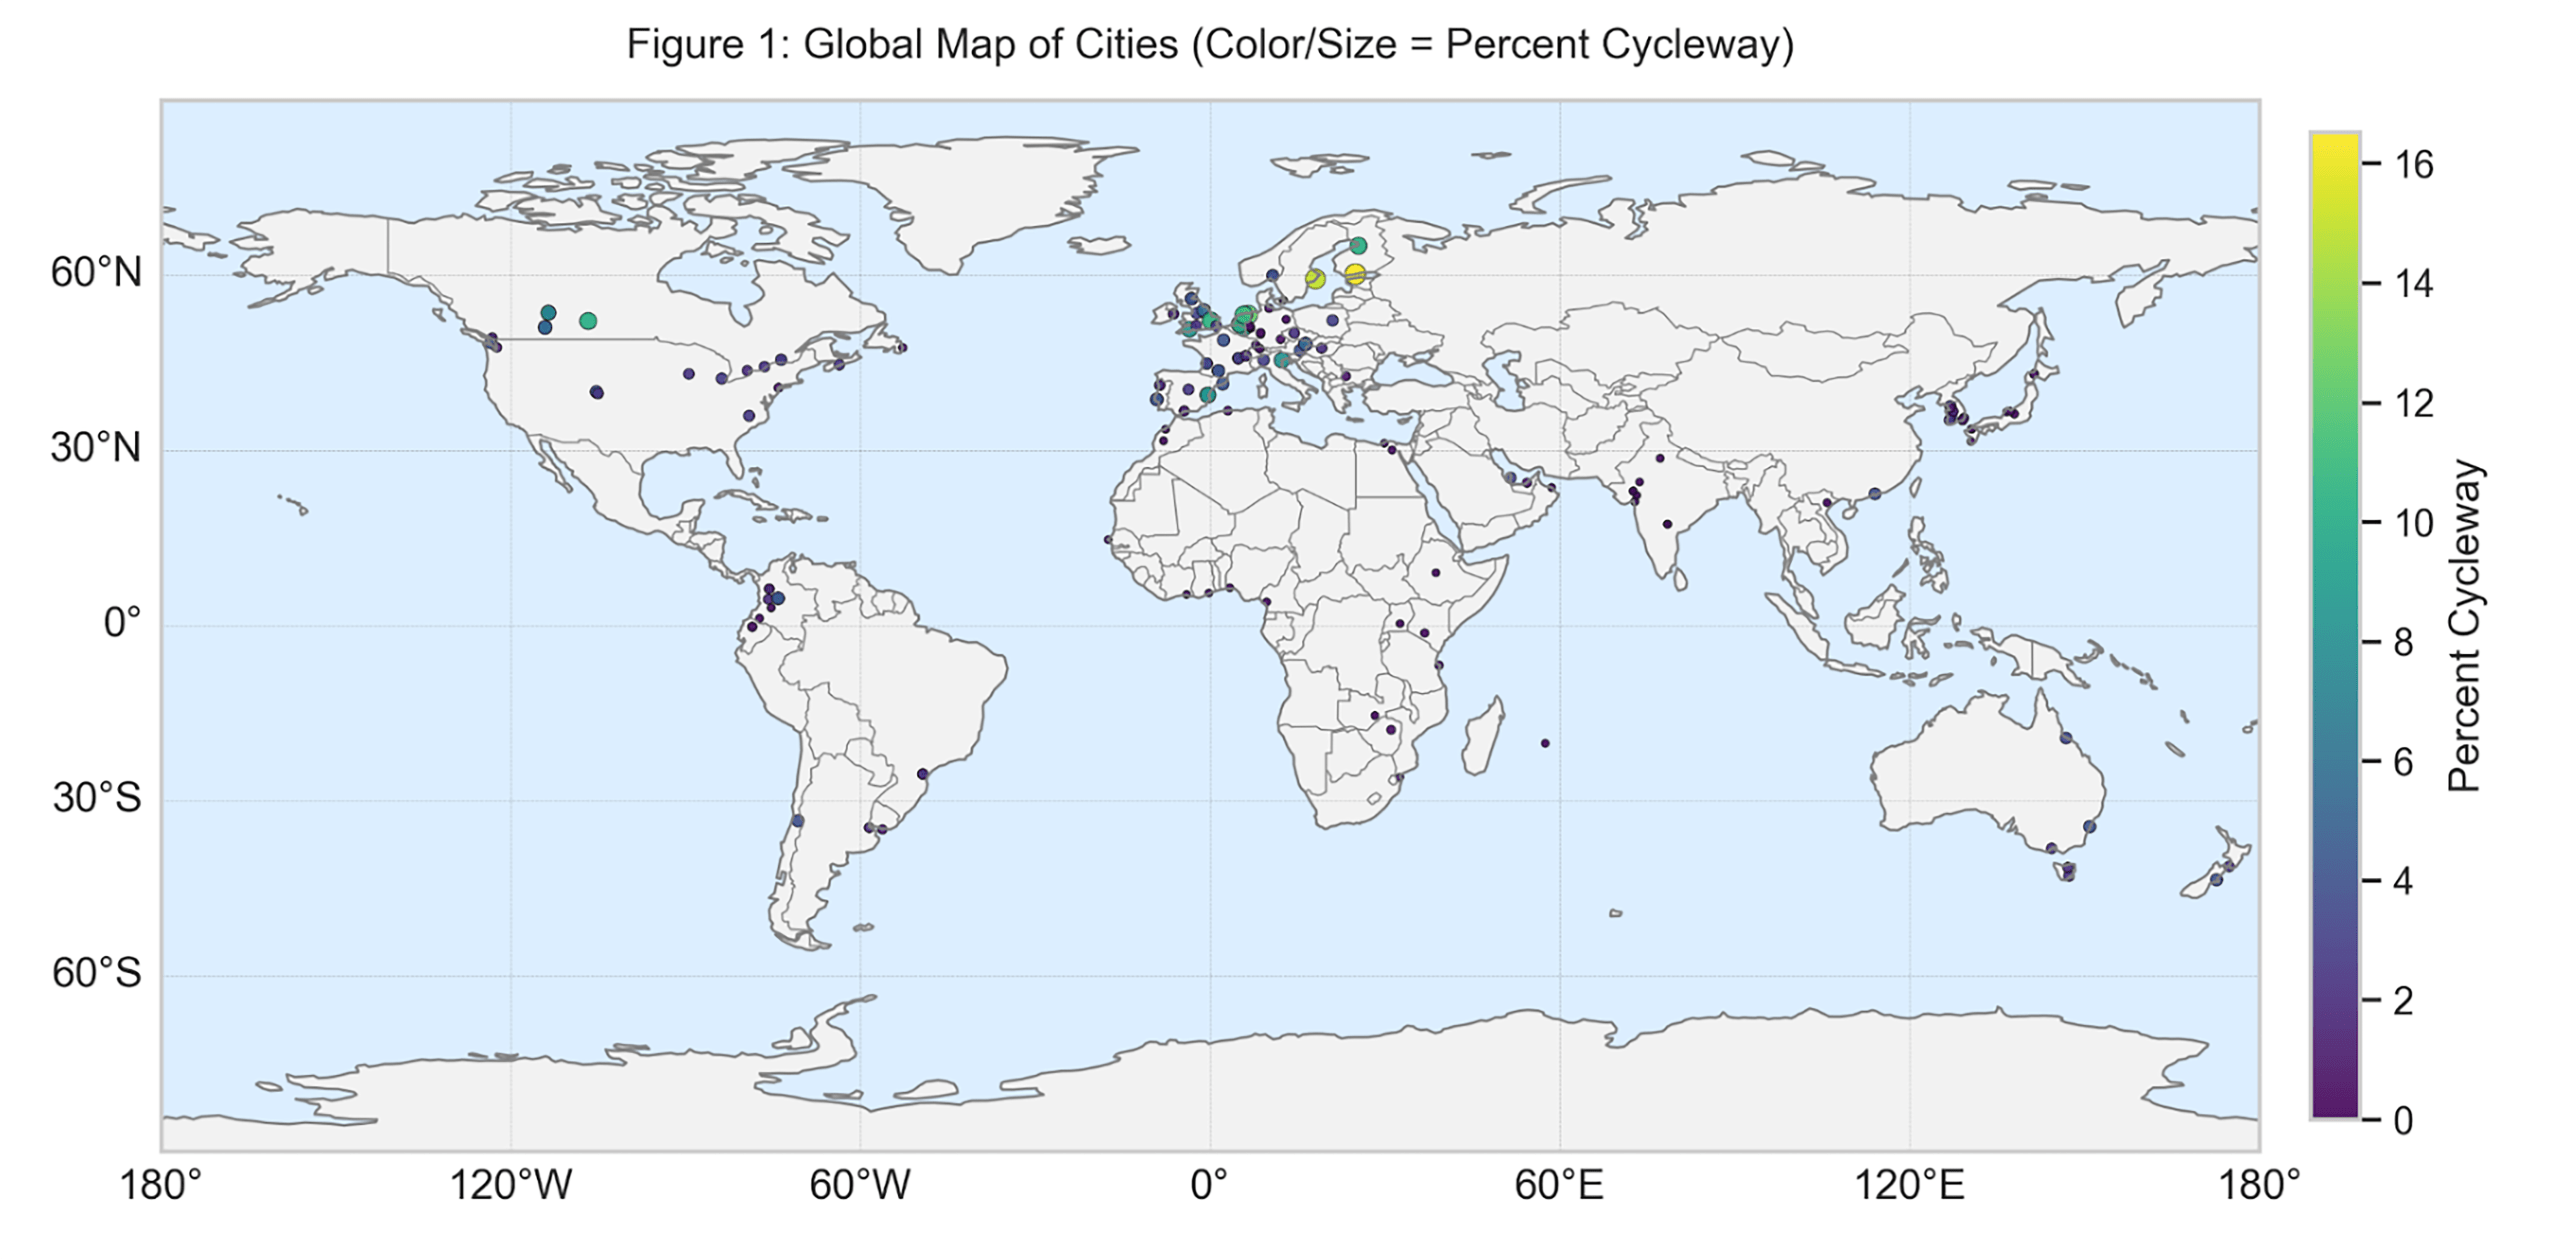
Furthermore, the percent cycleway seems to be higher in the Northwest of North America compared to the East. This data also correlates with the average temperature of cities as Saskatoon, Canada is 2.08°C and the next two highest percentage cycleways in the continent were Edmonton and Calgary with average temperatures of 4.02 and 4.36°C, respectively. Although there is a strong correlation with cities that have high cycle percentage and colder temperatures, this does not mean that all cities with high temperatures have high cycle percentage. For example, St John’s, Canada has the lowest cycle percentage in the sample cities of North America, but has an average temperature of 5.51°C, which is much lower than Chapel Hill (16.09°C), which has a higher cycle percentage. Therefore, the relationship between cycle percentage and cold temperatures does not go both ways, demonstrating that there are a series of other factors which are also associated with cycle percentage (e.g. terrain, culture, and infrastructure).
In Europe, the North and Southeast seem to have higher cycle percentages, with an outlier at Valencia, Spain (~8.5% compared to the rest of Spain ~3%) likely due to its flat terrain compared to other cities in Spain (e.g. Madrid). Interestingly, Sweden and Finland have the cities with the highest cycle percentages but Norway’s (its neighbouring country) is comparatively low. Even though their Koppen climates and temperatures are relatively similar, this difference is likely due to the increased total precipitation in Norway (650.1 mm) compared to that of Sweden and Finland (around 345.5 and 540.0 mm, respectively), which highlights that percentage cycleway is dependent on factors apart from average temperature and terrain.
In Figure 1, across Africa there are extremely low rates of percent cycleway (maximum is 0.79% but majority is less than 0.01%). There are also numerous trends across these cities: mostly tropical, hot climate, and GDP lower than $4000 (except Mauritius and Algeria). This is consistent with the pattern that hotter-climate cities tend to have lower cycle percentages, although the design is correlational and does not establish causation. Additionally, it emphasises the need for funding and infrastructure to improve percentage cycleways.
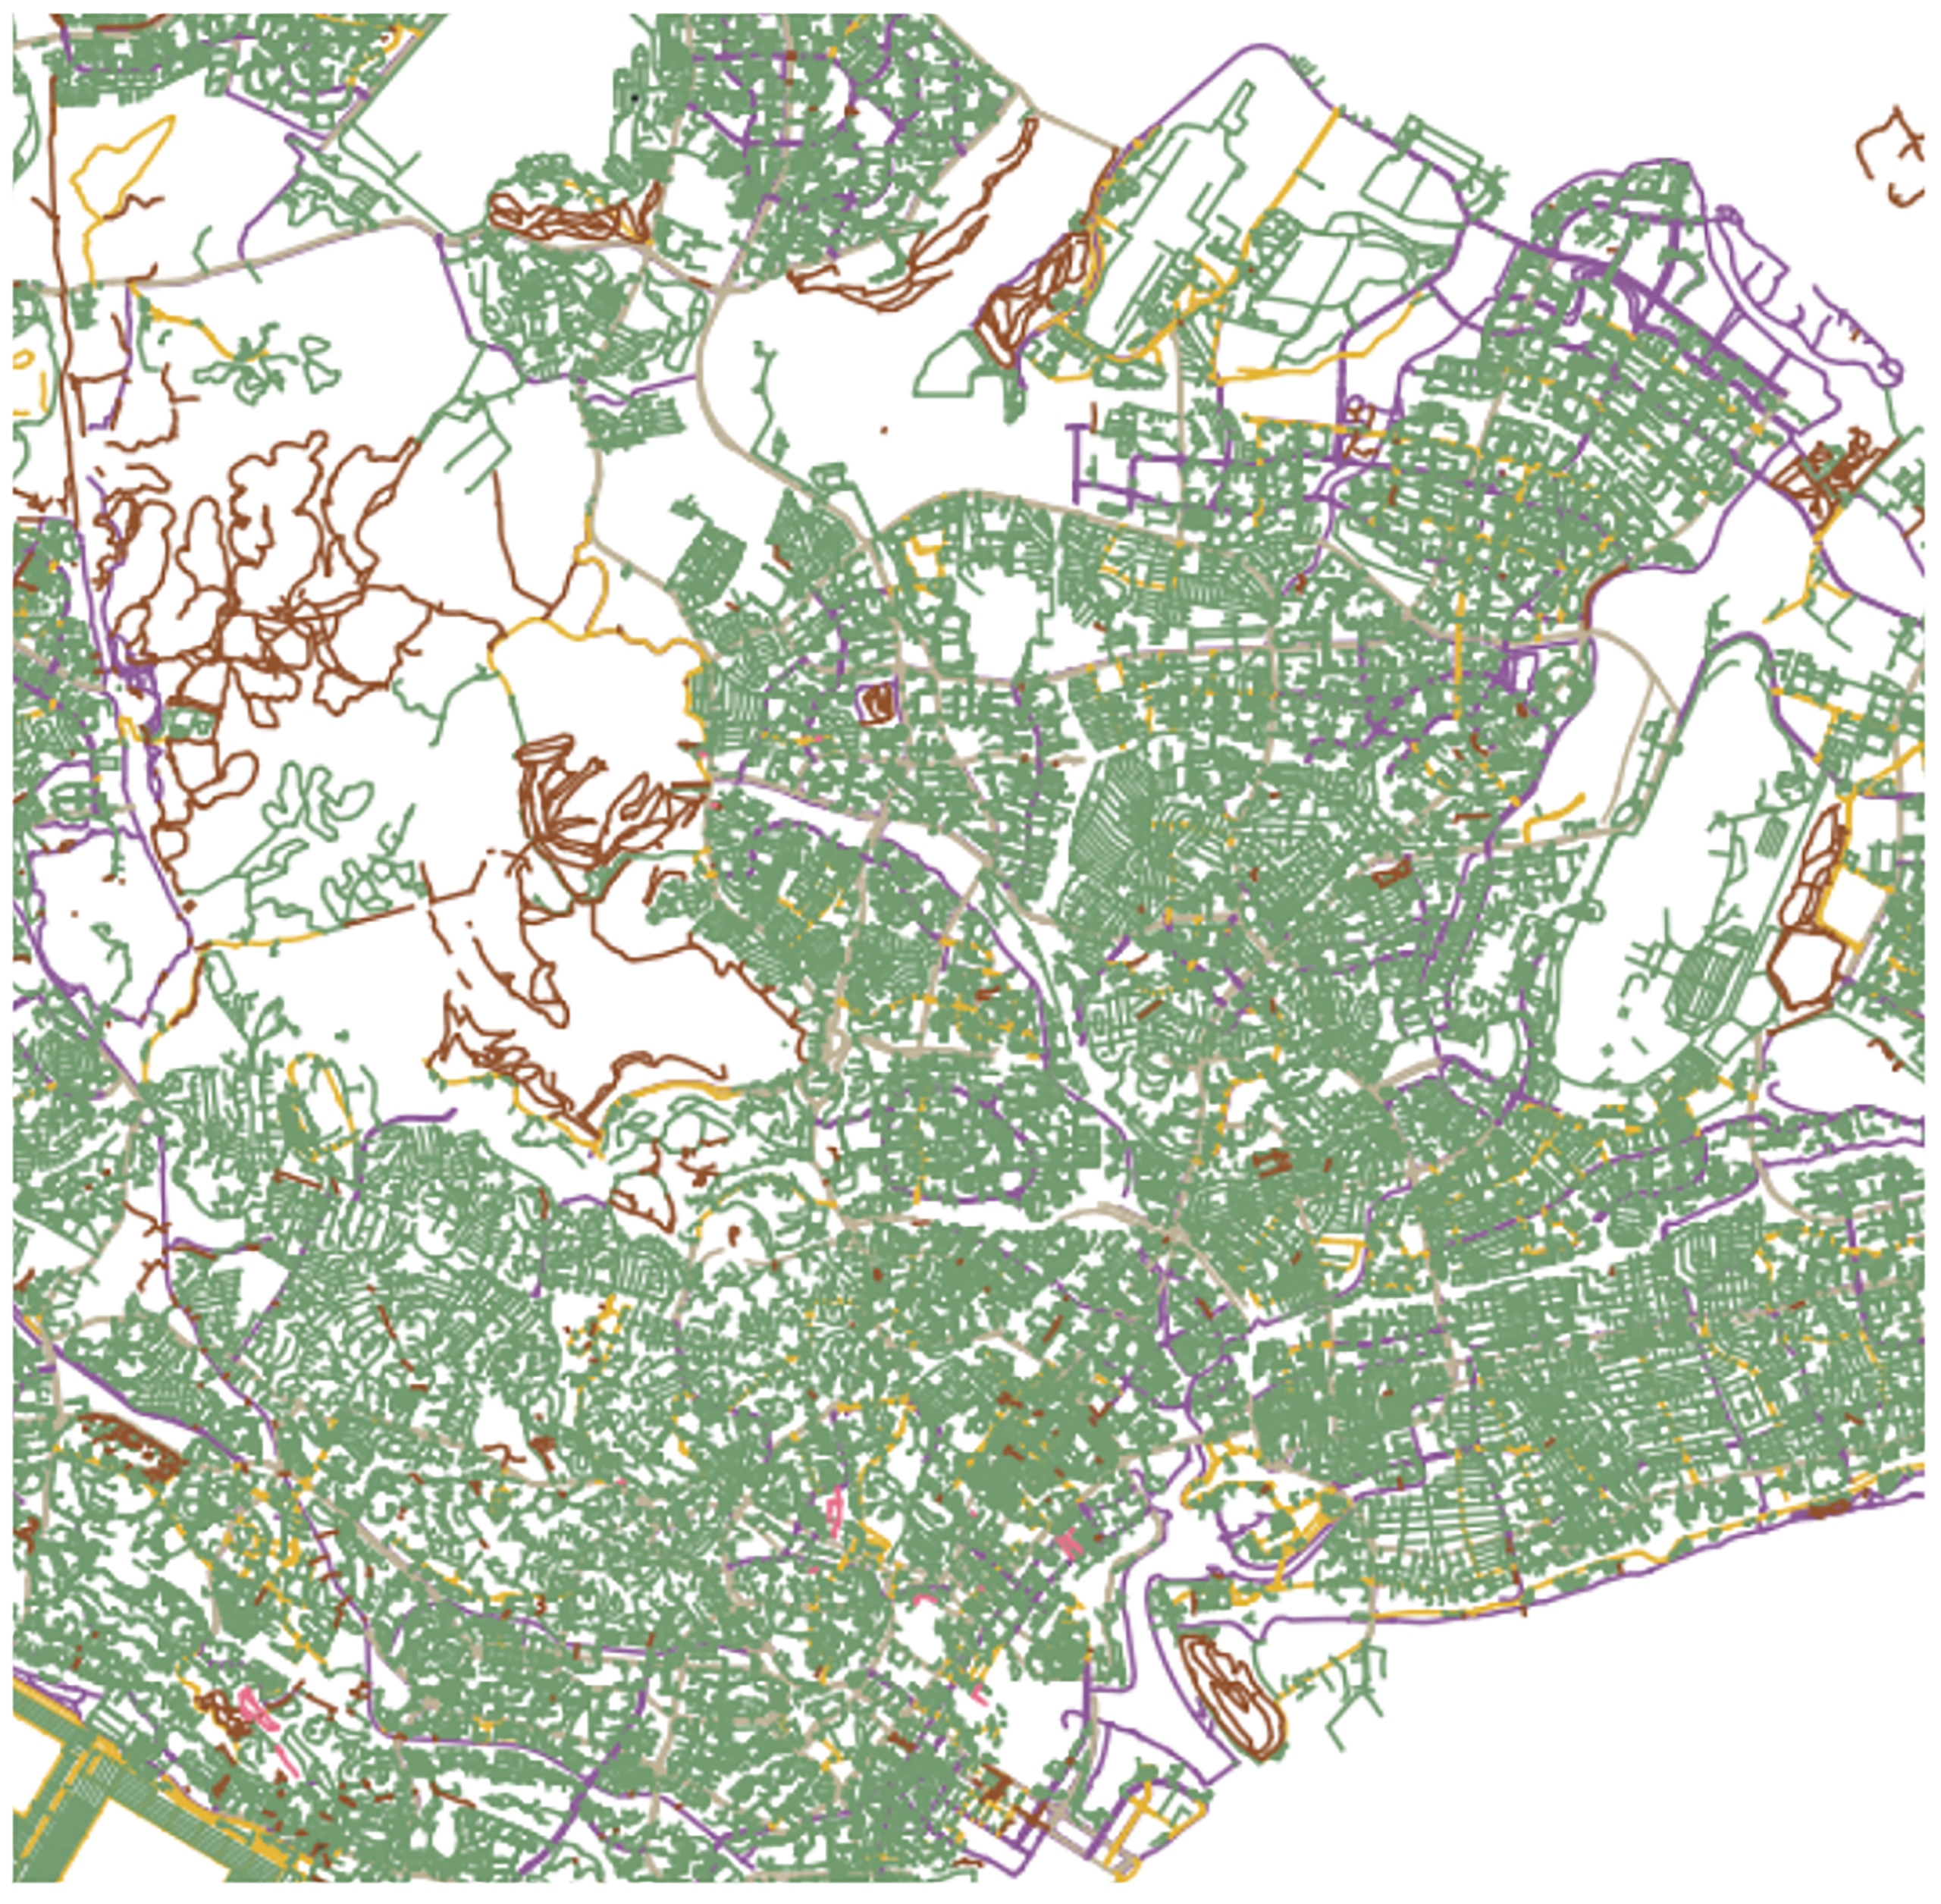
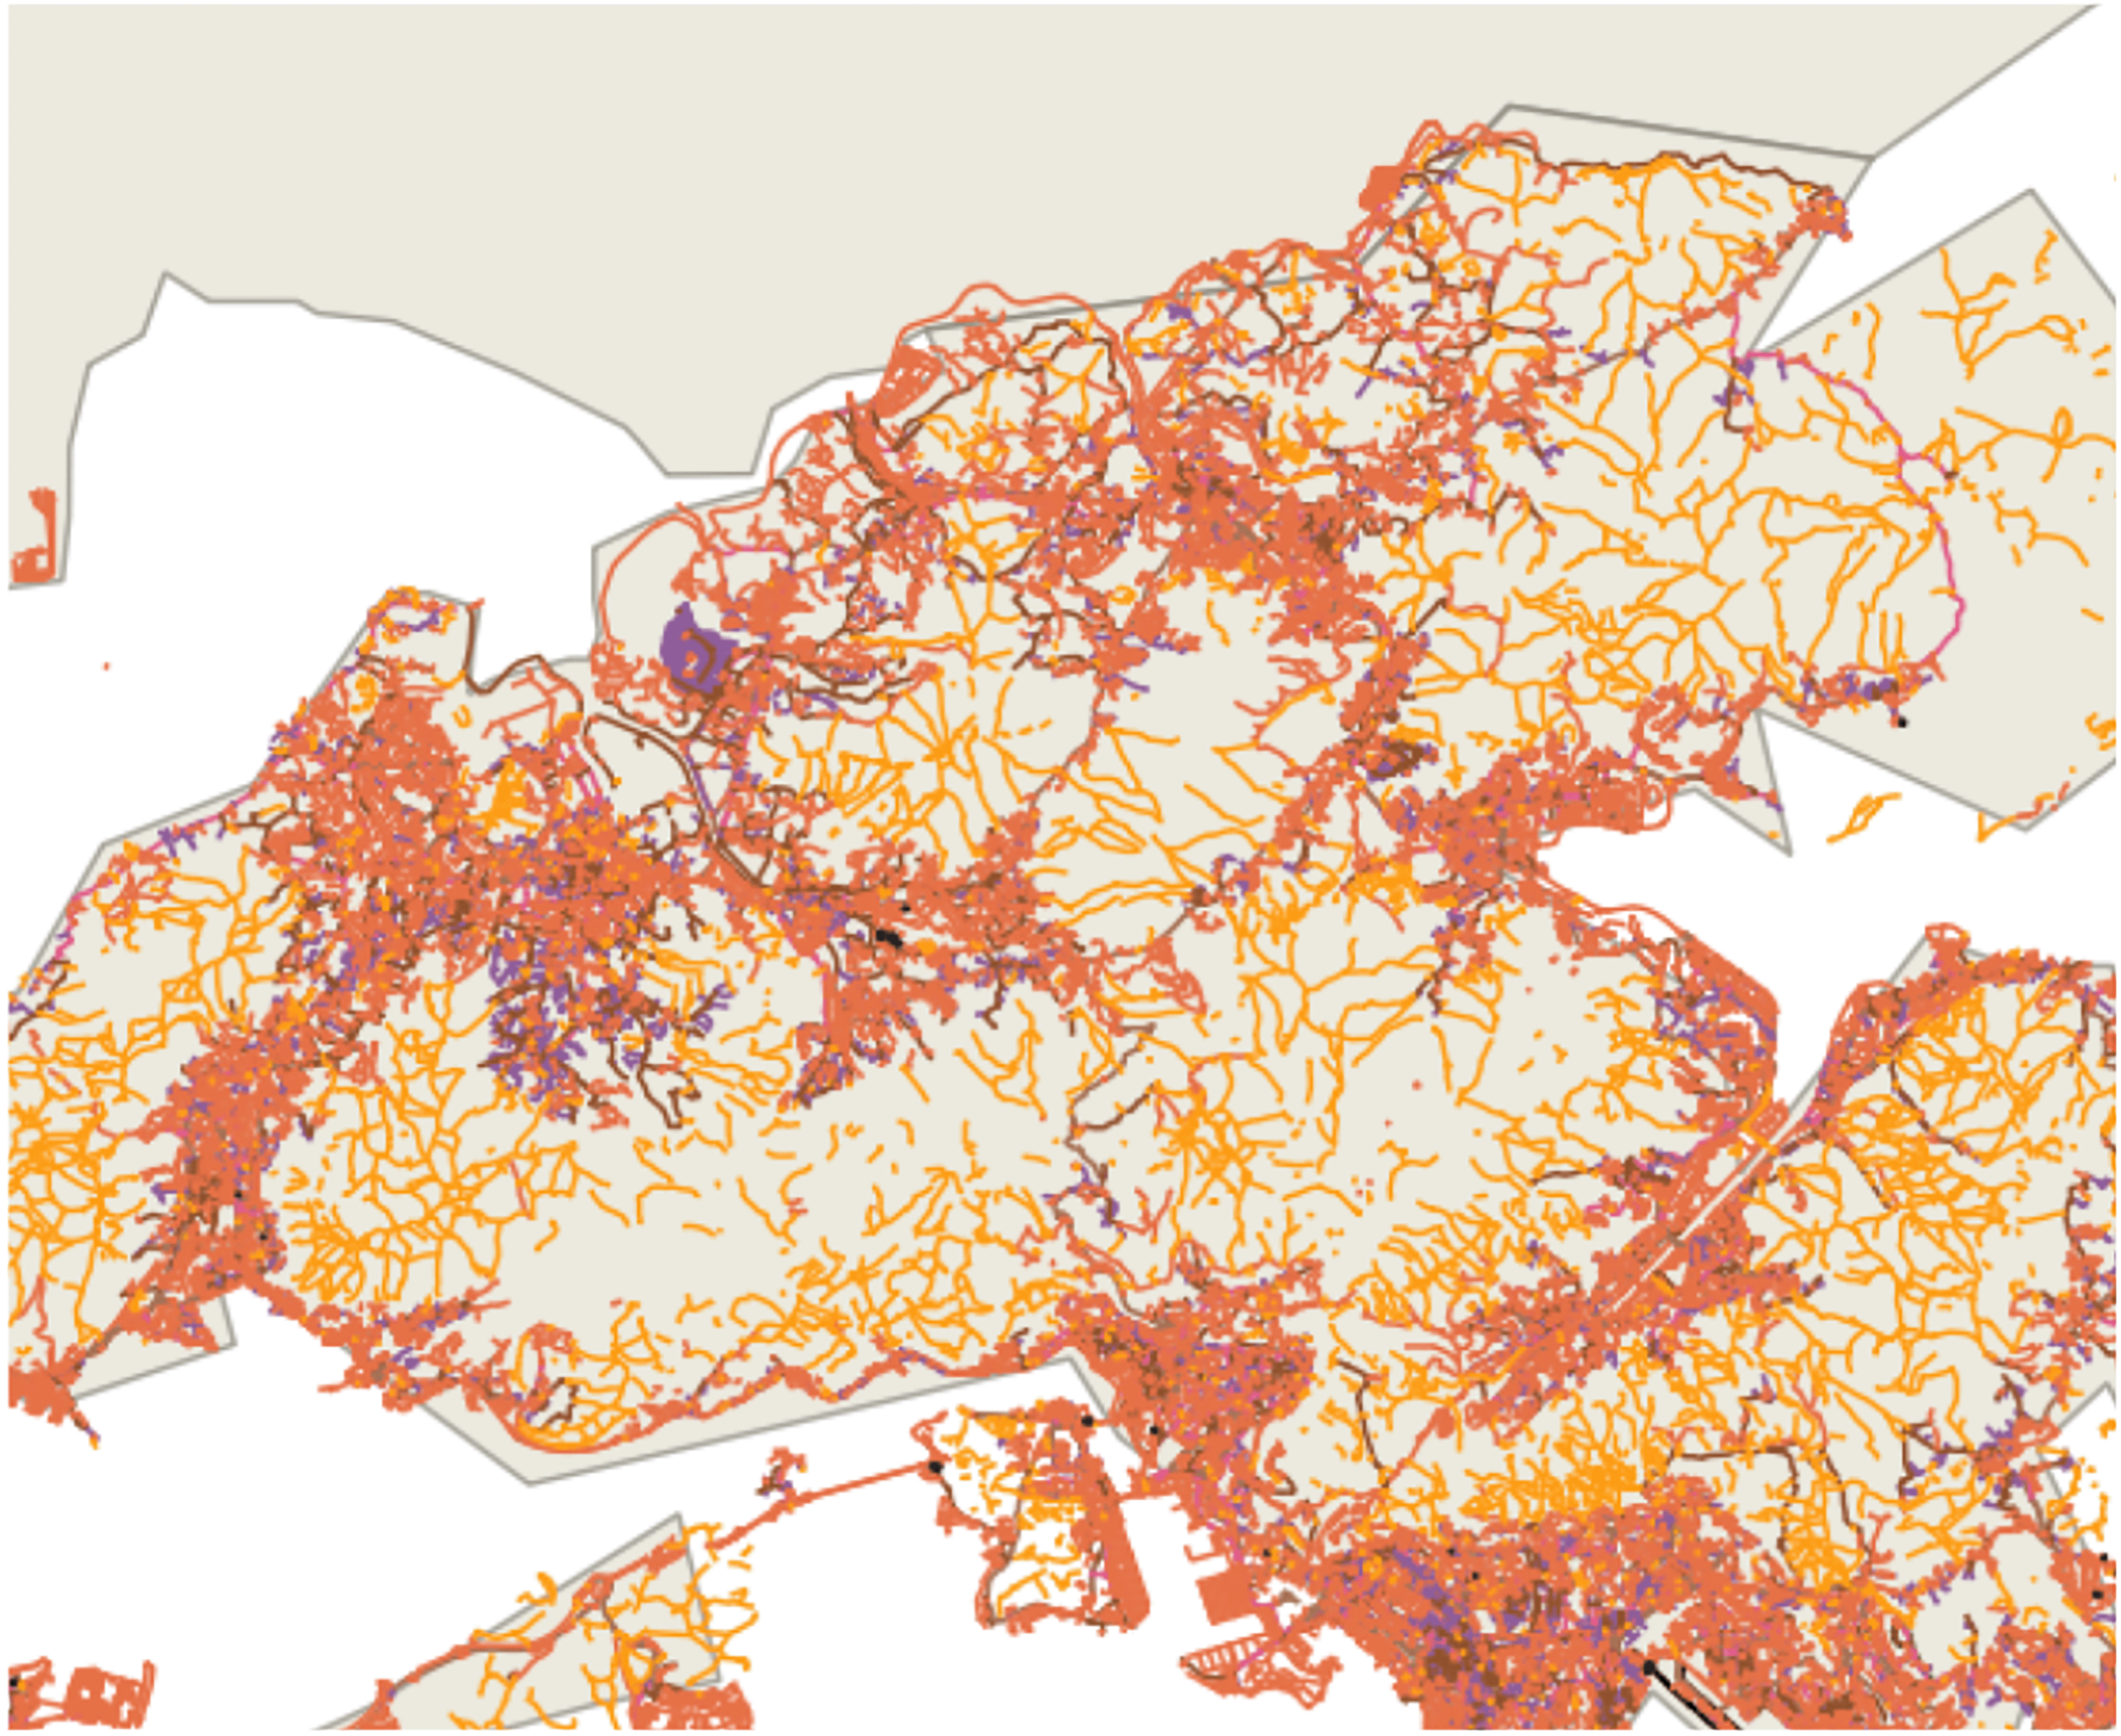
However, a key limitation of this graph and the city sample is that there was less representation of cities in central Africa, the Middle-East and South East Asia, which could affect the generalisability of the results and make it more prone to bias. This was due to the limited available information for cycleways in Africa, and the magnitude of information for megacities in South East Asia and the Middle East made it difficult to collect information on numerous cities through code. Even out of the data collected from the countries in Africa, numerous had 0% cycle percentage because the data was not able to be collected. Therefore, the percentage cycleways for Singapore and Hong Kong were collected individually using QGIS, displaying a percentage cycleway of 6.25% and 3.39%, respectively. Figure 2 and Figure 3 display the cycleways in a different color over all the highways and roads in each city.
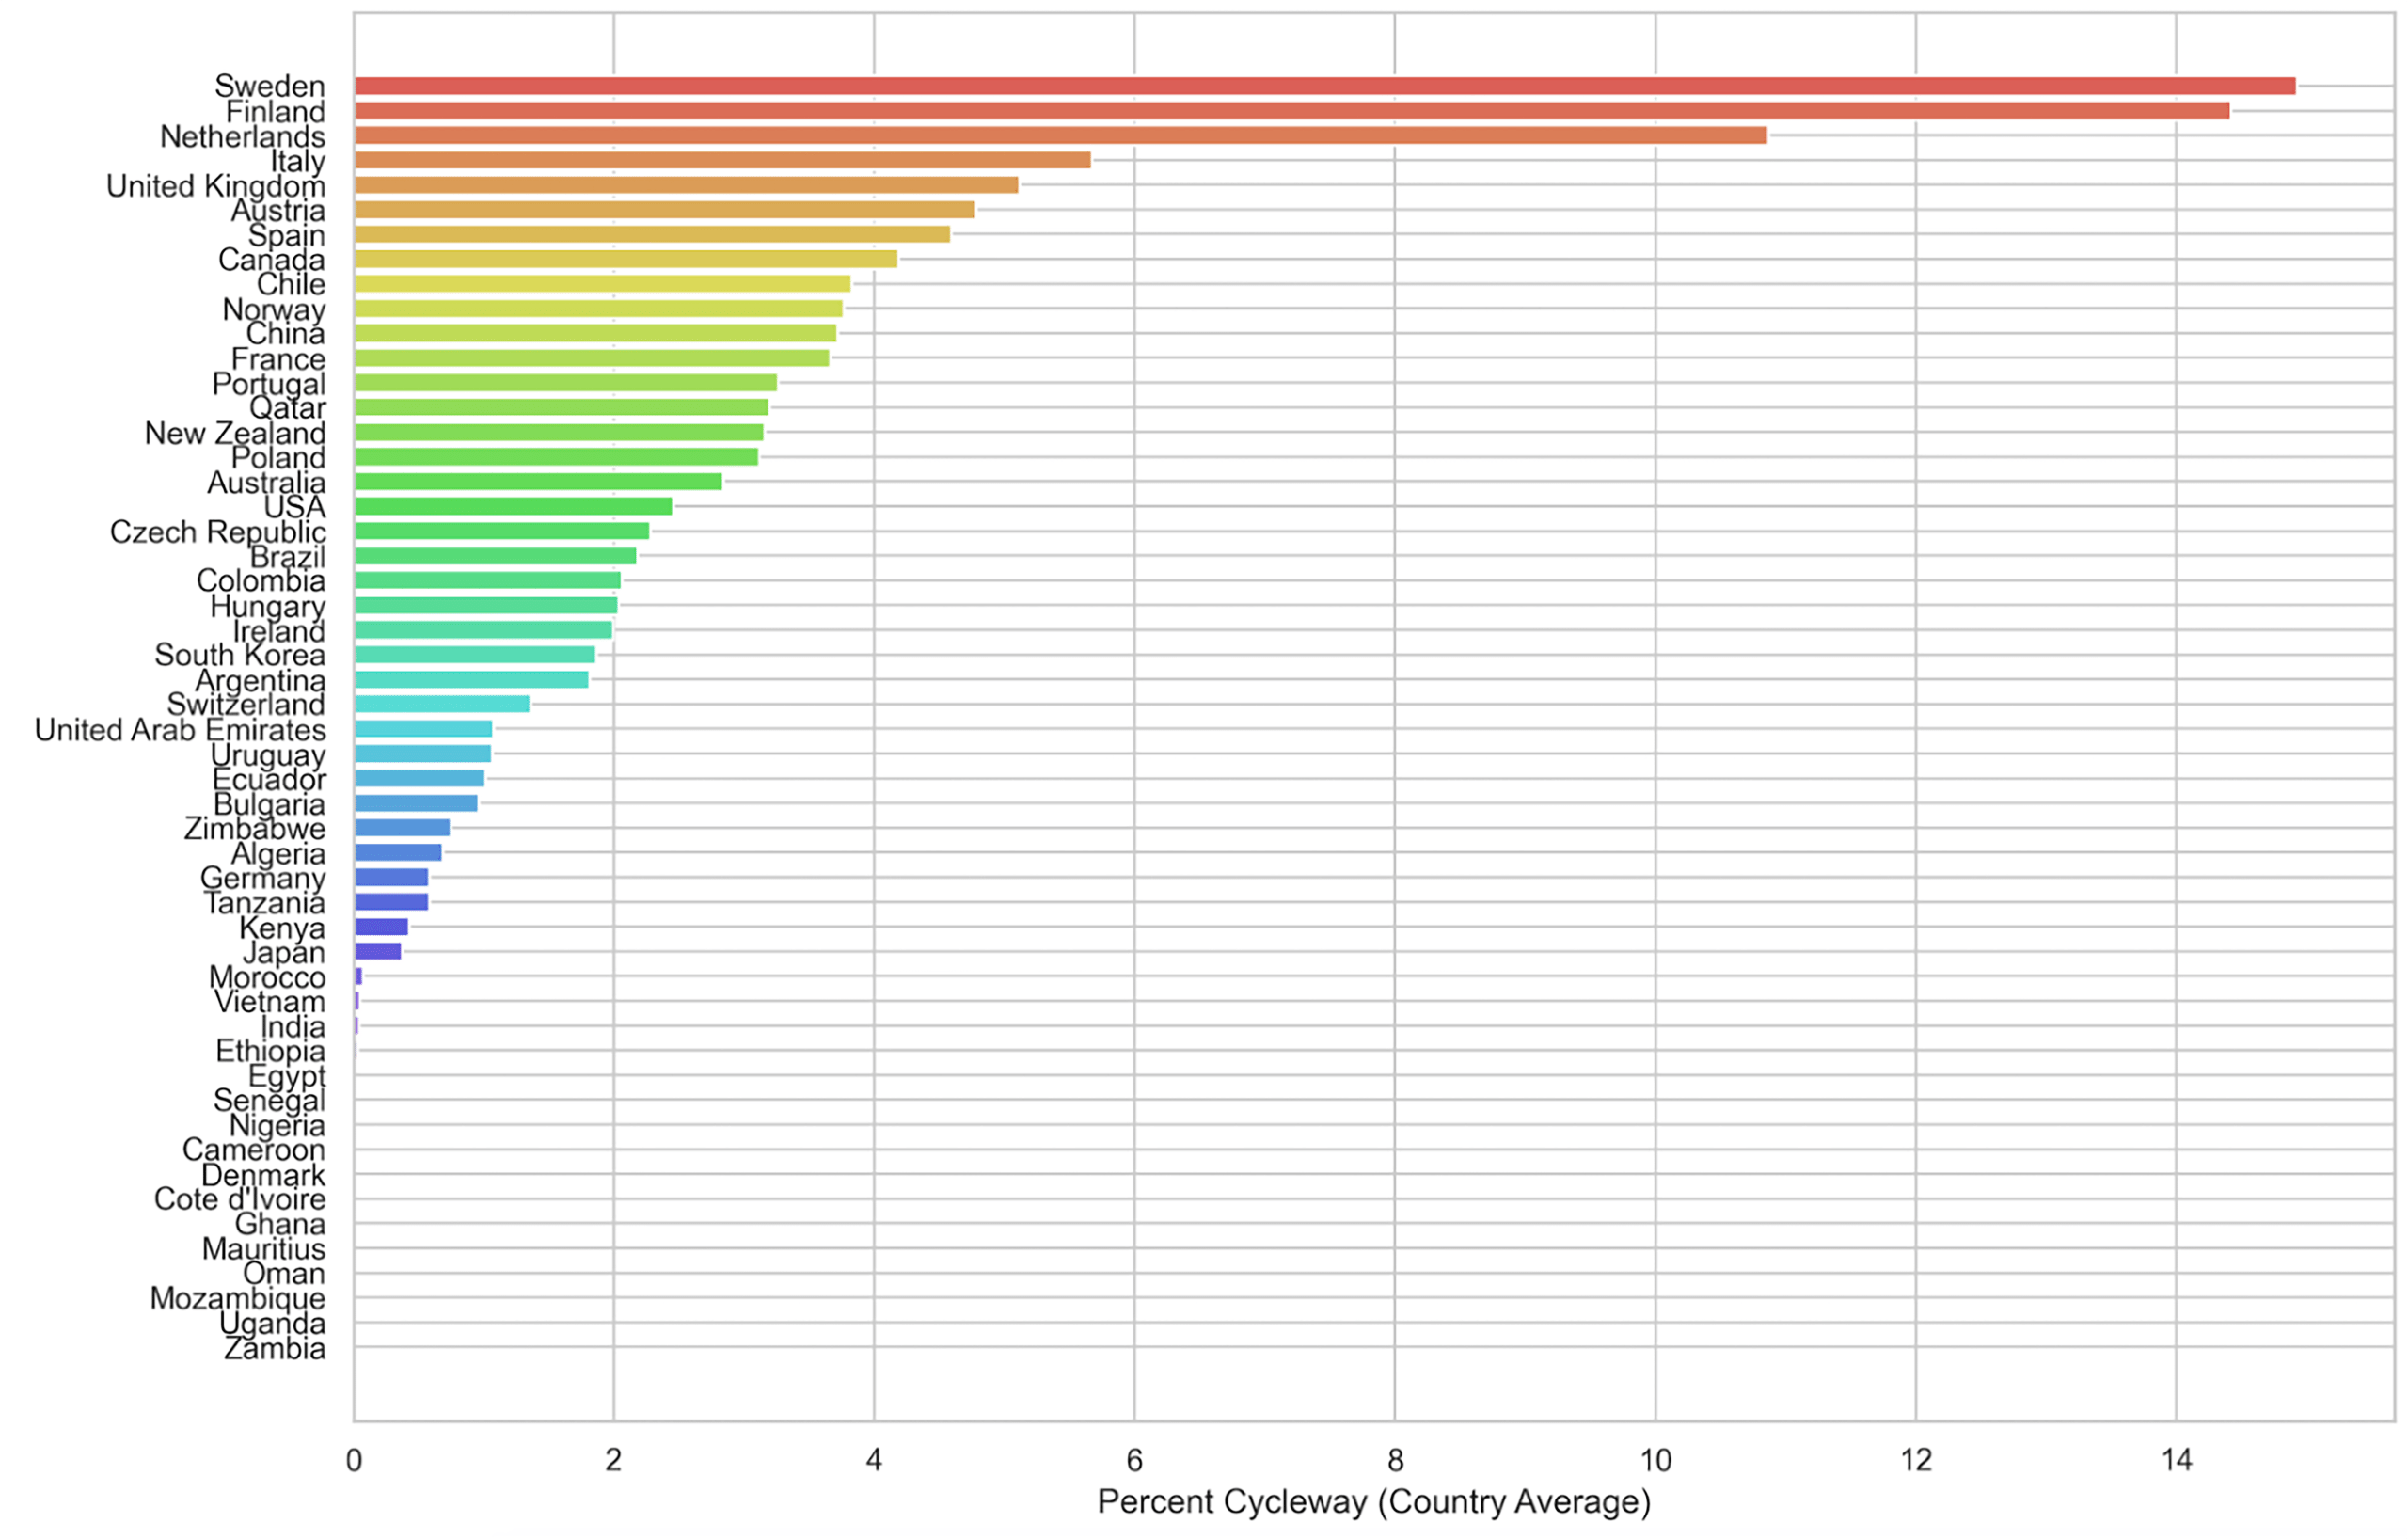
In Figure 4, the 5 countries with the highest average percentage cycleway are all in Europe which all have an average temperature between 8.26°C to 11.93°C (17 cities) with the exception of Helsinki and Oulu, Finland (7.44°C and 4.24°C, respectively) and Venice and Milan, Italy (14.97°C and 15°C, respectively). The GDP per capita also ranges between $40,226 to $68,218 USD which means that they are all developed countries with higher emphasis on bike infrastructure.
The top 12 countries with the lowest country average percent cycleway all have percent cycleways less than 0.05%, with 8 at 0%. Apart from Denmark and Mauritius, a trend is that all of the countries’ GDP per capita is less than $3400 USD, implying the necessity for money and funding. Moreover, apart from Ethiopia and Denmark, all of the countries’ average temperature is greater than 22°C, which is quite hot. However, Ethiopia’s GDP per capita is $916 and its maximum temperature is 30.2°C, likely limiting its cycle percentage.
Germany and Denmark rank unexpectedly low in Figure 4 despite their well-documented cycling cultures. The seven German cities included in this study — Cologne, Düsseldorf, Freiburg im Breisgau, Darmstadt, Kiel, Regensburg, and Potsdam — and the single Danish city (Copenhagen) are known from published literature to have substantially higher cycling infrastructure provision than our metric captures15,16,17. This discrepancy is consistent with the OSM tagging limitation described in the Discussion: our method counts only edges tagged highway=cycleway, and therefore misses on-street bike lanes — the predominant infrastructure type in both countries — which are tagged as cycleway=lane on road edges rather than as standalone features. The low rankings of Germany and Denmark should therefore be interpreted as a measurement artifact rather than a reflection of actual cycling provision.
A note on the China–India comparison: in our sample, the single Chinese city (Shenzhen) shows a higher percent cycleway than the five Indian cities (Delhi, Hyderabad, Surat, Ahmedabad, and Udaipur). This pattern is consistent with long-standing municipal investment in cycling networks in several Chinese cities — including legacy bicycle-mode share that pre-dated the rise of private cars and more recent dockless and station-based shared-bike rollouts — whereas the Indian cities sampled here face hot tropical and monsoon conditions and have less dedicated cycleway infrastructure tagged in OSM. The contrast is suggestive but should be read cautiously: the Chinese subsample is n = 1, and on-street informal cycling that is common in both countries is not captured by the highway=cycleway tag used here.
Out of the 6 countries with the lowest average percent cycleway which was greater than 0.05%, all have a hot/humid climate. Except for Japan and Morocco, all countries have a high average temperature (around 23°C). However, Japan has an extremely high total precipitation for all of its cities (ranging from 1045 to 2553 mm) which may help account for its low percentage cycleways. Morocco’s terrain is predominantly mountainous, likely resulting in lesser percentage cycleways despite its temperature.
Pearson correlations revealed that average temperature (r = −0.397, p < 0.001), minimum temperature (r = −0.299, p < 0.001), and total precipitation (r = −0.226, p = 0.010) were each significantly negatively associated with percent cycleway. Maximum temperature (r = −0.164, p = 0.063) and GDP per capita (r = +0.197, p = 0.184) did not reach statistical significance.
To assess whether the temperature association persisted after accounting for wealth and climate zone, we estimated a multivariable OLS regression with log-transformed percent cycleway as the outcome, using the 47 cities with complete GDP data. Average temperature remained a significant negative predictor (β = −0.079, p = 0.001) after controlling for GDP per capita and climate zone. GDP per capita was not independently significant (p = 0.171), likely reflecting collinearity with temperature given that wealthier nations tend to occupy temperate climates. Climate zone (Tropical vs. non-Tropical) was similarly non-significant (p = 0.369). The model explained 33% of variance in log percent cycleway (R² = 0.331, F = 7.09, p < 0.001), with normally distributed residuals (Shapiro-Wilk p = 0.52).
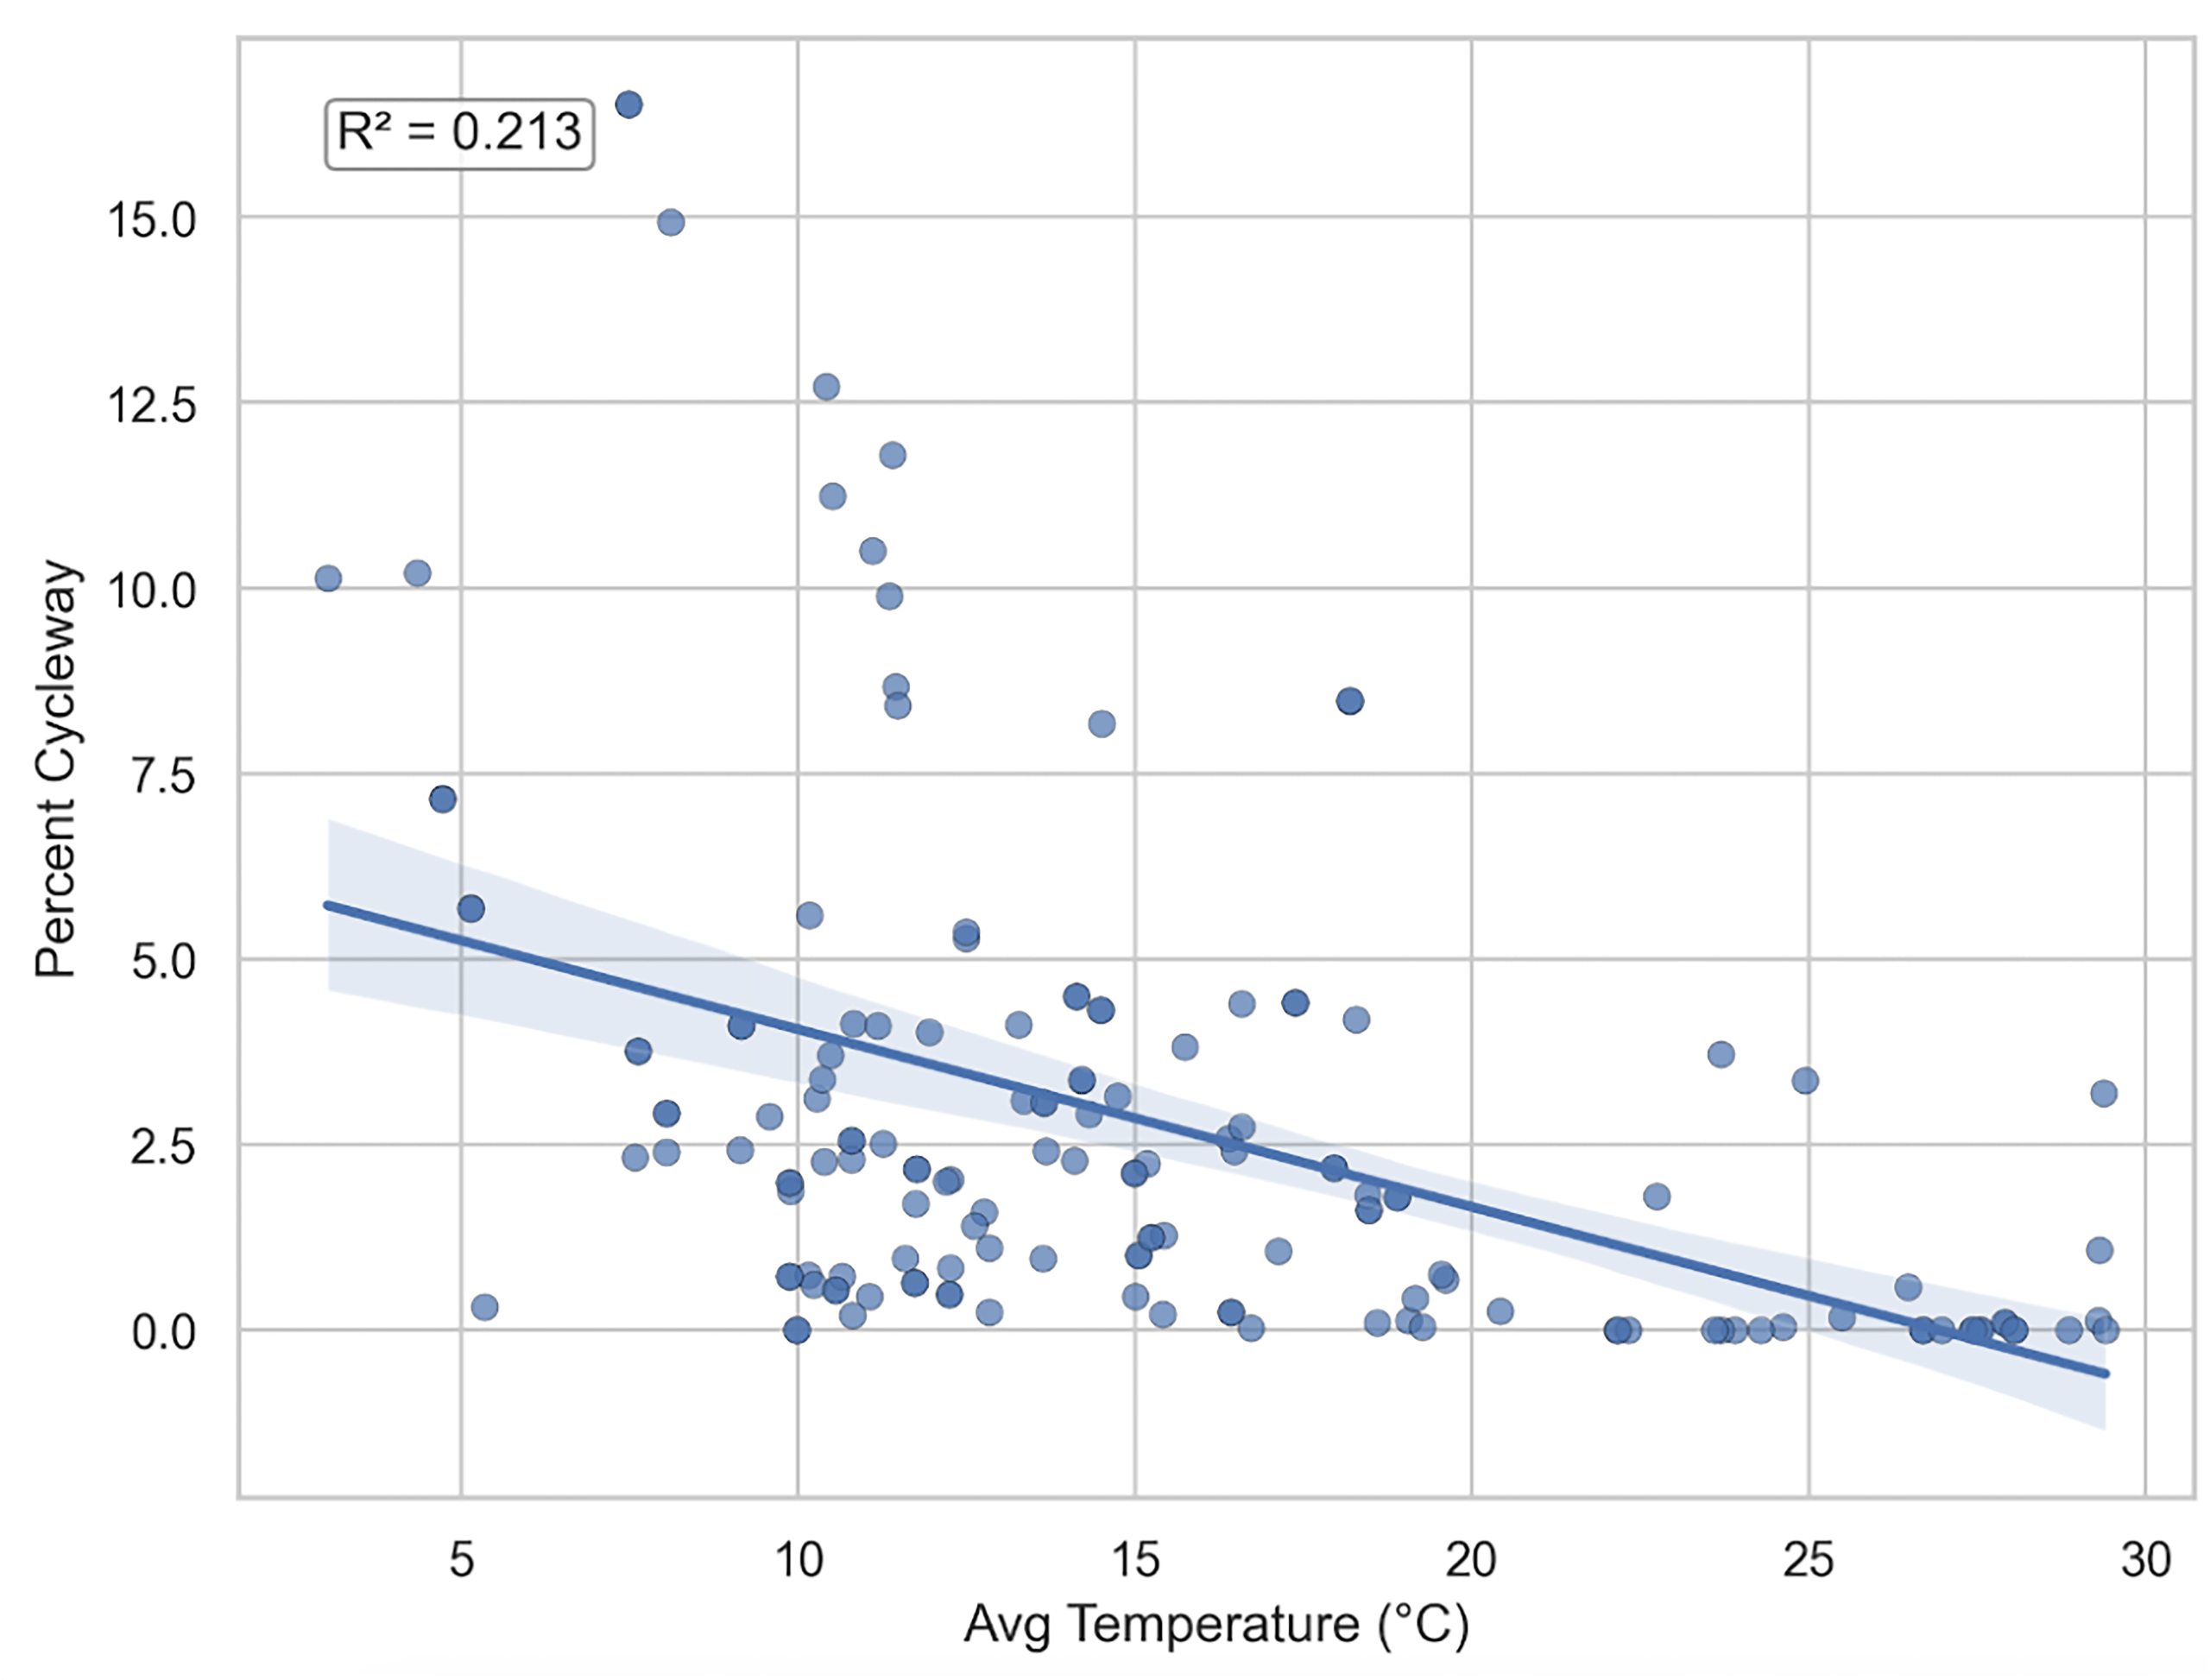
Figure 5 displays a negative linear correlation between the average temperature and percent cycleway, indicating that cooler cities generally have more cycleways. However, there are various cities with cold climates which have low percent cycleways, suggesting that other factors also influence the percent cycleway. The R² value is 0.213 which is decent to suggest a trend in a social sciences experiment, however, it emphasises the influence of various factors on cycleway percentage (such as terrain, precipitation and culture) and a non bi-directional relationship, meaning that most cities with a high percentage cycleway have low average temperatures, but not all cities with low average temperatures have a high percentage cycleway.
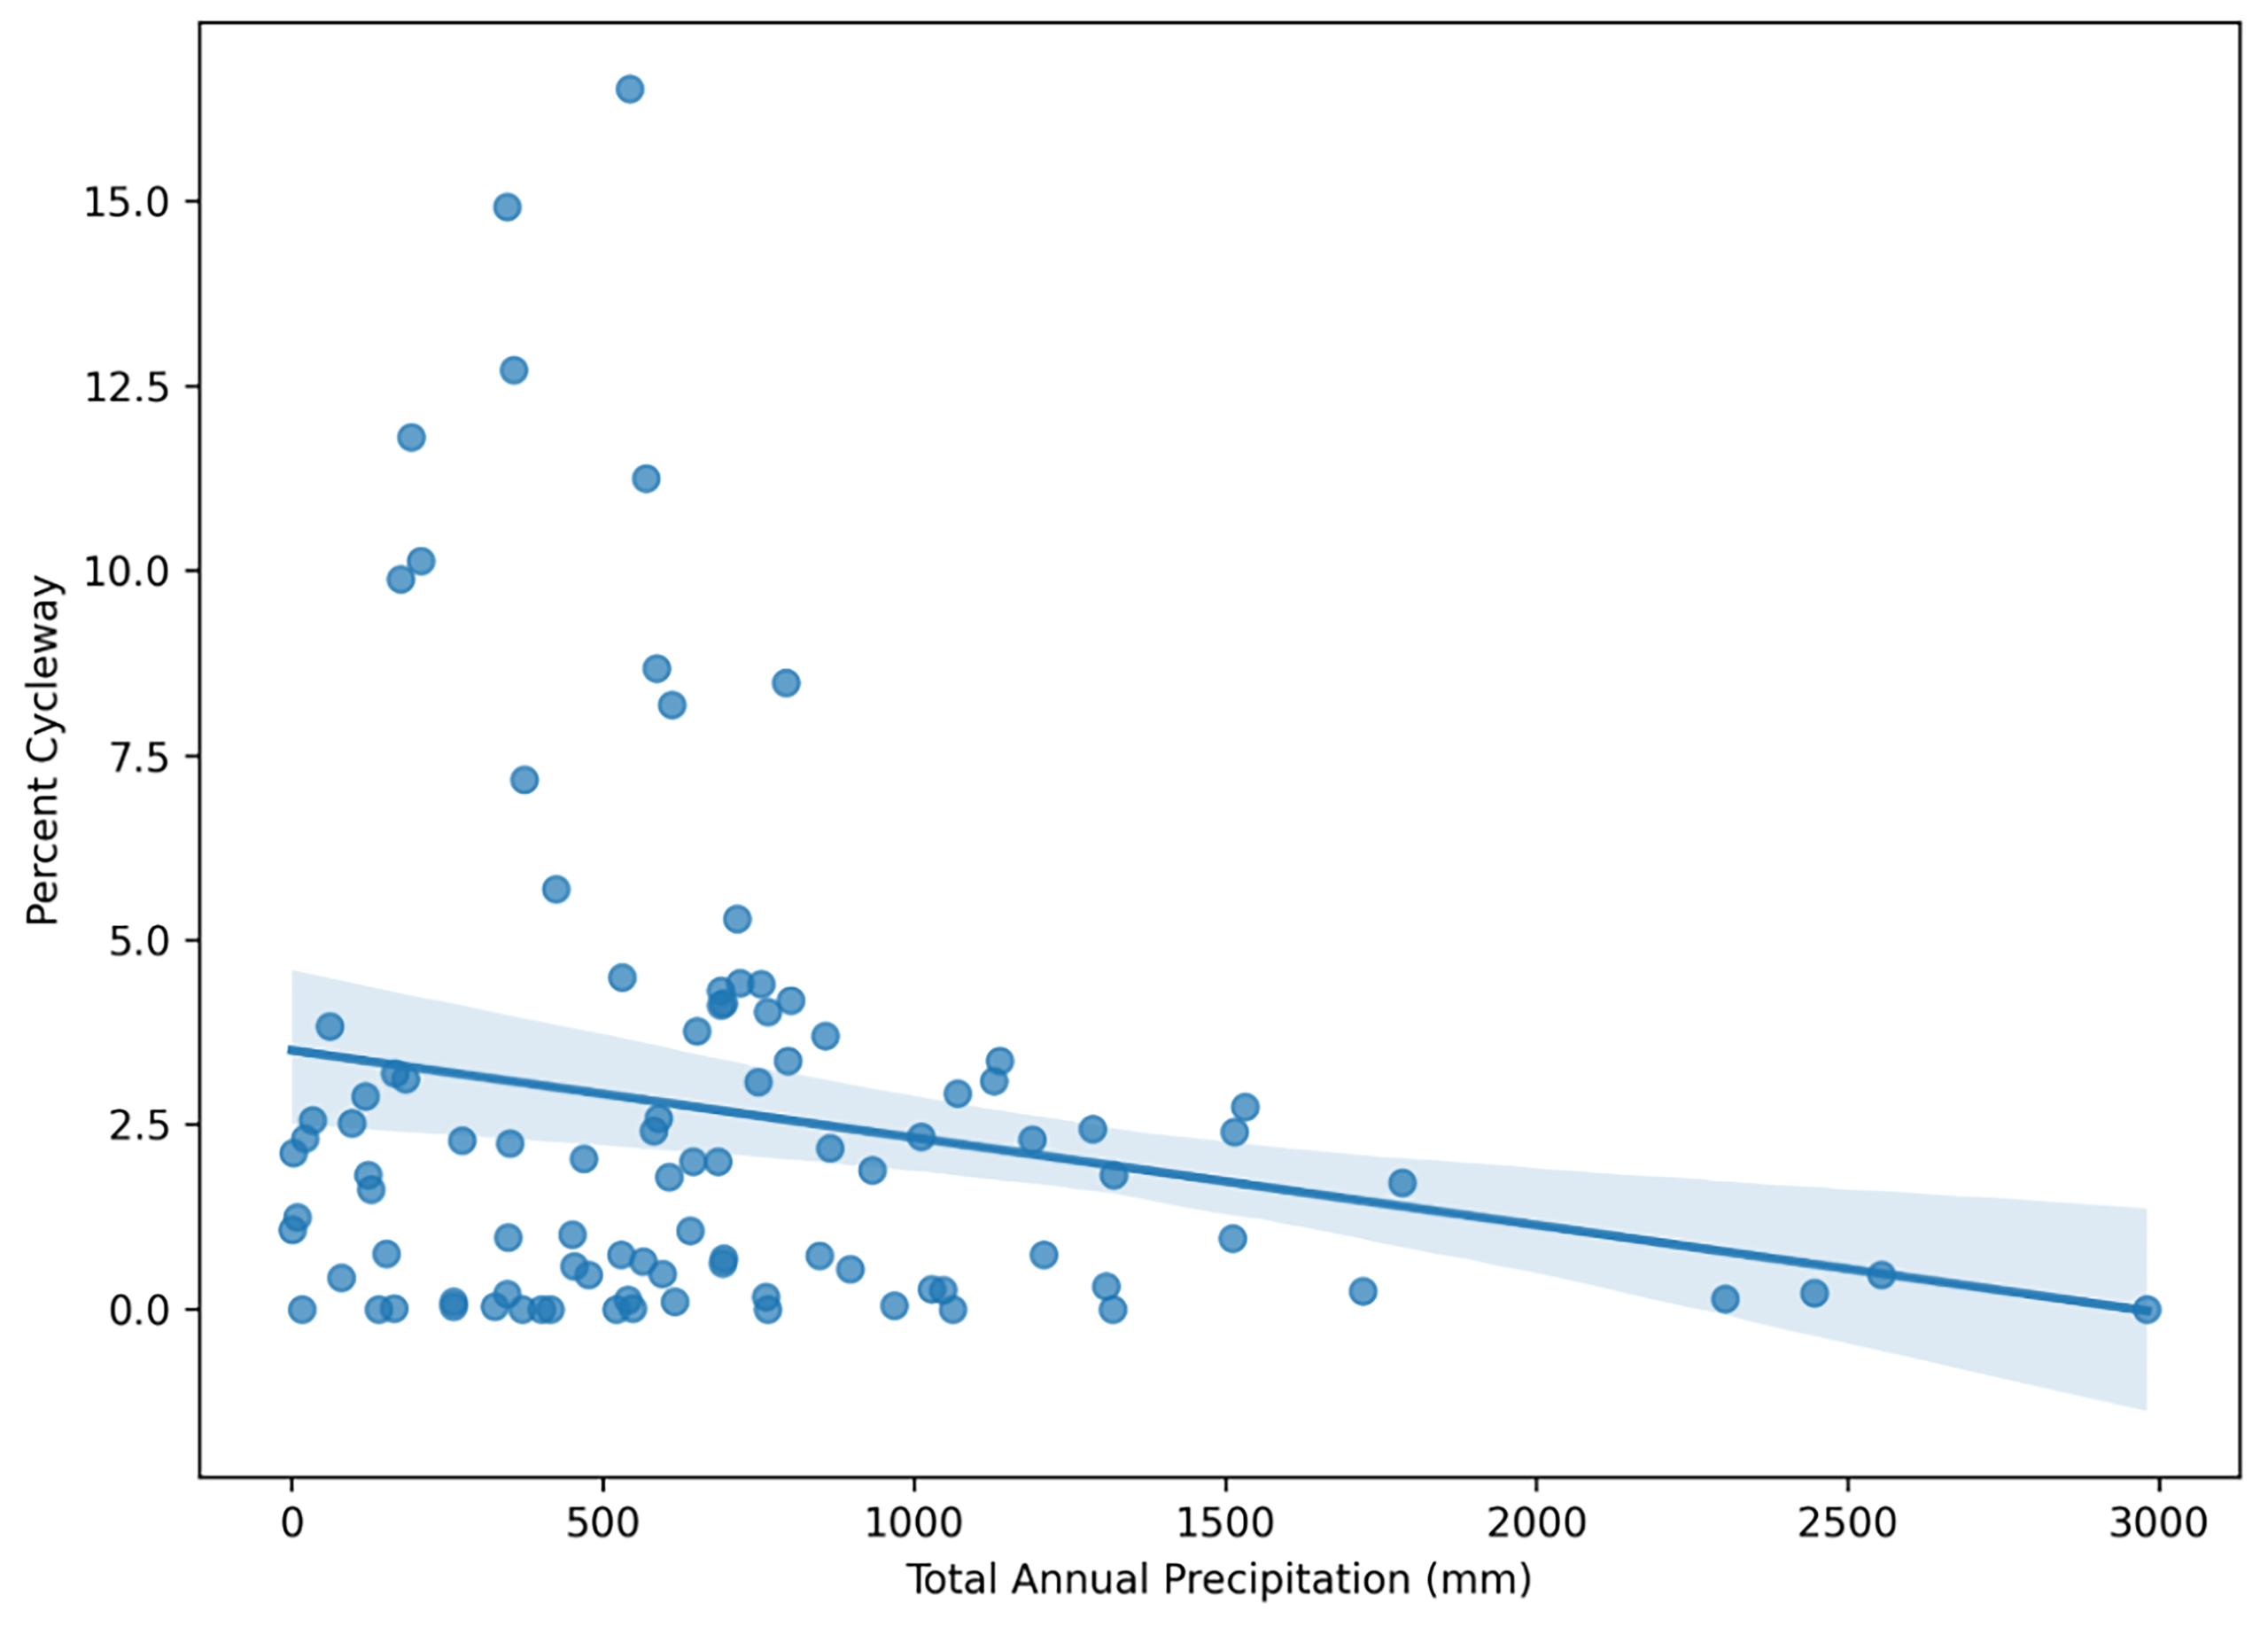
This scatterplot in Figure 6 shows the relationship between total annual precipitation (mm) and the share of roads that are bike lanes after removing erroneous 0-mm entries. Cities with zero percent cycleway are retained in this analysis, as the absence of mapped cycling infrastructure is a meaningful data point rather than an error; by contrast, cities returning zero total precipitation were excluded as clearly invalid records.
The fitted line is slightly negative, and the confidence band is wide, indicating a weak bivariate association at best. In other words, rainfall alone does not explain much of the cross-city variation in bike-lane share once obviously bad precipitation records are excluded. Several cities with moderate rainfall still cluster near zero, while a few high performers appear across a broad precipitation range, suggesting other factors dominate.
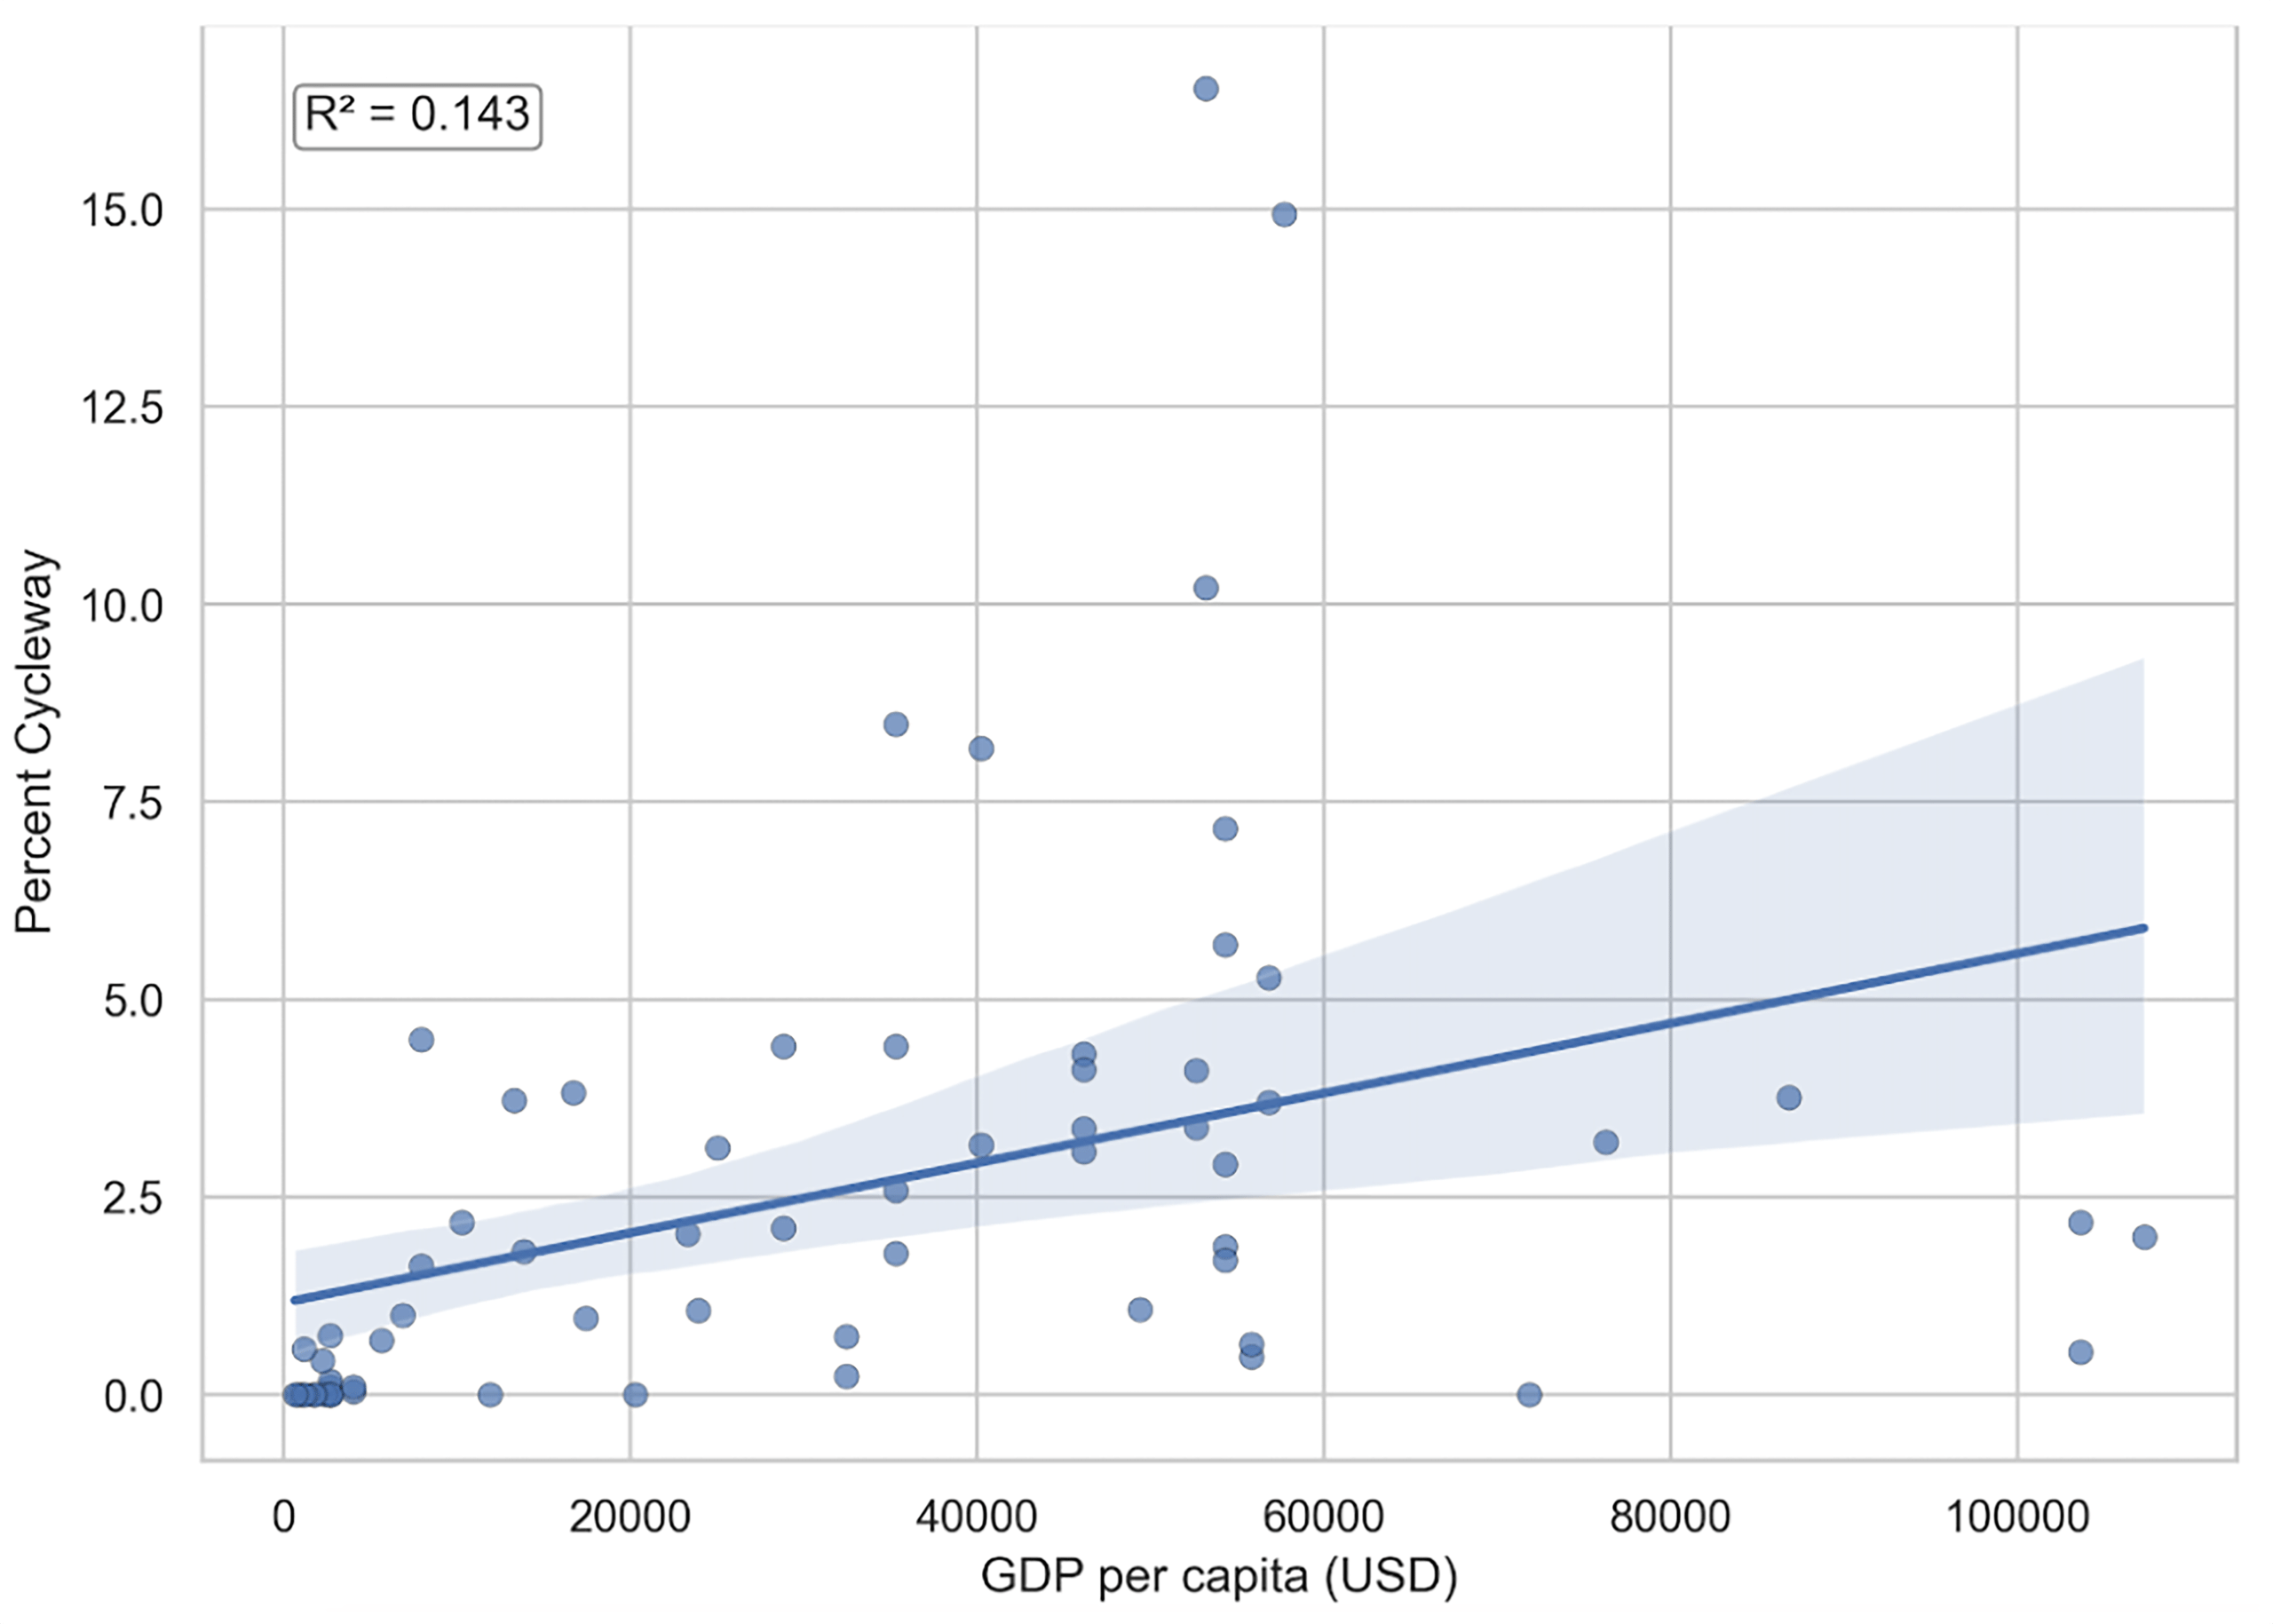
Figure 7 displays a descriptive positive trend between GDP per capita and percent cycleway. However, the Pearson correlation was not statistically significant (r = +0.197, p = 0.184), suggesting GDP alone is not a reliable predictor of cycling infrastructure across this sample. However, in developing countries, roads which are used for cycling may not be government constructed networks, which is not taken into account in this model. In Figure 8, the countries between $40000 and $60000 USD GDP per capita have the highest cycle percentage, in contrast to the few countries with GDPs per capita greater than $60000. One of these countries is Switzerland (with two cities), with a GDP per capita of $103669 USD, the second highest in the list. There are several reasons which may influence the low cycling rates in Switzerland despite its low average temperature and high GDP per capita: it has a high total precipitation, around 870mm; a mountainous terrain; and it has an extremely public transport-dependent culture due to its spread out nature. Furthermore, Ireland is the richest country out of the countries sampled, with a GDP per capita of $107316 USD. Although Ireland has lower total precipitation than the rest of the United Kingdom and a low average temperature as well (10°C), it does not invest much money into cycling infrastructure, so the minimal cycle percentage is a product of safety concerns, lack of connectivity and culture. Qatar, has a GDP per capita of $76275 USD, but has a low percentage cycleway due to its extreme heat (with an average temperature of 29.37°C) and is one of the most polluted countries in the world, emphasising its reliance on cars. Therefore, the relationship between GDP per capita and percentage cycleway is also not bi-directional, suggesting that cities with more cycle infrastructure often have higher GDPs per capita, but not all cities with high GDPs per capita have lots of cycling infrastructure, and there are cities with lower GDP per capita that have higher percent cycleways.
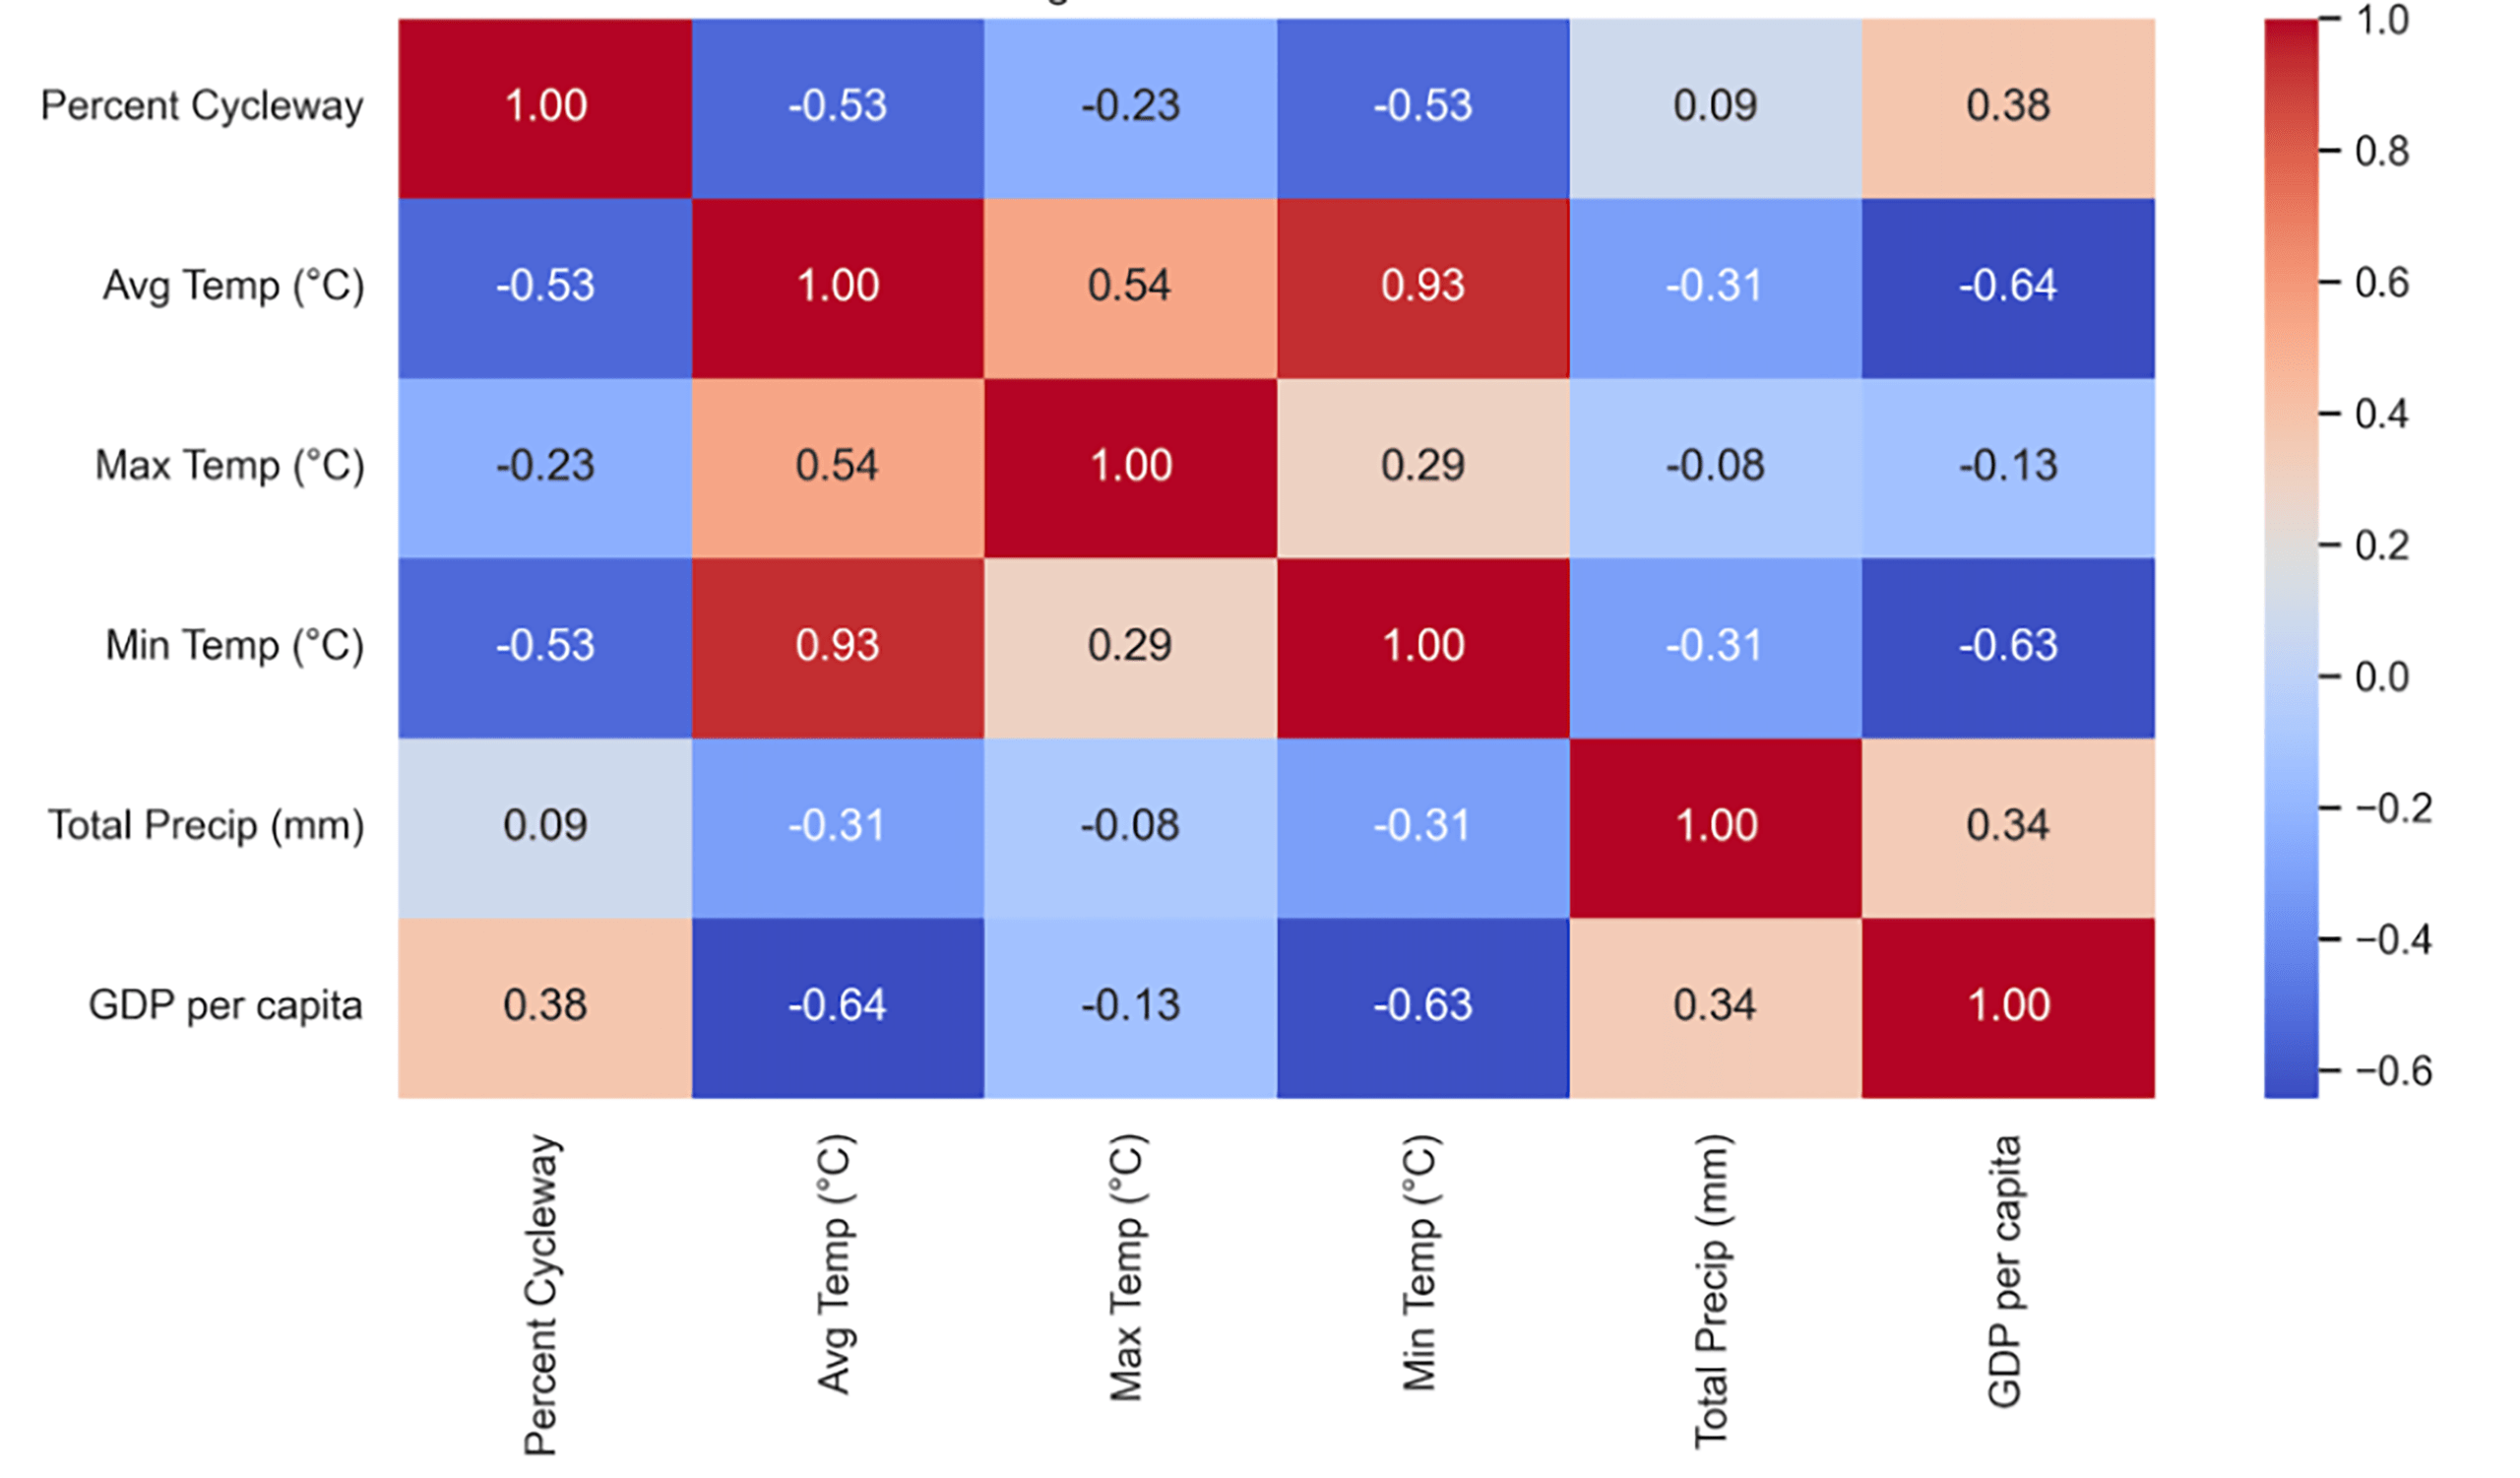
Figure 8 suggests that there is a negative correlation between average temperature and percentage cycleway and minimum temperature and percentage cycleway. There is also a weaker negative correlation with percent cycleway and maximum temperature, suggesting that cities with more cycleways tend to be cooler. Additionally, there is a moderate positive correlation between GDP per capita and percent cycleway, indicating that wealthier cities tend to have more cycleways. There is essentially no correlation between percent cycleway and total precipitation, which suggests that frequency of rainfall is not a consideration when developing cycle infrastructure.
Figure 8 supports Figures 5, 6, and 7 as it highlights that there is no bidirectional relation between percentage cycleway and any of the factors, and none are perfectly predictive, but certain common traits among cities with higher percentage cycleway: cycle culture, high GDP per capita, lower average temperature, and flat terrain.
Predictably, there is an extremely strong correlation between minimum temperature and average temperature as they measure similar metrics. There is also a slight positive correlation between total precipitation and GDP per capita, suggesting that cities with lower total precipitation tend to be wealthier. Another pattern is the strong negative correlation between GDP per capita and average temperature, which could also be a reason why both are more likely to have higher cycleway percentages.
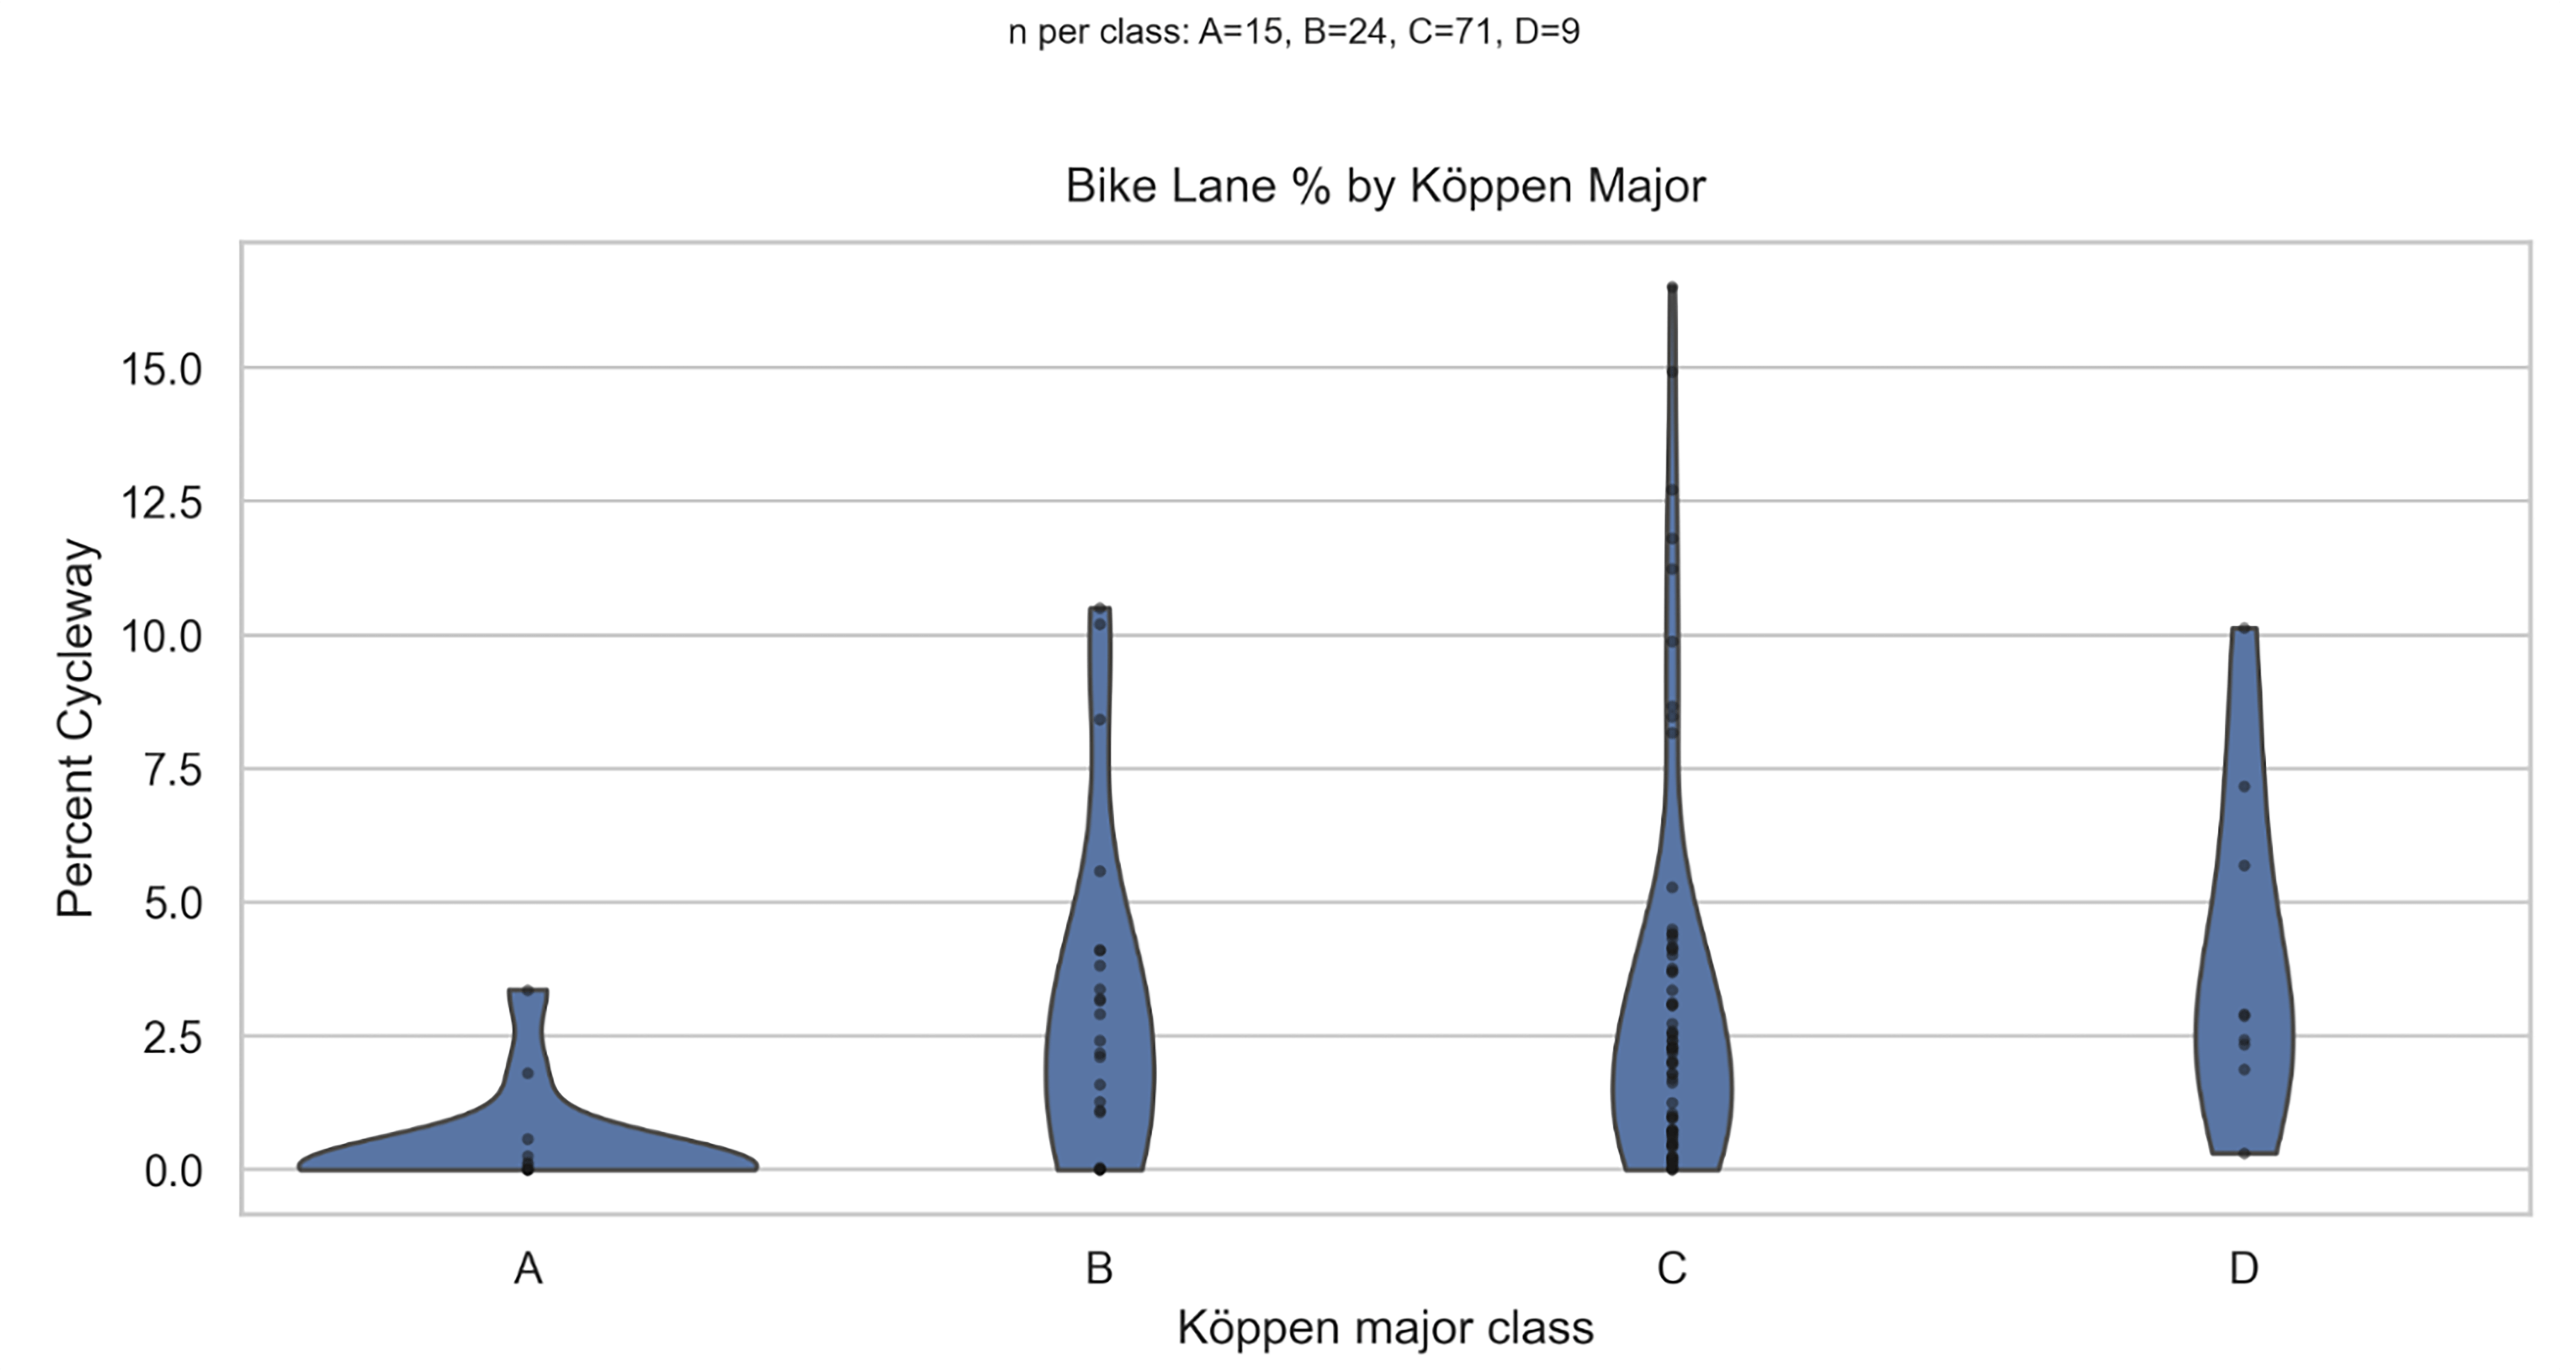
Distributions of Percent Cycleway differ visibly by climate class. Temperate (C) cities exhibit the widest spread and contain most of the high-share outliers (upper tail). Tropical (A) cities are tightly compressed near zero, with only a few moderate values. Arid (B) cities center low-to-moderate with a thinner positive tail than C. Continental (D) shows a somewhat higher central tendency than A/B but with fewer extreme outliers than C. Sample sizes are unbalanced (e.g., C substantially larger than A and D), so differences should be read as distributional tendencies rather than strict rank ordering. Overall, climate class helps organize the data, yet it is not deterministic: many cities in warmer or drier classes still cluster near zero, while a subset of temperate cities achieve markedly higher shares.
Discussion
As displayed in Figure 5, a trend is evident as all cities with percentage cycleways above 5%, except 1, have an average temperature less than 15°C, while a lot of cities with average temperatures less than 15°C are also below 5% percentage cycleway. Also, there are several points which are on the 0.0 percent cycleway line, which suggests some limitations in collecting information from OSMs and APIs since many developing countries often have roads which are used for cycling, but are not documented.
There exist a number of limitations that apply to this research. For example, we only sampled 119 cities out of all the cities in the world. We had limited data from Africa and the Middle East, and Europe is slightly overrepresented. This may bias the results. As an example, added diversity in the African cities (which are often tropical, have poor cycling infrastructure due to economic factors) could have reinforced the observed association between climate and infrastructure – or not, in case they have other trends. The further investigations are to be extended to a more balanced sample on the global basis to broaden the applicability of the results.
We have used Open Street Map data on infrastructure measures. Though OSM coverage is very high in most areas, previous research suggests that OSM road data can be over 80 percent complete in most areas18,19, but is incomplete or erratic in other cities. Some cities (particularly in developing nations) may have a few unmapable informal bike lanes, or vice versa, there may be some mapped cycleways, which are recreational routes not practical as commuting routes. We also assumed the accuracy of OSM data to be good enough to make relative comparisons, but any true mapping biases might be significant. To take an example, when the cycleways in some countries are under-mapped, the such cities will be artificially low in our data. This should be a point of caution and it could be enhanced by cross-checking of OSM data against local sources. Future work could cross-validate our OSM-derived cycling extent against alternative sources such as the Google Environmental Insights Explorer, which integrates routing and infrastructure data from independent imagery and mapping streams.
Further, percent cycleway does not take into consideration the quality, connectivity and safety of the bike lanes. A city may have a few long and great bike paths that add some reasonable length together, yet which are all dispersed in parks (so useless as means to commute). A different city can have numerous short and covered lanes built into street grid which may affect the ridership more significantly though the total length may be shorter. Furthermore, our metric is length of road network – some cities may have a big percentage even though they may have a high number of bike lanes within the urban core, but because of the size of these cities (i.e. lots of space) or due to the amount of suburbs. Percent cycleway should then be viewed with caution and future work possibly adopt new measures (such as a connectivity index or a bike lane density per land area).
Climate is not the only factor. We also failed to explicitly capture and consider topography which can significantly influence cycling; in fact a city with a huge hilly terrain may have a low rate of cycling uptake despite a favorable climate. As an illustration, San Francisco has a temperate climate yet hilly terrain that is a challenge and the rate of cycling is moderate. Economic factors were also mentioned very casually and we did not cover such variables as population density, traffic threat, gasoline prices, or cycling policy rating. All of that may be associated with differences in the quantity of the cycling infrastructure that a city develops and the extent to which it is utilized20,21. Probably in the case where such factors are taken into consideration, the observed association with climate may be reduced. An extension of the current study to include more multivariate analysis would be a logical step to take, but such would entail greater data gathering.
Importantly, this research is correlational. It cannot be conclusively stated that climate predisposes a city to have more or fewer bike lanes. Infrastructure decisions include policy decisions which may be associated with climate, but which are not defined by climate. Indicatively, European cities or North American cities are in a cool climate and have access to some urban planning philosophy and wealth, and many of the warmer cities are in nations that prioritize other things or do not have the wealth. In this way, climate may be serving as a proxy of these underlying differences. Causal claims are to be taken at a slow pace. We propose that climate is one of the factors to be considered, but by no means the single indicator of the cycling infrastructure investment. GDP per capita data were available for only 47 of 119 cities, limiting the multivariable model to this subset. Future work should compile city-level economic indicators to enable a fully powered multivariate analysis across the complete sample. Specifically, the highway=cycleway tag used in this study captures dedicated off-road cycle paths but excludes on-street bike lanes typically tagged as cycleway=lane or cycleway=track on road edges. This likely causes systematic undercounting of cycling provision in cities where infrastructure is predominantly on-street (common in North America and Asia), and may partially explain anomalous results such as the low rankings of Germany and Denmark, where on-street lanes are widespread.
Within these constraints, our findings do suggest a pattern: climate should be considered (but not overestimated) in urban cycling planning. City officials in hot climates often face public skepticism about cycling (“it’s too hot to bike here”), which can become a self-fulfilling prophecy if it leads to inaction on building bike lanes. Our results show that many hot-climate cities currently have very low cycling infrastructure, which may be associated with that mindset. However, as noted, there are policy remedies – providing cooling features on bike routes (shade trees, drinking water fountains, misting stations, etc.), promoting electric bikes to reduce the physical strain of cycling, and encouraging commuting during cooler hours (early morning or evening) may help alleviate heat issues for cyclists22. Planners in these cities may need to invest more creatively to overcome climate barriers, but successful examples show it’s not impossible. Conversely, cities in cooler climates shouldn’t be complacent: a pleasant climate alone doesn’t guarantee high cycling rates (e.g., some U.S. cities with excellent weather still have low cycling due to car-centric design)23.
In the context of global climate change, an interesting consideration is how shifting climates might influence cycling. As average temperatures rise, some traditionally cold cities could find more of the year comfortable for cycling, potentially boosting bike activity – but at the same time, extremely hot days will become more frequent in already-warm cities, possibly hindering cycling unless adaptive measures are taken22. This underlines the importance of building resilient cycling infrastructure now (using heat-resistant paving materials, planting shade trees along bike lanes, ensuring snow removal in winter, etc.) to sustain cycling as a viable mode in different climates in the future.
In summary, our study finds a notable climate-correlated pattern in global cycling infrastructure development: temperate cities currently lead in cycleway provision. Yet, this pattern is not destiny. Other factors – such as wealth, urban policy, and cultural priorities – are deeply intertwined with climate. Successful cycling cities tend to leverage strong pro-cycling policies (e.g., extensive protected lanes, traffic calming measures, education and promotion) to foster cycling irrespective of weather. As prior research has pointed out, even in less-than-ideal weather, people will cycle if the infrastructure and support are in place15,24,25. Therefore, while urban climate may be associated with differences in the ease or popularity of cycling, it should not be viewed as a strict barrier. Policymakers should focus on the controllable factors (infrastructure investment, safety improvements, incentives for cycling) to promote cycling, and consider climate as just one factor in planning – for example, designing climate-appropriate cycling facilities – rather than an excuse to avoid action.
Future research could build on this work by incorporating more variables and exploring causation more directly. For example, studies could examine case-study cities that defy the typical climate trend (a very hot city with high cycling rates, or a cold city with low cycling) to identify what specific policies or cultural factors make the difference26. Such insights would be valuable for crafting strategies to promote cycling in any climate.
Supplementary Material
References
- Fishman E., Schepers P., Kamphuis C. B. M. Dutch Cycling: Quantifying the Health and Related Economic Benefits. American Journal of Public Health, 105, e13–e15 (2015). [↩]
- Celis-Morales C. A., Lyall D. M., Welsh P., Anderson J., Steell L., Guo Y., Maldonado R., Mackay D. F., Pell J. P., Sattar N., Gill J. M. R. Association between active commuting and incident cardiovascular disease, cancer, and mortality: prospective cohort study. BMJ, 357, j1456 (2017). [↩]
- Ahmed F., Rose G., Jacob C. Impact of weather on commuter cyclist behaviour and implications for climate change adaptation. Proceedings of the 33rd Australasian Transport Research Forum, (2010). [↩]
- Thomas T., Jaarsma C. F., Tutert B. Exploring temporal fluctuations of daily cycling demand on Dutch cycle paths: the influence of weather on cycling. Transportation, 40, 1–22 (2013). [↩]
- Khattak A. J., de Palma A. The impact of adverse weather conditions on the propensity to change travel decisions: a survey of Brussels commuters. Transportation Research Part A, 31, 181–203 (1997). [↩]
- Nankervis M. The effect of weather and climate on bicycle commuting. Transportation Research Part A, 33, 417–431 (1999). [↩] [↩]
- Guo Z., Wilson N., Rahbee A. Impact of weather on transit ridership in Chicago, Illinois. Transportation Research Record, 2034, 3–10 (2007). [↩]
- Reggiani G., Verma T., Daamen W., Hoogendoorn S. A multi-city study on structural characteristics of bicycle networks. Environment and Planning B, 50, 2017–2037 (2023). [↩]
- Buehler R., Pucher J. Cycling to work in 90 large American cities: new evidence on the role of bike paths and lanes. Transportation, 39, 409–432 (2012). [↩]
- Schoner J. E., Levinson D. M. The missing link: bicycle infrastructure networks and ridership in 74 US cities. Transportation, 41, 1187–1204 (2014). [↩]
- Wadud Z. Cycling in a changed climate. Journal of Transport Geography, 35, 12–20 (2014). [↩] [↩]
- Xiao C. S., Sharp S. J., van Sluijs E. M. F., Ogilvie D., Panter J. Impacts of new cycle infrastructure on cycling levels in two French cities: an interrupted time series analysis. International Journal of Behavioral Nutrition and Physical Activity, 19, 77 (2022). [↩]
- Chen D., Chen H. W. Using the Köppen classification to quantify climate variation and change: an example for 1901–2010. Environmental Development, 6, 69–79 (2013). [↩]
- Cervero R., Sarmiento O. L., Jacoby E., Gomez L. F., Neiman A. Influences of built environments on walking and cycling: lessons from Bogotá. International Journal of Sustainable Transportation, 3, 203–226 (2009). [↩]
- Pucher J., Buehler R. Why Canadians cycle more than Americans: a comparative analysis of bicycling trends and policies. Transport Policy, 13, 265–279 (2006). [↩] [↩]
- Buehler R. Determinants of transport mode choice: a comparison of Germany and the USA. Journal of Transport Geography, 19, 644–657 (2011). [↩]
- Goetzke F., Rave T. Bicycle use in Germany: explaining differences between municipalities with social network effects. Urban Studies, 48, 427–437 (2011). [↩]
- Barrington-Leigh C., Millard-Ball A. The world’s user-generated road map is more than 80% complete. PLOS ONE, 12, e0180698 (2017). [↩]
- Haklay M. How good is volunteered geographical information? A comparative study of OpenStreetMap and Ordnance Survey datasets. Environment and Planning B, 37, 682–703 (2010). [↩]
- Parkin J., Wardman M., Page M. Estimation of the determinants of bicycle mode share for the journey to work using census data. Transportation, 35, 93–109 (2008). [↩]
- Buehler R. Determinants of bicycle commuting in the Washington, DC region. Transportation Research Part D, 17, 525–531 (2012). [↩]
- Spencer P., Watts R., Vivanco L., Flynn B. The effect of environmental factors on bicycle commuters in Vermont: influences of a northern climate. Journal of Transport Geography, 31, 11–17 (2013). [↩] [↩]
- Marshall W. E., Garrick N. W. Effect of street network design on walking and biking. Transportation Research Record, 2198, 103–115 (2010). [↩]
- Winters M., Friesen M. C., Koehoorn M., Teschke K. Utilitarian bicycling: a multilevel analysis of climate and personal influences. American Journal of Preventive Medicine, 32, 52–58 (2007). [↩]
- Heinen E., Maat K., van Wee B. The role of attitudes toward characteristics of bicycle commuting on the choice to cycle to work over various distances. Transportation Research Part D, 16, 102–109 (2011). [↩]
- Marqués R., Hernández-Herrador V., Calvo-Salazar M., García-Cebrián J. A. How infrastructure can promote cycling in cities: lessons from Seville. Research in Transportation Economics, 53, 31–44 (2015). [↩]