Abstract
Introduction: Diabetes and obesity are public health concerns influenced by socioenvironmental conditions. This ecological, cross-sectional study examined estimated diabetes-obesity burden across census tracts in the ten-county Greater Houston area, using a continuous combined diabetes-obesity score and its relationship with social vulnerability and United States Department of Agriculture (USDA) income-and-access indicators.
Methods: Public tract-level diabetes and obesity prevalence estimates, Social Vulnerability Index (SVI) percentiles, and USDA income-and-access indicators were harmonized to 2010 census tracts using area-weighted crosswalks. Diabetes and obesity z-scores were averaged into a continuous combined score. Analyses included rank correlation, blocked permutation testing of high-burden overlap, multivariable models with county controls, county-clustered standard errors, a neighbor-average spatial-lag covariate, and spatial clustering using Moran’s I and Getis-Ord Gi*.
Results: Among 1,069 analyzed tracts, diabetes and obesity prevalence estimates were strongly related (Spearman ρ = 0.857). The combined score increased across SVI quartiles and correlated strongly with SVI (ρ = 0.882). In multivariable models, SVI and the neighbor-average spatial-lag covariate had the largest positive coefficients for the combined score, while low-access status had the smallest USDA coefficient. The combined score was spatially clustered (Moran’s I = 0.719). At the 80th-percentile, the high diabetes-obesity overlap included 163 tracts versus 43.4 expected under independence (enrichment ratio = 3.75; Jaccard overlap = 0.61; blocked permutation P < .001).
Conclusion: Combined diabetes-obesity burden aligned with social vulnerability, low-income status, and spatial clustering across Greater Houston tracts. These tract-level patterns identify candidate areas for local review, validation, and planning discussion, but not individual-level or causal conclusions.
Keywords: Diabetes Mellitus, Obesity, Social Determinants of Health, Socioeconomic Factors, Geographic Mapping
Introduction
Diabetes and obesity are major public health challenges whose estimated prevalence can vary sharply across small geographic areas. A census tract-level analysis of insured adults in King County found that adult obesity prevalence varied geographically by tract after adjustment for individual characteristics1. A companion tract-level analysis in the same region found that diabetes prevalence also varied geographically and aligned with neighborhood socioeconomic patterns2. A primary-care geospatial study found significant census-tract hot and cold spots of type 2 diabetes and showed that hot-spot tracts had lower income, lower high-school graduation, more limited English proficiency, and less insurance coverage than other tracts3. A Gulf Coast cohort study found that greater neighborhood deprivation was associated with higher obesity and diabetes prevalence in a region with high baseline cardiometabolic burden4.
Social vulnerability and social determinants of health provide a framework for studying these patterns at the tract level. A national census-tract study found that higher Social Vulnerability Index (SVI) values were associated with higher prevalence of diabetes, obesity, physical inactivity, cardiovascular risk factors, and coronary heart disease5. A Pennsylvania study found that multiple tract-level social-determinants indexes and community typologies were associated with new-onset type 2 diabetes across diverse urban and rural settings6. A Houston tract-level study found that food-insecurity hot spots had higher overall SVI and higher SVI subdomain scores than cold-spot tracts7. A randomized housing-mobility experiment found that assignment to a low-poverty neighborhood voucher group was associated with lower long-term prevalence of extreme obesity and diabetes than the control group8. Together, these studies support investigating whether Greater Houston tracts with higher combined diabetes-obesity burden also have higher social vulnerability. It should be noted that tract-level patterns do not prove that social vulnerability causes diabetes or obesity in individual people.
Neighborhood physical and social environments have also been linked to obesity and diabetes in individual-level cohort research. In a multiethnic cohort, better neighborhood physical-environment scores were associated with lower body mass index9. In another study, better neighborhood resources for physical activity and healthy foods were associated with lower incidence of type 2 diabetes10. A 10-year follow-up study found that cumulative exposure to higher-quality healthy food resources, physical activity resources, and social environment was associated with reduced incidence of type 2 diabetes11. A Boston-area multilevel study found substantial neighborhood variation in type 2 diabetes, while also showing that neighborhood measures did not fully explain racial and ethnic disparities12. These primary research studies suggest that neighborhood conditions can help explain why diabetes and obesity are higher in some places than others.
Food access is relevant to this study, but prior research has shown mixed findings. Therefore, the United States Department of Agriculture (USDA) income-and-access indicators should be interpreted carefully. A longitudinal veterans cohort found that greater neighborhood fast-food exposure was associated with higher diabetes risk13. A Swedish cohort found that food-environment characteristics beyond simple supermarket access were associated with diabetes risk14. A three-cohort mediation study found that neighborhood socioeconomic disadvantage was associated with type 2 diabetes but was not mediated through measured food-environment pathways15. A dynamic food-environment study found that changes in grocery stores, fast-food restaurants, and full-service restaurants were associated with neighborhood type 2 diabetes prevalence over time16. A national global and local regression study found that food-desert exposure and fast-food density were not significant in global models for obesity and diabetes, whereas park access was inversely associated with both outcomes and local associations varied geographically17. An activity-based national food-environment study found that patterns related to food retailer visits predicted cardiometabolic disease prevalence better than residential food-location measures alone18. A county-level food-environment study found that food swamps were stronger predictors of adult obesity rates than food deserts19. Similarly, a commuting-corridor analysis found body mass index associations with food environments near home and along commuting routes20. These findings support analyzing low-income status, low-access status, and Low-Income, Low-Access (LILA) status separately rather than treating LILA as a pure food-access mechanism.
Recent spatial epidemiology studies explain why overlap should be tested directly rather than assumed from separate maps. A Chicago study found that food-environment associations with obesity depended on neighborhood racial segregation, illustrating that environmental associations can differ across urban contexts21. A geospatial machine-learning study in Shelby County identified adult-obesity hot spots and found associations with income, poverty, race, renting, insurance, and age composition22. A Missouri geospatial model found strong spatial autocorrelation in obesity prevalence and showed that adding spatial structure improved prediction23. A New York City study found that about half of pediatric type 2 diabetes hot spots overlapped with childhood obesity hot spots, but also identified discordance in some neighborhoods24. In adults with diabetes, higher neighborhood deprivation was associated with poor glycemic control and multiple poorly controlled cardiometabolic risk factors25. A Swedish primary-care cohort found that neighborhood deprivation was associated with higher type 2 diabetes risk after adjustment for individual-level factors26. A longitudinal young-adult cohort found that changes in neighborhood food-retail and physical-activity environments were associated with body mass index trajectories27. A recent U.S. census-tract study found that population-level social risk factors were associated with diabetes prevalence across tracts28.
The present study builds on this body of work by focusing on tract-level combined diabetes-obesity burden in Greater Houston. Maps that depict a single chronic disease condition would show where diabetes or obesity is individually elevated. However, they do not show whether both burdens co-occur in the same tracts more often than expected under independence. Therefore, this study used the continuous combined diabetes-obesity score as the primary measure and treated the high-burden overlap classification as a secondary test of overlap. The study focused on four research questions for Greater Houston. First, are estimated diabetes and obesity burdens related across census tracts? Second, do high diabetes and high obesity estimates appear in the same tracts more often than expected under independence? Third, how is the continuous combined score related to social vulnerability and to USDA low-income, low-access, and LILA indicators? Finally, is the continuous combined score spatially clustered across the study area?
Methods
Study Area
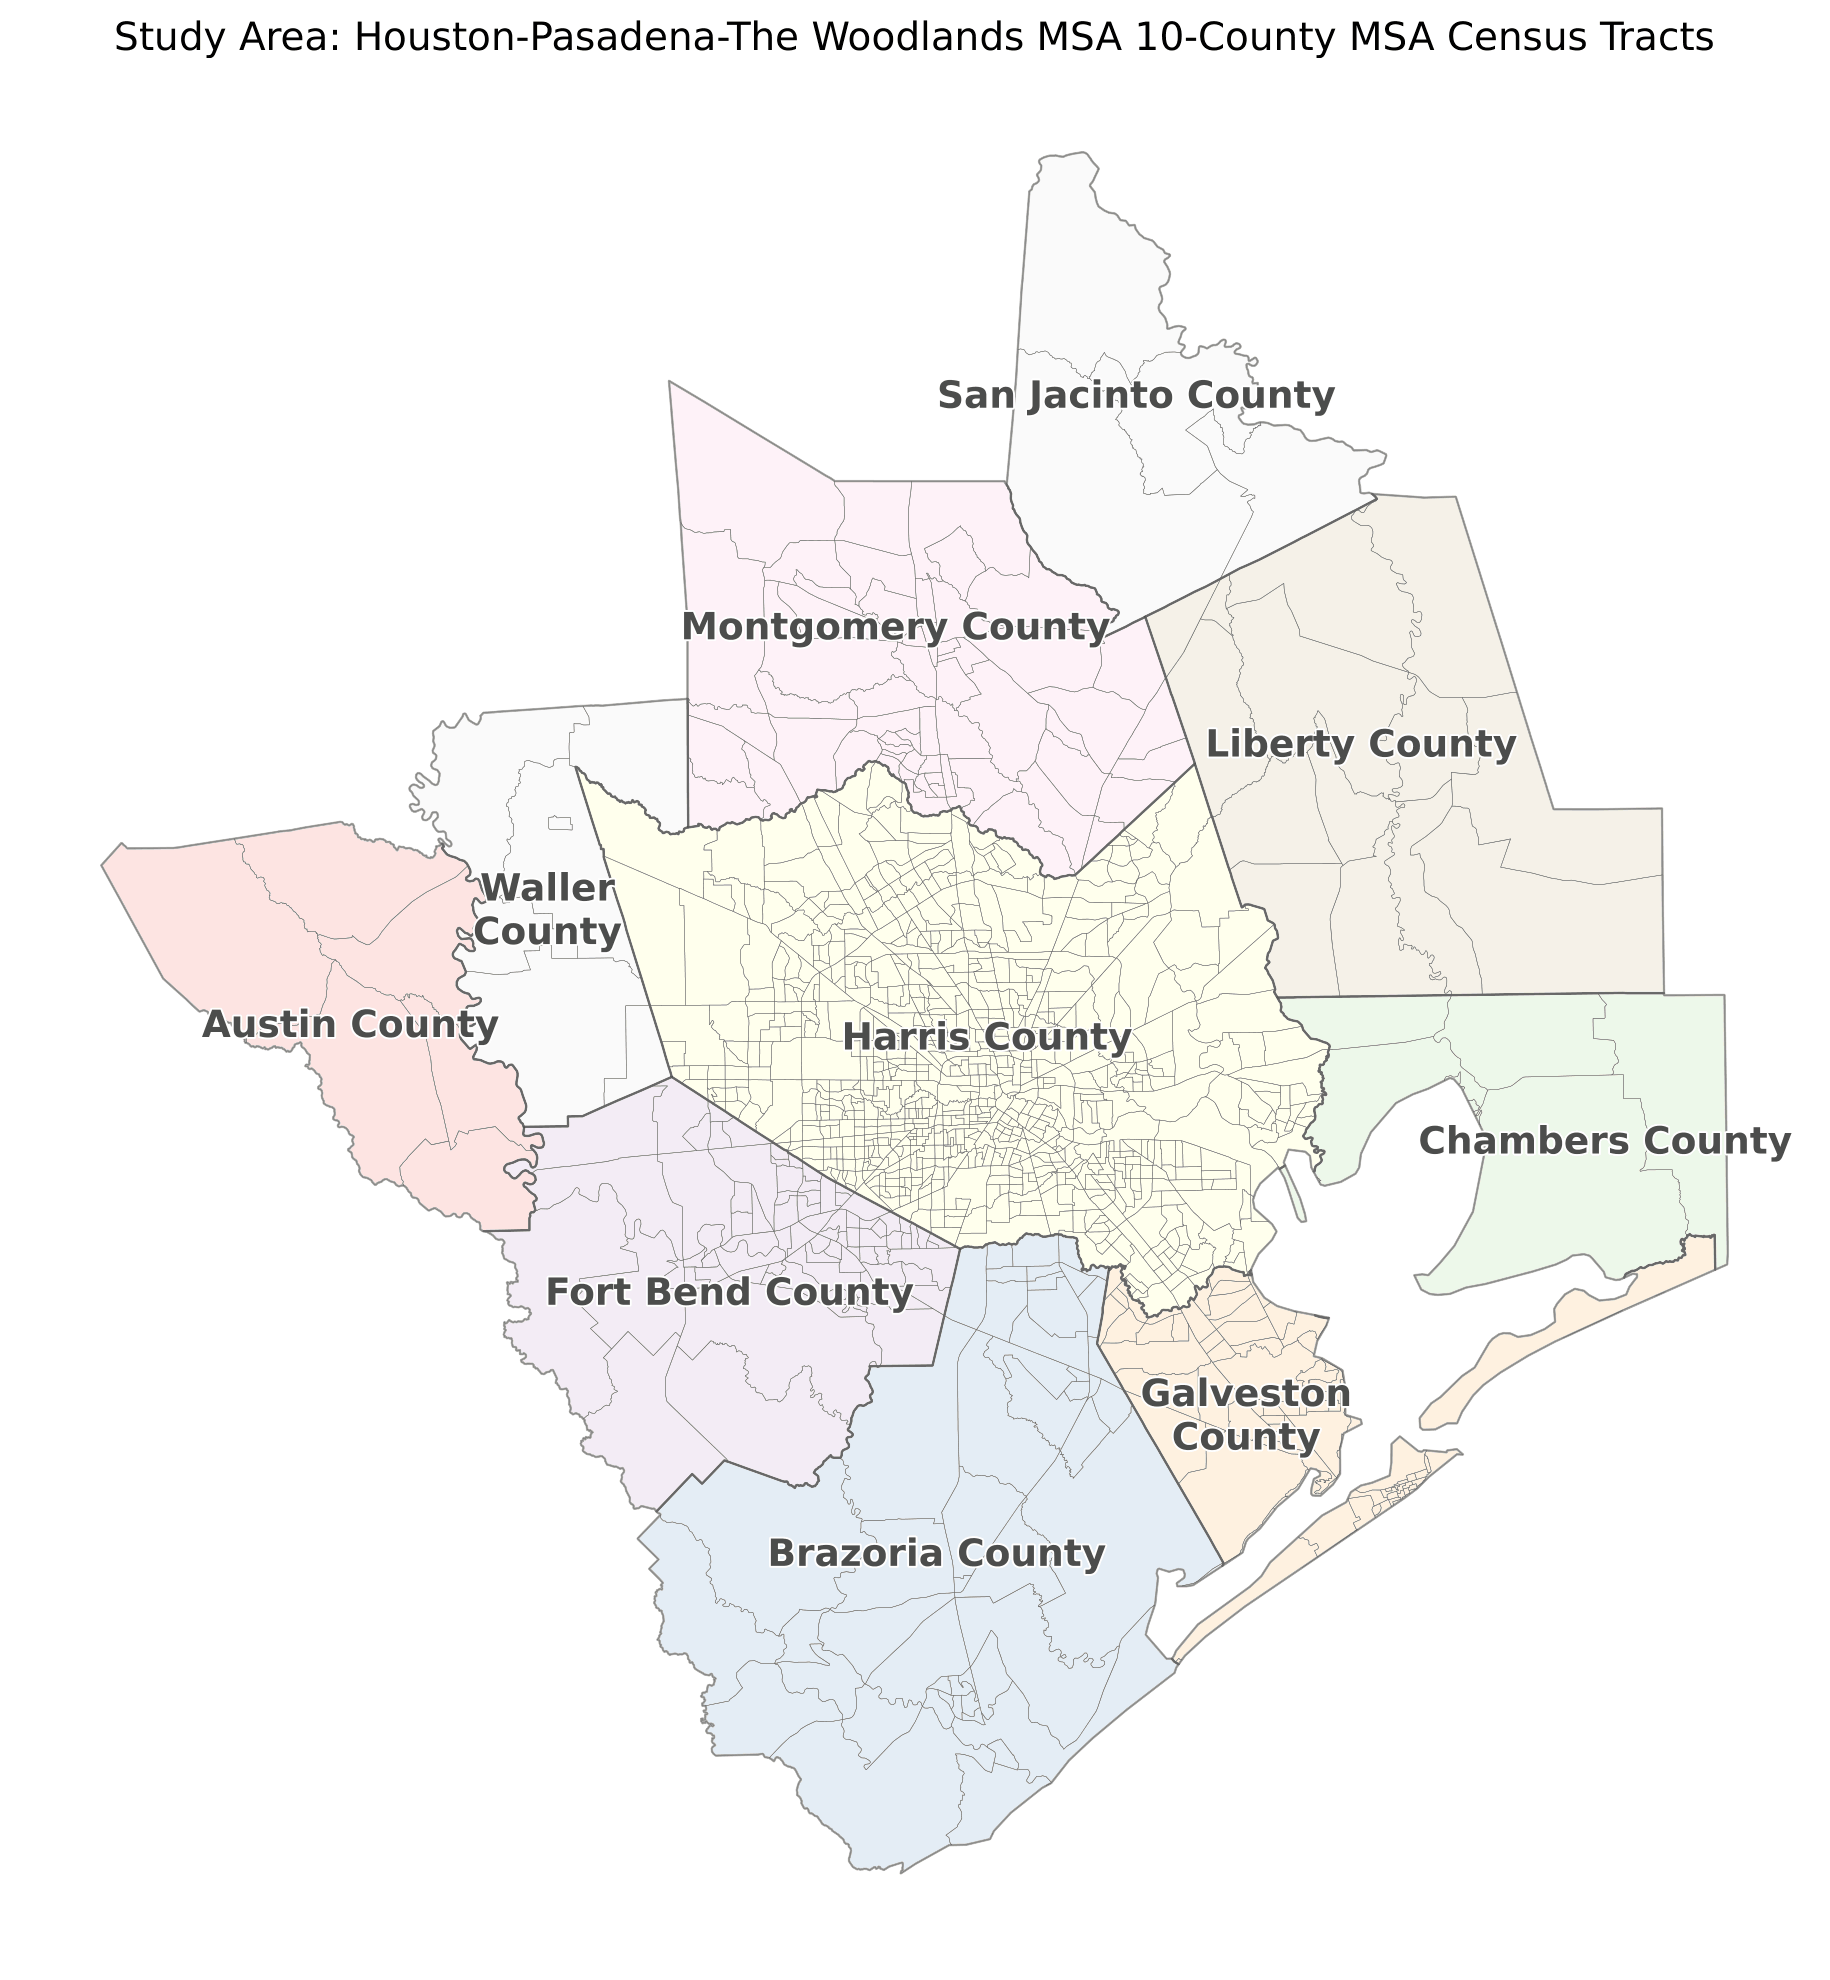
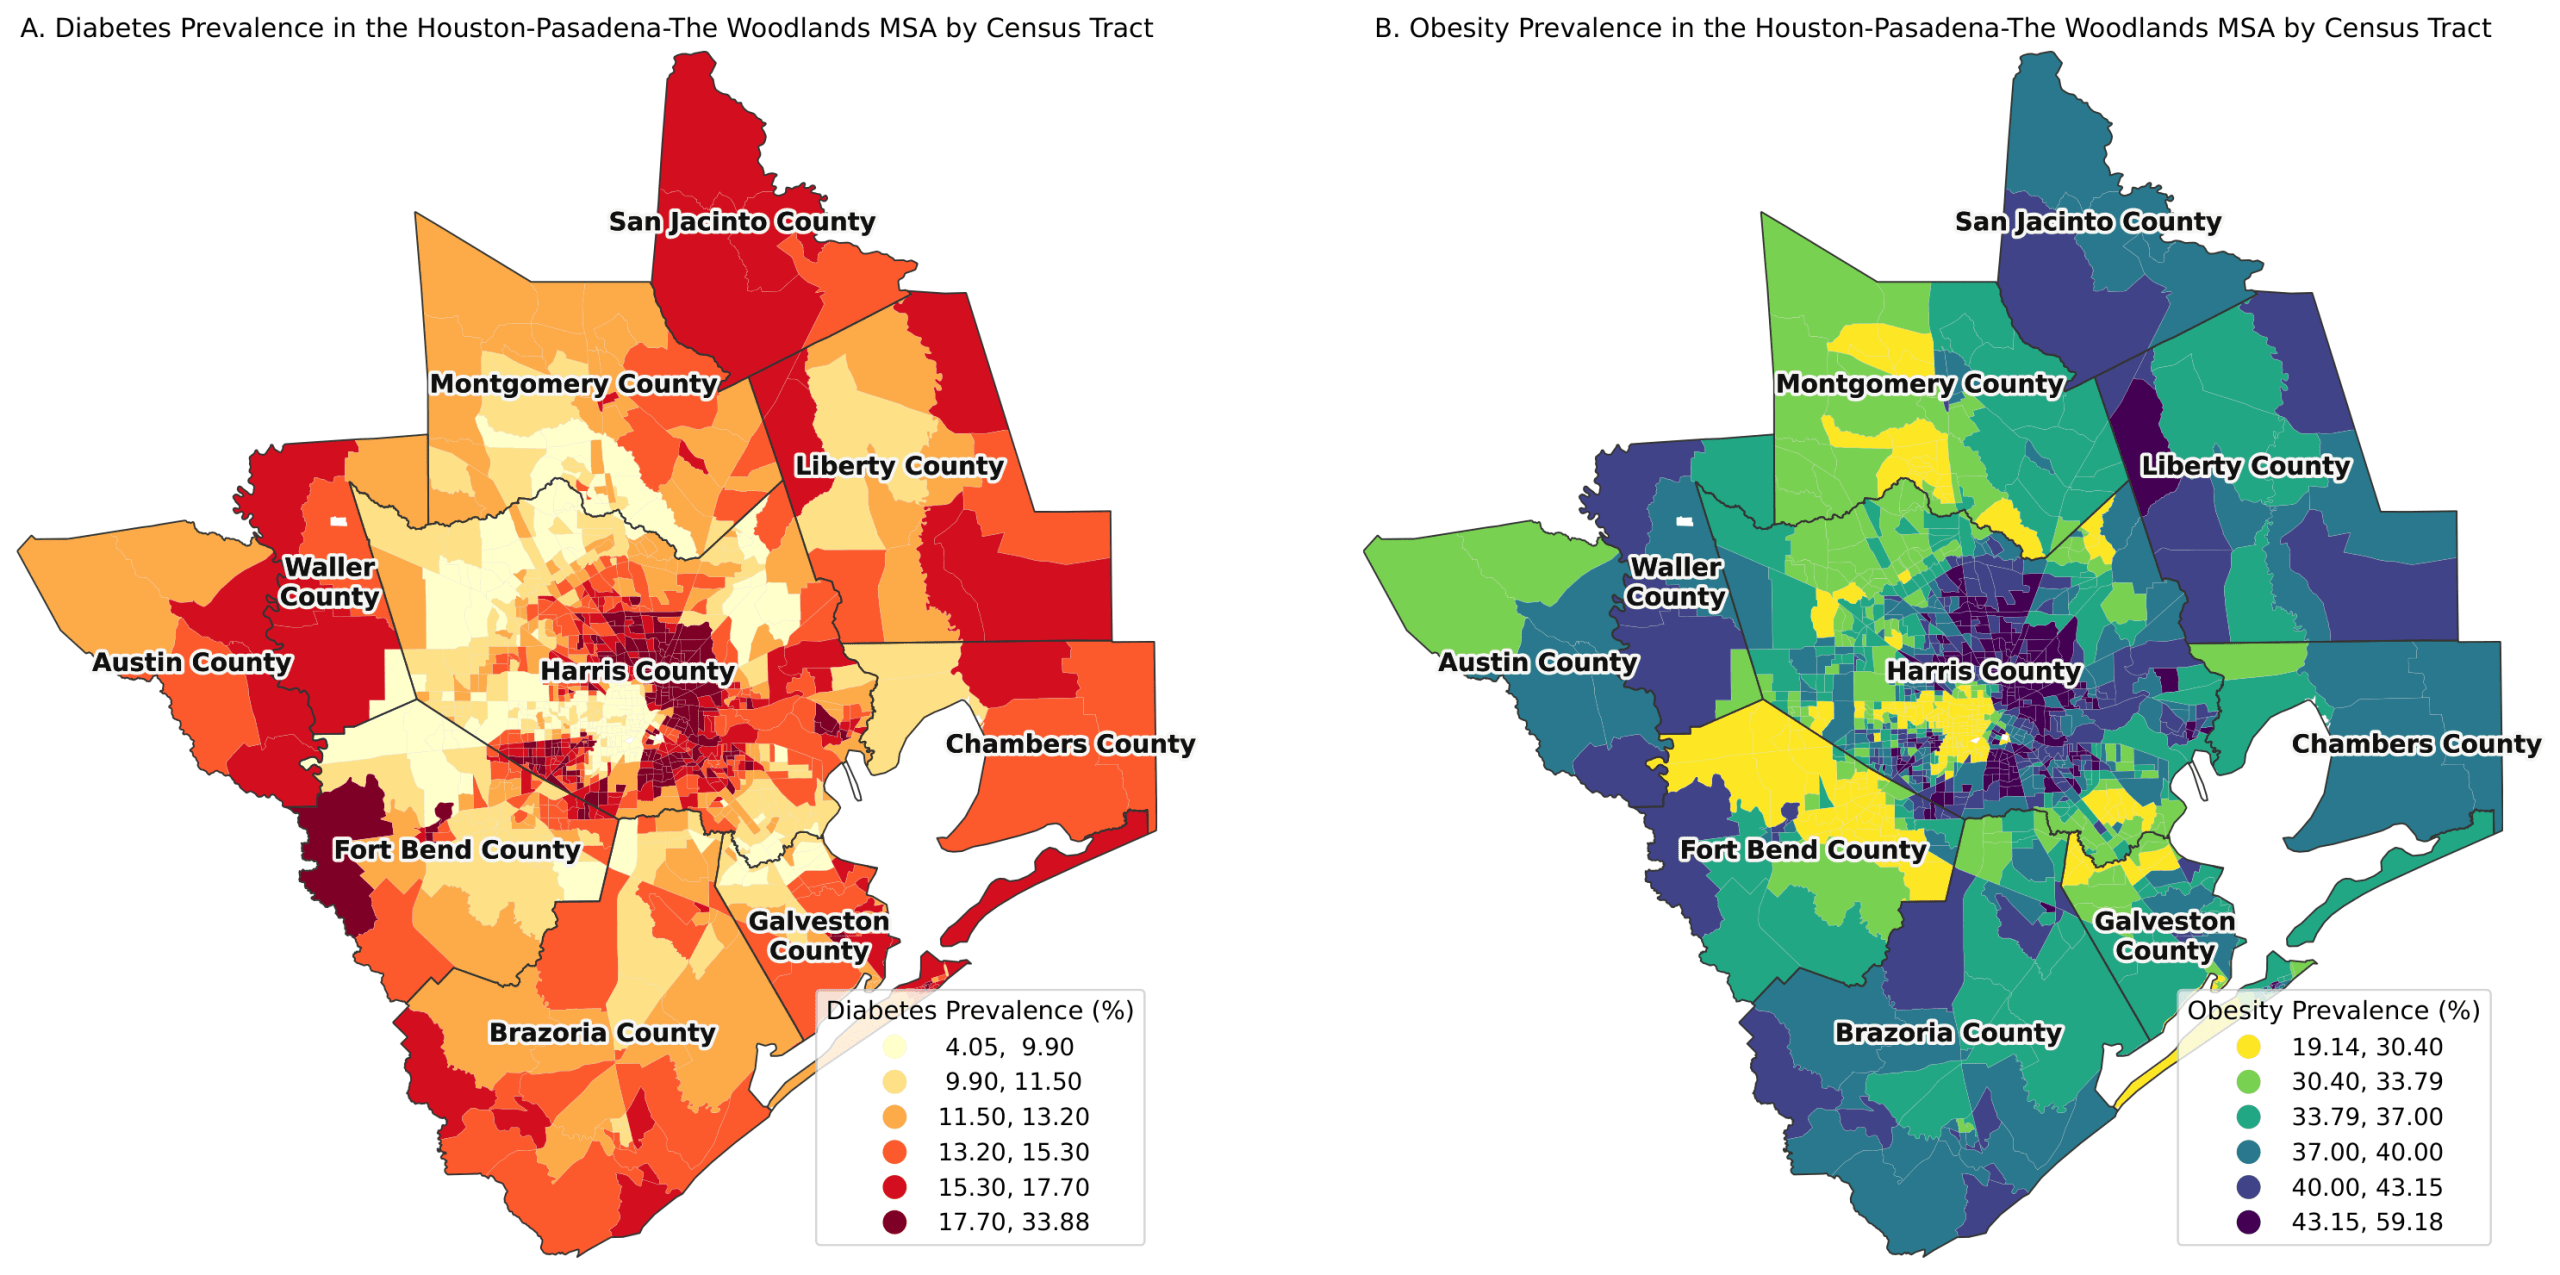
The present study was an ecological, cross-sectional, census tract-level spatial analysis in the ten-county Houston-Pasadena-The Woodlands Metropolitan Statistical Area, referred to as “Greater Houston” herein. These ten counties included Austin, Brazoria, Chambers, Fort Bend, Galveston, Harris, Liberty, Montgomery, San Jacinto, and Waller (Figure 1).
Data Sources and Variables
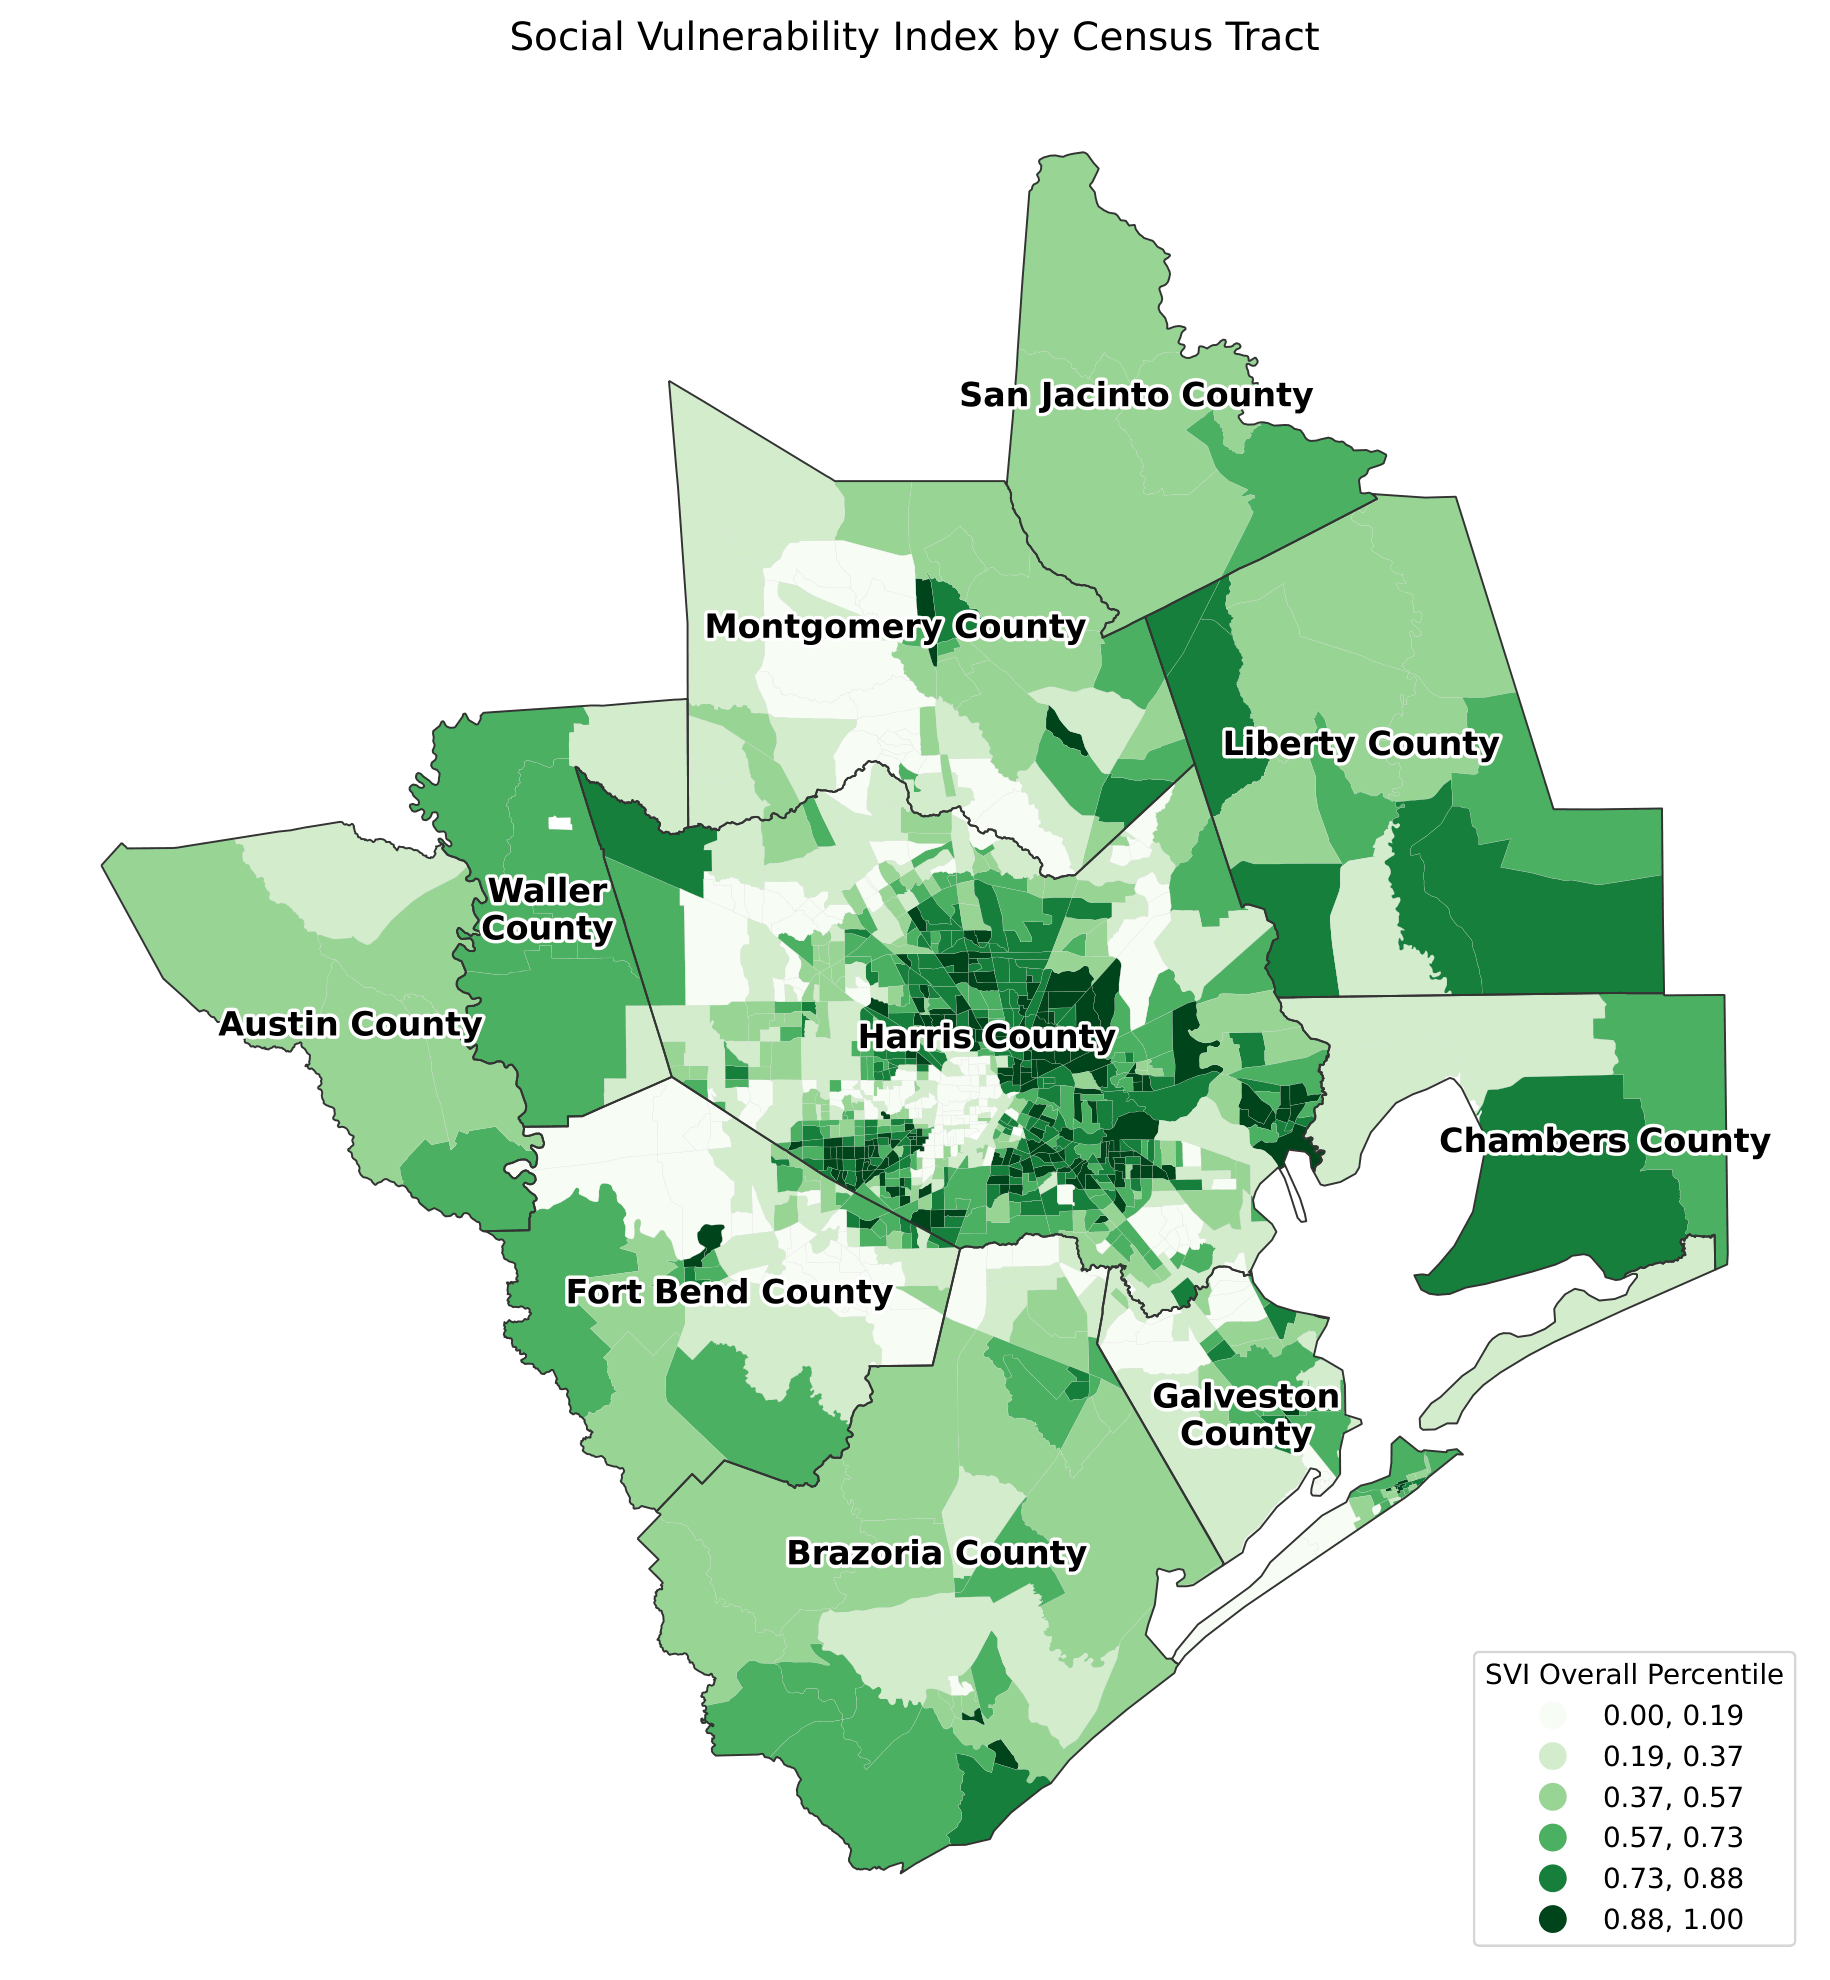
Publicly available datasets from the Centers for Disease Control and Prevention (CDC), the USDA, and the United States Census Bureau were downloaded on March 7, 2026. Harmonization of these datasets, mapping, and statistical analyses were conducted during March 2026. Diabetes and obesity prevalence estimates were obtained from CDC PLACES 202529. This dataset provides model-based, small-area estimates of chronic disease measures for the US census tracts. Small-area estimates are useful for place-based public health research, but they should be interpreted only as modeled estimates rather than direct clinical measurements of census tract disease prevalence30. The PLACES dataset includes estimates from the Behavioral Risk Factor Surveillance System (BRFSS). Its 2025 release includes 35 measures based on 2023 BRFSS and 5 measures based on 2022 BRFSS. The CDC/Agency for Toxic Substances and Disease Registry (ATSDR) SVI 2022 dataset31 was used to obtain community-level social vulnerability data built from American Community Survey (ACS) 2018-2022 estimates. SVI is a variable that synthesizes several socioeconomic and demographic indicators. The overall SVI percentile variable (RPL_THEMES) was used in the present analysis (Figure 2).
Food access was evaluated using the USDA Food Access Research Atlas (2019) dataset32. Three tract indicators were used: low-income status (LowIncomeTracts), low-access status (LA1and10), and the combined low-income, low-access (LILA) status (LILATracts_1And10). The low-access criterion flags tracts where at least 500 people, or 33% of the tract population, live more than 1 mile in urban areas or more than 10 miles in rural areas from the nearest supermarket, supercenter, or large grocery store. LILA status combines this low-access criterion with low-income status. The low-income and low-access components were examined separately before the combined LILA measure was interpreted. The LILA classification accounts for both economic and geographical dimensions of food access, but is not a complete measure of food affordability, food quality, transportation reliability, or household food insecurity.
Ethical Statement
This study utilized previously collected, publicly available government datasets. No new human data were collected, and no human participants were recruited, so Institutional Review Board (IRB) approval was not required. In all the datasets, personally identifiable information was already removed prior to public release. Analyses were conducted only on aggregated census tract-level variables for public health research and planning purposes, not for clinical diagnosis or individual-level medical decision-making.
Data Preparation and Tract Harmonization
The PLACES tract-level dataset was filtered to the ten Greater Houston counties using the 5-digit county Federal Information Processing Standards (FIPS) prefixes within the tract Geographic Identifiers (GEOIDs). Values of -999 in certain SVI percentile fields of the 2022 SVI dataset were treated as missing. The USDA Food Access Research Atlas 2019 dataset was also filtered to the ten counties, but it uses 2010 tract GEOIDs. Therefore, the 2020 to 2010 census tract crosswalk33 was used to calculate area-based weights:
![\[Weight_{2020 \rightarrow 2010}\frac{AREALAND_{PART}}{AREALAND_{TRACT20}}\]](https://nhsjs.com/wp-content/ql-cache/quicklatex.com-a13d33333a66cb77eb675070f899059d_l3.png "Rendered by QuickLaTeX.com")
where,
Weight2020→2010 = area-based proportion of the 2020 tract assigned to the 2010 tract
AREALANDPART = land area of the intersection between the 2020 tract and the 2010 tract
AREALANDTRACT20 = total land area of the 2020 tract
These weights were used to convert the PLACES health indicators and the SVI percentile scores to the 2010 tracts:
![\[X_{2010}\frac{\sum (X_{2020} \times \text{Weight}{2020 \to 2010})} {\sum (\text{Weight}{2020 \to 2010})}\]](https://nhsjs.com/wp-content/ql-cache/quicklatex.com-1171193d5eed77b72d92c7f2e1d811cc_l3.png "Rendered by QuickLaTeX.com")
where,
X2020 = value of a variable in the 2020 census tract (diabetes prevalence, obesity prevalence, or SVI percentile)
X2010 = harmonized value of that variable per the corresponding 2010 census tract
This approach allowed values from split or partially overlapping tracts to be proportionally allocated to the corresponding 2010 tracts. These converted estimates were merged with the LowIncomeTracts, LA1and10 and LILATracts_1And10 indicators, and the 2010 tract boundary shapefile34 to create the comprehensive analysis dataset. Any census tracts with missing diabetes prevalence, obesity prevalence, SVI, or USDA classifications were removed. In order to visualize the spatial variation of those variables across the study area, choropleth maps were produced by assigning color gradients to the tract polygons based on the selected variables.
Continuous Combined Diabetes-Obesity Score and High-Burden Overlap Tracts
Diabetes and obesity prevalence were standardized using z-scores calculated from the respective means and standard deviations as follows:
![\[z=\frac{X-\mu}{\sigma}\]](https://nhsjs.com/wp-content/ql-cache/quicklatex.com-a25e3d0e21d3b229ab766b3f36a1419b_l3.png "Rendered by QuickLaTeX.com")
where,
X = diabetes or obesity prevalence
𝜇 = mean prevalence across all tracts
σ = standard deviation of the prevalence
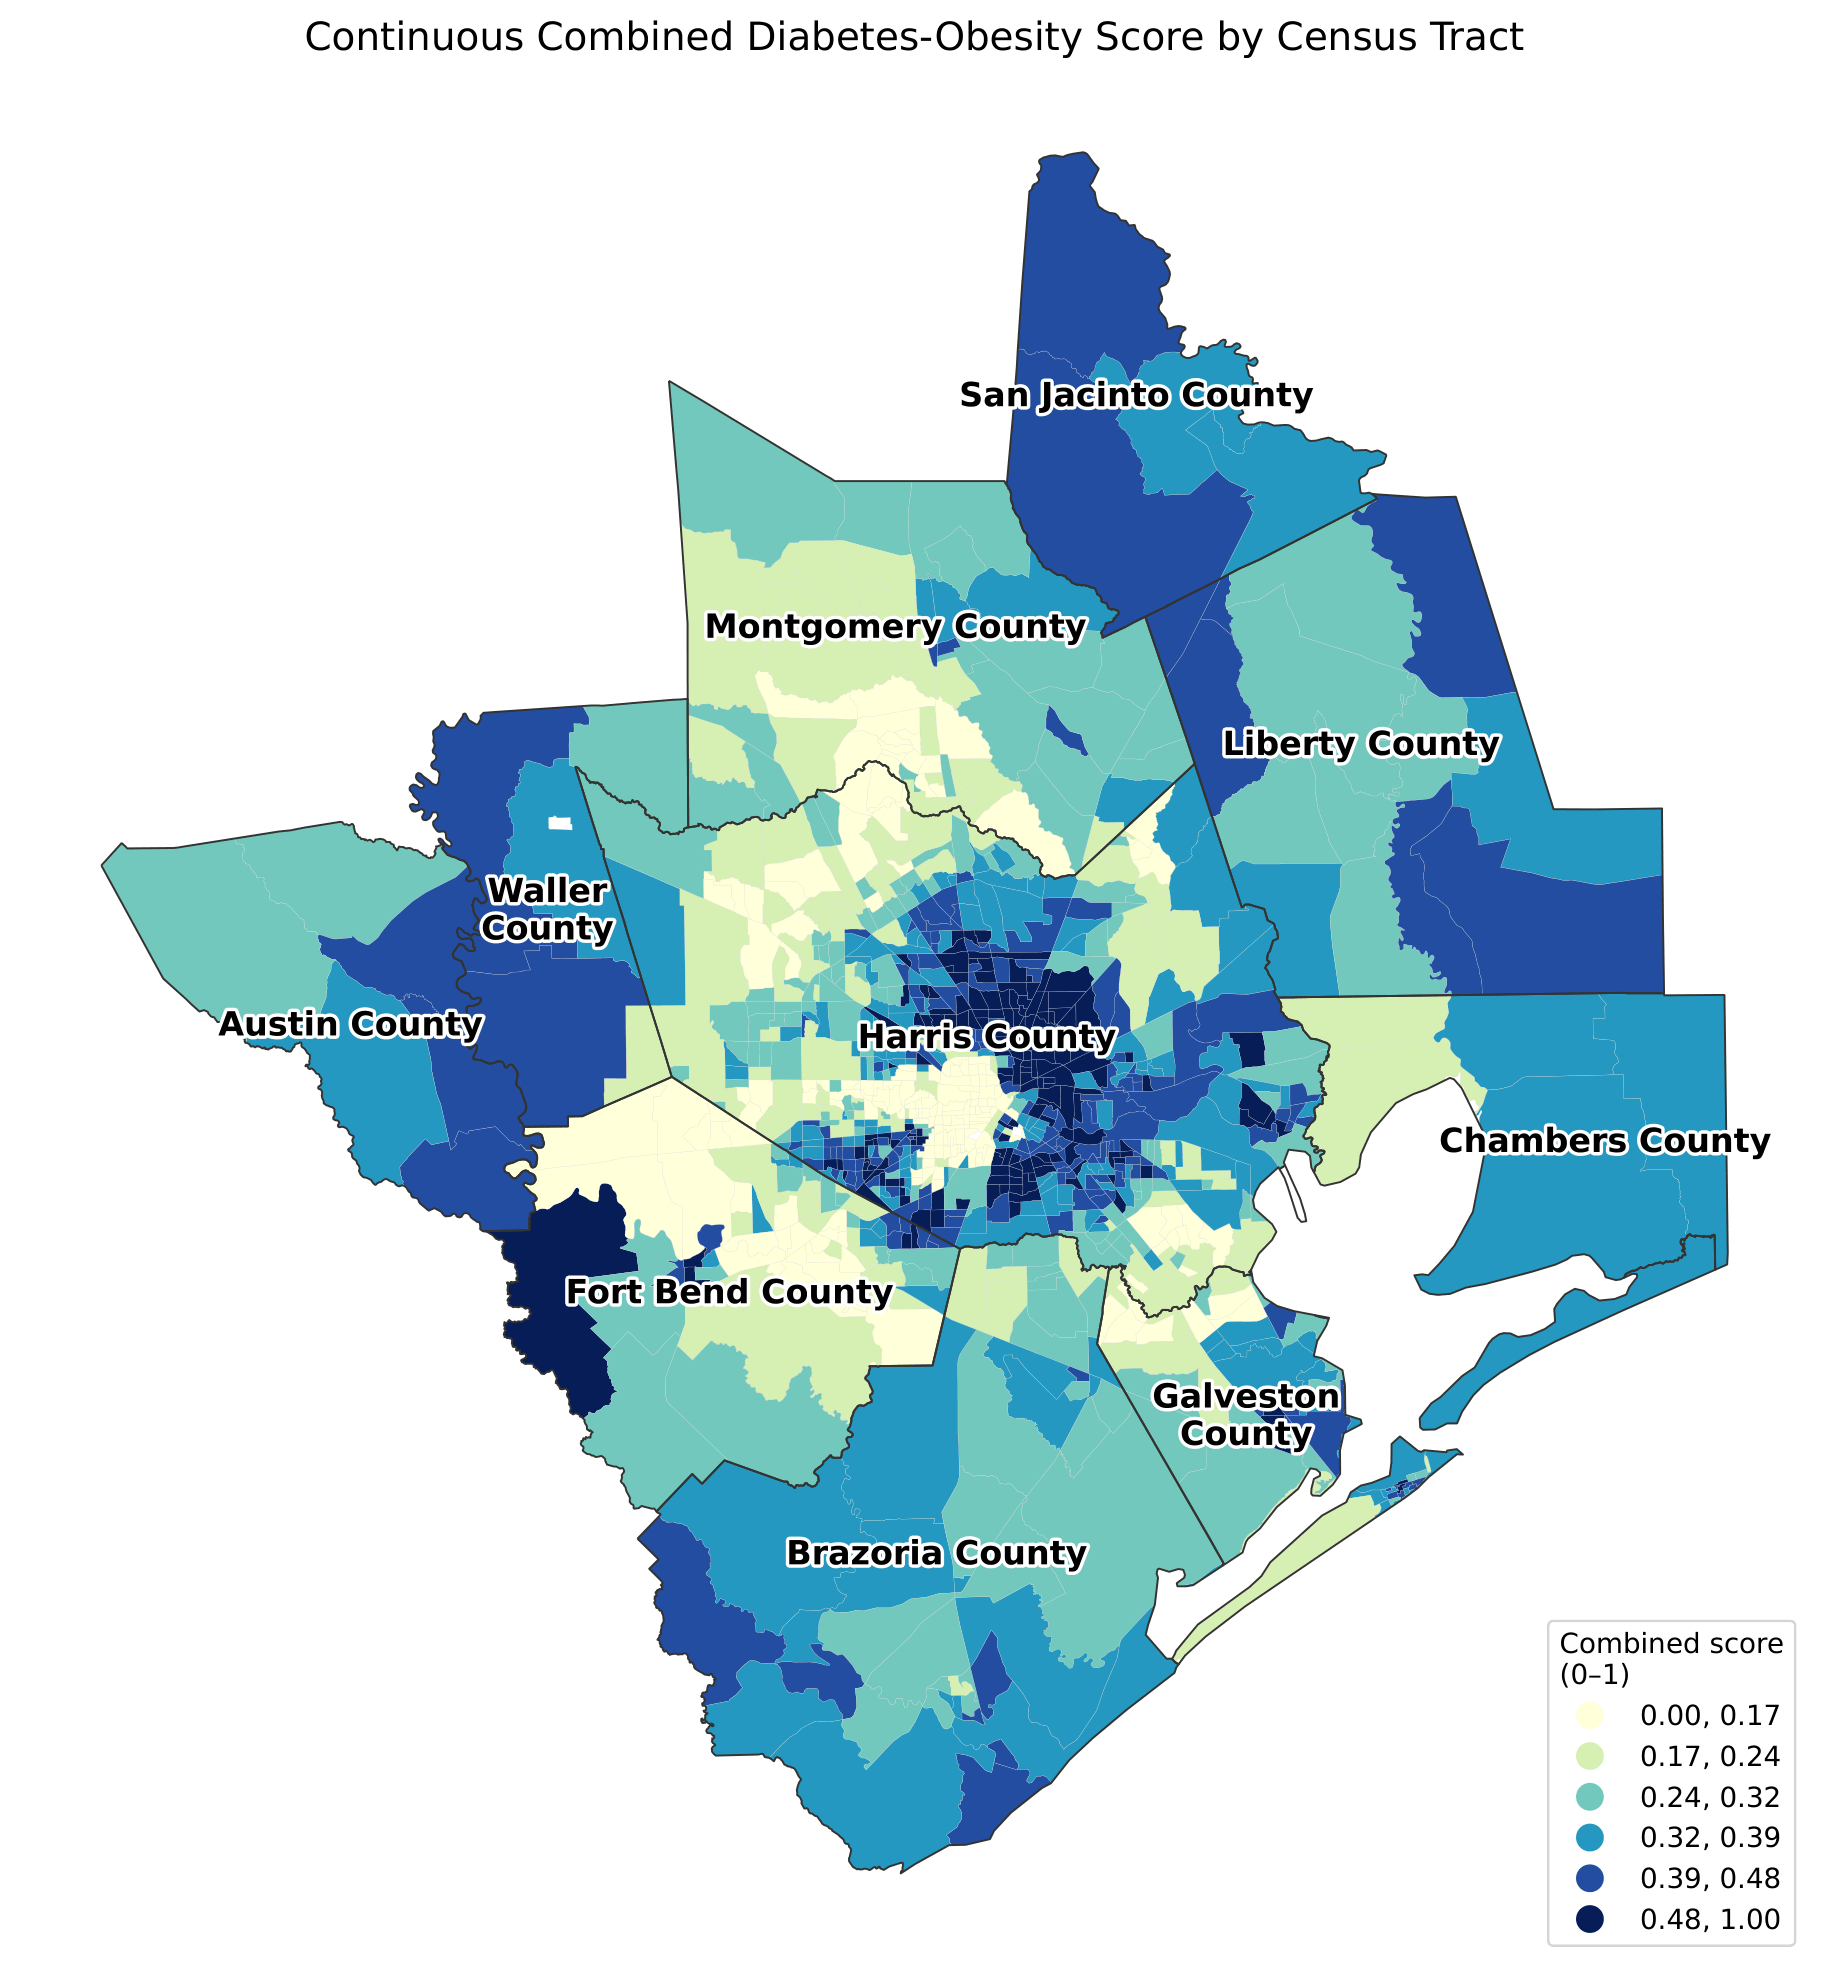
For each tract, the z-scores for diabetes and obesity were averaged to create the continuous combined score, the primary measure for all main analyses. This average z-score was linearly rescaled to a 0-to-1 range, preserving rank order while making larger values consistently represent higher combined diabetes-obesity burden. This score summarized joint estimated prevalence with equal contribution from both conditions (Figure 3).
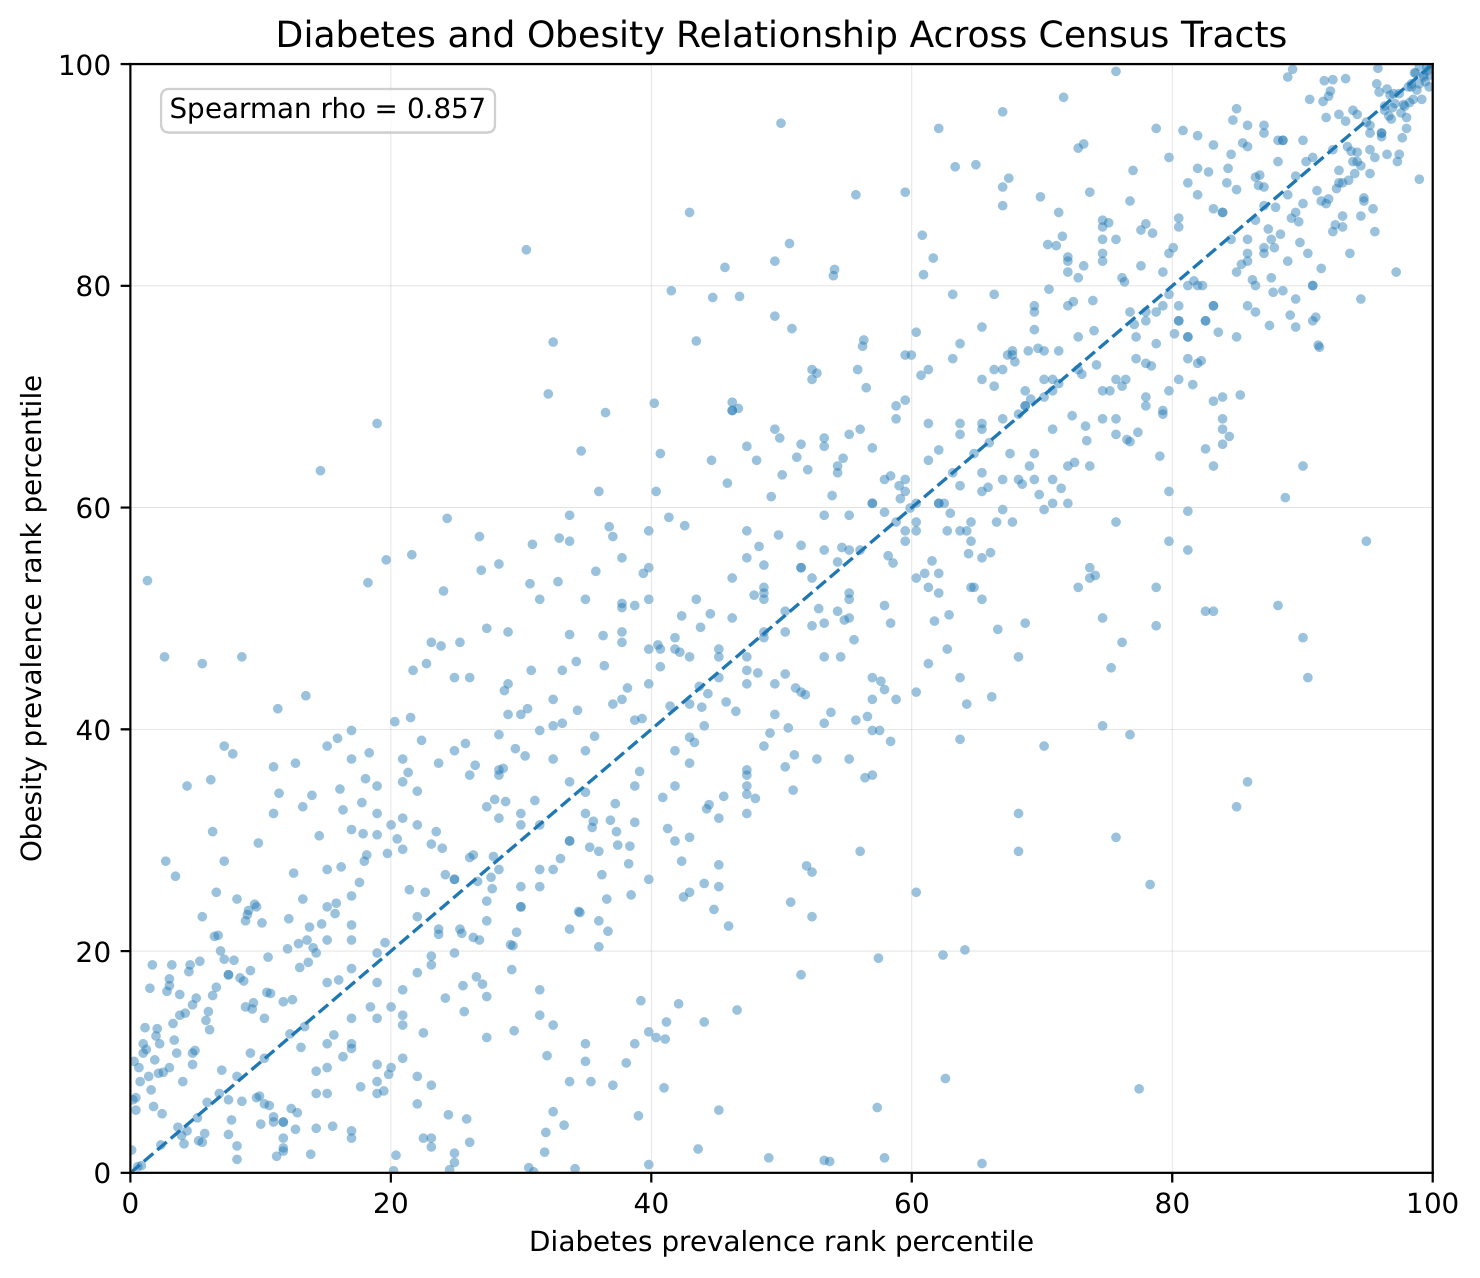
Diabetes and obesity prevalence estimates were also ranked separately across census tracts (Figure 4). To examine whether high diabetes and high obesity estimates appeared in the same tracts, tracts in the highest 20% for diabetes were designated as high diabetes burden tracts, tracts in the highest 20% for obesity were designated as high obesity burden tracts, and tracts that met both criteria were classified as high-burden overlap tracts. This 80th-percentile cutoff was used as a secondary measure to define a high-burden overlap group for testing whether high diabetes and high obesity estimates appeared in the same tracts more often than expected under independence. This comparison was repeated using the 75th- and 85th-percentile thresholds to confirm that the result did not depend on the specific cutoff.
Statistical Analysis
Statistical analyses were performed in Python using pandas, NumPy, and SciPy, with GeoPandas and PySAL (libpysal and esda) for spatial analyses. Statistical significance was evaluated at α = .05. The relationship between estimated diabetes and obesity prevalence across tracts was assessed using the Spearman rank correlation. The relationship between the continuous combined score and SVI percentiles (RPL_THEMES) was also assessed using the Spearman rank correlation, and the median combined score was summarized across SVI quartiles.
| Measure | Median | Q1 – Q3 | Mean, n |
| Estimated diabetes prevalence, % | 13.2 | 10.6 – 16.4 | 13.7 |
| Estimated obesity prevalence, % | 37.0 | 32.2 – 41.7 | 37.0 |
| Continuous combined score (0–1) | 0.318 | 0.209 – 0.438 | 0.329 |
| Overall SVI percentile | 0.566 | 0.284 – 0.805 | 0.543 |
| Low-income tracts, n (%) | — | — | 503 (47.1%) |
| Low-access tracts, n (%) | — | — | 414 (38.7%) |
| LILA tracts, n (%) | — | — | 155 (14.5%) |
For the high-burden overlap question, the observed number of high-burden overlap tracts was compared with the number expected if the high-diabetes and high-obesity classifications were independent. The enrichment ratio and the Jaccard overlap were reported as well. Statistical significance was tested with a blocked permutation test. This test compared the observed diabetes-obesity overlap with overlaps that could occur by chance. To keep the random test realistic, tracts were only compared within the same county and urban/rural group. In the main 80th-percentile overlap test, the high-diabetes tracts were kept the same, while the high-obesity labels were randomly shuffled within each county and urban/rural group. This process was repeated 10,000 times using random seed 12345. The P value was calculated as the proportion of shuffled results that produced as much overlap as, or more overlap than, the observed result, using a standard +1 correction.
The continuous combined score was summarized by low-income, low-access, and LILA status, reporting the median score and the difference in medians. Two multivariable linear models used the continuous combined score as the outcome: Model A included SVI, LILA status, and county controls; Model B included SVI, low-income status, low-access status, and county controls. Both models added a neighbor-average spatial-lag covariate, defined as the average continuous combined score of neighboring tracts using row-standardized Queen contiguity weights, and used standard errors clustered by county.
Spatial clustering of the continuous combined score was tested with Global Moran’s I using row-standardized Queen contiguity weights and 999 permutations. Under this approach, two tracts were considered neighbors if they shared a boundary or a corner. Local Getis-Ord Gi* analysis used Queen contiguity with binary weights and 999 permutations, with a one-sided local cluster interpretation focused on areas where higher combined scores were concentrated near other higher scores. Local significance was controlled with the Benjamini-Hochberg False Discovery Rate (FDR) procedure, and both nominal and FDR-significant high-cluster counts were reported. To check whether the spatial results depended on how neighbors were defined, Moran’s I and the Gi* high-cluster counts were recomputed using Queen contiguity, Rook contiguity, four- and eight-nearest-neighbor weights, and a distance-band specification.
Code Availability
The code used for data preprocessing, spatial analysis, statistical testing, and figure generation in this study is available at: https://github.com/ynganatra/houston-census-tract-analysis.
Results
The study area originally comprised 1,075 census tracts in the tract polygon layer. After merging the health, social vulnerability, and food-access datasets and removing the six tracts with missing key variables, the final analysis dataset contained 1,069 tracts across the ten counties, of which 784 were in Harris County. Diabetes and obesity prevalence estimates were not evenly distributed across Greater Houston, with the higher prevalence concentrated mainly in parts of the Houston urban core. As seen in Figure 5, diabetes and obesity prevalence estimates were strongly related across census tracts (Spearman ρ = 0.857, P < .001), supporting their combination into a single continuous combined score.
When evaluated with respect to social vulnerability, the continuous combined score rose steadily across SVI quartiles (Table 2), from a median of 0.163 in the lowest quartile to 0.497 in the highest and showed a strong positive Spearman correlation with the SVI percentiles (ρ = 0.882, P < .001).
| Measure | Median Combined Score | n |
| Spearman ρ, combined score vs SVI | 0.882 (P < .001) | 1,069 |
| SVI quartile 1 (lowest) | 0.163 | 268 |
| SVI quartile 2 | 0.262 | 267 |
| SVI quartile 3 | 0.369 | 267 |
| SVI quartile 4 (highest) | 0.497 | 267 |
Further analyses compared the continuous combined diabetes-obesity score by USDA indicator status (Figure 6). The median score was higher in low-income tracts than in non-low-income tracts (0.441 vs 0.219; difference = +0.222) and higher in LILA tracts than in non-LILA tracts (0.425 vs 0.293; difference = +0.132). In contrast, the median score was lower in low-access tracts than in non-low-access tracts when the two groups were compared directly (0.279 vs 0.348; difference = −0.069). This means that the continuous combined score was higher in low-income and LILA tracts, but low-access status alone did not show the same pattern.
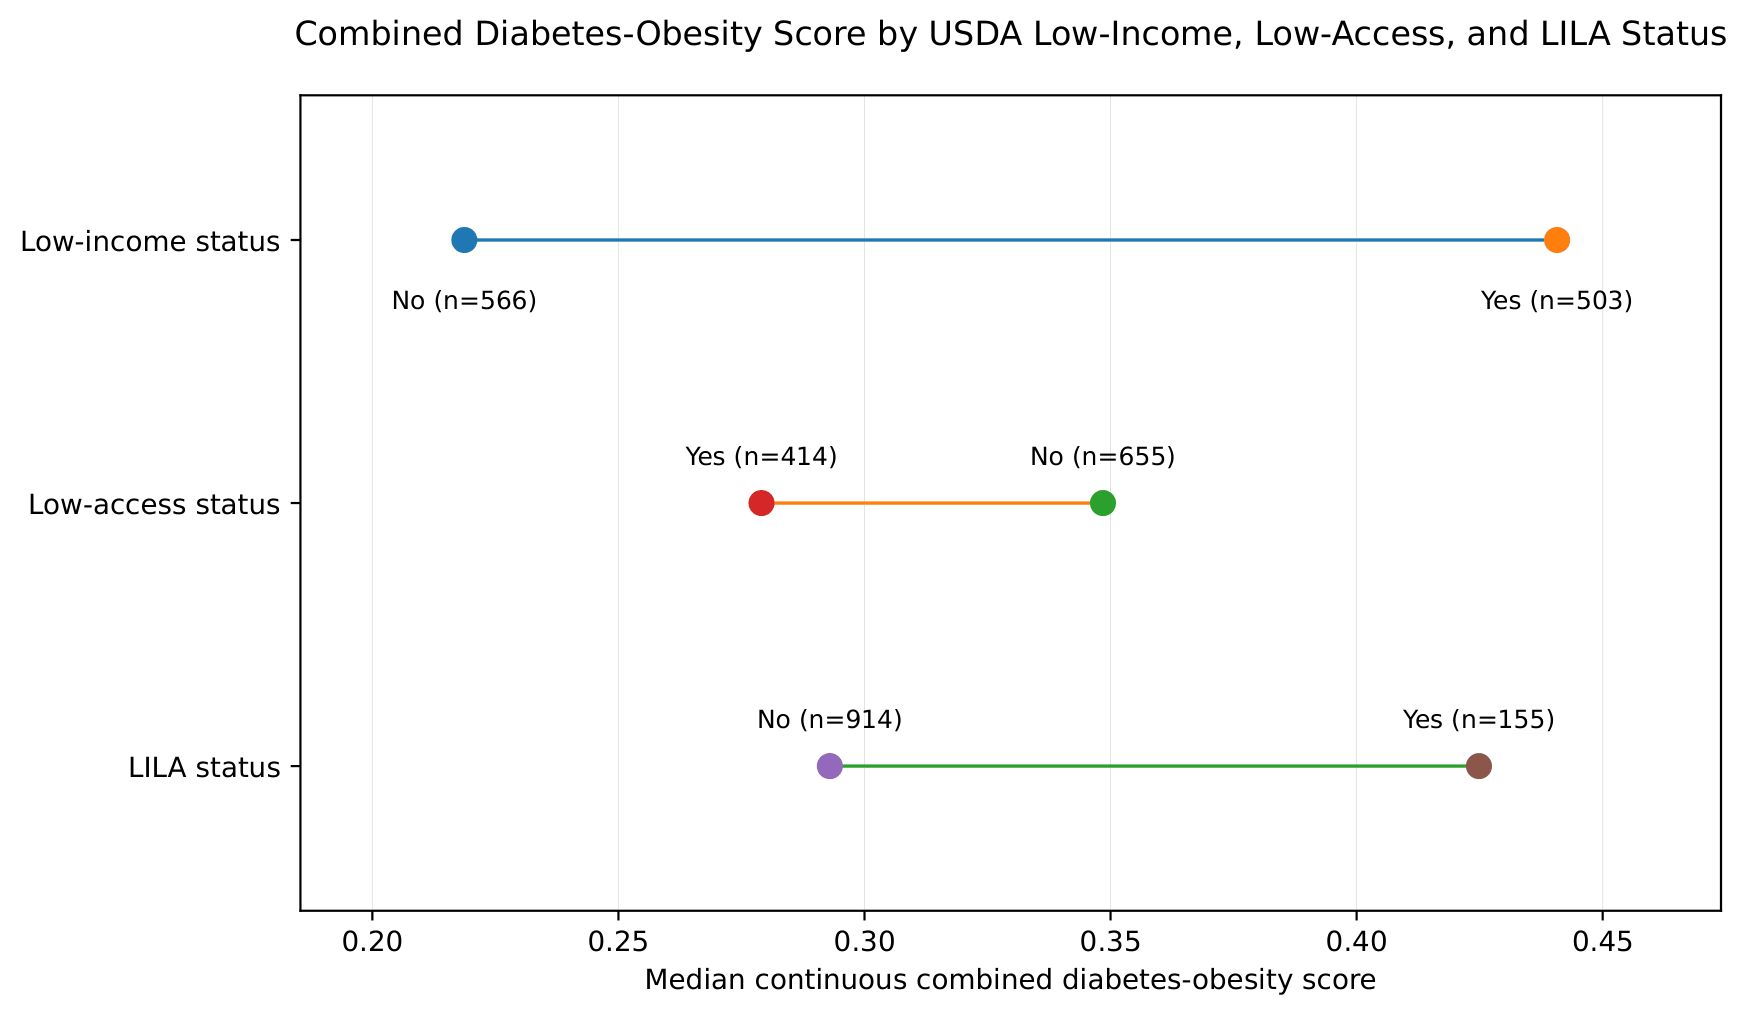
Similarly, in the multivariable models (Table 3), SVI and the neighbor-average spatial-lag covariate had the largest positive coefficients. In Model A, SVI had a coefficient of +0.245, LILA status had a coefficient of +0.015, and the neighbor-average spatial-lag covariate had a coefficient of +0.593. In Model B, which separated the USDA components, SVI had a coefficient of +0.233, low-income status had a coefficient of +0.018, low-access status had a coefficient of +0.009, and the neighbor-average spatial-lag covariate had a coefficient of +0.582. These results indicate that the continuous combined diabetes-obesity score was more clearly related to low-income status and LILA status than to low-access status alone. The low-access result was weaker and less consistent because low-access tracts had a lower median score in the direct median comparison, while low-access status had only a small positive coefficient in the multivariable model.
| Term | Coefficient | 95% CI |
| Model A (R² = 0.839): SVI | +0.245 | 0.225 – 0.266 |
| Model A: LILA status | +0.015 | 0.012 – 0.019 |
| Model A: neighbor-average spatial-lag covariate | +0.593 | 0.572 – 0.614 |
| Model B (R² = 0.840): SVI | +0.233 | 0.208 – 0.259 |
| Model B: low-income status | +0.018 | 0.008 – 0.029 |
| Model B: low-access status | +0.009 | 0.004 – 0.014 |
| Model B: neighbor-average spatial-lag covariate | +0.582 | 0.565 – 0.599 |
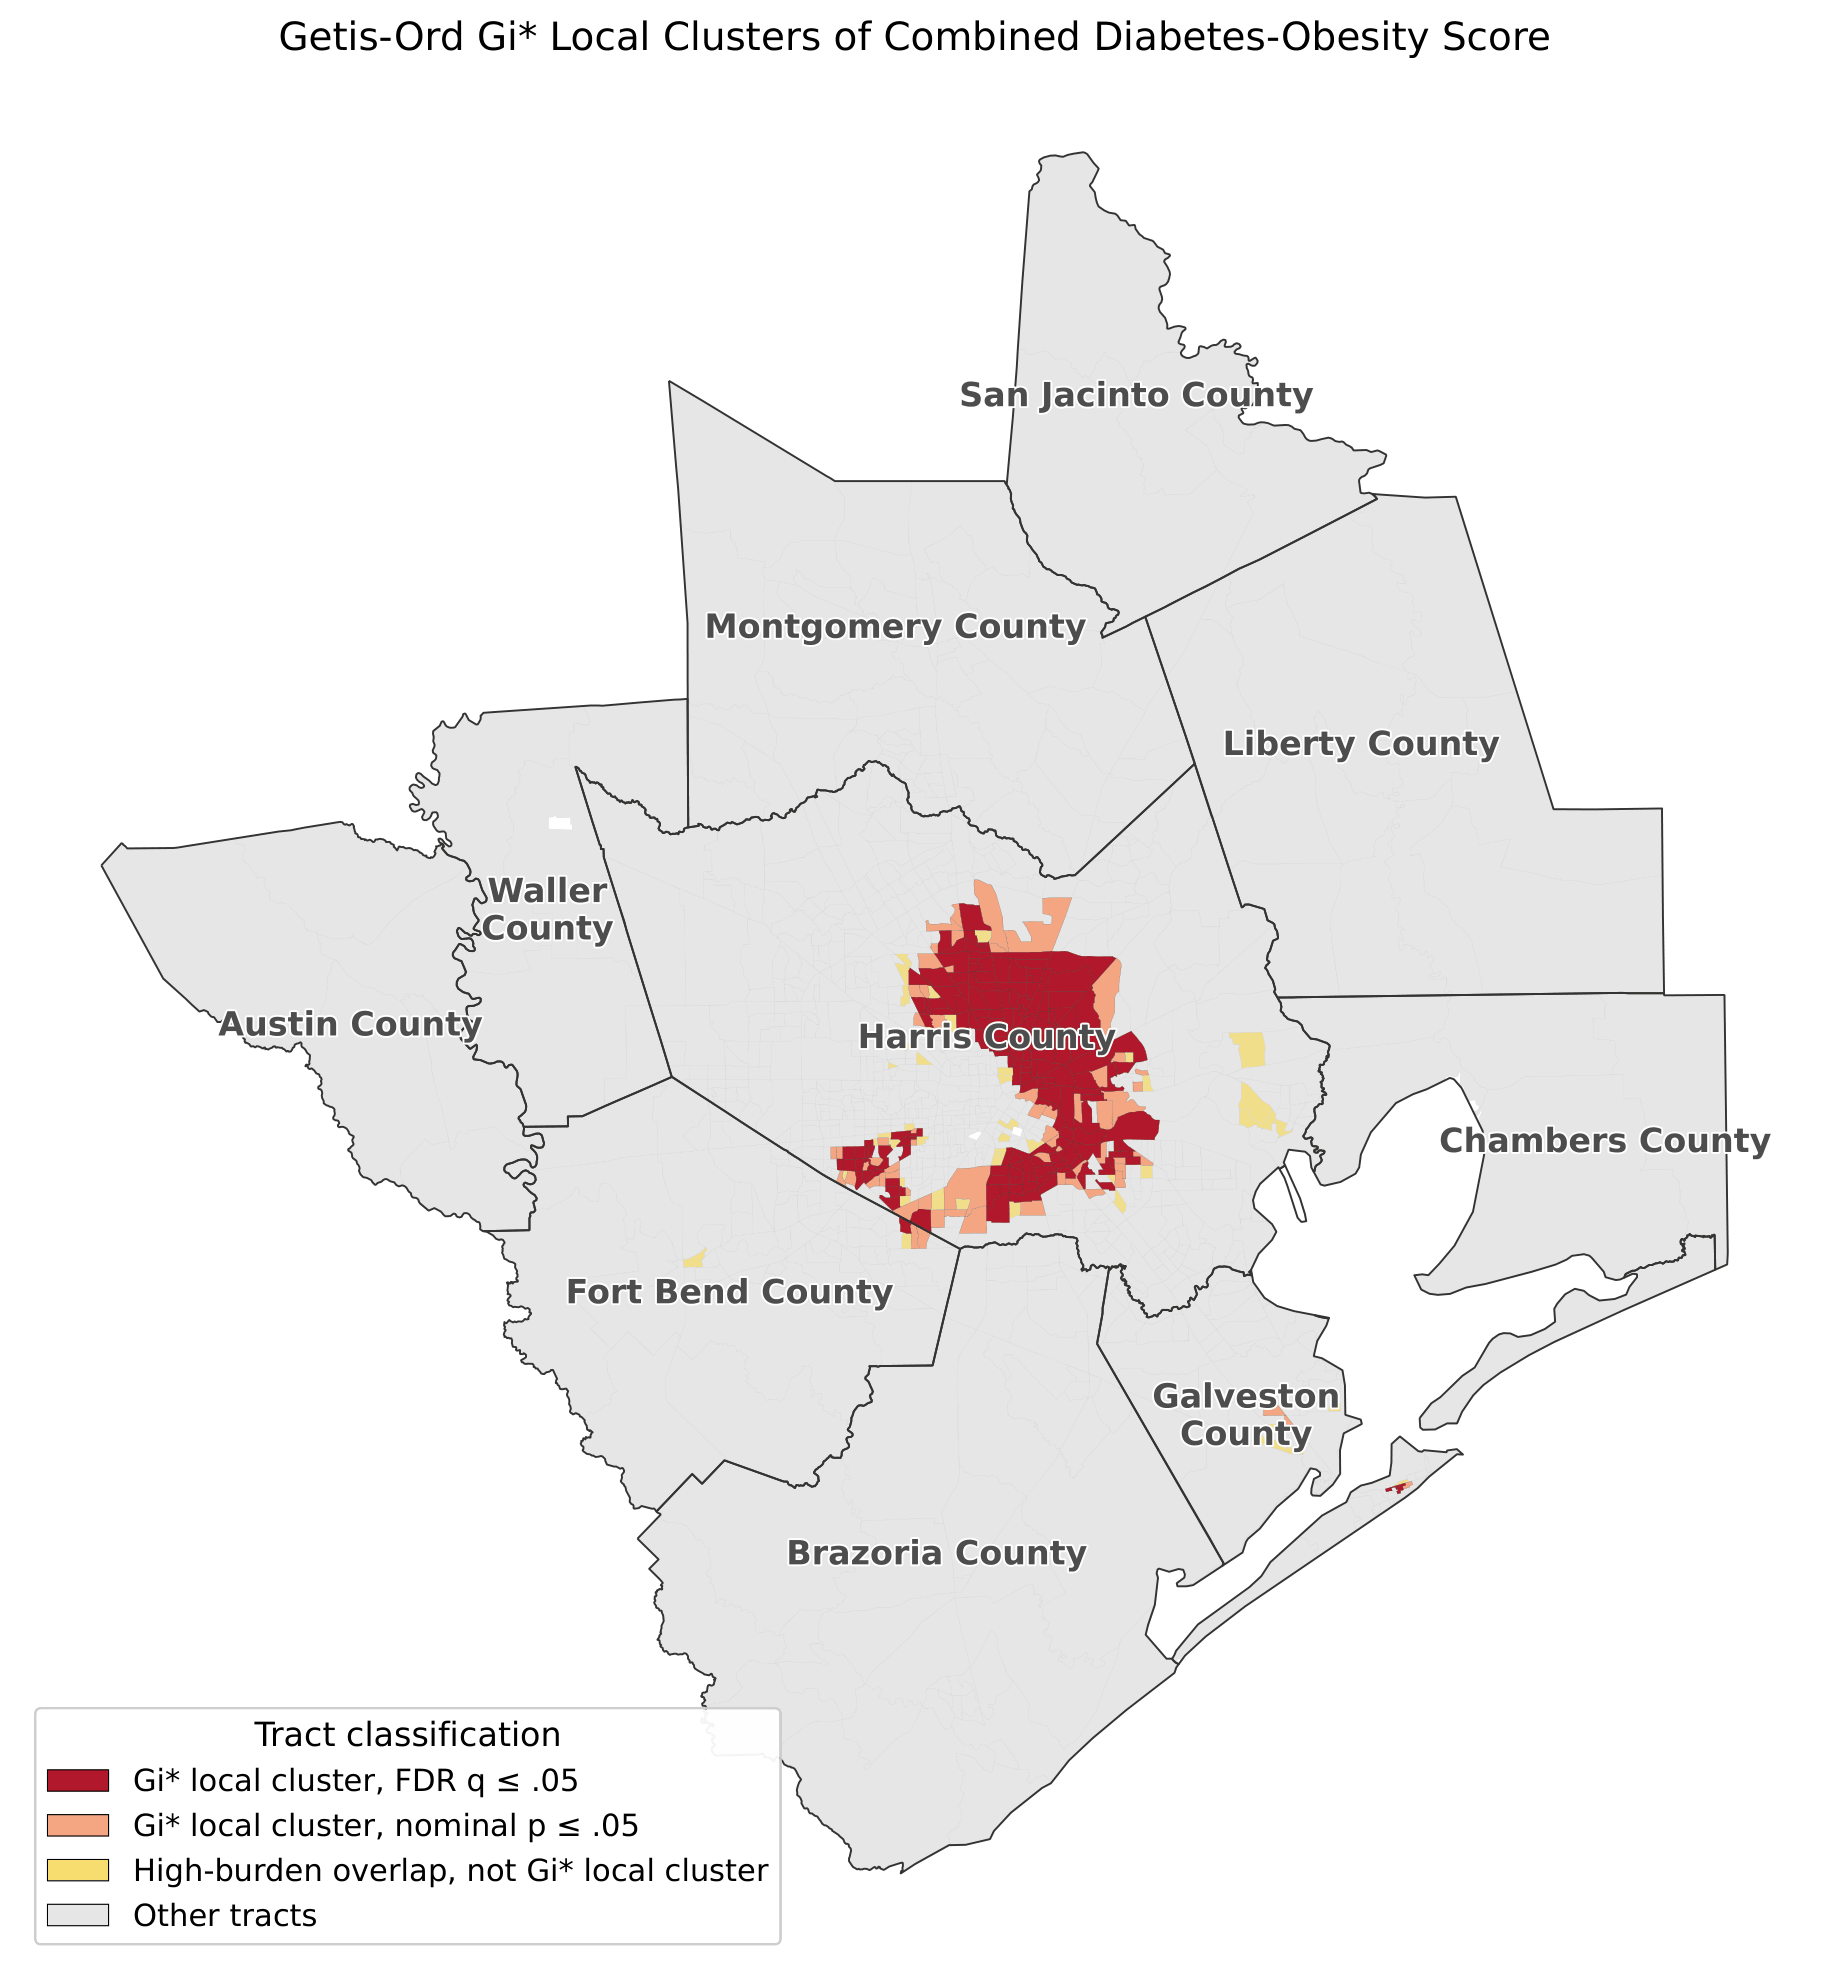
The continuous combined score showed strong overall spatial autocorrelation (Global Moran’s I = 0.719, P = .001, z = 42.18; Figure 7). This means that the tracts with similar combined scores tended to be located near one another as opposed to being randomly distributed across the study area. Local Getis-Ord Gi* analysis identified 232 nominal high-cluster tracts, of which 170 remained significant after Benjamini-Hochberg FDR adjustment (Figure 8). The median combined score was 0.519 inside FDR-significant high clusters compared with 0.285 outside those tracts, demonstrating that the local clusters captured areas with substantially higher combined burden.
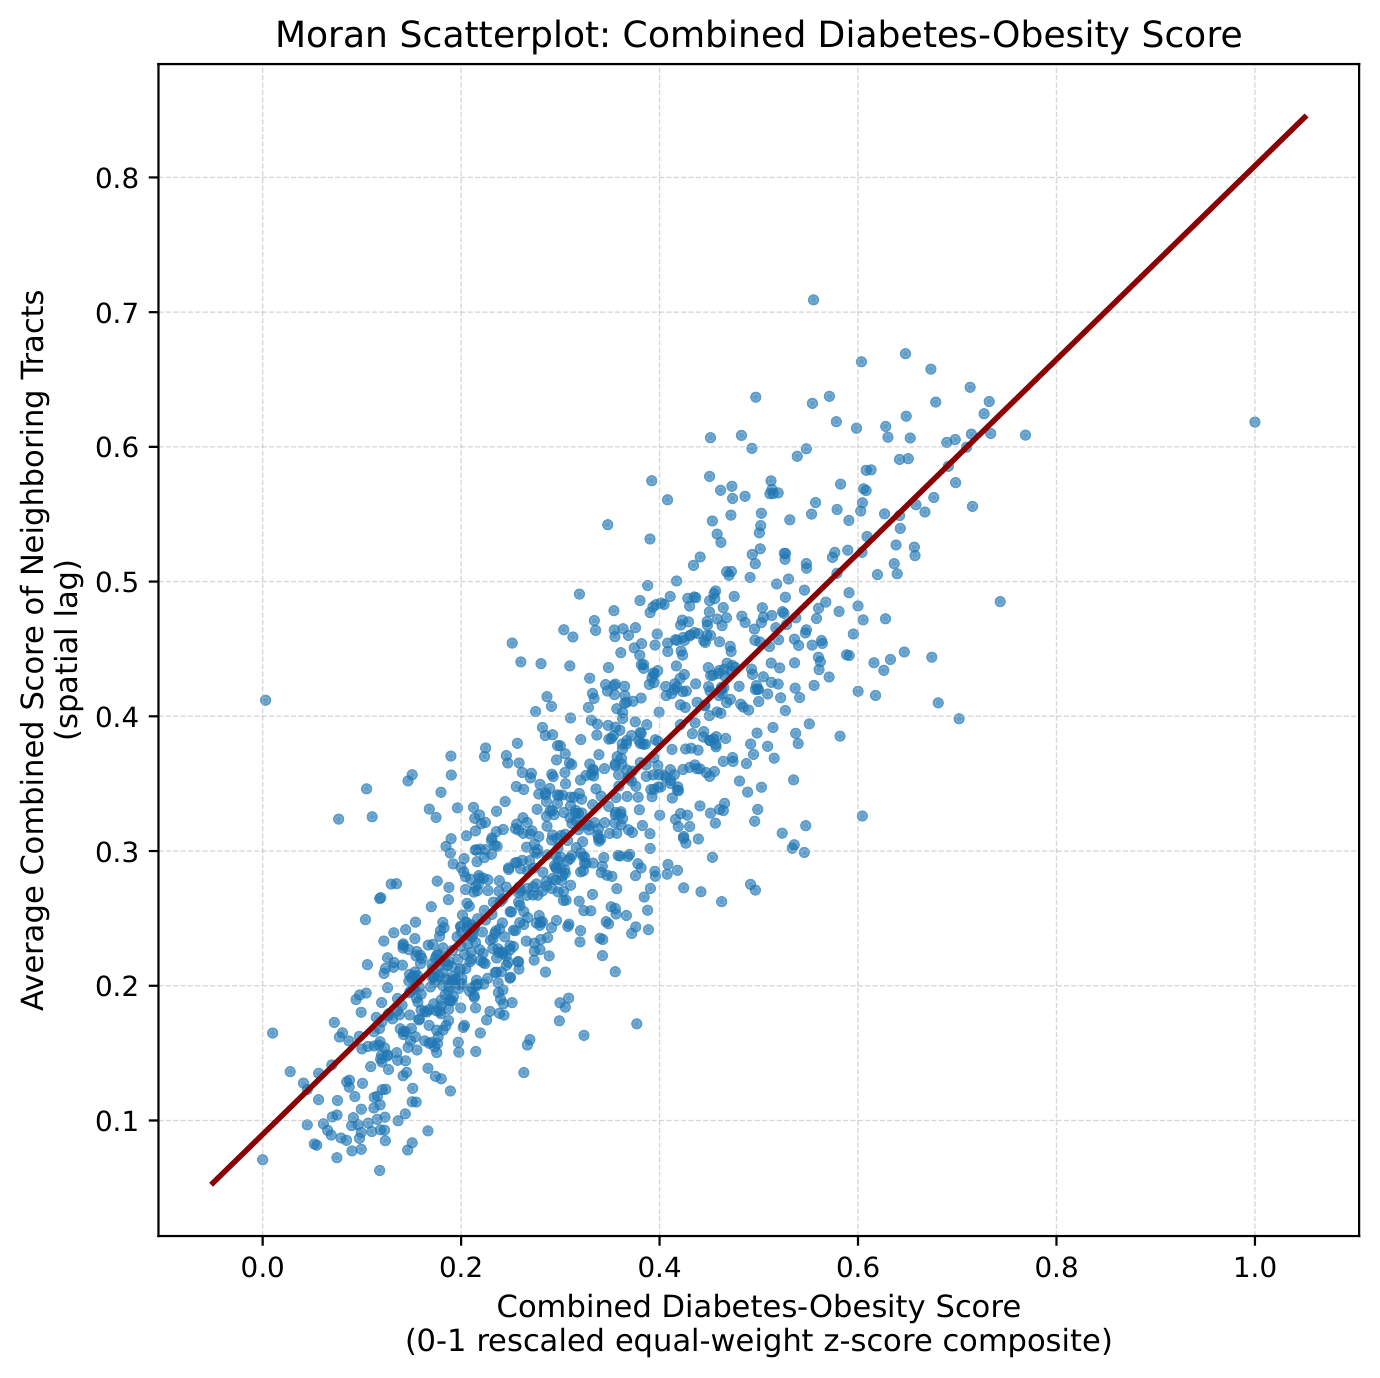
meaning that high-score tracts tended to be near other high-score tracts and low-score tracts tended to be near other low-score tracts.
The spatial clustering results were similar across most neighbor definitions (Table 4). Queen, Rook, KNN-4, and KNN-8 weights all showed strong clustering, with Moran’s I values from 0.71 to 0.76. The distance-band method used a wider neighborhood definition, connecting each tract to many more nearby tracts, with an average of 286.21 neighbors per tract. Because this method tested clustering at a broader regional scale, its Moran’s I value was lower at 0.073, although it remained statistically significant. Therefore, the distance-band Gi* result should be interpreted as a broad regional pattern, not the same type of local cluster result shown by the other neighbor definitions.
| Weight Type | Moran’s I | Z-Score | Gi* Nominal High | Gi* FDR High |
| Queen contiguity | 0.719 | 42.18 | 232 | 170 |
| Rook contiguity | 0.737 | 38.48 | 214 | 122 |
| KNN, k = 4 | 0.761 | 38.79 | 207 | 107 |
| KNN, k = 8 | 0.712 | 50.47 | 292 | 227 |
| Distance band | 0.073 | 14.99 | 491 | 477 |
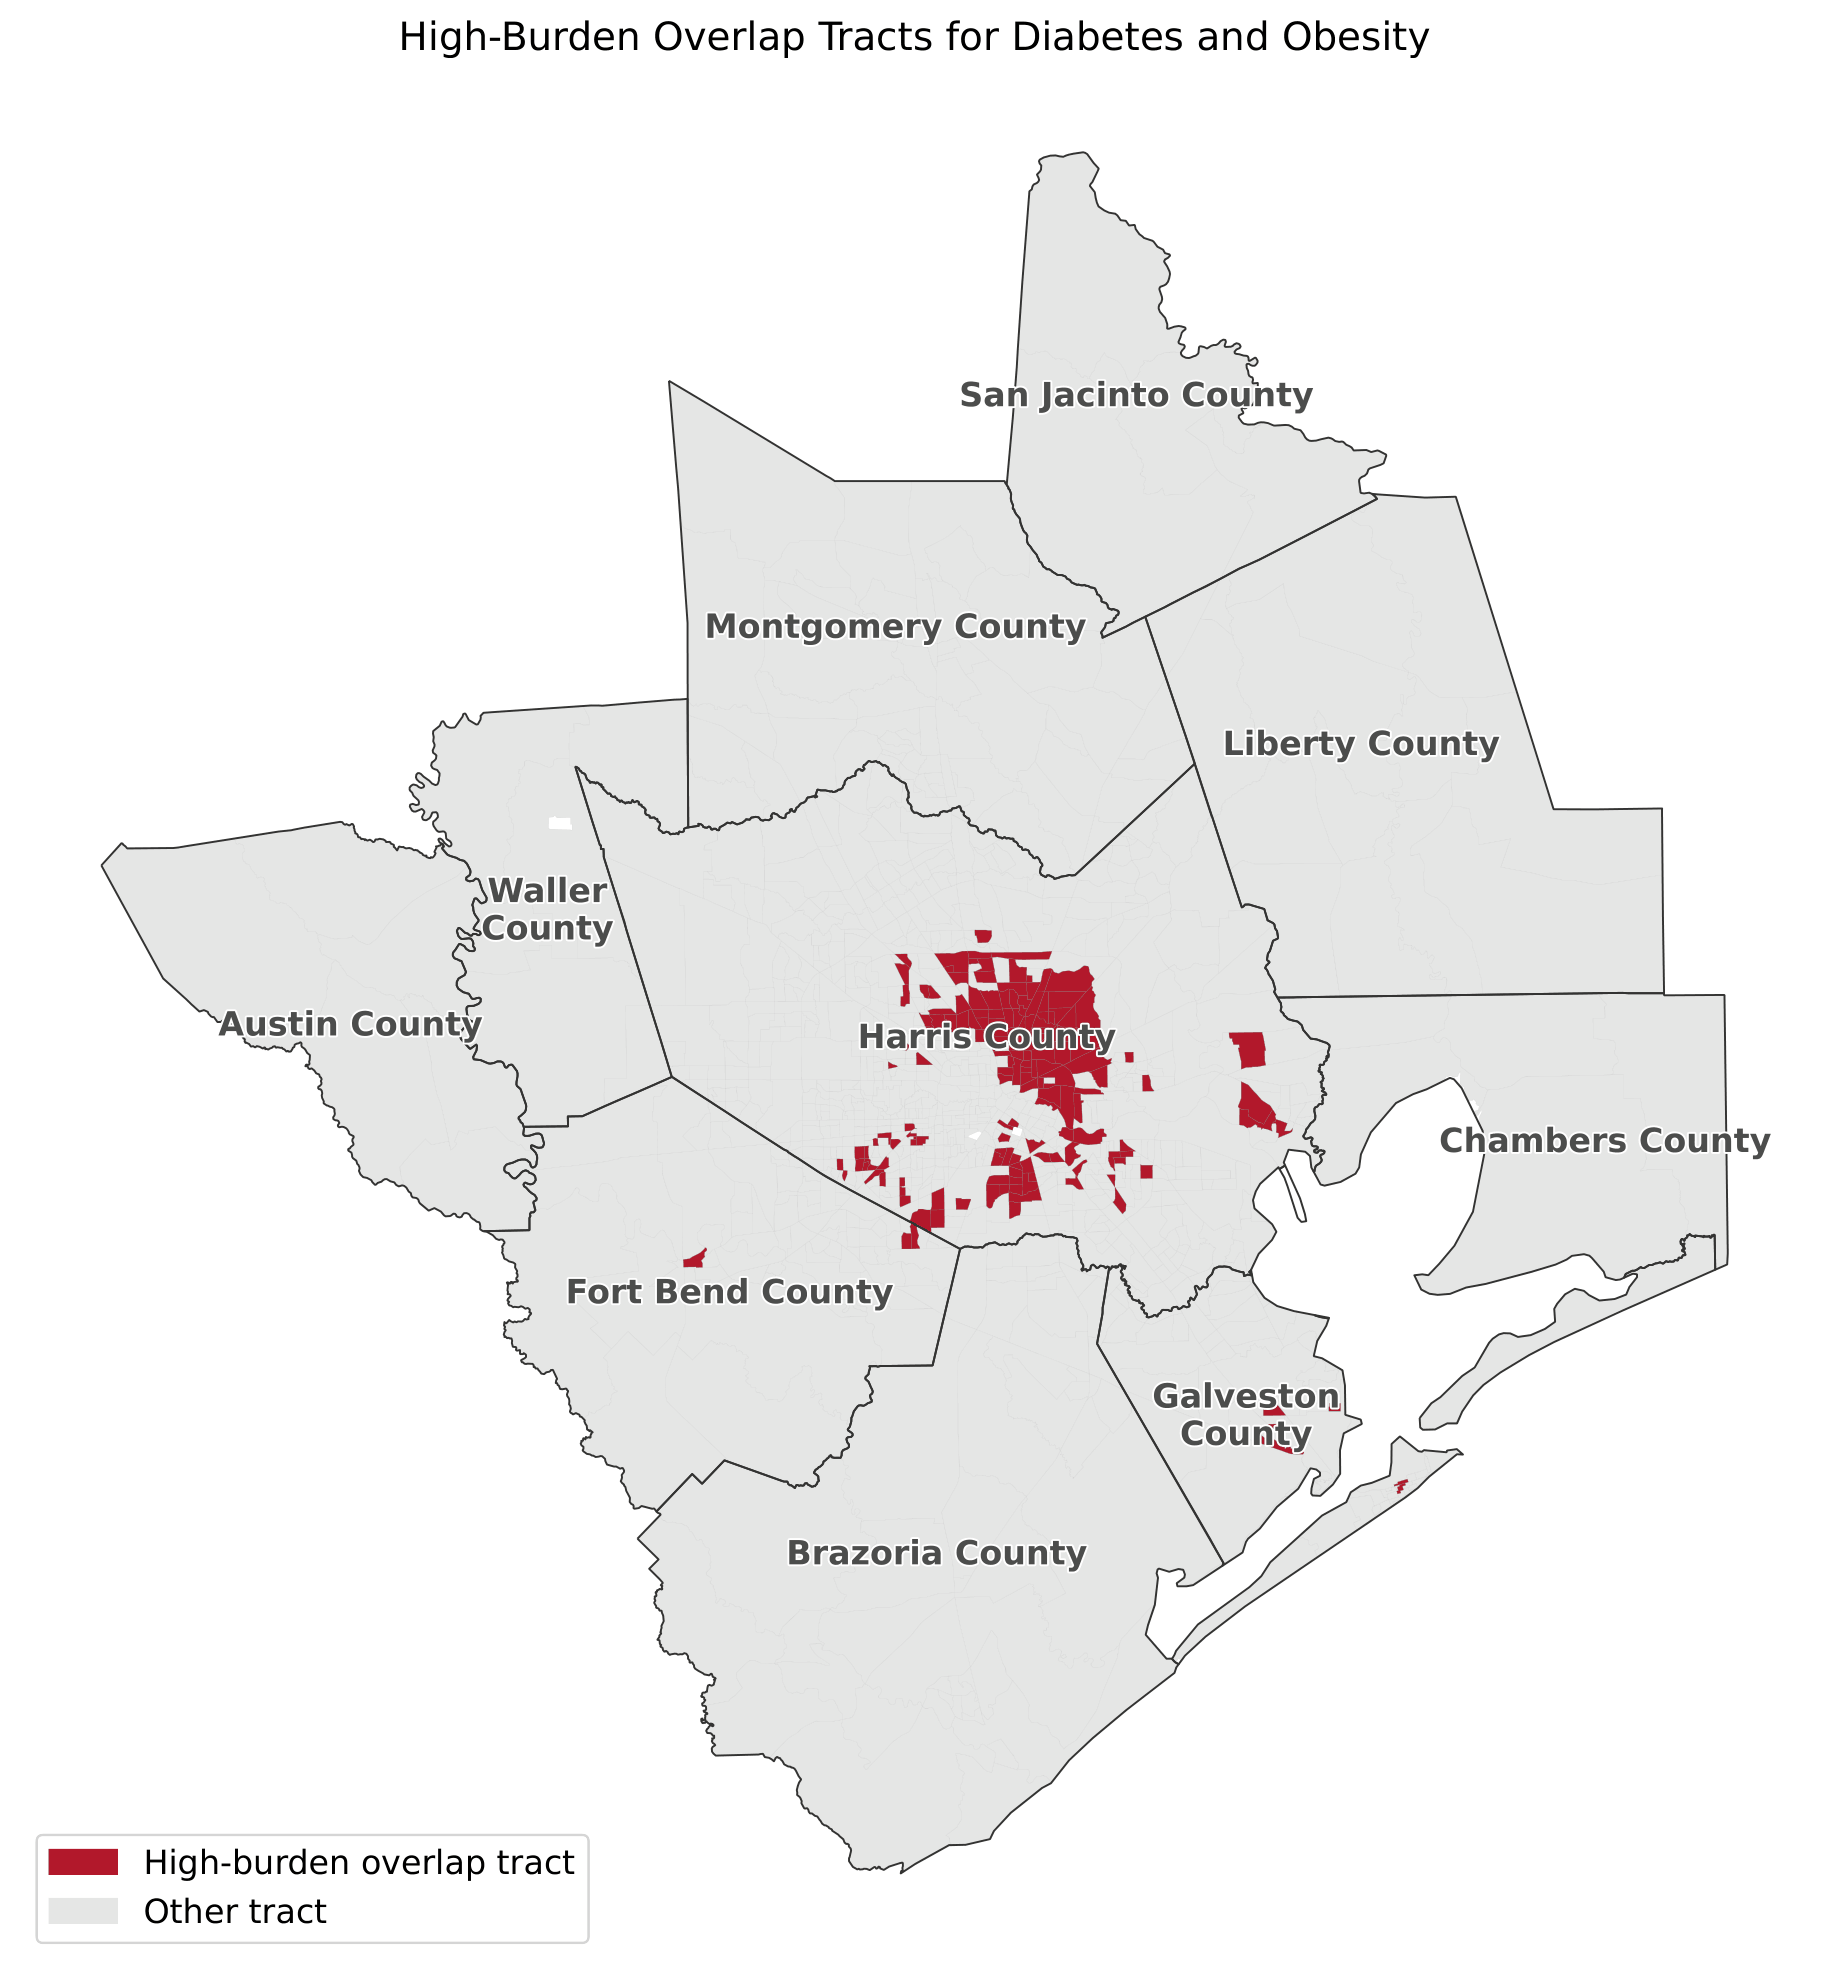
The 80th-percentile cutoff was 17.22% for diabetes and 42.5% for obesity, identifying 214 high diabetes burden tracts and 217 high obesity burden tracts, respectively. Of these, 163 tracts met both criteria and were classified as high-burden overlap tracts (Figure 9). This observed overlap far exceeded the 43.4 tracts expected under independence (enrichment ratio = 3.75; Jaccard overlap = 0.608; Table 5). A blocked permutation test that preserved county and urban or rural structure placed the observed overlap far beyond its null distribution (mean permuted overlap = 52.8; 95th percentile = 62; maximum = 74; P < .001; Table 5). The high-burden overlap result was stable across cutoff values. The observed overlap stayed more than three times the expected value at the 75th-percentile (observed = 214; expected = 69.2; enrichment ratio = 3.09), 80th-percentile (observed = 163; expected = 43.4; enrichment ratio = 3.75), and 85th-percentile (observed = 118; expected = 24.7; enrichment ratio = 4.78), with blocked permutation P < .001 at each cutoff (Table 6).
| Observed high-burden overlap tracts | 163 |
| Expected overlap under independence | 43.4 |
| Enrichment ratio (observed / expected) | 3.75 |
| Jaccard overlap | 0.608 |
| Blocked permutation null distribution | mean = 52.8; 95th percentile = 62; maximum = 74 |
| Blocked permutation P value | < .001 |
| Threshold | Observed Overlap | Expected Overlap | Enrichment | Jaccard |
| 75th-percentile | 214 | 69.2 | 3.09 | 0.648 |
| 80th-percentile | 163 | 43.4 | 3.75 | 0.608 |
| 85th-percentile | 118 | 24.7 | 4.78 | 0.570 |
Discussion
The present study used the continuous combined diabetes-obesity score as the primary measure to evaluate tract-level diabetes-obesity burden across Greater Houston. Estimated diabetes and obesity prevalence were strongly related across tracts, and the continuous combined score showed clear alignment with social vulnerability, low-income status, and spatial clustering. The secondary high-burden overlap analysis indicated that the high diabetes and high obesity estimates appeared together in the same tracts far more often than expected under independence. These results jointly showed that the combined diabetes-obesity burden in Greater Houston was not evenly distributed across census tracts.
The continuous combined score showed a strong relationship with social vulnerability. It rose steadily across SVI quartiles and showed a strong positive Spearman correlation with the SVI percentile scores. These results were in line with prior studies5,6, which showed that chronic disease burden is often higher in areas with greater neighborhood socioeconomic disadvantage. The PLACES estimates and SVI both draw on area-level demographic and socioeconomic information; hence, this finding should be interpreted as alignment between two area-level measures, not as an independent cause-and-effect relationship. The results also showed that low-income status was more clearly related to the continuous combined score than low-access status alone. When the median scores were compared directly, the continuous combined diabetes-obesity score was higher in low-income tracts and LILA tracts, but was not higher if the low-access tracts were considered alone. In the multivariable model that separated the USDA indicator components, low-income status also had a larger coefficient than low-access status. Therefore, the higher continuous combined score observed in the LILA tracts appeared to reflect the low-income component more strongly than the low-access component and should not be interpreted as being related to food access alone.
The continuous combined diabetes-obesity score was also spatially clustered. Global Moran’s I showed that nearby tracts tended to have similar combined scores, and Getis-Ord Gi* identified local areas where higher combined scores were concentrated. The sensitivity analysis showed that this pattern remained strong with Queen, Rook, KNN-4, and KNN-8 weights. The lower distance-band Moran’s I value showed that spatial findings depended on how neighboring tracts were defined, especially when a method connected each tract to a much larger set of neighbors. In the maps, Harris County did not appear to have a uniformly high combined diabetes-obesity score. Instead, the higher combined diabetes-obesity scores were concentrated in parts of the Houston urban core, where many tracts also showed higher SVI. The maps also showed some higher-burden tracts outside of Harris County, so the finding was not restricted to Harris County alone. Thus, high combined burden appeared at the neighborhood level, not across an entire county.
The high-burden overlap tract analysis helped answer a different question than the analyses that utilized the continuous combined score. The continuous combined score measured the full range of the combined diabetes-obesity burden across all tracts, whereas the high-burden overlap analysis evaluated whether the high diabetes and high obesity estimates overlapped more often than expected. The observed overlap was much higher than expected under independence, and the blocked permutation test confirmed that this pattern was unlikely to be explained by county and urban or rural structure alone. The results of the 75th-, 80th-, and 85th-percentile cutoffs indicate that the overlap finding did not depend upon the exact cutoff.
Public Health Implications
Census tract-level spatial analysis can help identify candidate areas for local review, validation, and planning discussion. Because the health values are model-based, small-area estimates rather than direct measurements of tract residents, these maps should be compared with local clinical, screening, or program data before being used in planning. In Greater Houston, the tracts with higher continuous combined scores and local spatial clusters in Harris County can provide reasonable starting points for local review, but the maps should not be treated as stand-alone decision tools.
Limitations
Certain limitations may have influenced the results of the present study, and they should be addressed at this point. The CDC PLACES dataset consists of model-based prevalence estimates derived from survey data. Direct clinical measurements at the census tract-level are resource-prohibitive, and this limitation should be kept in mind when interpreting the results. The study was ecological and cross-sectional, so its findings only describe tract-level patterns that cannot be interpreted as individual-level relationships or cause-and-effect relationships. Thus, a person living in a certain tract of Greater Houston with a higher modeled continuous combined score should not be assumed to have diabetes or obesity.
The strong relationship between SVI and the continuous combined diabetes-obesity score should also be interpreted cautiously. PLACES estimates and SVI both use area-level demographic and socioeconomic information, so part of this relationship may reflect shared underlying inputs. The analysis therefore describes tract-level alignment between the modeled continuous combined score and social vulnerability, not an independent causal effect of SVI.
Results also depend upon the census-tract scale and tract boundary definitions, reflecting an issue known as the Modifiable Areal Unit Problem. A different geographic unit, such as block groups, ZIP codes, or counties, could yield different estimates. Because neighboring tracts tend to have similar conditions, simple tract-level tests that assume independent observations may not offer the main bases for inference. The main findings utilize multivariable models with county controls, county-clustered standard errors, and a neighbor-average spatial-lag covariate, along with permutation-based tests. Thus, the reported medians, correlations, model coefficients, and spatial maps should be considered jointly rather than relying on P values.
The harmonization of datasets required the translation of census tract boundaries from the 2020 to 2010 definitions using area-based weighting. This crosswalk may have introduced some approximations that affected the results. The USDA low-income, low-access, and LILA indicator flags only represented limited measures of income and food access conditions, but did not capture food affordability, food quality, household food insecurity, transportation reliability, or individual shopping behavior. LILA was therefore interpreted as a combined income-and-access measure, and the low-income and low-access components were examined separately.
Finally, the 80th-percentile cutoff used to define high-burden overlap tracts was neither a clinical threshold nor a national public health benchmark. It was only used to test whether high diabetes and high obesity estimates appeared in the same tracts more often than expected under independence. Threshold sensitivity analyses showed that the observed overlap remained more than three times the expected overlap at the 75th-, 80th-, and 85th-percentiles.
Conclusion and Future Work
The present study found that estimated diabetes and obesity prevalence were strongly related across Greater Houston census tracts, and that higher continuous combined diabetes-obesity scores were spatially clustered. The continuous combined score was more consistently aligned with social vulnerability and low-income status, while low-access status alone showed a weaker and less consistent pattern. The secondary high-burden overlap analysis showed that high diabetes and high obesity appeared in the same tracts more often than expected under independence. These findings support tract-level mapping as a tool for local review, validation, and planning discussion, while being limited to ecological, cross-sectional, modeled estimates.
Future research could strengthen the findings of the present study. Longitudinal studies could evaluate whether changes in neighborhood socioeconomic conditions or food environments are associated with changes in the diabetes-obesity burden or its spatial patterns over time. Other neighborhood indicators, such as physical inactivity and access to health care services, could be studied to better understand the observed patterns. Additional spatial analyses using alternative local cluster definitions could help identify smaller subregional trends within Greater Houston. A larger-scale comparative study of multiple metropolitan areas could help establish whether the trends observed in Greater Houston are reflected in other large cities as well.
Acknowledgments
The author declares no potential conflicts of interest with respect to the research, authorship, or publication of this article. The author received no external financial support for the research, authorship, or publication of this article. The study design, preprocessing procedures, data processing scripts, spatial analysis, and statistical analyses were defined and conducted by the author. Coding support from Artificial Intelligence (AI) was used during software development to assist with implementation and debugging of analysis scripts in the Google Colab (Google Colaboratory) environment, including Gemini-powered coding features. All scientific objectives, dataset selection, analytic decisions, and interpretation of results were determined and verified by the author.
References
- A. Drewnowski, C. D. Rehm, D. Arterburn. The geographic distribution of obesity by census tract among 59 767 insured adults in King County, WA. International Journal of Obesity. Vol. 38, pg. 833-839, 2014, https://doi.org/10.1038/ijo.2013.179. [↩]
- A. Drewnowski, C. D. Rehm, A. V. Moudon, D. Arterburn. The geography of diabetes by census tract in a large sample of insured adults in King County, Washington, 2005-2006. Preventing Chronic Disease. Vol. 11, pg. E125, 2014, https://doi.org/10.5888/pcd11.140135. [↩]
- M. Kolak, G. Abraham, M. R. Talen. Mapping census tract clusters of type 2 diabetes in a primary care population. Preventing Chronic Disease. Vol. 16, pg. E59, 2019, https://doi.org/10.5888/pcd16.180502. [↩]
- M. D. Hu, K. G. Lawrence, M. R. Bodkin, R. K. Kwok, L. S. Engel, D. P. Sandler. Neighborhood deprivation, obesity, and diabetes in residents of the US Gulf Coast. American Journal of Epidemiology. Vol. 190, pg. 295-304, 2021, https://doi.org/10.1093/aje/kwaa206. [↩]
- G. H. Bevan, A. Pandey, S. Griggs, J. E. Dalton, D. Zidar, S. Patel, S. U. Khan, K. Nasir, S. Rajagopalan, S. Al-Kindi. Neighborhood-level social vulnerability and prevalence of cardiovascular risk factors and coronary heart disease. Current Problems in Cardiology. Vol. 48, pg. 101182, 2023, https://doi.org/10.1016/j.cpcardiol.2022.101182. [↩] [↩]
- B. S. Schwartz, M. Kolak, J. S. Pollak, M. N. Poulsen, K. Bandeen-Roche, K. A. Moon, J. DeWalle, K. R. Siegel, C. I. Mercado, G. Imperatore, A. G. Hirsch. Associations of four indexes of social determinants of health and two community typologies with new onset type 2 diabetes across a diverse geography in Pennsylvania. PLOS ONE. Vol. 17, pg. e0274758, 2022, https://doi.org/10.1371/journal.pone.0274758. [↩] [↩]
- R. Ramphul, L. Highfield, S. Sharma. Examining neighborhood-level hot and cold spots of food insecurity in relation to social vulnerability in Houston, Texas. PLOS ONE. Vol. 18, pg. e0280620, 2023, https://doi.org/10.1371/journal.pone.0280620. [↩]
- J. Ludwig, L. Sanbonmatsu, L. A. Gennetian, E. Adam, G. J. Duncan, L. F. Katz, R. C. Kessler, J. R. Kling, S. T. Lindau, R. C. Whitaker, T. W. McDade. Neighborhoods, obesity, and diabetes: a randomized social experiment. New England Journal of Medicine. Vol. 365, pg. 1509-1519, 2011, https://doi.org/10.1056/NEJMsa1103216. [↩]
- M. S. Mujahid, A. V. Diez Roux, M. Shen, D. Gowda, B. Sanchez, S. Shea, D. R. Jacobs Jr., S. A. Jackson. Relation between neighborhood environments and obesity in the Multi-Ethnic Study of Atherosclerosis. American Journal of Epidemiology. Vol. 167, pg. 1349-1357, 2008, https://doi.org/10.1093/aje/kwn047. [↩]
- A. H. Auchincloss, A. V. Diez Roux, D. G. Brown, T. E. Raghunathan, C. A. Erdmann, A. G. Bertoni. Neighborhood resources for physical activity and healthy foods and incidence of type 2 diabetes mellitus. Archives of Internal Medicine. Vol. 169, pg. 1698-1704, 2009, https://doi.org/10.1001/archinternmed.2009.302. [↩]
- P. J. Christine, A. H. Auchincloss, A. G. Bertoni, M. R. Carnethon, B. N. Sanchez, K. Moore, S. D. Adar, T. B. Horwich, K. E. Watson, A. V. Diez Roux. Longitudinal associations between neighborhood physical and social environments and incident type 2 diabetes mellitus: the Multi-Ethnic Study of Atherosclerosis (MESA). JAMA Internal Medicine. Vol. 175, pg. 1311-1320, 2015, https://doi.org/10.1001/jamainternmed.2015.2691. [↩]
- R. S. Piccolo, D. T. Duncan, N. Pearce, J. B. McKinlay. The role of neighborhood characteristics in racial/ethnic disparities in type 2 diabetes: results from the Boston Area Community Health (BACH) Survey. Social Science & Medicine. Vol. 130, pg. 79-90, 2015, https://doi.org/10.1016/j.socscimed.2015.01.041. [↩]
- R. Kanchi, P. Lopez, P. E. Rummo, D. C. Lee, S. Adhikari, M. D. Schwartz, S. Avramovic, K. R. Siegel, D. B. Rolka, G. Imperatore, B. Elbel, L. E. Thorpe. Longitudinal analysis of neighborhood food environment and diabetes risk in the Veterans Administration Diabetes Risk Cohort. JAMA Network Open. Vol. 4, pg. e2130789, 2021, https://doi.org/10.1001/jamanetworkopen.2021.30789. [↩]
- B. Mezuk, X. Li, K. Cederin, K. Rice, J. Sundquist, K. Sundquist. Beyond access: characteristics of the food environment and risk of diabetes. American Journal of Epidemiology. Vol. 183, pg. 1129-1137, 2016, https://doi.org/10.1093/aje/kwv318. [↩]
- L. E. Thorpe, S. Adhikari, P. Lopez, R. Kanchi, L. A. McClure, A. G. Hirsch, C. R. Howell, A. Zhu, F. Alemi, P. Rummo, E. L. Ogburn, Y. Algur, C. M. Nordberg, M. N. Poulsen, L. Long, A. P. Carson, S. A. DeSilva, M. Meeker, B. S. Schwartz, D. C. Lee, K. R. Siegel, G. Imperatore, B. Elbel. Neighborhood socioeconomic environment and risk of type 2 diabetes: associations and mediation through food environment pathways in three independent study samples. Diabetes Care. Vol. 45, pg. 798-810, 2022, https://doi.org/10.2337/dc21-1693. [↩]
- C. D. Zick, D. S. Curtis, H. Meeks, K. R. Smith, B. B. Brown, K. Kole, L. Kowaleski-Jones. The changing food environment and neighborhood prevalence of type 2 diabetes. SSM – Population Health. Vol. 21, pg. 101338, 2023, https://doi.org/10.1016/j.ssmph.2023.101338. [↩]
- J. I. Oh, K. J. Lee, A. Hipp. Food deserts exposure, density of fast-food restaurants, and park access: exploring the association of food and recreation environments with obesity and diabetes using global and local regression models. PLOS ONE. Vol. 19, pg. e0301121, 2024, https://doi.org/10.1371/journal.pone.0301121. [↩]
- R. Xu, X. Huang, K. Zhang, W. Lyu, D. Ghosh, Z. Li, X. Chen. Integrating human activity into food environments can better predict cardiometabolic diseases in the United States. Nature Communications. Vol. 14, pg. 7326, 2023, https://doi.org/10.1038/s41467-023-42667-8. [↩]
- K. Cooksey-Stowers, M. B. Schwartz, K. D. Brownell. Food swamps predict obesity rates better than food deserts in the United States. International Journal of Environmental Research and Public Health. Vol. 14, pg. 1366, 2017, https://doi.org/10.3390/ijerph14111366. [↩]
- A. Dornelles. Impact of multiple food environments on body mass index. PLOS ONE. Vol. 14, pg. e0219365, 2019, https://doi.org/10.1371/journal.pone.0219365. [↩]
- H. Huang. A spatial analysis of obesity: interaction of urban food environments and racial segregation in Chicago. Journal of Urban Health. Vol. 98, pg. 676-686, 2021, https://doi.org/10.1007/s11524-021-00553-y. [↩]
- W. S. Brakefield, O. A. Olusanya, A. Shaban-Nejad. Association between neighborhood factors and adult obesity in Shelby County, Tennessee: geospatial machine learning approach. JMIR Public Health and Surveillance. Vol. 8, pg. e37039, 2022, https://doi.org/10.2196/37039. [↩]
- B. M. Dahu, S. Khan, I. E. Toubal, M. Alshehri, C. I. Martinez-Villar, O. B. Ogundele, L. R. Sheets, G. J. Scott. Geospatial modeling of deep neural visual features for predicting obesity prevalence in Missouri: quantitative study. JMIR AI. Vol. 3, pg. e64362, 2024, https://doi.org/10.2196/64362. [↩]
- M. Osorio, C. A. Koziatek, M. P. Gallagher, J. Recaii, M. Weinstein, L. E. Thorpe, B. Elbel, D. C. Lee. Concordance and discordance in the geographic distribution of childhood obesity and pediatric type 2 diabetes in New York City. Academic Pediatrics. Vol. 20, pg. 809-815, 2020, https://doi.org/10.1016/j.acap.2020.03.012. [↩]
- B. A. Laraia, A. J. Karter, E. M. Warton, D. Schillinger, H. H. Moffet, N. Adler. Place matters: neighborhood deprivation and cardiometabolic risk factors in the Diabetes Study of Northern California (DISTANCE). Social Science & Medicine. Vol. 74, pg. 1082-1090, 2012, https://doi.org/10.1016/j.socscimed.2011.11.036. [↩]
- B. Mezuk, A. Chaikiat, X. Li, J. Sundquist, K. S. Kendler, K. Sundquist. Depression, neighborhood deprivation and risk of type 2 diabetes. Health & Place. Vol. 23, pg. 63-69, 2013, https://doi.org/10.1016/j.healthplace.2013.05.004. [↩]
- J. Boone-Heinonen, A. V. Diez Roux, D. C. Goff, C. M. Loria, C. I. Kiefe, B. M. Popkin, P. Gordon-Larsen. The neighborhood energy balance equation: does neighborhood food retail environment plus physical activity environment equal obesity? The CARDIA Study. PLOS ONE. Vol. 8, pg. e85141, 2013, https://doi.org/10.1371/journal.pone.0085141. [↩]
- L. E. Egede, R. J. Walker, S. Linde. Association between population level social risk factors and prevalence of diabetes. BMC Health Services Research. Vol. 25, pg. 1252, 2025, https://doi.org/10.1186/s12913-025-13479-x. [↩]
- Centers for Disease Control and Prevention. PLACES: Local Data for Better Health, Census Tract Data, 2025 release. https://data.cdc.gov/500-Cities-Places/PLACES-Local-Data-for-Better-Health-Census-Tract-D/cwsq-ngmh, 2025. [↩]
- A. Y. Kong, X. Zhang. The use of small area estimates in place-based health research. American Journal of Public Health. Vol. 110, pg. 829-832, 2020, https://doi.org/10.2105/AJPH.2020.305611. [↩]
- Centers for Disease Control and Prevention/Agency for Toxic Substances and Disease Registry/Geospatial Research, Analysis, and Services Program. CDC/ATSDR Social Vulnerability Index 2022 Database, United States. https://www.atsdr.cdc.gov/place-health/php/svi/svi-data-documentation-download.html, 2024. [↩]
- U.S. Department of Agriculture, Economic Research Service. 2019 Large Retailer Access Map (LRAM), formerly known as the Food Access Research Atlas (FARA), Data. https://www.ers.usda.gov/data-products/food-access-research-atlas/download-the-data, 2021. [↩]
- U.S. Census Bureau. 2020 Census Tract to 2010 Census Tract Relationship File. https://www.census.gov/geographies/reference-files/2020/geo/relationship-files.html, 2020. [↩]
- U.S. Census Bureau. 2010 Census Tracts, Texas, 1:500,000 cartographic boundary file (gz_2010_48_140_00_500k). https://www2.census.gov/geo/tiger/GENZ2010/gz_2010_48_140_00_500k.zip, 2012. [↩]