
Abstract
In summer 2025, a local New York Community Reinvestment Act (CRA) organization and a group of lenders asked our team to survey 406 small business (with 100 or fewer employees) in the most populous counties in New York. In keeping with the spirit of the CRA, our study looked at credit availability for diverse small businesses in low-to-moderate income (LMI) neighborhoods in these counties. To do this, we used a range of methods: in-person interviews, phone calls and Google Form surveys. We think capital availability for small business, a key focus of the CRA, depends on broader political and economic factors. Drawing on quantitative data, we looked at the impact of macroeconomic factors, such as inflation, tariffs and geopolitical risk, on considerations of borrowing in the financial centers of New York’s urban counties. To examine responses, we tested for a plurality (P0=0.40) of each consideration in the selections. We then produced 95% confidence interval around the proportions. When we weighted the three most common considerations, one stood out as the key concern for many of the businesses in our survey. We thought that, in these communities, if small businesses with a need for financing were asked to consider their main concerns in borrowing, more than the plurality would point to one macroeconomic factor. Our survey found a “two-tier” set of considerations for small businesses in New York’s urban counties. Depending on their own industrial and operational circumstances, different socioeconomic factors will rank higher for different businesses. But in this particular environment of rising interest rates over several years, the financial environment, particularly the government monetary policy/lending interest rate, was a key consideration for borrowing in these communities.
Keywords: community reinvestment, small business, inflation, tariff, immigration, monetary policy.
Introduction
The CRA1 is a key U.S. federal legislation intended to spur credit in LMI neighborhoods and elsewhere in the communities where banks and savings associations are chartered. In part, it was intended to counter concern that in some areas, financial institutions were not providing sufficient financing and services. Small businesses support community stability, job creation and economic growth. According to New York annual report on the state of small business, in 2024, 94% of New York businesses had fewer than 100 employees, with 92.7% of the total having fewer than 25 employees. In summer 2025, under the New York banking law, the New York Alliance and a number of local lenders organized a CRA lending event for local businesses eligible for CRA loans. 2025 FED Small Business Organization research shows that 32% of the New York small business had difficulty obtaining credit, higher than 28% of the overall United States. By asking our survey respondents about macroeconomic and political factors2 that affect the financing considerations3 and challenges of small businesses, local lender could get a sense of credit availability under the CRA. In turn, this could help local financial institutions better meet the needs of their communities in difficult economic times. Of the 500,994 private small businesses in New York State, 406 with 100 or fewer employees in the five most populous boroughs (Kings County, Manhattan, Queens County, Nassau County and Suffolk County) responded to a question about the key socioeconomic factors impacting their financing considerations. This survey by the New York Alliance was designed to answer the question of how socioeconomic determinants shape small business credit access under the CRA framework in New York urban area. Ahead of the survey, we hypothesized that a small number of underlying factors with more than 40% of responses (P0=0.40) would dominate small businesses’ borrowing considerations. In particular, they would reflect common concerns among businesses who need financing. But in the high interest rate environment in the boroughs where we conducted the survey, the industrial makeup of our sample, our methods and the economic environment could well color the findings through an industrial lens and with a strong element of recency. Our questionnaire was developed over time, from observation in the pilot survey to statistical testing in the main survey. In order to avoid bias in our sample and get as wide a response as possible across sectors of small business, we used an essentially quantitative study, supplemented by secondary qualitative findings from interviews, phone calls and online forms.
Methods
Pilot Survey
To support content validity of the survey instrument, a pilot was undertaken using an archive of small business loan applications (n=152) to local lenders in 2023 and 2024. In this pilot, the study included all loan applications over the two-year period for which the institutions had identified socioeconomic factors affecting borrowing and operational capacity in their applicants’ businesses. In the original loan applications, small business owners were asked in an open-ended question to identify socioeconomic factors affecting their borrowing and operational capacity. Using content analysis of these 152 open-ended responses, a range of raw challenges was identified. To explore further the socioeconomic drivers of borrowing in these applications, two coders hired by New York Alliance used a structured qualitative content analysis of the open-ended responses. Each of the 152 loan applications in the archive included an open-ended question. The coders, who were familiar with commercial financial data, used a codebook with clear definitions of each code. They applied this to the open-ended responses and grouped them into macro-environmental themes. Inter-coder reliability (ICR) was evaluated to avoid bias in the interpretation of the responses and to ensure consistency between them. Overall, the coding of the open-ended responses was highly consistent (91.4%). Cohen’s Kappa (Қ) between them was 0.84, above the typical thresholder (0.80) for good qualitative concordance4. Very occasionally the coders disagreed about particular points in the responses. Where this occurred, they discussed these to reach agreement on a final set of socioeconomic factors.
Survey Design
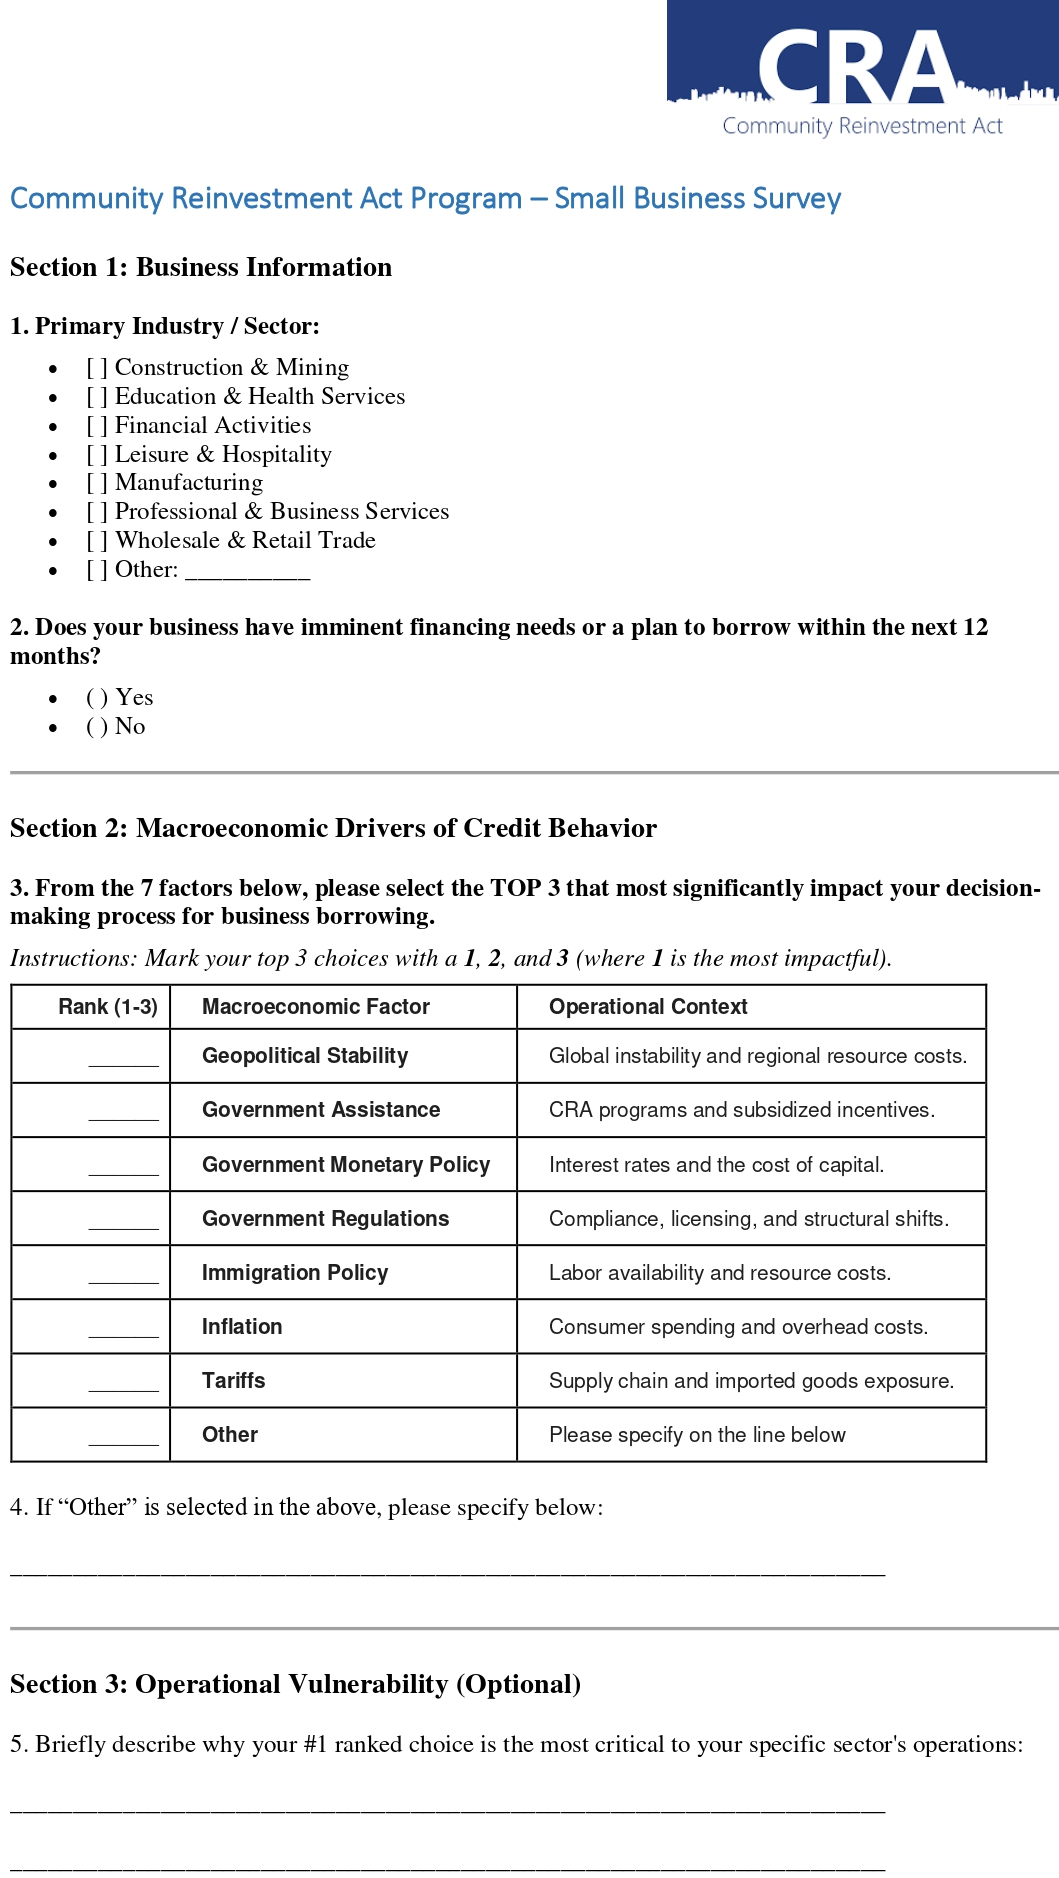
In the pilot study of the credit applications of 152 small businesses in the New York metropolitan area, we developed a list of factors thought to impact their borrowing and credit decisions. From this list, we developed a short set of seven pre-defined factors, that is geopolitical stability5 (no military conflicts, trade wars or diplomatic crises), government assistance program, government monetary policy6 (actions of the central bank to drive borrowing costs and inflation), government regulations, immigration policy7, inflation8, tariff9. To determine which of these factors was most salient across applicants, we used a criterion of frequency of mention. Only factors mentioned by more than 15% of applicants were included. This produced seven mutually exclusive and highly prevalent variables to build a foundation for the survey instrument. In this pilot, we used only credit applications that had already been submitted. Our primary survey (N=406) was therefore independent of these applicants. None of them could have participated in the survey, so there would have been no risk of selection or testing bias10.
Our purpose in developing this survey was to find out which socioeconomic factors most affected credit decisions and borrowing behavior of small businesses in the New York urban area. Rather than testing theoretical factors, we wanted to focus on constraints raised in their credit files. To do this we asked respondents to rank their top three constraints. Of the 406, 93.8% of concerns fell into the top five factors. In a list such as this, we knew it was unlikely all factors would be selected as “important,” so we included rankings. In this way, unlike a Likert scale11 where every factor can be “important,” we could pick up an importance hierarchy. In the end, “government monetary policy/lending interest rate” was the concern driving borrowing decisions in most of our respondents (96%). In designing the industrial section of this inquiry, we noticed different sectors of our pilot survey were interested in different products of lending. We therefore included a section of our questionnaire to test the assumption that, across sectors, they would face similar drivers, but at different degrees. Thus, we could link socioeconomic driver to a business’ operational vulnerability12, which is the structural susceptibility of a business to external disruptions.
Data Collection
For this study, our sampling frame was small businesses in five counties in New York: Manhattan, Kings, Queens, Nassau and Suffolk. Specifically, we took names from the local White Pages and commercial registries. To save time, we carried out in-person interviews on well-known commercial streets in each county. Where we used mail and phone surveys, we took a random script of businesses from each county’s listing. Because of resource constraints for the survey team, we did not seek a particular number of responses from each county. Instead we kept collecting responses until we had 406 in total.
Over four weeks, we used a combination of phone, online form and in-person approaches to survey the 406 respondents. At the heart of our data collection was the in-person interview at the CRA summer lending event. Here, we felt we could pick up more qualitative nuance13 of the socioeconomic driver than we could in, for example, a paper or online questionnaire. Through the interview, the research team could explain, for example, government monetary policy, and could be sure we were speaking to the decision-maker in the business. In-person interview yielded higher response rate than phone and online form. And in these interviews, the “Other” question gave us more detailed information about operational vulnerability, because the research team could ask more about the vulnerabilities in each sector.
To add more sectors and geography to our research, we used phone interviews to approach businesses. Telephone was a useful middle ground between the interpersonal nature of an interview and the efficiency of remotely gathering data. Most valuable about using the phone was speed and flexibility. Through it, we could enter data immediately and ensure the ranking instruction on the questionnaire were properly followed, particularly, asking people to rank their primary socioeconomic drivers. To give busy entrepreneurs an option of completing the questionnaire in a self-administered method14, we included a Google Form. Often, small business owners have many roles in their business. With the questionnaire form, they could refer to internal records or their finances when picking their primary socioeconomic drivers. In the absence of an interviewer, they might well feel more able to name, for example, immigration policy or government regulation as one of their key concerns, without feeling pressure to give an answer that might be more socially acceptable.
Taken together, the three modes of the survey enabled methodological triangulation. In other words, the mode could affect the outcome. For example, had we only used a face-to-face survey, we might well have heard more from retailers who have a shop front. Through the addition of phone and online, we got response from less accessible sectors of the economy.
Response rates differed across the three modes (Table 2). Highest was for face-to-face (95%), lowest for mail (4%). Across the three modes, we had an overall response rate of 18% and refusal rate of 82%, broadly in line with previous multi-mode small business field surveys15.
| survey mode | contacted / dispatched | completed responses | response rate | refusal rate |
|---|---|---|---|---|
| In person | 96 | 91 | 95% | 5% |
| Telephone | 850 | 262 | 31% | 69% |
| Online form | 1,300 | 53 | 4% | 96% |
| Total | 2,246 | 406 | 18% | 82% |
In conducting this survey, we followed the operational, ethical and compliance standards of institutional banking. In accordance of its outreach process, the fieldwork in this study was subject to internal risk and compliance review to ensure consumer privacy. All participants were asked for their informed consent before data was collected. They were told that participation in the survey would not affect their existing or future relationship with the institution and that the study was entirely voluntary. At the point of data entry, all responses were anonymized. No personally identifiable information (PII) was provided or passed on. In particular, account numbers and financial statements of individual businesses were not included. This was consistent with privacy rules at the institution. To avoid bias in the survey and to ensure its reliability, the questions were first pre-tested with internal credit analysts. This helped sharpen up the wording. And all those administering the survey received the same training, to ensure they asked the questions in a consistent manner. In addition, to pick up potential bias in responses, the characteristics of businesses in the sample (sector, size, stage of development and location) were compared with the profile of business at the lending event. This showed that the sample reflected the sectoral make-up of businesses in the counties of New York City. Had personal information been included, this sample could have differed from that of the event. But because of institutional privacy regulations, such information was not included.
Statistical Analysis
In analyzing one of the factors, a range of statistical techniques was used to assess the strength of influence of that factor and the reliability of the findings.
In our study, we looked at the overall influence of the seven variables. The result was a heavy-headed pattern: the five most important variables together explained 93.8% of #1 concern. Of this,19.2% related to inflation, 18.7% to government monetary policy, regulations and tariffs, and 18.5% to immigration policy. Combined, this identified a range of common drivers at the time. In particular, there was a statistically significant difference between the main drivers and minor ones (e.g. “Government Assistance” at 2.2% and “Geopolitical Stability” at 3.0%). Through this, we could go beyond frequency of concern across the variables, and point to a hierarchy in decision-making for the small business in the New York metropolitan area.
To test whether concern of individual variables differed materially from mere chance, we treated each variable as a binary response at the individual level. In a completely random situation in which each respondent picked three of the seven variables, the chance that any one variable would be picked would be 3/7≈42.86%. To reflect this, we set a null hypothesis threshold of H0: p=0.40. Collectively, the concentration of concern across variables, Z-testing of individual variables against the null hypothesis and weighted concern across the variables, confirmed our findings. Specifically, it underlines a relationship between macroeconomic policy and borrowing decisions at the micro-level. The test statistic was calculated using the formula:
Furthermore, to define the precision of these results, 95% confidence intervals (CI) were constructed for each driver. The interval provides the range in which the population proportion likely falls, calculated as:
| Macroeconomic Factor | Successes (n) | Denominator (N) | Estimated Proportion (р̂) | 95% Confidence Interval | Z-Statistic | P-Value | Test Direction |
| Gov. Monetary Policy | 389 | 406 | 95.81% | [93.85% – 97.77%] | +22.95 | < 0.00001 | One-Sided (Right) |
| Gov. Regulations | 179 | 406 | 44.09% | [39.26% – 48.92%] | +1.68 | 0.04648 | One-Sided (Right) |
| Immigration Policy | 174 | 406 | 42.86% | [38.05% – 47.67%] | +1.18 | 0.11904 | One-Sided (Right) |
| Inflation | 142 | 406 | 34.98% | [30.34% – 39.62%] | -2.06 | 0.0197 | One-Sided (Left) |
| Tariff | 142 | 406 | 34.98% | [30.34% – 39.62%] | -2.06 | 0.0197 | One-Sided (Left) |
| Gov. Assistance | 117 | 406 | 28.82% | [24.41% – 33.23%] | -4.6 | < 0.00001 | One-Sided (Left) |
| Geopolitical Stability | 69 | 406 | 16.99% | [13.34% – 20.64%] | -9.47 | < 0.00001 | One-Sided (Left) |
Table 3 | One-Sample One-Sided Z-test. The total sample size is N=406. Hypotheses are evaluated against a null hypothesis H0: p = 0.40. For factors exceeding 40%, the alternative hypothesis is Ha : p > 0.40 (Right-tailed). For factors below 40%, the alternative hypothesis is Ha : p < 0.40 (left-tailed). Confidence intervals are computed according to Wald asymptotic standard errors. The “Other” category (n=6) is excluded from direct hypothesis testing as it’s not a numerical value.
For each of the seven variables, we calculated a 95% confidence interval and p-value based on our sample of 406 small businesses. To test whether concern for each of these variables was materially different from a uniform random selection, we undertook one-sample proportion Z-tests of each variable against our null hypothesis (p0 = 0.40). Looking at the findings of these tests (Table3), we can see distinct tiers of concern across the seven macroenvironmental factors in our sample of 406 small businesses.
In a survey of 406 respondents, 389 (p̂=95.81%, 95% CI [93.85% – 97.77%]) named government monetary policy as one of their top three concerns about borrowing. This represents a positive deviation from the null hypothesis and gives a P-value of less than 0.00001 and a Z of +22.95. In other words, this was a highly common concern across the sample. Government regulations (p̂=44.09%) and immigration policy (p̂=42.86%) were also significant variables. Of the other four macroeconomic factors, each showed a significant deviation in the left tail of responses. That is, they were selected much less often than would be expected under the null hypothesis. Tariffs and inflation had identical, negative footprint (p̂ = 34.98%, Z= -2.06, p = 0.0197). In the case of government assistance, the negative deviation was much more (p̂ = 28.82%, Z = -4.6, p < 0.00001), and in the case of geopolitical stability, it reached the lowest point among all (p̂ = 16.99%, Z= -9.47, p <0.00001).
Looking across all considerations of small businesses, government monetary policy/lending interest rate was among most of their top three concerns. Of the 1,218 selections, 32% (389) included this in their top three concerns (33.33% of all selections). In this way, it could be seen behind the apparent similarity in the single-choice responses that, for example, inflation was a key concern for those in the hospitality sector, while tariffs mattered more for those in manufacturing. But across the board, cost of capital was more often the key concern in the top three considerations affecting borrowing. Note that here the study reports frequency across any three considerations, rather than explicit ranking. This widespread inclusion of the lending interest rate show that for almost all business in the sample, it was a key underlying consideration. But it would be wrong to read this as a defining factor in borrowing for all of the small businesses in the survey. The question asked respondents what their key considerations were, regardless of whether they ranked the interest rate as first, second or third.
* each business in the 406 samples were required to select 3 factors as their top 3 concerns, the total count of selection collected was 1,218 (406×3)
| socioeconomic factors | count | percent of answers | percent of respondents |
| government monetary policy (lending interest rate) | 389 | 32% | 96% |
| government regulations | 179 | 15% | 44% |
| immigration policy | 174 | 14% | 43% |
| inflation | 142 | 12% | 35% |
| tariff | 142 | 12% | 35% |
| government assistance program (e.g. CRA) | 117 | 10% | 29% |
| geopolitical stability (regional war) | 69 | 6% | 17% |
| other* | 6 | 0% | 1% |
| Total selections | 1218 | 100% |
Table 4 | Counts of all factors selected by the small business. The count refers to the number of times that one factor was selected, regardless whether it’s selected as #1, #2 or #3 factor.
Results
Set of Main Variables
To determine the three most important socioeconomic factors affecting business expansion and operations for small businesses in New York urban areas, we surveyed them in person, by phone or with a questionnaire on Google Forms. In developing the questionnaire, we looked at recent loan applications from local lenders. In some of these applications, applicants indicated their most important socioeconomic concern. In our pilot survey, we were able to assemble a list of seven variables. To ensure we did not miss important factors, we included an “Other” response in the questionnaire. In a multiple-choice question, respondents were asked to pick and rank the top three important of the seven most relevant factors from a list. They could also enter their own factor in the “Other” response.
Reviewing the responses to the “most important” factor (i.e., the top of the three most important factors), we hypothesized that: there are key macroeconomic variables which, taken individually, exceed the plurality point (P0=0.40) in the borrowing decisions of small businesses in New York urban areas. Rather than many small factors, we find a small number of dominant ones. Of the seven variables on our list, five of which together explain 93.8% of influence. Individually, they range from 18.5% to 19.2%. Combined, they represent the key socioeconomic factors for these businesses. Looking at the frequency of inclusion across variables, the distribution shows quite clearly a distinction between the prominent variables and other concerns, such as geopolitical stability and government programs. In addition, the small gap between the top five variables (0.7%) suggests a set of common concerns across small businesses in the New York financial hub.
Sector Specific Variables
Of the 406 small businesses in the survey in New York’s urban communities, the chart below shows that their key consideration is closely connected to their vulnerability in their particular sector. That vulnerability could relate, for example, to consumer spending through inflation, supply chain16 exposure through tariffs or geopolitical risk through cost of resources.
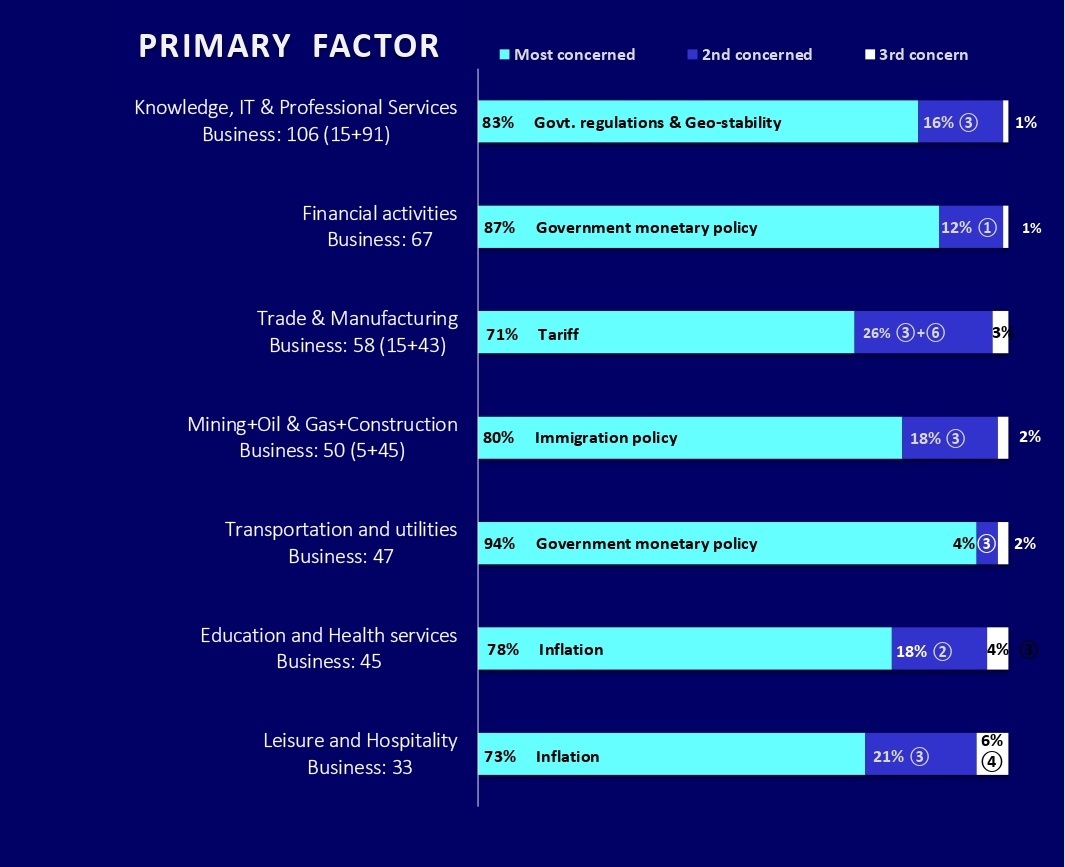
| ① | geopolitical stability (regional war) |
| ② | government assistance program (e.g. CRA) |
| ③ | government monetary policy (lending interest rate) |
| ④ | government regulations |
| ⑤ | immigration policy |
| ⑥ | inflation |
| ⑦ | tariff |
| ⑧ | Other* |
| * survey participant specified answer to an open question |
Consumer discretionary sectors (education & health services and leisure & hospitality businesses): for businesses in retail and personal services, vulnerability stem from changing levels of discretionary income and purchasing power in their local consumer base. Such businesses tend to have small profit margins and little cash. They therefore risk being hit by higher costs in inflation. Where inflation erodes savings in households, customer demand and transaction numbers quickly fall in discretionary businesses. Only later would credit become more available to them17.
Supply chain dependent sectors (wholesale & retail trade and manufacturing): for business dependent on inputs and inventory, vulnerability lies in cross-border transport and trade. Often, such small businesses will have significant exposure to, for example, changing port-of-entry rules18 and tariffs in their upstream trade. Lacking the buying power of larger companies and no ability to hedge internationally, even a small change in tariff would immediately hit margins for such businesses.
Capital-dependent sectors (financial activities, transportation and utilities): Usually, these small businesses will feel the impact of shifts in monetary policy. For example, higher lending rates will dampen borrowing for capital-intensive utility and transport providers, shift their investment plans and increase their underlying costs19.
Knowledge-intensive and professional services sectors: in these businesses, labor hours are needed to deal with regulatory requirements. But such labor hours do not contribute to revenue or billable work20. In small, localized urban areas such as the New York metro area, data privacy laws, licensing rules and heavy administrative reporting requirements often take up much of the wage bill of these small businesses.
Pervasive Baseline Variable
To better understand what drives borrowing decisions by small businesses, we asked our survey respondents to pick the three most important socioeconomic factors from seven options. At first, almost equal weight was given by respondents to five of the seven socioeconomic factors in their consideration of borrowing. But when we look at their three top factors, including the first, second and third, it becomes clear that in practice, the factor of government monetary policy/lending interest rate was the key driver of borrowing decisions.
Of the 406 small businesses in our survey of the New York urban areas, each picked one of the seven socioeconomic factors as its first, second and third considerations. In all, they made 1,218 selections across these factors. More often than not, the factor of government monetary policy/lending interest rate was selected. It may not have been top of mind for every business, but it was in the top three considerations of nearly all of the 406 small businesses in our survey. 389 of the 406 businesses agreed.
Discussion
In this survey, when we looked at the data across variables (Table 4), we found a “heavy headed” pattern among small business owners in the New York metro areas. Nearly 50% of all selections could be attributed to just two variables, that is 28% of the total seven available selections, namely government monetary policy/lending interest rate and government regulations. Altogether, the top 5 variables make up 84% of all selections from the small business owners. That suggests they weren’t each individuals’ separate concerns, but rather the socioeconomic factors many of them shared. Studying our hypothesis of plurality, we found that these factors dominated. In the survey, we found tariff and inflation as less significant concerns, but think statistically government assistance and geopolitical stability played minimal role,
Studying the main economic factors of each sector surveyed, we saw a link between these factors and the main concerns raised. In the urban communities of New York, vulnerabilities of business operations determined socioeconomic concerns across the sectors. Manufacturing and wholesale & retail trade, for example, were most at risk along their supply chain. Hence, they found tariff important. Likewise, inflation drove concerns of consumer spending power in the leisure & hospitality and education & health sectors. Geopolitical stability and immigration policy shaped labor and resource risk in construction, mining and information. And for many in professional & business services, their operations depended on “rules of engagement.” Therefore, government regulations were their number one concern. So even though they shared many of the same concerns, small businesses in the New York metro area across different sectors tended to have different underlying structures. And this influenced what they considered important in their borrowing. In our survey, we find a sector-by-sector correspondence with findings in a working paper from the Federal Reserve Bank of Philadelphia. In that paper, the authors found that in the year an operational factor become eligible under CRA, lending by banks to the sector at risk of that factor tended to pick up. In our survey, we find a relationship between a sectors’ key borrowing concern and its key economic factor.
Looking at the underlying data, though, a count of responses would miss an important hierarchy in this multiple-choice question. Of New York small businesses in the metropolitan area, five factors tended to be chosen by equal numbers of respondents in the single-choice question. But in the multiple-choice question, there was a marked tendency for respondents to pick one variable, namely government monetary policy/lending interest rate, as 96% of respondent included this in their top three concerns.
Our findings were constrained by certain elements of our sample and of the economic environment. Responses tended to cluster around a small set of macroeconomic variables, reflecting the composition of our sample21, the state of the economy, the structure of the survey, and the limited qualitative evidence.
Sample’s composition
One limitation of this study is in its sampling frame. This was built from the New York City White Pages for Business and included only directory-listed businesses mostly with a relationship with the local commercial banking system. In effect, this meant our sample excluded cash-only, unlisted micro-enterprises, unbanked businesses and, for example, IT businesses, which tend to access non-traditional financing from venture capital rather than from local retail banks. Taken together, these meant we could draw a detailed picture of the kind of business sectors covered under CRA rules. But caution should be exercised in extending the inputs from individual sectors in our sample to small, unbanked business22 more widely.
Broader macroeconomic climate
In our sample, almost everyone identified government monetary policy/lending interest rates as most important. This says more about the timing of the survey than it does about this factor more generally. At the time, leading interest rates were by far the most publicized and volatile macroeconomic variable in the post-COVID environment. That fact probably caused their dominance in responses. Other variables would have been more prominent in a period of more stable rates. In our sample, many viewed government’s monetary policy/lending interest rate as a priority. But we would caution against reading too much into this, beyond its context at the time. In periods of relatively stable interest rate, a business owner will pay reasonable attention to decisions by the central bank. But in a period of tightening credit and high interest rates, monetary variables move much more visibly up the priority list23. In such circumstances, monetary policy/lending interest rate would tend to be prominent for concern in business. The distribution of responses we observe therefore reflects a particular point in time in terms of economic stress. It is not necessarily a picture of underlying, long-term obstacles to operations. In particular, macroeconomic instability and volatility in the financial crisis and its aftermath strongly affected credit markets24.
Survey design
In line with the constraints of the institutional lenders commissioning this survey, we did not ask small business owners about their social status, education or race. To include this information, there would need to be disclaimers in, for example, telephone interviews. And there would be regulatory requirements attached. These were beyond the scope of the lending coalition. Had we included such information, we could more readily situate our findings in the existing literature on discrimination against minority businesses and their access to finance. But our findings are informed by broader structural constraints on credit for small businesses. These include discrimination by banks and gaps in financing for minority businesses25. In the post-COVID-19 environment, many small businesses have moved from seeking expansionary debt to capital preservation. Credit conditions have tightened across the board. In effect, existing gaps in capital for many small businesses have turned into acute liquidity pressures26. Our survey could not directly explore the demographic drivers of such discrimination. But we think our findings show that, at a macro level, small businesses are affected differently. More often than not, macro-forces will combine with particular risks in their input and supply chains to add to the financial pressure on historically disadvantaged or vulnerable urban businesses such as those in New York City.
In designing the survey, we asked respondents to pick three of seven factors affecting their ability to borrow. In effect, by offering just seven factors, we could have bundled up different concerns among respondents. And this probably explains the small (1.0%) “Other” response. Through this questionnaire, we asked respondents to identify their three most important concerns from seven macroeconomic factors. Our purpose in developing this question was to avoid flat-lining27 of responses, where someone ticks the same answer for each item in a set of grid or rating questions, and to allow respondents pick up what mattered most to them. But in reality, at any given time, a small business faces a range of risks across its inputs and supply chain. It does not face just one or two. Through this question, we risk missing that. In effect, by setting a ranking threshold, this approach risks diminishing the salience of lower ranked concerns and could create an artificial bias toward prominent, visible variables.
Analysis of qualitative data collected
Another limitation of our approach is related to access to the qualitative element of the survey. In designing this study, we hoped to use a mixed-methods approach, including blocks of open-ended questions in the survey and feedback from interviews in each region. But the transcripts of these interviews and quotes from participants belong to the local lenders who commissioned the survey. Under data privacy rules in our institution and restrictions on disclosure, we were not allowed access to the underlying text files. As a result, we could not, for example, undertake our own thematic analysis of the qualitative material or include quotes from participants in this paper. Our qualitative findings here are best viewed as secondary guideposts for our quantitative results. They are not in themselves a separate qualitative dataset. In future work under collaborative use of data or in an-open-science setting, it would be helpful for researchers to obtain transcripts of the survey interviews in order to support a thematic analysis.
More important than whether the CRA works as policy or in practice is the pattern we see across small business in New York metropolitan areas of what they saw as key pressures in this cycle. In theory, the CRA is intended to encourage credit needs of local communities in banking institutions. But in our data from unweighted, multi-selection, business owners identified quite different pressures as most important at this point.
Collectively, our findings suggest possible improvements to CRA programs in the New York metropolitan area, in particular more focus on economic stress and outreach by sectors. In future surveys of small businesses in this region, it might well be interesting to ask whether in periods of low interest rates when monetary policy would no longer dominate, more of them would consider government-assisted financing.
Moreover, it would be useful to explore whether the low importance of government assistance in our survey was because small business owners in these communities didn’t know of CRA programs, or because even if they did, such programs wouldn’t overcome other key drivers of their responses. In future, we could build on limitations of our findings and explore whether these variables changed over time in this region.
Likely as a result of the interest rate environment at the time, in our survey one variable stood out. In a longitudinal study, it could well be that, as lending rates fall or stabilize, a different prevailing variable would emerge. A comparison of variables across regions could help us decide whether they reflect more general economic forces, or something specific to the New York area.
In this survey, for the first time we used multiple selection rather than single selection questions. Overall, our hypothesis was strongly borne out in the New York metropolis. In this survey several factors compete for prominence, but the 96% response rate to the question about government monetary policy/lending interest rate stood out as the prevailing concern. Considering the pattern of responses, we can see a hierarchy of concerns. A prevailing consideration, government monetary policy/lending interest rate, followed by a range of other factors (the four other factors in the top five of Table 4). And in comparison, other socioeconomic factors played only a small statistical role.
Conclusion
In essence, this study shows that borrowing decisions of small businesses in the New York metropolitan area are not haphazard but depend on particular socioeconomics levers. Across our sample, almost all named government monetary policy/lending interest rate as concern while borrowing. Like much macroeconomic work, our sample points to the credit channel of monetary policy. In a tightening monetary policy environment, small businesses tend to be hit hardest. Without access to public capital market, they rely almost exclusively on financing from intermediary banks28. Lending rate increases quickly raise debt servicing costs for small businesses and put pressure on their balance sheets. And in such an environment, commercial lenders tend to tighten credit standards for small, riskier borrowers29. In its 2025 Small Business Credit Survey, the Federal Reserve found widespread capital constraints in the small business sector. Six in ten small businesses said they were actively seeking financing to meeting growing operating costs. In an environment of high lending rates, only 42% of these applicants got the amount they asked for. There was clearly friction in allocating capital. Looking at demand and supply in its Small Business Lending Survey, the Federal Reserve Bank of Kansas City found that in its members’ view, credit standards for small businesses had generally tightened over time. Altogether, the Fed’s surveys show that at the same time, small business tended to worry more about interest rates, faced tighter credit from banks and saw less demand for loans. Our survey studied the concerns of businesses in our sample. Other studies and readily available data suggest these concerns are reasonable reflections of underlying credit conditions in their local area.
In many ways our findings echo credit channel theory and macro trends. But taken at a point in time, cross-sectional data can only show a picture at one location. To explore in detail how government monetary policy actions affect long-term borrowing by small businesses, we would do well to use panel and longitudinal data.
In urban areas of New York, small businesses’ underlying vulnerabilities, such as risk of tariffs in their supply chain, sensitivity to regulation in the service sector, rationalize their response to certain secondary factors. But more often, it is the cost of capital that drives borrowing behavior.
Our localized empirical findings provide a partial diagnostic picture of key socioeconomic factors affecting small businesses in the New York metropolitan area at a time of tightening monetary policy. In light of this, early conclusions about the relevance of CRA policy and its fit with the economy have been scaled back to avoid generalization. Reviewing our descriptive data, 117 of the 406 firms in our survey selected “government assistance programs” (i.e. CRA programs and subsidized incentives) as a socioeconomic consideration. That gives us a descriptive frequency of 28.8% in the selection matrix. But this variable, taken up by a business, can only reflect the importance of this factor at a particular point in time. It would not, for example, reflect program awareness, prior use of CRA programs, eligibility for a low-income minority loan, application to a program or whether a business was approved or denied. In its present form, the raw data supporting our findings belong to the lenders who commissioned our work. And at this point it would be impossible to add variables to the data for selection, for example, whether a business was eligible for a low-income minority loan, had previously used CRA programs, knew about the programs or applied for them. For this reason, we would not go beyond the patterns in our data. In this particular group, more weight was given to immediate macroeconomic factors such as government monetary policy/lending interest rate, than to local government assistance.
Rather than pointing to a flaw in CRA policy, this suggests that at this point, with very high lending interest rates, incentives under the policy are crowded out. In follow-up work with lenders or under open data, we would want to include, for example, variables showing whether a business was eligible for a low-income minority loan, whether it had used CRA programs in the past, its awareness of the programs and whether it applied for them. Only with such data could we move beyond mapping sentiment in our findings to assess, causally, the impact of CRA policy.
References
- R. W. Bostic, H. Lee. Small business lending under the community reinvestment act, Cityscape, 19, 2 https://www.huduser.gov/portal/periodicals/cityscpe/vol19num2/article6.html (2017). [↩]
- M. K. Zonouzi, M. Hoseyni, M., Khoramshahi. Political factors affecting the survival of SMEs case study: an empirical study in Tehran Grand Bazaar, Asia pacific Management Review 26, 1 https://www.researchgate.net/publication/346431287_Political_factors_affecting_the_survival_of_SMEs_case_study_An_empirical_study_in_Tehran_Grand_Bazaar (2020). [↩]
- B. Nguyen. Small business investment: the importance of financing strategies and social networks, International Journal of Finance & Economics 27, 3 https://onlinelibrary.wiley.com/doi/10.1002/ijfe.2302 (2020). [↩]
- C. O’Connor, H. Joffe. Intercoder reliability in qualitative research: debates and practical guidelines, International Journal of Qualitative Methods 19, https://journals.sagepub.com/doi/epub/10.1177/1609406919899220 (2020). [↩]
- D. Caldara, M. Iacoviello. Measuring geopolitical risk, American Economic Review 112, 4 https://www.aeaweb.org/articles?id=10.1257/aer.20191823 (2022). [↩]
- M. Gertler, P. Karadi. Monetary policy surprises, credit costs, and economic activity, America Economic Journal: Macroeconomics 7, 1 https://www.aeaweb.org/articles?id=10.1257/mac.20130329 (2015). [↩]
- J. K. Bedi, S. Jia. Quid pro quota: a cross-country study on the impacts of immigration quotas on early-stage entrepreneurship, Small Business Economics 63,4 https://www.researchgate.net/publication/377727131_Quid_pro_quota_a_cross-country_study_on_the_impacts_of_immigration_quotas_on_early-stage_entrepreneurship (2024). [↩]
- C. Conflitti. What’s behind firms’ inflation forecasts? SSRN Electronic Journal 465, https://papers.ssrn.com/sol3/papers.cfm?abstract_id=3429831 (2018). [↩]
- M. Amiti, S. J. Redding, d. E. Weinstein. The impact of the 2018 tariffs on prices and welfare, Journal of Economic Perspective 33, 4 https://www.nber.org/system/files/working_papers/w25672/w25672.pdf (2019). [↩]
- P. M. Podsakoff, S. B. Mackenzie, J. Y. Lee, N. P. Podsakoff. Common method biases in behavioral research: a critical review of the literature and recommended remedies, Journal of Applied Psychology 88, 5 https://doi.org/10.1037/0021-9010.88.5.879 (2003). [↩]
- P.J. Ferrando, F. Morales-Vives, J.M. Casas, J. Muñiz. Likert scales: a practical guide to design, construction and use, Psicothema 37, 4 https://www.psicothema.com/pdf/4895.pdf. (2025). [↩]
- M. Isa, A. N. Praswati, S. Zulaekah. Vulnerability analysis: a tool for SMEs’ business resilience, Journal of Integrated disaster Risk Management 14, 2 https://www.idrimjournal.com/article/125616-vulnerability-analysis-a-tool-for-smes-business-resilience.pdf (2024). [↩]
- D. T. Bee, D. Murdock-Eaton. Questionnaire design: the good, the bad and the pitfalls, ADC Education & Practice 101, 4 https://ep.bmj.com/content/101/4/210 (2016). [↩]
- H. Gunn. Web-based surveys: changing the survey process, First Monday 7, 12 https://firstmonday.org/ojs/index.php/fm/article/view/1014/935 (2002). [↩]
- R. M. Groves, E. Peytcheva. The impact of nonresponse rates on nonresponse bias: a meta-analysis, Public Opinion Quarterly, 72, 2 https://academic.oup.com/poq/article-abstract/72/2/167/1920564?redirectedFrom=fulltext (2008). [↩]
- J. T. Mentzer, W. Dewitt, J. S. Keebler, S. Min, N. W. Nix, C. D. Smith, Z. G. Zacharia. Defining supply chain management, Journal of Business Logistics 22, 2 https://onlinelibrary.wiley.com/doi/10.1002/j.2158-1592.2001.tb00001.x (2001). [↩]
- N. E. Weiss. Economic factors affecting small business lending and loan guarantees, Congressional Research Service RL34400, https://www.congress.gov/crs-product/RL34400 (2013). [↩]
- S. LeMay, D. McMahon. The impact of tariff and trade policy uncertainty on SME supply chains, Journal of Small Business Strategy 36, 2 https://jsbs.scholasticahq.com/article/157795-the-impact-of-tariffs-and-trade-policy-uncertainty-on-sme-supply-chains (2026). [↩]
- M. Gertler, S Gilchrist. Monetary policy, business cycles and the behavior of small manufacturing firms, The Quarterly Journal of Economics, 109, 2 https://academic.oup.com/qje/article-abstract/109/2/309/1870303?redirectedFrom=fulltext (1994). [↩]
- M. Morikawa. Compliance costs and productivity: an approach from working hours, Journal of Regulatory Economics, 63, 2 https://link.springer.com/article/10.1007/s11149-023-09460-3 (2023). [↩]
- L. R. Harris. Mixing interview and questionnaire methods: practical problems in aligning data, Practical Assessment, Research, and Evaluation, 15, 1 https://openpublishing.library.umass.edu/pare/article/1551/galley/1502/view/ (2010). [↩]
- P. Calem, C. Henderson, J. Wang. Who remains unbanked in the United States and why? AEA Papers and Proceedings, 116, https://www.aeaweb.org/articles?id=10.1257/pandp.20261007 (2026). [↩]
- O. Coibion, Y. Gorodnichenko, T. Ropele. Inflation expectations and firm decisions: new causal evidence The Quarterly Journal of Economic Literature, 135, 1 https://academic.oup.com/qje/article-abstract/135/1/165/5570592 (2020). [↩]
- Y. Ghulam, A. Hakro, O. Naumani. SME’s access to bank financing during the financial crises in Europe, Journal of Small Business Strategy, 35, 1 https://jsbs.scholasticahq.com/article/124820-smes-access-to-bank-financing-during-the-financial-crises-in-europe (2025). [↩]
- R. Bartlett, A. Morse, R. Stanton, N. Wallace. Consumer-lending discrimination in the fintech era, Journal of Financial Economics, 143, 1 https://doi.org/10.1016/j.jfineco.2021.05.047 (2022). [↩]
- L. Gambacorta, d. Marques-Ibanez. The bank lending channel: lessons from the crisis, Economic Policy, 26, 66 https://academic.oup.com/economicpolicy/article-abstract/26/66/135/2918349 (2011). [↩]
- K. Reuning, E. Plutzer. Valid vs. invalid straightlining: the complex relationship between straightlining and data quality. Survey Research Methods, 15, 5 https://ojs.ub.uni-konstanz.de/srm/article/view/7641 (2020). [↩]
- M. Gertler, S. Gilchrist. Monetary policy, business cycles, and the behavior of small manufacturing firms, The Quarterly Journal of Economics, 109, 2 https://www.uh.edu/~bsorense/Gertler%26Gilchrist.MP%20business%20cycles%20and%20behavior%20of%20small%20manufactoring%20firms.pdf (1994). [↩]
- G. Jimenez, S. Ongena, J. L. Peydro, J. Saurina. Credit supply and monetary policy: identifying the bank balance-sheet channel with loan application, American Economic Review, 102, 5 https://www.aeaweb.org/articles?id=10.1257/aer.102.5.2301 (2012). [↩]