
Abstract
Major music streaming platforms recommend music to users based on systems which rely heavily on metadata and other users’ music preferences. This currently accepted approach reinforces existing listening patterns and does not encourage listeners to explore new genres of music. This study investigated whether analyzing the audio itself via waveforms with a convolutional neural network could effectively predict Spotify’s Energy feature and drive recommendations without user data. Energy is a perceptual scale from 0.0 to 1.0 which measures a given song’s activity and intensity through tempo, volume, and range. A supervised deep learning model was trained on waveform images generated from 2,000 popular songs downloaded from Spotify and achieved 0.0796 mean absolute error. The prediction performance was compared against a baseline model trained on spectral features. An additional experiment compared the song recommendations based on a series of inputs from the waveform-based model against baselines using random picking and other Spotify features. The waveform model was found to have superior performance to the baselines in these experiments, suggesting that it could be a novel component of music recommendation systems. Although the study is limited by dataset size and computing power, it demonstrates the capability of raw waveforms to produce viable recommendations for users of streaming platforms and continues to be an area of interest in future research.
Introduction
Music recommendation systems are critical to streaming platforms, allowing users to find new songs within vast catalogs. Many modern systems rely on collaborative filtering methods, which utilize user behavioral data and listening histories1. In contrast, content-based approaches use characteristics derived from audio signals2 in order to generate recommendations with limited user data. Spotify’s Energy feature is one such characteristic, a perceptual measure for a given song’s intensity3. Because Energy does not depend on past listening habits or specific artists, it could drive recommendations which go beyond a user’s typical genres while preserving desired intensity.
Energy was selected as the target variable because it is a standardized measure across Spotify’s entire music catalog. Energy is a value ranging from 0.0 to 1.0 which is derived from dynamic range, loudness, timbre, onset rate, and general activity. Table 1 exemplifies songs of different Energy levels in order to show that the labels match intuitive perception of musical intensity.
| Artist | Title | Energy |
| Gary Jules | Mad World | 0.058 |
| John Legend | All of Me | 0.264 |
| Rihanna | Work | 0.534 |
| Travis Scott | SICKO MODE | 0.730 |
| Green Day | American Idiot | 0.988 |
Because perceived musical intensity is often associated with listeners’ emotional and situational preferences4, recommendation strategies that incorporate Energy may complement traditional genre-based approaches by emphasizing how music feels rather than how it is categorized. Waveform-based Energy prediction could provide an additional signal for future recommendation systems designed to adapt to different listening contexts or moods. Energy represents only one feature of songs, though, and does not account for genre or lyrics. Therefore, this study evaluates the feasibility of using Energy as a signal for content-based recommendation rather than proposing it as a comprehensive measure of musical similarity.
Machine learning has become a fundamental component of music information retrieval (MIR)5, enabling automatic analysis of audio for tasks including genre classification, mood recognition, instrument identification, and recommendation. Traditional MIR systems commonly represent audio using handcrafted spectral features6 such as Mel-Frequency Cepstral Coefficients (MFCCs), spectral centroid, spectral bandwidth, chroma features, and zero-crossing rate.
Recent advances in deep learning have shifted audio analysis toward representation learning7, allowing models to learn discriminative features directly from raw data instead of relying solely on handcrafted descriptors. Convolutional neural networks (CNNs) have demonstrated strong performance across a wide range of MIR applications because they automatically identify hierarchical patterns within audio signals8.
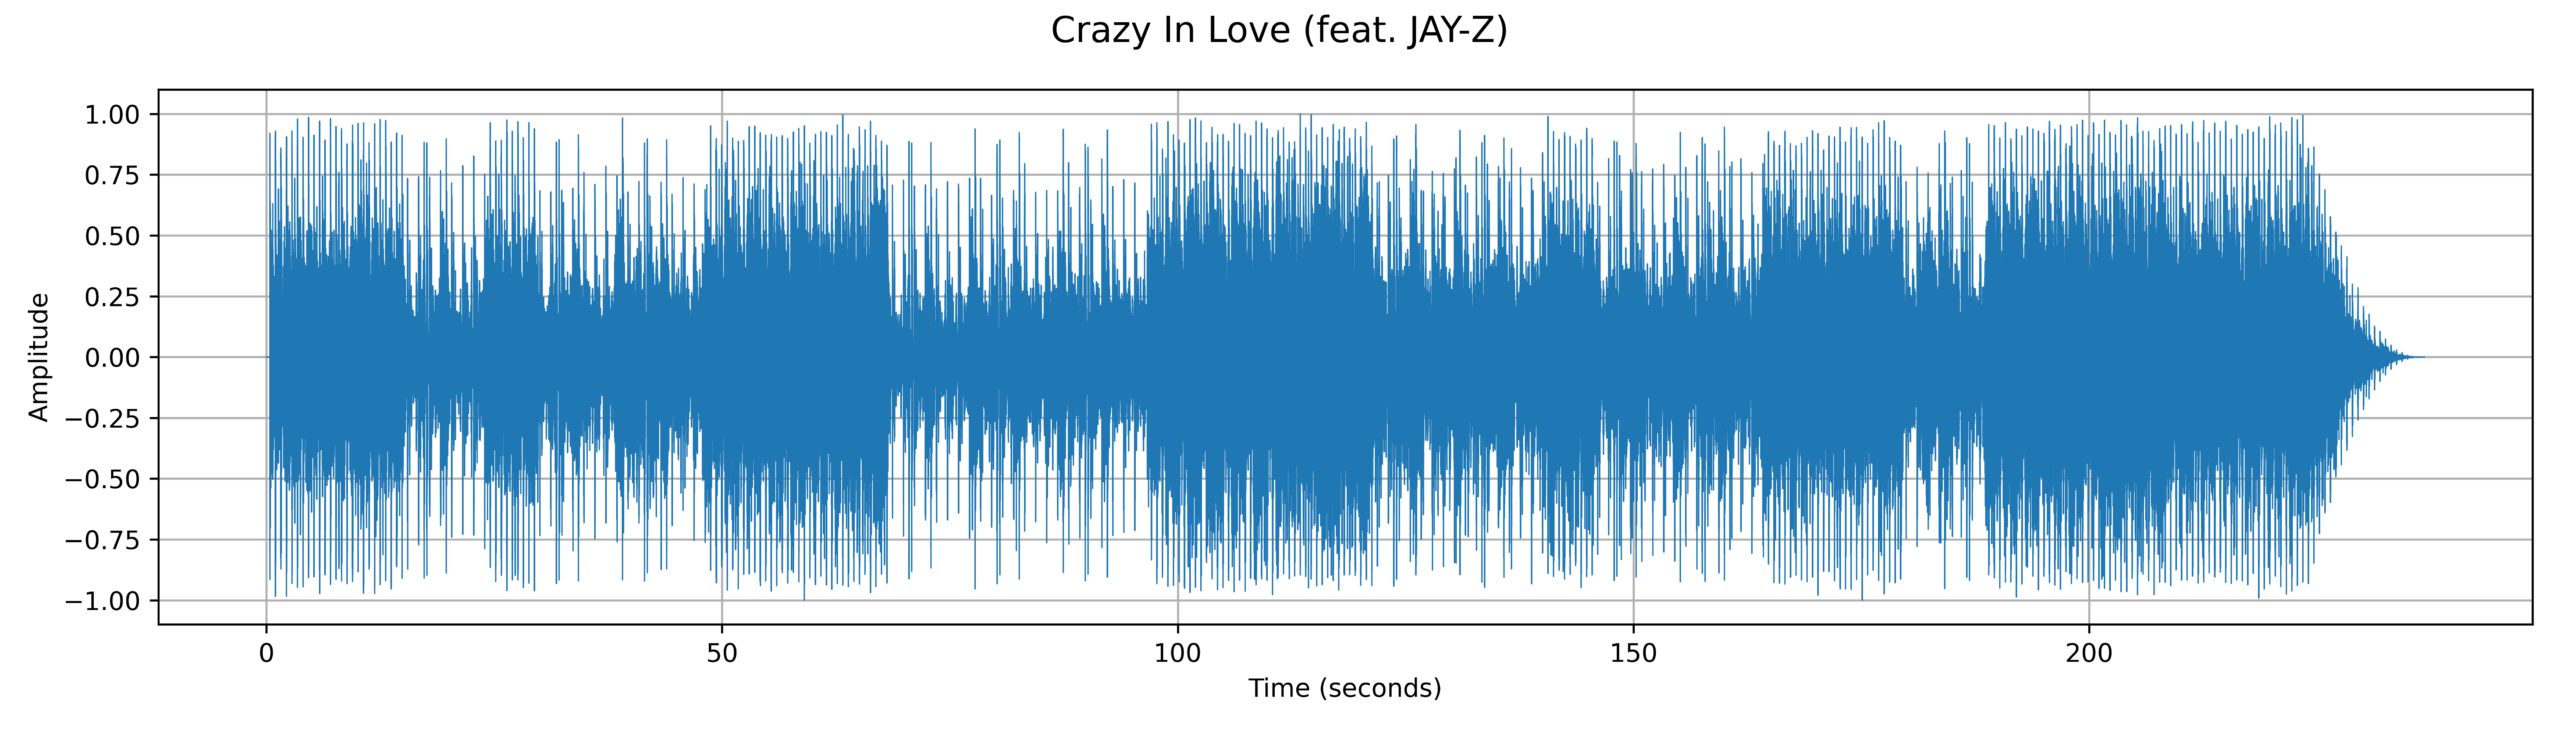
While many deep learning systems continue to operate on spectrograms or other transformed audio representations, several studies have shown that CNNs trained directly on raw waveforms can learn meaningful acoustic representations without manual feature engineering9, 10. These findings suggest that waveform-based models may capture information unavailable to traditional spectral features while reducing dependence on handcrafted preprocessing. Although this increases computational complexity, it allows deep learning models to learn task-specific representations directly from the original signal. An example of the raw waveform of a song is displayed below in Figure 1, showing the change in amplitude of the signal over time.
While previous studies have demonstrated the effectiveness of raw waveform models for tasks such as audio classification and speech processing11, comparatively few have examined whether waveform representations can predict perceptual audio descriptors used by commercial music streaming platforms. Furthermore, limited work has investigated whether such predictions can serve as the basis for content-based recommendation.
Recommendation systems that rely heavily on collaborative filtering often reinforce existing listening patterns12 because recommendations are influenced by previous user interactions and population-level trends. Audio-based recommendation offers an alternative by comparing songs according to their acoustic characteristics, potentially introducing listeners to music outside their typical genres while preserving perceptual qualities that influence listening preferences.
Previous research on content-based music recommendation has historically relied on engineered spectral features. Some studies calculate the distance between spectral features such as MFCCs to generate recommendations13 or analyze Mel spectrogram audio representations14. In contrast, this study investigates an end-to-end approach that learns directly from raw waveforms.
The research question addressed in this study is: Can a convolutional neural network trained directly on raw audio waveforms predict Spotify Energy accurately enough to support content-based music recommendation, and does it outperform traditional spectral-feature approaches? It is hypothesized that a waveform-based convolutional neural network will achieve lower prediction error and generate more consistent recommendations than models relying on handcrafted spectral features because it can learn feature representations directly from the audio signal.
Methods
In order to investigate whether audio waveforms are an effective predictor of Spotify Energy, a deep learning model which analyzes raw waveform data from songs was developed. The proposed model learns directly from the audio signal without spectral characteristics or user data.
A baseline model trained on spectral features was also evaluated in performance against the waveform-based model. The purpose of this was to compare the use of handcrafted audio features against those learned from raw waveforms.
Data Collection
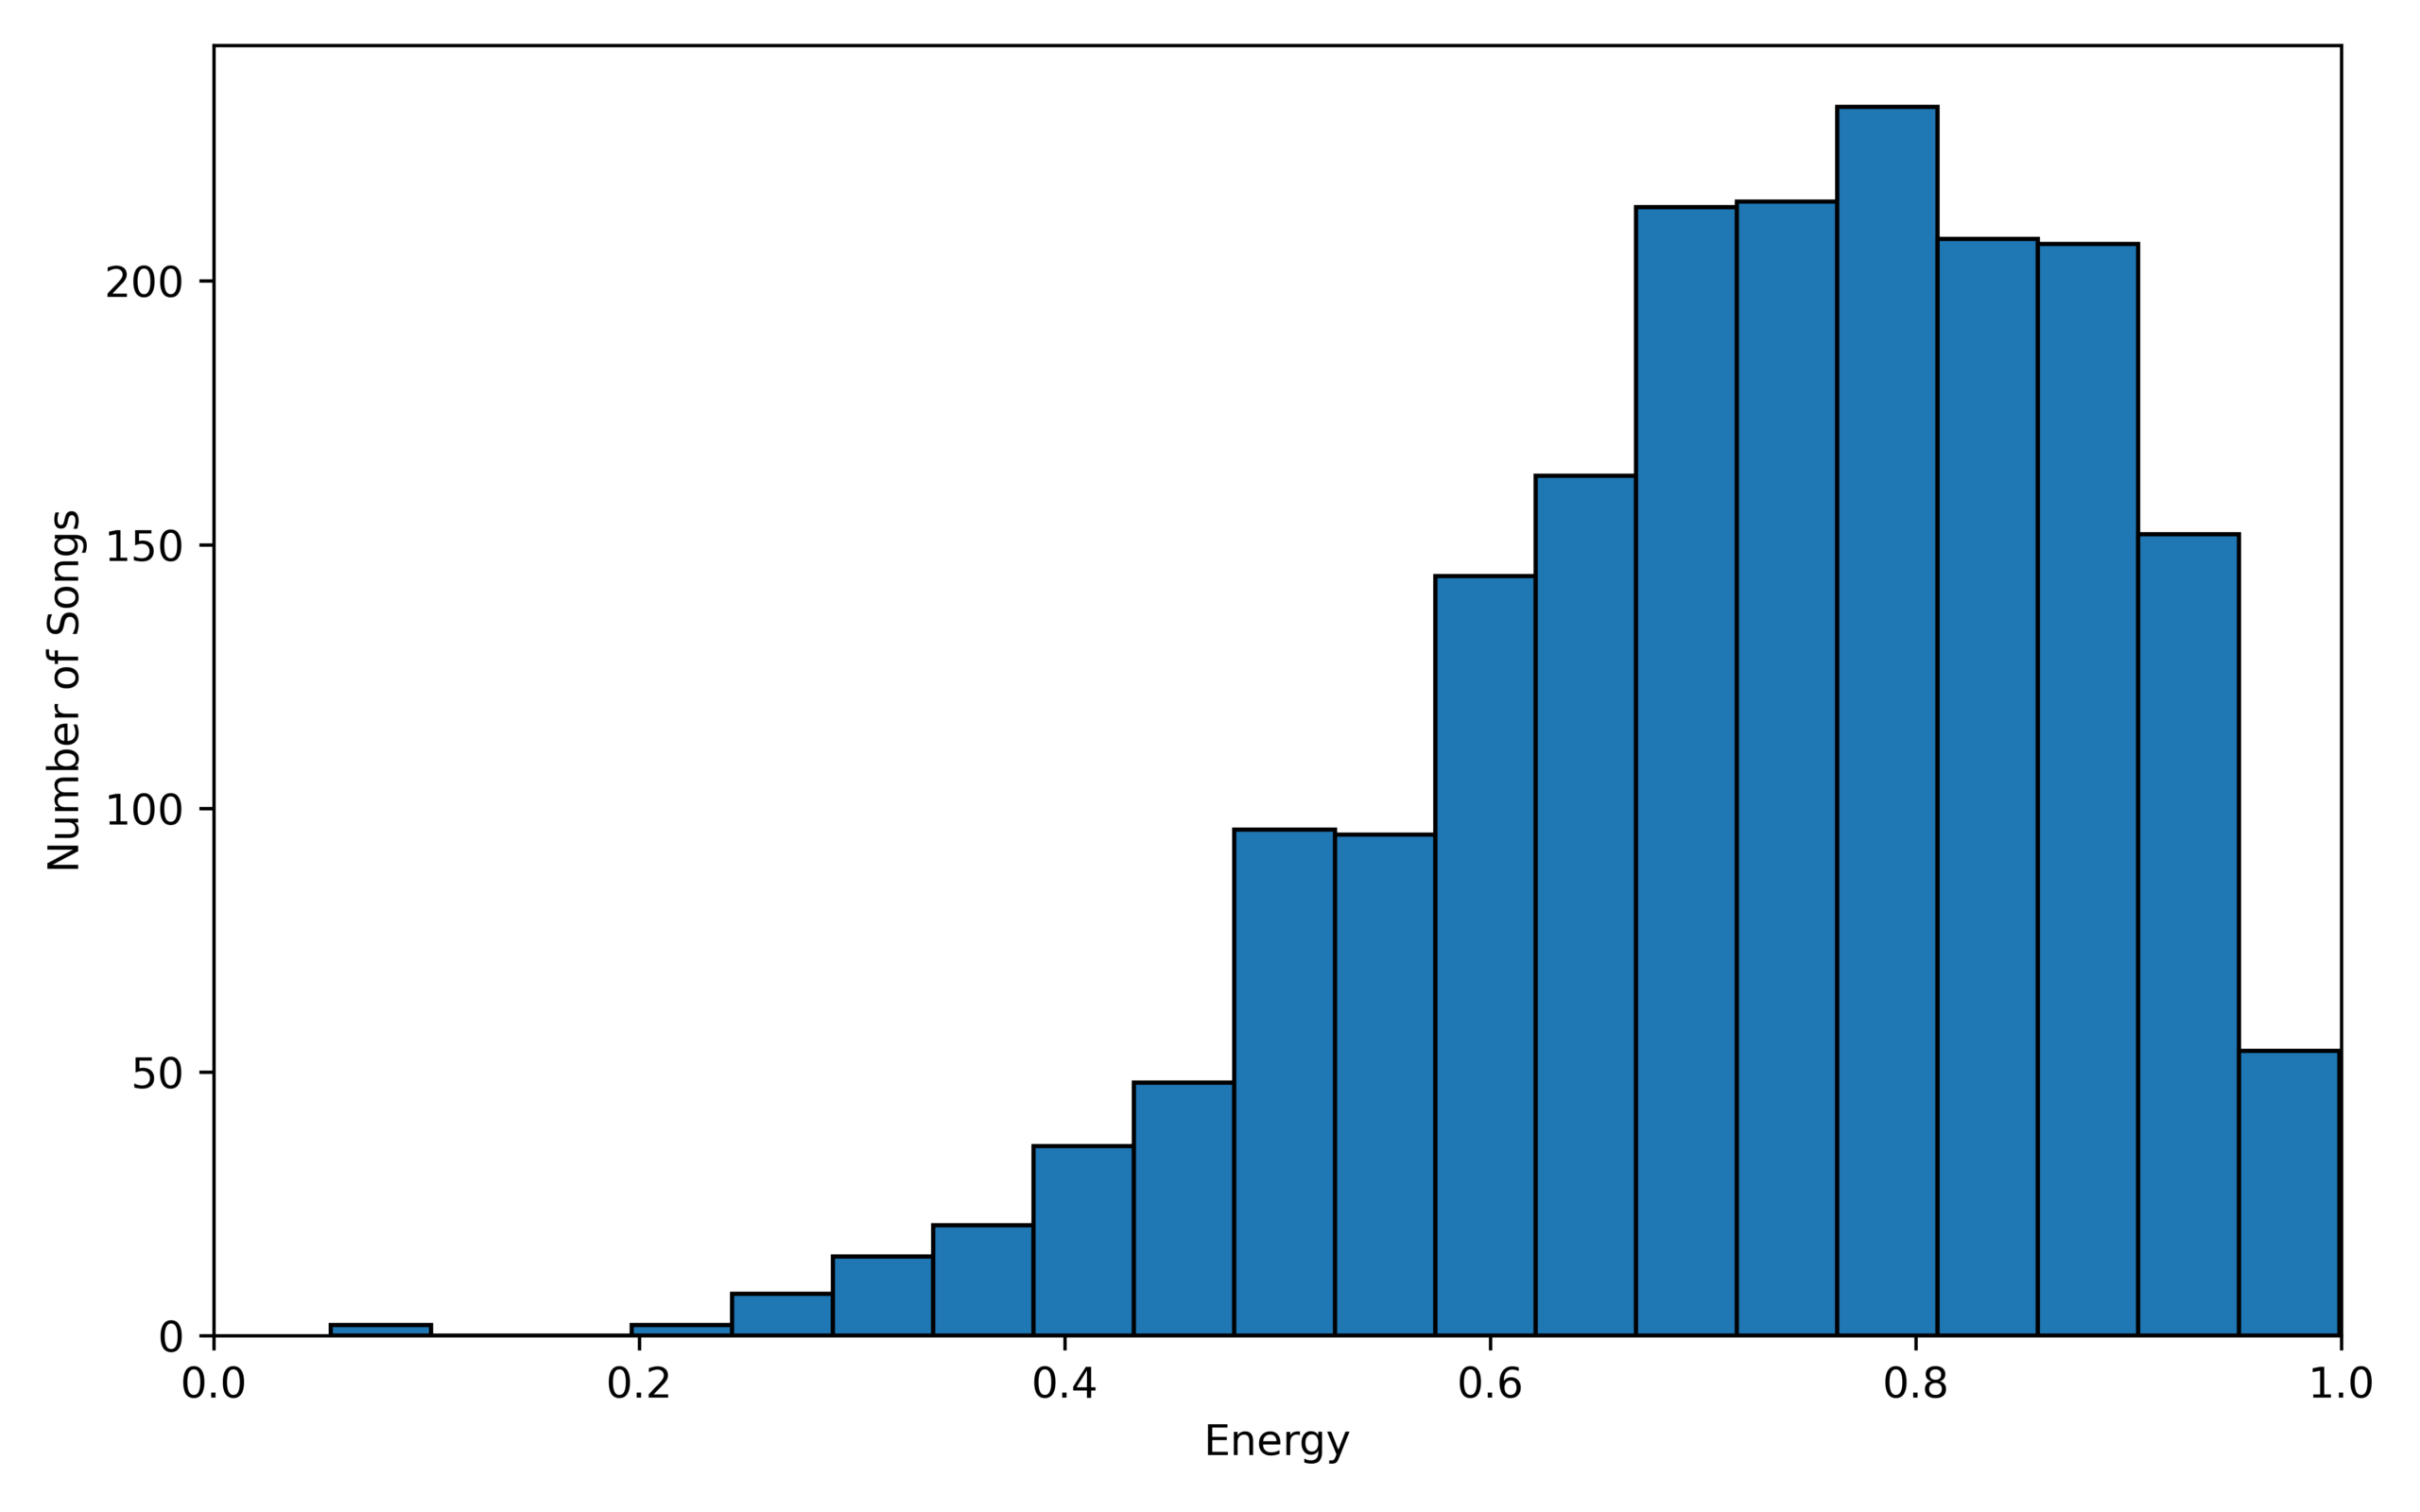
The models were trained on a public Kaggle dataset15 of the 2,000 most popular songs on Spotify from 2000 to 2019. The dataset listed each song’s title, artist, and Spotify audio features, with the Energy of songs ranging from 0.055 to 0.999. Figure 2 shows the dataset’s distribution of Energy values, showing how Spotify Energy skews toward higher values for popular songs16.
A playlist was created on Spotify in order to retrieve the corresponding audio files of each dataset entry. Using the app’s search feature, each track was tested for audio quality and then added to the playlist. Search queries included each song’s exact title and original artist. Matching statistics are summarized in Table 1 below.
| Matching Stage | Number of Songs |
| Initial dataset | 2,000 |
| Excluded: duplicate | 74 |
| Excluded: uncertain matching | 13 |
| Excluded: poor audio quality | 1 |
| Final usable dataset | 1,912 |
Some songs were unavailable on Spotify at the time of collection or only covered by a different artist. These cases are listed as “uncertain matching” in Table 2 and were excluded from the playlist. Others were duplicates within the original dataset and were also excluded. After the playlist was complete, the MP3 files of each song were downloaded from Spotify. Each file was then renamed to match those of the original dataset. For songs with identical names, each file name included the artist’s name as well.
In this matching process, there is a risk that a given downloaded track does not correspond exactly to its label. Although this was minimized through matching by song length and version title (e.g., “Radio Edit”), there may be some outliers in the data.
Audio Preprocessing
The downloaded audio files were converted to WAV format for compatibility with waveform generation. After conversion, the sampling rate of all audio files was standardized to 44.1 kHz using Librosa17. Each file was then loaded and converted to mono sound by averaging both audio channels. To ensure consistency, the first sixty seconds of audio was extracted from each file.
An image of each file’s waveform was generated using TorchAudio18. The Energy value of each file was then obtained by matching its name to entries from the CSV of the Kaggle dataset using Pandas. Each image, its corresponding Energy, and its song title were then added to a single tensor, which is a multidimensional array of values optimized for processing by deep learning layers. The final tensor was then shuffled to ensure a random distribution of data.
For the spectral baseline model, engineered audio features also needed to be extracted from each song using TorchAudio. First, Root Mean Square (RMS) Energy was computed in order to capture the overall audio amplitudes. Second, the mean and standard deviation of the Spectral Centroid were calculated to characterize the spectral Energy distribution across frequencies. Third, the Zero-Crossing Rate (ZCR) was computed with a frame length of 4,096 samples and hop length of 1,024 samples to measure the frequency where each waveform changes signs. Lastly, the mean and standard deviation of the Mel-Frequency Cepstral Coefficients (MFCCs) were calculated with a 4,096-point Fourier transform, hop length of 1,024 samples, and 40 Mel filter banks to capture timbral properties of each song.
Model Architecture
The waveform-based model was implemented as a convolutional neural network (CNN) with PyTorch19. The model operated on images of song waveforms generated by TorchAudio with corresponding Energy labels.
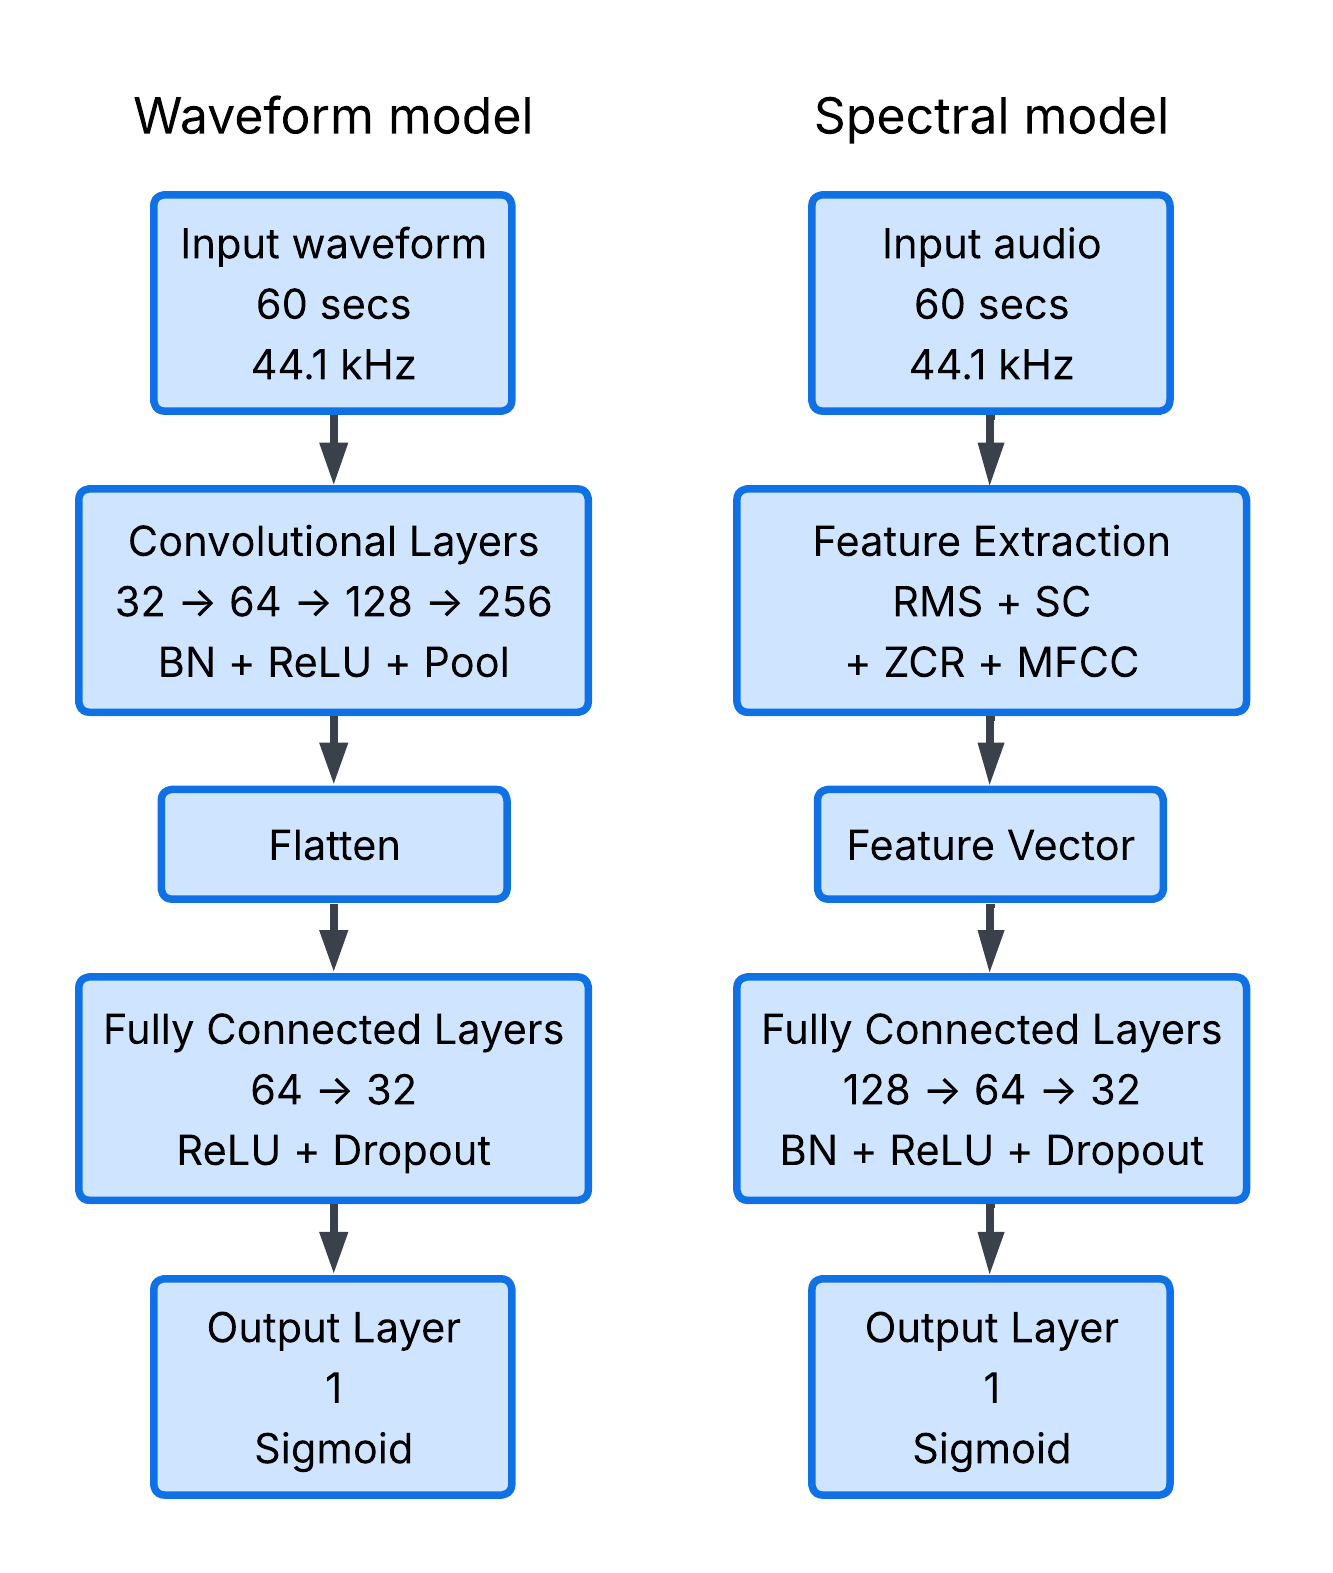
The CNN consisted of four convolutional layers and one fully connected layer. The number of feature channels expanded from 1 to 32, 64, 128, and 256 for each convolutional layer. Each convolutional layer had a kernel size of 9, stride of 4, padding of 4, and was followed by a batch normalization20 and Rectified Linear Unit (ReLU) activation function21. The first three layers then used maximum pooling operations to progressively reduce spatial dimensions.
Batch normalization was added to enforce a predictable scale on data, which stabilizes training and reduces the effects of internal covariate shift from previous layers. ReLU activation functions were used for their simplicity and effectiveness in promoting gradient flow. An adaptive average pooling operation was applied after the final layer to output a vector with fixed dimensions.
The vector was then passed through a fully connected head with two layers of 64 and 32 neurons each. ReLU activation was applied after each layer, followed by dropout regularization22 (p = 0.3) to reduce overfitting. The final output was constrained to the Energy range of 0 to 1 with a sigmoid activation.
The baseline spectral feature model featured a feedforward regressor with three fully connected layers followed by an output layer with a sigmoid activation function. Similar to the waveform-based model, each of the fully connected layers was followed by batch normalization, ReLU activation, and dropout regularization.
The spectral model pipeline, including feature extraction from the data preprocessing phase, is shown in Figure 3 alongside the pipeline of the main waveform-based CNN. The boxes for the layers of the models show their respective functions and number of feature channels.
Training Procedure and Evaluation
The complete dataset was split into two subsets using Scikit-learn, with 90% of songs solely for training and 10% reserved for testing and final evaluation. The testing subset was completely unseen during hyperparameter tuning and training.
The waveform-based and spectral models were trained with 5-fold cross-validation23 on the training subset, which was divided into five equal folds. For each fold, 80% of training data (four folds) was used for optimization and 20% (one fold) was for validation. Each time, a different fold would be used for validation and the performance across all folds was averaged to obtain cross-validation estimates.
The model parameters were optimized by Adaptive Moment Estimation (ADAM)24 during training with a batch size of eight songs. The initial learning rate was 0.001, and was reduced by the ReduceLROnPlateau scheduler from PyTorch when validation loss did not improve for three epochs. The models were trained for a maximum of 100 epochs, stopping when validation loss did not improve for ten epochs in order to prevent overfitting.
The Huber loss function25 was used as the training objective using SmoothL1Loss in PyTorch, which behaves quadratically for small errors and linearly for large errors. This function allows for faster convergence while reducing the impact of outliers, shown below.
Where:
 and
and  are the true and predicted Energy values, respectively;
 is the threshold at which the loss function switches from quadratic to linear.
A final model was trained after cross-validation with optimized hyperparameters and evaluated on the testing data subset. Performance was determined via Mean Absolute Error (MAE), Root Mean Squared Error (RMSE), and the Pearson correlation coefficient (r). These metrics were also used to assess cross-validation performance during hyperparameter optimization, which involved iterative experimentation with learning rate, optimizer, loss function, and dropout rate.
MAE measures the average absolute difference between true and predicted Energy, showing prediction error in Energy units. RMSE measures the square root of the average squared difference, emphasizing larger errors. A smaller MAE or RMSE value indicates smaller error. On the other hand, the Pearson coefficient quantifies the strength of the linear relationship between true and predicted Energy on a scale of -1 to +1, with a coefficient of +1 being a perfectly positive correlation.
Experiment Design
A recommendation experiment was conducted in order to evaluate the ability of waveform-based Energy prediction to drive recommendations. All songs used in the experiment were withheld from the training process. From the held-out dataset, 15 input songs were randomly selected and a pool of 200 candidate songs was constructed for the experiment.
The waveform-based model was compared against two baselines: a random-pick model and a K-nearest-neighbors model26. Each model used the same set of input and candidate songs. The waveform model first predicted the Energy of all input and candidate tracks. Then, for each input song, the top three candidate songs predicted to be closest in Energy were selected from the pool. The random-pick model selected three candidate songs at random from the pool for each input song. The K-nearest-neighbors model picked the closest candidates based on a combination of other Spotify metrics from the original dataset, including “danceability,” “loudness,” “acousticness,” “instrumentalness,” and “liveness.”
Recommendation quality was determined by Average Energy Difference (AED). For each input, the absolute difference of the input song’s true Energy and its corresponding recommendation’s true Energy was calculated. Energy values were derived from the Kaggle dataset. Only the top recommendation for a given input was considered for AED1, while the average difference for the top three recommendations was used for AED3. The final AED would then be determined by the mean of the differences for all input songs, represented below. AED ranges from 0 to 1, with smaller values indicating higher Energy similarity.
Where:
- n is the number of total input songs;
 is the true Energy value for input song
  ;
; is the true Energy value of the
  -th recommendation for input song .
Results
Energy Prediction
The waveform-based model achieved lower MAE and RMSE values and a higher Pearson than the spectral baseline, as shown in Table 3. These results indicate that Energy could be predicted more accurately with learned features from raw audio than handcrafted descriptors. They also suggest that the waveform model could perceive information which was not fully represented by spectral features.
| Model | MAE | RMSE | Pearson |
| Waveform | 0.0796 ± 0.0037 | 0.1031 ± 0.0038 | 0.7437 ± 0.0308 |
| Spectral | 0.0887 ± 0.0031 | 0.1115 ± 0.0044 | 0.6415 ± 0.0542 |
Recommendation Experiment
The waveform-based recommender achieved the lowest AED1 and AED3 values out of the three methods tested, as shown in Table 4. Since the random baseline produced much larger AED values, the recommendations generated by the waveform model were not attributable to chance. The k-nearest-neighbors baseline was also unable to match the consistency of the waveform-based model. These results suggest that the prediction accuracy observed in Table 2 translated directly to recommendation quality.
| Model | AED1 | AED3 |
| Waveform | 0.0740 | 0.0880 |
| Random | 0.1853 | 0.1747 |
| K-nearest-neighbors | 0.1318 | 0.1362 |
The qualitative results of the recommendation experiment on the waveform model and baselines are displayed in Tables 5-7. Each row contains an input song along with the model’s top three recommendations for that song based on predicted Energy compatibility. Each cell reports a given song’s title, artist(s), predicted Energy value computed by the model (if applicable), and its true Energy value.
| Input (predicted / true Energy) | Rec. 1 | Rec. 2 | Rec. 3 |
| Scream Usher 0.730 / 0.862 | How Do You Sleep? Sam Smith 0.730 / 0.682 | Push The Button Sugababes 0.728 / 0.660 | gone girl iann dior 0.733 / 0.714 |
| Move Your Feet Junior Senior 0.965 / 0.904 | No Money Galantis 0.965 / 0.916 | We Made You Eminem 0.958 / 0.853 | U + Ur Hand P!nk 0.954 / 0.891 |
| Going Bad (feat. Drake) Meek Mill 0.576 / 0.496 | No One Alicia Keys 0.569 / 0.549 | Daddy Issues The Neighbourhood 0.569 / 0.521 | Grillz Nelly 0.569 / 0.504 |
| Chelsea Dagger The Fratellis 0.883 / 0.815 | There’s Nothing Holdin’ Me Back Shawn Mendes 0.882 / 0.800 | SICKO MODE Travis Scott 0.885 / 0.730 | Here’s to Never Growing Up Avril Lavigne 0.880 / 0.871 |
| Money In The Grave (Drake ft. Rick Ross) Drake 0.569 / 0.502 | No One Alicia Keys 0.569 / 0.549 | Daddy Issues The Neighbourhood 0.569 / 0.521 | Grillz Nelly 0.569 / 0.504 |
| Whatever It Takes Imagine Dragons 0.787 / 0.655 | Impossible Shontelle 0.787 / 0.624 | Walking On A Dream Empire of the Sun 0.787 / 0.701 | Man Of The Year ScHoolboy Q 0.786 / 0.861 |
| Don’t Give Up Chicane 0.828 / 0.720 | Jenny from the Block (feat. Jadakiss & Styles P.) – Track Masters Remix Jennifer Lopez 0.828 / 0.768 | You Found Me The Fray 0.828 / 0.803 | Battle Scars (feat. Lupe Fiasco) Guy Sebastian 0.826 / 0.863 |
| How You Remind Me Nickelback 0.918 / 0.764 | In My Head Jason Derulo 0.920 / 0.748 | DJ Got Us Fallin’ In Love (feat. Pitbull) Usher 0.916 / 0.861 | Black Magic Little Mix 0.915 / 0.896 |
| Love Me Lil Wayne 0.662 / 0.634 | Air Force Ones Nelly 0.661 / 0.459 | Fight For This Love Cheryl 0.658 / 0.741 | Control Myself LL Cool J 0.667 / 0.876 |
| Collard Greens ScHoolboy Q 0.726 / 0.571 | Blame It Jamie Foxx 0.726 / 0.614 | Push The Button Sugababes 0.728 / 0.660 | Callaita Bad Bunny 0.723 / 0.624 |
| rockstar (feat. 21 Savage) Post Malone 0.569 / 0.520 | No One Alicia Keys 0.569 / 0.549 | Daddy Issues The Neighbourhood 0.569 / 0.521 | Grillz Nelly 0.569 / 0.504 |
| Monster Skillet 0.971 / 0.957 | Faint Linkin Park 0.977 / 0.978 | No Money Galantis 0.965 / 0.916 | We Made You Eminem 0.958 / 0.853 |
| I Love It Icona Pop 0.871 / 0.901 | Bad Romance Lady Gaga 0.871 / 0.921 | Secreto Anuel AA 0.872 / 0.803 | I’m a Slave 4 U Britney Spears 0.868 / 0.843 |
| Dip It Low Christina Milian 0.660 / 0.722 | Fight For This Love Cheryl 0.658 / 0.741 | Air Force Ones Nelly 0.661 / 0.459 | Te Amo Rihanna 0.656 / 0.707 |
| Input | Rec. 1 | Rec. 2 | Rec. 3 |
| Scream Usher 0.862 | Bed J. Holiday 0.606 | Umbrella Rihanna 0.829 | Dancing On My Own Robyn 0.865 |
| Move Your Feet Junior Senior 0.904 | From Paris to Berlin Infernal 0.869 | Proper Education – Radio Edit Eric Prydz 0.937 | Holidae In Chingy 0.791 |
| Going Bad (feat. Drake) Meek Mill 0.496 | Kiss Kiss Holly Valance 0.717 | Caught in the Middle A1 0.874 | U + Ur Hand P!nk 0.891 |
| Chelsea Dagger The Fratellis 0.815 | Oblivion Grimes 0.529 | Girlfriend Avril Lavigne 0.959 | Break Up Mario 0.517 |
| Money In The Grave (Drake ft. Rick Ross) Drake 0.502 | One Wish Ray J 0.652 | Impossible Shontelle 0.624 | I Need Your Love (feat. Ellie Goulding) Calvin Harris 0.869 |
| Whatever It Takes Imagine Dragons 0.655 | Lifestyles of the Rich & Famous Good Charlotte 0.930 | Back To Black Amy Winehouse 0.422 | No One Alicia Keys 0.549 |
| Don’t Give Up Chicane 0.720 | Summertime Sadness – Cedric Gervais Remix Lana Del Rey 0.810 | As Long As You Love Me Justin Bieber 0.873 | Almost Here Brian McFadden 0.452 |
| How You Remind Me Nickelback 0.764 | Superstar Jamelia 0.645 | Dilemma Nelly 0.552 | Black Betty – Single Edit Spiderbait 0.865 |
| Love Me Lil Wayne 0.634 | Nobody To Love – Radio Edit Sigma 0.921 | Because of You Kelly Clarkson 0.583 | Strip That Down Liam Payne 0.485 |
| Collard Greens ScHoolboy Q 0.571 | Do It Again Pia Mia 0.564 | Walk It Talk It Migos 0.633 | If There’s Any Justice Lemar 0.665 |
| rockstar (feat. 21 Savage) Post Malone 0.520 | Do It Again Pia Mia 0.564 | The Fox (What Does the Fox Say?) Ylvis 0.867 | Faint Linkin Park 0.978 |
| Monster Skillet 0.957 | Starry Eyed Ellie Goulding 0.814 | Weak AJR 0.637 | Fill Me In Craig David 0.744 |
| I Love It Icona Pop 0.901 | If There’s Any Justice Lemar 0.665 | Rockabye (feat. Sean Paul & Anne-Marie) Clean Bandit 0.763 | No Promises Shayne Ward 0.498 |
| Dip It Low Christina Milian 0.722 | Drowning (feat. Kodak Black) A Boogie Wit da Hoodie 0.810 | Starry Eyed Ellie Goulding 0.814 | Intro The xx 0.778 |
| Pass Out Tinie Tempah 0.891 | Murder On The Dancefloor Sophie Ellis-Bextor 0.848 | You Make Me Feel… (feat. Sabi) Cobra Starship 0.857 | Lifestyles of the Rich & Famous Good Charlotte 0.930 |
| Input | Rec. 1 | Rec. 2 | Rec. 3 |
| Scream Usher 0.862 | No One Alicia Keys 0.549 | Faded Alan Walker 0.651 | Dark Horse Katy Perry 0.585 |
| Move Your Feet Junior Senior 0.904 | Crazy – Radio Edit Gnarls Barkley 0.741 | Turn Down for What DJ Snake 0.799 | No Money Galantis 0.916 |
| Going Bad (feat. Drake) Meek Mill 0.496 | Gucci Gang Lil Pump 0.523 | Beautiful Girls Sean Kingston 0.661 | One Call Away Chingy 0.821 |
| Chelsea Dagger The Fratellis 0.817 | Back To Black Amy Winehouse 0.725 | Faint Linkin Park 0.980 | Still into You Paramore 0.923 |
| Money In The Grave (ft. Rick Ross) Drake 0.502 | Believer Imagine Dragons 0.780 | SICKO MODE Travis Scott 0.730 | Can’t Hold Us Down (feat. Lil’ Kim) Christina Aguilera 0.658 |
| Whatever It Takes Imagine Dragons 0.655 | See You Again Miley Cyrus 0.911 | No One Alicia Keys 0.549 | Blame It Jamie Foxx 0.614 |
| Don’t Give Up Chicane 0.719 | Black Betty – Single Edit Spiderbait 0.865 | My Love (feat. Jess Glynne) Route 94 0.610 | Kiss Kiss Holly Valance 0.717 |
| How You Remind Me Nickelback 0.764 | Don’t Mind Kent Jones 0.771 | Russian Roulette Rihanna 0.486 | Nobody To Love – Radio Edit Sigma 0.922 |
| Love Me Lil Wayne 0.634 | Little Dark Age MGMT 0.712 | Do It Again Pia Mia 0.564 | The Greatest (feat. Kendrick Lamar) Sia 0.725 |
| Collard Greens ScHoolboy Q 0.573 | Bitch Better Have My Money Rihanna 0.728 | Man Of The Year ScHoolboy Q 0.865 | Sucker Jonas Brothers 0.734 |
| rockstar (feat. 21 Savage) Post Malone 0.520 | Leave a Light On Tom Walker 0.624 | Summertime Sadness – Cedric Gervais Remix Lana Del Rey 0.810 | Chained To The Rhythm Katy Perry 0.800 |
| Monster Skillet 0.957 | I Like It Enrique Iglesias 0.942 | You Make Me Feel… (feat. Sabi) Cobra Starship 0.857 | DJ Got Us Fallin’ In Love (feat. Pitbull) Usher 0.861 |
| I Love It Icona Pop 0.906 | DJ Got Us Fallin’ In Love (feat. Pitbull) Usher 0.861 | Bad Romance Lady Gaga 0.921 | I Like It Enrique Iglesias 0.942 |
| Dip It Low Christina Milian 0.718 | My Prerogative Britney Spears 0.937 | Believer Imagine Dragons 0.780 | We R Who We R Kesha 0.817 |
| Pass Out Tinie Tempah 0.891 | DJ Got Us Fallin’ In Love (feat. Pitbull) Usher 0.861 | Bad Romance Lady Gaga 0.921 | I Like It Enrique Iglesias 0.942 |
Discussion
This study investigated whether a convolutional neural network trained directly on audio waveforms could accurately predict Spotify Energy and whether those predictions could support content-based music recommendation. In the prediction experiment, the waveform-based model was able to outperform the spectral-feature baseline, achieving a lower prediction error and higher correlation. The waveform model’s superior performance was also presented in the recommendation experiment, where it generated recommendations with a smaller difference in Energy from the input than the random and K-nearest-neighbors models. These findings support the hypothesis that learning directly from raw audio enables more effective prediction of Spotify Energy than handcrafted spectral features, suggesting that waveform representations can provide a useful foundation for Energy-based recommendation.
The results indicate that end-to-end waveform learning can capture acoustic information relevant to Spotify Energy without requiring manual feature engineering. However, the recommendation experiment evaluated only similarity in predicted Energy values rather than overall recommendation quality. Consequently, the findings should be interpreted as evidence that waveform-based models can improve Energy prediction and Energy-based recommendation, rather than demonstrating improvements in broader measures of recommendation performance or user satisfaction.
Several limitations should be considered when interpreting these results. The study was conducted using a relatively small dataset of popular songs which were skewed toward higher Energy values, and the recommendation experiment relied on a limited evaluation set. There was also a risk that the Energy labels from the dataset did not correspond to the audio files retrieved from Spotify. Furthermore, the study relied solely on Spotify Energy, which is derived from a proprietary algorithm and represents only one dimension of musical similarity, excluding factors such as genre, mood, lyrical content, listening context, and individual user preferences. The evaluation also relied exclusively on quantitative metrics and did not include user studies or lisjtening experiments, preventing conclusions about real-world listener experience.
Future research should evaluate the proposed approach on larger and more diverse datasets or as part of a hybrid recommendation system, investigate additional audio features and more advanced neural network architectures, and incorporate user-centered evaluations to determine whether improvements in Energy prediction translate into meaningful improvements in perceived recommendation quality. Future work could also investigate whether Energy-based recommendations align with listeners’ emotional states, activities, or situational preferences. User-centered evaluations could determine whether incorporating accurately predicted Energy improves the perceived relevance and diversity of recommendations.
Overall, this study demonstrates that raw audio waveforms can be used to accurately predict Spotify Energy and generate consistent Energy-based recommendations, outperforming a comparable spectral-feature baseline under a common training framework. Although additional validation is required before practical deployment, these findings contribute to the growing body of research on end-to-end deep learning for music information retrieval and suggest that waveform-based representations are a promising direction for future content-based music recommendation systems.
Acknowledgements
Dr. Mariel Werner from the University of California at Berkeley is acknowledged for her guidance in the development of this study.
References
- J. Ben Schafer, D. Frankowski, J. Herlocker, S. Sen. Collaborative Filtering Recommender Systems. The Adaptive Web. Vol. 4321, pg. 291-324, 2007, https://link.springer.com/chapter/10.1007/978-3-540-72079-9_9. [↩]
- Y. Deldjoo, M. Schedl, P. Knees. Content-driven music recommendation: Evolution, state of the art, and challenges. Computer Science Review. Vol. 51, pg. 100618, 2024, https://www.sciencedirect.com/science/article/abs/pii/S1574013724000029. [↩]
- Spotify. Track Audio Features. 2026, https://developer.spotify.com/documentation/web-api/reference/get-audio-features. [↩]
- A. North, D. Hargreaves. Situational influences on reported musical preference. Psychomusicology, Vol. 15, pg. 30-45, 1996, https://doi.org/10.1037/h0094081. [↩]
- T. Li, M. Ogihara. Toward intelligent music information retrieval. IEEE Transactions on Multimedia, Vol. 8, pg. 564-574, 2006, https://doi.org/10.1109/TMM.2006.870730. [↩]
- A. Friberg, E. Schoonderwaldt, A. Hedblad, M. Fabiani, A. Elowsson. Using listener-based perceptual features as intermediate representations in music information retrieval. Journal of the Acoustical Society of America, Vol. 136, pg. 1951-1963, 2014, https://doi.org/10.1121/1.4892767. [↩]
- E. Humphrey, J. Bello, Y. LeCun. Feature learning and deep architectures: new directions for music informatics. Journal of Intelligent Information Systems. Vol. 41, pg. 461–481, 2013. https://doi.org/10.1007/s10844-013-0248-5. [↩]
- G. Gwardys, D. Grzywczak. Deep Image Features in Music Information Retrieval. International Journal of Electronics and Telecommunications, Vol. 60, pg. 321-326, 2014, http://yadda.icm.edu.pl/baztech/element/bwmeta1.element.baztech-d8639001-5f16-479a-99a6-91ecda6372db. [↩]
- W. Dai, C. Dai, S. Qu, J. Li, S. Das. Very deep convolutional neural networks for raw waveforms. IEEE International Conference on Acoustics, Speech and Signal Processing, Vol. 2017, pg. 421-425, 2017, https://doi.org/10.1109/ICASSP.2017.7952190. [↩]
- M. Ravanelli, Y. Bengio. Speaker Recognition from Raw Waveform with SincNet. IEEE Spoken Language Technology Workshop, Vol. 2018, pg. 1021-1028, 2018, https://doi.org/10.1109/SLT.2018.8639585. [↩]
- Jongpil Lee, Taejun Kim, Jiyoung Park, Juhan Nam. Raw Waveform-based Audio Classification Using Sample-level CNN Architectures. IEEE Journal of Selected Topics in Signal Processing, Vol. 13, pg. 285-297, 2017, https://arxiv.org/abs/1712.00866. [↩]
- M. Saissi, N. Idrissi, A. Zellou. Understanding Echo Chambers in Recommender Systems: A Systematic Review. International Journal of Advanced Computer Science and Applications, Vol. 16, pg. 696-711, 2025, https://www.researchgate.net/publication/397222554_Understanding_Echo_Chambers_in_Recommender_Systems_A_Systematic_Review. [↩]
- H. Han, X. Luo, T. Yang, Y. Shi. Music Recommendation Based on Feature Similarity. IEEE International Conference of Safety Produce Informatization, Vol. 2018, pg. 650-654, 2018, https://doi.org/10.1109/IICSPI.2018.8690510. [↩]
- Z. Fu, Z. Zhang, J. Zheng, K. Lin, D. Li. EAMR: An Emotion-aware Music Recommender Method via Mel Spectrogram and Arousal-Valence Model. International Conference on Frontiers of Artificial Intelligence and Machine Learning, Vol. 2022, pg. 57-64, 2022, https://doi.org/10.1109/FAIML57028.2022.00021. [↩]
- M. Koverha. Top Hits Spotify from 2000-2019. 2022, https://www.kaggle.com/datasets/paradisejoy/top-hits-spotify-from-20002019. [↩]
- D. Duman, P. Neto, A. Mavrolampados, P. Toiviainen, G. Luck. Music we move to: Spotify audio features and reasons for listening. PLoS ONE, Vol. 17, pg. 275228, 2022, https://doi.org/10.1371/journal.pone.0275228. [↩]
- B. McFee, C. Raffel, D. Liang, D. Ellis, M. McVicar, E. Battenberg, O. Nieto. librosa: Audio and music signal analysis in python. SciPy, Vol. 2015, pg. 7, 2015, https://www.academia.edu/download/40296500/librosa.pdf. [↩]
- Y. Yang, et al. Torchaudio: Building blocks for audio and speech processing. IEEE International Conference on Acoustics, Speech and Signal Processing, Vol. 2022, pg. 6982-6986, 2022, https://arxiv.org/pdf/2110.15018. [↩]
- A. Paszke, et al. Pytorch: An imperative style, high-performance deep learning library. Advances in Neural Information Processing Systems, Vol. 32, pg. 8024-8035, 2019, https://proceedings.neurips.cc/paper_files/paper/2019/file/bdbca288fee7f92f2bfa9f7012727740-Paper.pdf. [↩]
- S. Ioffe, C. Szegedy. Batch normalization: Accelerating deep network training by reducing internal covariate shift. International Conference on Machine Learning, Vol. 2015, pg. 448-456, 2015, http://proceedings.mlr.press/v37/ioffe15.pdf. [↩]
- C. Banerjee, T. Mukherjee, E. Pasiliao. An empirical study on generalizations of the ReLU activation function. ACM Southeast Conference, Vol. 2019, pg. 164-167, 2019, https://dl.acm.org/doi/pdf/10.1145/3299815.3314450. [↩]
- P. Baldi, P. Sadowski. Understanding dropout. Advances in Neural Information Processing Systems, Vol. 2013, pg. 2814-2822, 2013, https://proceedings.neurips.cc/paper/2013/file/71f6278d140af599e06ad9bf1ba03cb0-Paper.pdf. [↩]
- T. Fushiki. Estimation of prediction error by using K-fold cross-validation. Statistics and Computing, Vol. 21, pg. 137-46, 2011, https://doi.org/10.1007/s11222-009-9153-8. [↩]
- D. Kingma, J. Ba. Adam: A method for stochastic optimization. International Conference on Learning Representations, Vol. 2015, pg. 1-13, 2014, https://arxiv.org/pdf/1412.6980. [↩]
- G. Meyer. An alternative probabilistic interpretation of the Huber loss. IEEE Conference on Computer Vision and Pattern Recognition, Vol. 2021, pg. 5261-5269, 2021, https://openaccess.thecvf.com/content/CVPR2021/papers/Meyer_An_Alternative_Probabilistic_Interpretation_of_the_Huber_Loss_CVPR_2021_paper.pdf. [↩]
- L. Peterson. K-nearest neighbor. Scholarpedia, Vol 4, pg. 1883, 2009, http://scholarpedia.org/article/K-Nearest_Neighbor. [↩]