Abstract
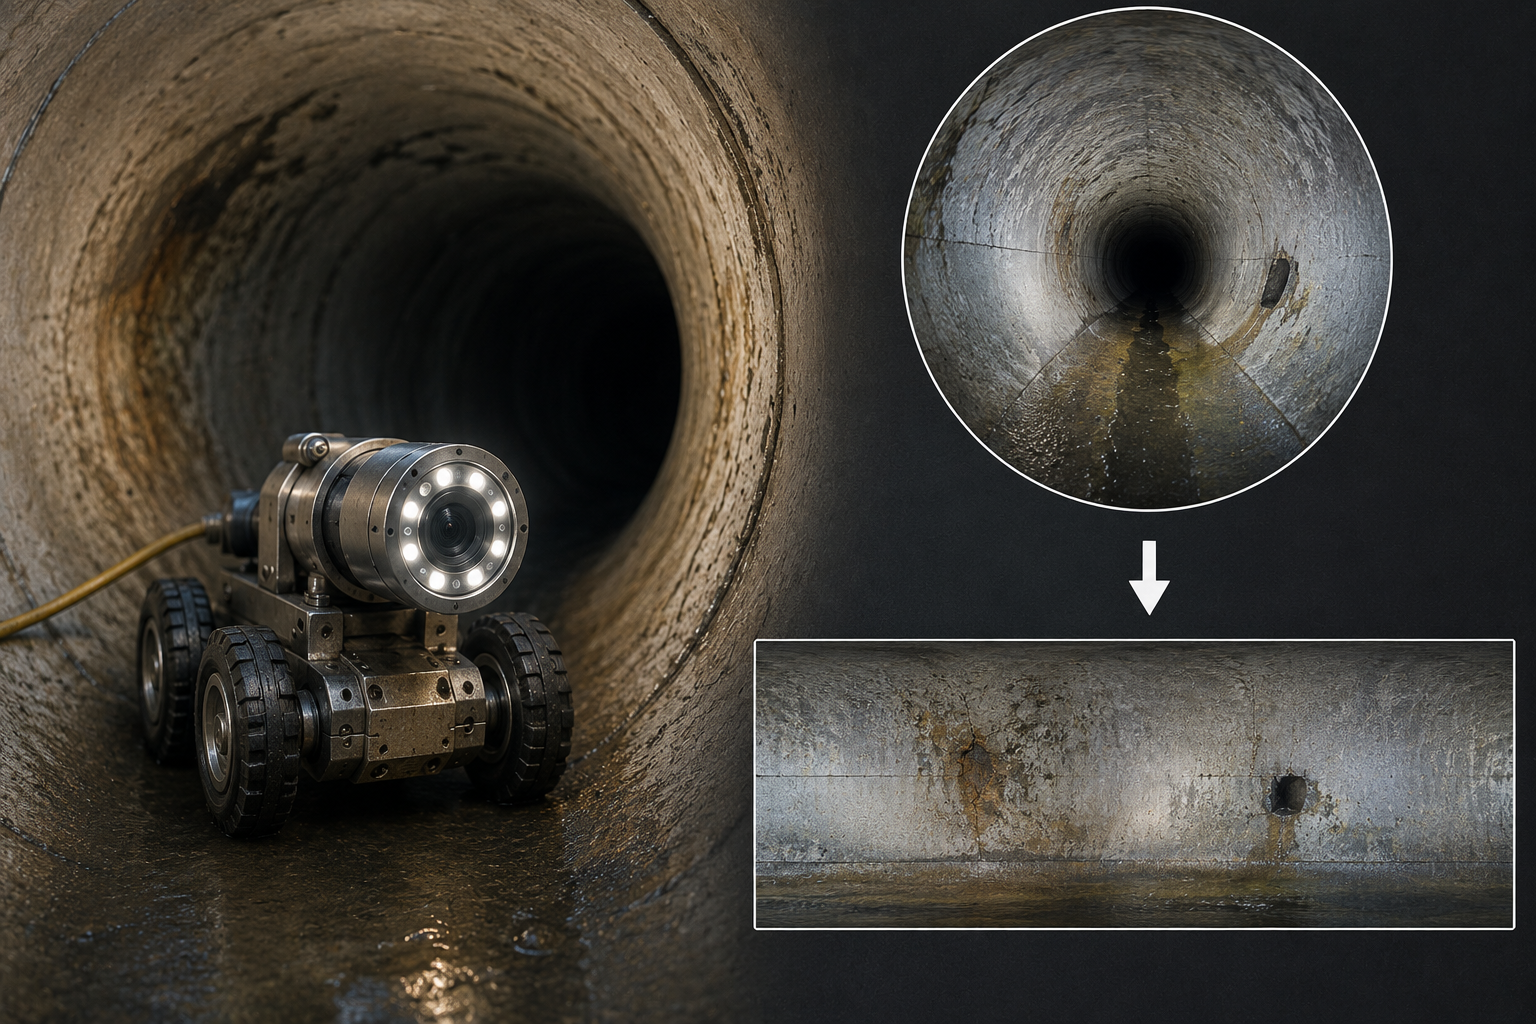
In our day-to-day life, we need drainage infrastructure. However, the routine inspection of these infrastructures is hazardous, labor intensive, and irregular. In this paper, polar-remapped rectangular representations are produced by converting imagery into a flat format. These representations provide a structured format that may facilitate downstream visual analysis of pipe conditions. The algorithm estimates the pipe center by finding the darkest central region and computing its centroid. The centroid is then used to find an estimated center and unwrap the pipe view into a rectangular representation. The performance of the algorithm has been tested on various publicly available open pipe-image datasets and evaluated on selected images from the QV-Pipe (Quality Vision Pipe) dataset. The pipeline is inspected by processing pipe imagery and evaluating whether the pipe geometry, center estimate, and image quality are suitable for unwrapping. Results show that the polar-remapped representation provides a coordinate system that organizes visible pipe-wall imagery into angular and radial image coordinates for examination. This work demonstrates a low-cost, practical approach for reorganizing forward-looking pipe imagery into a rectangular representation. The center-detection algorithm achieved a mean Euclidean center error of 20.79 pixels across 50 GOOD-tier frames (76% within 10% of the detected outer radius R) and processes 640 × 640 images at 36.8 frames per second. Classification of 530 QV-Pipe videos showed that 24.5% of QV-Pipe dataset videos were categorized as GOOD or MARGINAL with the current unwrapping method.
Keywords: Pipe inspection, drainage infrastructure, image processing, polar-to-Cartesian remapping, cylindrical unwrapping, polar image unwrapping, visual inspection, center detection, OpenCV, computer vision.
Introduction
Sewers are often overlooked and when they fail, the damage is devastating. They support public health, waste transport, and environment protection. However, over time these pipelines can develop defects such as cracks, blockages, and corrosion. Many of these defects cannot be observed from the exterior and are only visible from within pipes. Thus, regular inspection of pipelines is crucial to maintain pipeline infrastructure. In the United States, wastewater treatment facilities process approximately 34 billion gallons of wastewater a day. Furthermore, according to the U.S. Environmental Protection Agency (EPA), on average 14% of treated water is lost to leaks1.
Earlier detection reduces infrastructure damage and repair costs by addressing defects before they escalate2,3. Some minor issues like small cracks, sediment buildup, corrosion and joint separation may occur, but with passing time these issues can expand into larger structural failures. And, if by mistake, the damage becomes severe, repair is unbearably expensive and also dangerous for laborers.
There have been some local events which have shown the pressing need of pipe inspection. In December 2024, a sewer line broke near a pump station in Bay Point, Contra Costa County and it released millions of gallons of untreated wastewater into nearby marshland. Approximately 20 million gallons were spilled, hurting the wildlife and destroying the environment. All this can occur due to hidden pipe damage. This example highlights the need for better drainage infrastructure inspection and maintenance.
Right now, sewer inspection relies on closed-circuit television (CCTV) and other inspection methods. To improve inspection in hazardous environments, researchers and engineers have begun to create a wide range of pipeline robotic systems. Cameras and sensors are usually mounted on these robots, capturing images and sensing various aspects of the internal surface of the pipe, allowing inspectors to examine conditions. This method makes inspection possible; however, the raw images are often difficult to interpret. Industry and government assessments show that sewer inspections and sewer maintenance are often dependent on the specific type of data collected, from recorded camera footage, defect observation, and sensor input. CCTV footage can be useful only if the pipeline damages can be seen and connected to the actual location of the pipe4,5,6.
In forward-looking pipe imagery, the pipe appears as a circular tunnel. The visible pipe wall curves around the center of the image rather than appearing as a flat surface. This perspective can make it hard to analyze the sections of the pipe wall or follow large defects in multiple images captured. Features near the edge of the circular view may appear stretched, while features closer to the center may appear compressed or hidden by darkness. Inspectors must mentally interpret a three-dimensional cylindrical surface from a two-dimensional camera image. This process can be inconsistent because it depends on lighting, camera alignment, pipe material, worker experience, and image quality. Even if the camera is successfully recording the pipe interior, the final results depend on image quality, lighting, camera centering, and center estimation.
In forward-looking inspection imagery, cracks and minor fissures along the inner surface can be hard to see and detect. Some current examples of pipeline robotic systems include Carnegie Mellon University’s Pipeline Explorer, a robot designed for long-range inspection of underground pipelines7,8. However, while these systems can improve imagery and provide a live camera view of the passage, the forward-looking images collected can be hard to interpret directly because the inner wall appears in a circular form, making it hard to detect defects in the pipe.
This creates a need for image-processing methods that can make pipe imagery more readable. Current inspection footage is usually stored as a video, but videos do not usually provide a clear view of the pipe surface. This may cause inspectors to repeatedly pause and compare frames, which can make defect identification difficult. Instead of only viewing the original circular camera frame, the pipe wall can be converted into a rectangular representation. This does not completely remove all distortion, but it gives the inspector a more organized view of the pipe surface. A polar-remapped rectangular representation can also make future automated pipe wall analysis more tractable because features can be examined in a more regularized coordinate system. Therefore, image unwrapping is an important part of the pipe and borehole inspection strategies for research. The forward-looking circular imagery can be turned into a rectangular panorama, easier to study as a map. In this paper, based on the cylindrical panorama approach of Deng et al, the center of a pipeline image is estimated and the circular view is unwrapped into a rectangular representation using OpenCV (Open Source Computer Vision Library) and NumPy (Numerical Python)9. Similar pipe mapping concepts have been studied for sewer pipes and boreholes9,10,11,12. More recent studies have generated panoramic representations of pipe and borehole interiors using inverse perspective mapping and stabilized monocular video processing13,14.
The basic idea of this project is to treat the inner surface of the pipe as a cylindrical surface. Seen from the front, each point on the visible wall can be described by how far away it is from the center of the pipe, and the angle around the pipe. This circular view can be unwrapped into a rectangular representation in which the horizontal direction can be used to represent the angular position around the pipe and the vertical direction can be used to represent the radial distance from the center. This provides a polar-remapped image view of the pipe wall which is easier to inspect than the original circular image. The aim of this paper is to construct a polar-remapped rectangular representation of the pipe wall to support improved visual interpretability.
Methods
We developed an image-processing system that analyzes forward-looking pipe imagery from the QV-Pipe dataset. The algorithm currently used is meant to eventually be used with a robotic inspection system, however the current study uses QV-Pipe footage. The robotic inspection platform is a compact prototype using an ESP32-S3-WROOM and OV2640 camera. The robotic system is expected to cost approximately $45. Other studies have investigated similar robotic systems for pipe inspection and data gathering15. However, the main focus of this paper is the image-processing system rather than the robot itself.
The image-processing evaluation was tested on public QV-Pipe dataset frames rather than robot-collected field footage. Image processing is implemented in Python using OpenCV and NumPy. The image-processing workflow consisted of four major stages: image acquisition, preprocessing, center estimation, and cylindrical unwrapping. First, pipe imagery was taken from the selected QV-Pipe dataset, Second, every frame tested was initially converted into grayscale and smoothed in an attempt to reduce any small lighting variations. Third, the center of the pipe was estimated using the darkest central region of the image. Finally, the circular pipe view was remapped into a rectangular image representation. This structure made it possible to test out each part of the system and identify where errors occurred.
Dataset
The QV-Pipe dataset (Y.Liu, Y.Wang, et al.) contains 9.6k inspection videos from real world urban pipes. Location-identifying information, including streets and cities, is not provided in the publicly available dataset. Videos were recorded using CCTV crawlers with forward facing cameras. The dataset contains a multitude of pipe conditions that include intact pipes, pipes with damage, and flooded or debris filled pipes. For this study, the available Track 1 archives were downloaded, extracted, and combined into a local folder containing 531 MP4 files. One file could not be decoded because its MP4 container produced a “moov atom not found” error, leaving 530 videos for analysis. Publicly available documentation did not provide reliable information on pipe-wall materials, pipe diameters, or recording hardware, so these characteristics are not reported.
Image Acquisition
The method is intended for forward-looking images where the pipe appears as a circular tunnel with a visible dark central area. This requires the assumption that the camera is suitably far enough away from any pipe exit so that the pipe’s cross-section appears like a full circle. This assumption is possible as it is a frame-selection criteria. Frames near entries or exits were excluded during classification as they are classified as POOR-tier and are automatically filtered out before unwrapping. This assumption is important because the unwrapping process depends on estimating a center point. If the camera is tilted and cannot maintain full visibility of the pipe or if water partially blocks pipe visibility, the circular geometry of the pipe is much harder to detect. These situations were useful for testing limitations, but were much less reliable at producing ideal rectangular representations.
Preprocessing
Each image is converted to grayscale so that the center can be analyzed. The image was converted to grayscale because the center-detection process depends on brightness rather than color. In most forward-looking pipe images, the center of the pipe appears much darker than the surrounding wall. This is because less light reaches the far interior of the pipe, resulting in the color difference. This makes grayscale intensity a useful factor in identifying the pipe center. After converting the image to grayscale, a Gaussian blur with a 5 × 5 kernel was applied to reduce high-frequency noise and smooth intensity variations. Preprocessing was necessary as pipe images often contain shadows, low contrast, or uneven illumination. The Gaussian blur reduces the influence of random outliers, small stains, or artifacts that could lead to an inaccurate center estimation.
Center Estimation
The search for the pipe center was limited to a center region to avoid shadows and other irrelevant parts of the background: The algorithm searches in this region over grayscale thresholds to segment dark candidate regions that could correspond to the pipe center. The algorithm calculates the average gray value of different parts of the image and the area of each part. This is one of the most important steps for center detection, because the estimated center is used in the unwrapping process. If the center is correct, the unwrapped image is very stable on the pipe wall. If the center is off then one side of the pipe could be stretched and the other compressed. To avoid false detections of the center, the search is constrained to be within the central 70% of the width and height of the image. The above is based on the assumption that the robot viewing angle is almost parallel to the pipe axis and the center is in this region. From 10 to 140, darkness thresholds were tested in increments of 10. This range was selected after performing a sensitivity sweep of 100 frames. When the darkness threshold bound was changed from 140 to 200, no change was detected in any frame. However, when lowering the lower bound from 10 to 5, the detected center shifted greatly (mean shift 59 px, up to 698 px on one frame). Thus 10 was kept as the floor. The method tests the image in increments of 10 as it minimizes the calculations required significantly while maintaining the same level of accuracy. Additionally, the minimum area cutoff was kept at 50 as when the minimum area was changed to 100, 200, or 500, the detected image center shifted on average by 49, 71, and 92 pixels respectively. On the other hand, varying the maximum area cutoff from 5% to 50% produced no change. No noticeable center change was present when maximum area cutoff ranged from 5% to 50%, so a moderate 20% was used. For each threshold value, pixels with grayscale value less than the threshold were marked as possible center points. Very small regions (area < 50 pixels) were also ignored since these are more likely to be stains or shadows than the actual pipe opening. Any component larger than 20% of the image area was discarded as a possible center point. Where no criteria were met, a second estimate was made based on the darkest available area of the central region. This is useful in images where the original process is less effective e.g. partial water coverage images. However, this estimate is less robust than the main one as the darkest area in the frame is not always the actual center.
Radius Estimation
After detecting the center of the pipe, the inner radius r and the outer radius R are estimated by sampling the brightness values along 360 radial lines at each distance from the center to the edge of the image. This produces a radial brightness profile outwards of the image. The gradient of the averaged radial brightness was calculated to identify the strongest intensity transitions. The interior radius r is the transition from dark to bright in the pipe opening. This is usually 5%–50% of max radius. The outer radius R is the brightness that falls from bright to dark at the pipe wall. The confidence score is calculated by the strength of these brightness transitions. If the inner radius exceeded the outer radius, or if the visible wall thickness was less than 10% of the maximum possible radius, fallback estimates were used and the radius confidence was set to zero. A check was conducted on two images in which the inner and outer radii were estimated manually as 96 and 256 pixels. The algorithm provided estimates of 95 and 255 pixels, respectively.
The QV-Pipe dataset does not have information about pipe dimensions or about camera settings, so the accuracy that is shown by this test has to be seen as a check, not a guarantee of accuracy. Thus, in order to create a verified accuracy study, it would be necessary to have pipe imagery with known radii.
Cylindrical Unwrapping
Once the pipe center has been estimated, the circular image is transformed into a rectangular representation by using polar remapping. Pixels are remapped from polar coordinates to Cartesian coordinates through a linear transform. In the unwrapped representation, angular position is expressed as the horizontal axis on the map and radial distance through vertical axis. Remapping is based on geometric transforms in OpenCV, where pixels from the original image are taken and reassigned into new positions in the output image. To unwrap the image, the algorithm takes pixels along radial lines from the estimated center and rearranges them to form the rectangular image. Each column in the rectangular representation is a different angle along the pipe, and each row represents a different radial distance from the estimated center. This turns the pipe image into a rectangular remapped one. The rectangular format is intended to make the pipe wall easier to inspect and compare across frames. The unwrapping process has two different radius values: the inner radius r, representing the inner bore boundary, and the outer radius R, representing the outer pipe wall boundary. The output image height was defined as:
The output image width was defined as:
For each output pixel (u,v), the angular coordinate was calculated as:
The radial coordinate was calculated as:
The corresponding original image coordinate was then calculated as:
where x0 and y0 are the x and y coordinates of the pipe’s estimated center. The coordinates were then used with OpenCV’s remap function, which sampled pixels from the original image. If the mapped coordinate was outside the original image boundary, the output pixel was filled with black.
Evaluation
The algorithm was qualitatively tested by visually inspecting the center estimate to verify if it was reasonable and to ensure that the output image contained the entire pipe wall without distortion. The key factors in producing a clear and readable representation are lighting, shadows, and visibility of the central dark region. There were three main criteria of evaluation. First, the discovered center must correspond to the pipe axis. Second, the selected inner and outer radius must not contain an excessive amount of empty space in the background but should include the pipe wall. Third, the unwrapped result must demonstrate the wall features in such a way that can be inspected easily. After unwrapping the images, if the pipe wall is interpretable, frames are considered successful. If this center estimation is inaccurate due to light, shadows, water, or if the visible ring on the wall is too thin to build a rectangular representation, the frames are regarded as unideal. A subset of videos in the QV-Pipe database was classified to check how many could be unwrapped properly using the proposed method. To quantify center-detection accuracy, 100 GOOD-tier frames were manually reviewed by two separate reviewers. The raw center coordinates assigned by both reviewers for all 100 evaluated frames are provided in the project GitHub repository as reviewer_center_coordinates.csv. The 100 test frames were drawn from a combination of GOOD-tier videos interval sampling. Only 78 videos were classified as GOOD-tier, the additional frames were taken from randomly selected GOOD-tier videos. One frame was selected at the 10% mark from each of the 78 videos and an additional frame was taken at the 50% mark of the 22 random GOOD-tier videos to produce a net sample size of 100 frames. However, the 100 manually reviewed frames can’t be considered as statistically independent because 22 of the videos contributed two frames. To determine the manually reviewed centers, reviewers were provided enlarged frames and selected a point that appeared to be the center of the pipeline. The center of the 100 frames were classified using the same procedure by the reviewers so that reference points were consistent across the sample. For center estimation, 50 frames were chosen randomly from the 100 frame sample and tested upon. The reference center was defined as the coordinate-wise average of both reviewers estimates. The algorithm-estimated center was then compared with the manually estimated center using Euclidean pixel error:
Where (xalg, yalg) is the center estimated by the algorithm and (xgt, ygt) is the manually estimated reference center. To account for different pipe sizes across frames, error was also normalized by the detected outer radius R:
If the error was less than or equal to 5% of the outer radius, the center estimate was considered successful; the SSIM seam-continuity metric shows that distortion reaches 0.60 at this displacement, representing a meaningful degradation threshold. A tolerance of 10% of R was also reported as the point beyond which SSIM plateaus (0.56), indicating that further displacement no longer produces proportionally worse distortion. The inter-rater agreement for the manually assessed pipe center was assessed using ICC(2,1): two-way random effects, single-measure, absolute-agreement model. The reviewers demonstrated good agreement with an ICC of 0.98 for the x-coordinate and 0.99 for the y-coordinate. The mean Euclidean distance between the reviewer estimations was 17.19 pixels, meaning that there was close agreement between the two reviewers in their center estimation.
This inter-reviewer distance represents the measurement uncertainty of the manual reference. Since the algorithm’s mean error is similar in magnitude to the mean Euclidean distance between the two reviewers, a part of the reported error may have come from reference uncertainty rather than center detection inaccuracy. The concept of polar to Cartesian remapping was adopted from Deng et al in this paper. This work contributed a darkness based center detection system that is different from their Otsu-based central-region centroid approach, automated radius estimation via radial intensity profiling, and an evaluation on 100 frames of GOOD tier quality. In order to provide a comparison with Deng et al., the original pipe images and their corresponding outputs from the paper were examined. The original images were processed using the proposed method, and the resulting estimations were compared with the center locations displayed in Deng et al.’s processed figures. The estimated centers differed by around 7.6 pixels with less than 0.6 pixels of vertical difference. However, Deng et al. did not provide source code or center coordinates of the pipelines in which they ran their tests on. In addition, extracting the images from their paper may introduce uncertainty through resizing and cropping. Therefore, the difference in center estimation cannot be used as a comparison of accuracy, but as a measure of output disagreement. One method cannot be considered more accurate than the other because independent center coordinates were not provided for comparison. Additionally, an objective, reference-free metric was created. Since the remapped image is periodic in the angular coordinate, then leftmost and rightmost columns of the output represent positions in the pipe wall right next to each other and should match when the center and radii are correct. This was measured using the structural similarity index (SSIM) between the first and last columns of the unwrapped image. When tested upon the 100 frame GOOD-tier sample, the mean seam-region SSIM was 0.750. Another experiment was also run to test how center-estimation error affects the quality of the image unwrap. 25 GOOD-tier frames were selected at random. In each frame, the detected center was intentionally shifted by 2%, 5%, 10%, 15%, and 20% of R in the four cardinal directions. Each center-shifted frame was compared to the baseline using seam-region SSIM. Distortion increases sharply even for small errors: SSIM falls from 1.0 at 0% displacement to a mean of about 0.66 already at 2% of R, then to about 0.60 by 5% and 0.56 by 10%, after which it flattens.
Results
The image processing system finds a center point for the pipe and generates an unwrapped rectangular panorama of the pipe wall based on the center point. The center detection system takes into account different darkness thresholds and selects the darkest zone that satisfies all requirements. If the images had the dark center area of the pipe, the program provided a usable estimate of the pipe center. The algorithm is most accurate when there is a clear visible pipe all around a dark central region. In these cases, the method selects an estimated center near the manual reference center and unrolls the pipe with minimal distortion. This illustrates that the algorithm can successfully transform a circular camera view into an interpretable rectangular representation. Once the algorithm detected a center point, the unwrapping function converted the image of the pipe from a circle to a rectangular flat view. This aids the visual inspection of the side of the pipeline and reduces the challenge of interpreting curved walls of the pipeline in the original image. The rectangular format also enables comparisons to be made between different regions of the pipe wall. The original image shows the left, right, up and down sections of the pipe arranged around a circular center. The rectangular panorama shows the pipe-wall in a readable way in the unwrapped representation view. This is particularly useful for defects such as cracks, deposits or discoloration as these are seen as features on a flattened wall rather than on curved markings within a tunnel. The method is most effective for cases where the inside of the pipe exhibits a well defined dark central region and shadows are minimized. Under these conditions, the Euclidean center error of the center-detection algorithm on a manually evaluated set of GOOD-tier frames was 20.79 pixels on average. Errors in center estimation are noticeably larger in frames which have poor lighting, shadows, or non-uniform geometry. When lighting is not uniform or if there are shadows, the algorithm often selects dark regions which are less reliable. In these cases, the output was slightly distorted. The algorithm displayed some limitations but still demonstrated the image unwrap process. Normally the process would fail for three main reasons: insufficient light, partial coverage by water and lack of circular geometry. In poorly lit frames, the darkest region did not correspond to the center of the pipe clearly. Shadows along the sides of the pipe could pull the center estimation away from the true center. In partially filled pipes, water reflections changed the appearance of the pipe, removing the circular shape. It became difficult for the algorithm to detect a circular pipe. In some images of the QV-Pipe dataset, the camera was only able to capture the top part of the pipe and not the whole cross section of the pipe.
QV-Pipe Video Classification
In an analysis to determine how effective the unwrapping process was, a subset of 530 videos from the QV-Pipe dataset16 were classified based on their compatibility with the program’s requirements. Every video was assigned one of four different tiers of image quality. This classification will help determine the frequency at which pipe imagery will be appropriate for the method described in this paper. The algorithm is most accurate when the pipe’s cross section appears like the circle and where the central area of the pipe can be clearly seen.
| Tier | Description | Count | % |
| GOOD | Circle detected confidently; sufficient wall visible | 78 | 14.7 |
| MARGINAL | Circle detected but one quality factor is weak | 52 | 9.8 |
| ARCH | No full circle found; only a partial bright arch | 376 | 70.9 |
| POOR | No circle and no arch; frame too dark or occluded | 24 | 4.5 |
| Total | 530 | 100 |
Out of 530 videos, 78 videos or 14.7% were classified as GOOD. These videos demonstrated a clear circular pipe view and had enough wall area to unwrap. Another 52 videos, or 9.8% were classified as MARGINAL. Those videos could be processed but exhibited one or more factors that could lead to inaccuracy, such as lower contrast, or a thinner visible wall ring. Together, the GOOD and MARGINAL categories represent 130 videos, or 24.5% of the dataset used. This suggests that around a quarter of the tested videos are appropriate for the current method. GOOD and MARGINAL videos represent situations where most, if not all the factors have been met, suggesting a successful unwrap. ARCH and POOR categories both represent other situations where the algorithm will struggle and where additional processing would be needed. These classifications help identify which frames would require a different approach for a successful image unwrap. The r/R ratio is the ratio of the inner bore radius to the outer pipe radius. A low value means a wide visible wall annulus, meaning more of the pipe surface is in frame and can be unwrapped. Videos with r/R < 0.65 qualify as GOOD; those with r/R in the range 0.65–0.80 are MARGINAL; above 0.80, the visible wall ring is too thin to be useful. The fill fraction is defined as:
Videos with a fill fraction greater than 0.40 qualify as GOOD. Fill fraction measures how much of the image the detected circle fills. The denominator represents the maximum possible radius of a circle centered in the image, so a fill fraction of 1.0 would indicate that the detected pipe circle almost fills the smaller image dimension. A higher value means the pipe occupies more of the frame, giving more pixels of wall to inspect.; 0.25–0.40 is MARGINAL; below 0.25, the circle is likely a false positive. The ARCH category was assigned when no circular cross-section was found but the algorithm detected a wide bright arch across the upper part of the frame, which is characteristic of a pipe that is partially filled with water. Of the 530 videos, 78 (14.7%) are directly suitable for unwrapping and a further 52 (9.8%) are borderline. The majority, 376 videos (70.9%), are classified as ARCH, indicating that much of the QV-Pipe database consists of footage from partially filled pipes. This result shows that many QV-Pipe dataset videos do not match the ideal circular geometry assumed by the algorithm. The POOR category contained 24 videos (4.5%) where the frame was too dark, occluded, or unclear for reliable processing. This shows that the algorithm performs well in mostly visible pipes while imagery with a weak circular geometry leads to unwrapping issues. Furthermore, a Kruskal-Wallis test was run on mean frame brightness across the four classification tiers. A significant association (H(3) = 27.9, p = 3.9 × 10⁻⁶) was found between the tiers: the POOR tier had a quite low mean brightness (97.3) compared to GOOD, MARGINAL, or ARCH tiers (approximately 126-129), indicating that lower brightness was associated with POOR classifications.
Center-Detection Accuracy
To validate whether the center-detection step was performing accurately, we manually inspected 100 frames from the GOOD tier. Then 50 frames were chosen at random from the manually inspected pool. The estimated apparent geometric center of the visible opening of the pipe was manually estimated for each frame and compared with the estimated center by the algorithm. Error was calculated as Euclidean pixel distance, further normalized by detected outer pipe radius R. The average center error for the 50 GOOD-tier frames was 20.79 pixels, with a median of 8.7 pixels. The mean normalized error was 9.58% of R and the median normalized error was 3.86% of R. At the 5% reporting point, 29 of 50 frames were within the specified displacement. At the 10% reporting point, 38 of 50 frames were within the specified displacement. These assessments represent performance at two different representative points on the center-error sensitivity curve. This shows that unwrapping quality decreases rapidly for small changes in the estimated center before eventually leveling out.
| Metric | Result |
| Number of evaluated GOOD-tier frames | 50 |
| Mean Euclidean center error | 20.79 px |
| Standard deviation | 30.19 px |
| Median Euclidean center error | 8.70 px |
| Mean normalized error | 9.58% of R |
| Median normalized error | 3.86% of R |
| Frames within 5% of R | 29/50 = 58% |
| Frames within 10% of R | 38/50 = 76.0% |
The results show that the center-detection method can produce close center estimates on many GOOD-tier frames. However, the accuracy of the method can still be affected by shadows, uneven lighting, as well as several other factors. This concurs with the error analysis that center estimation is the main factor that controls the quality of the final unwrapped representation.
Computational Performance
The whole pipeline takes about 27 ms to process a single frame, i.e. 36.8 frames per second processing speed. The threshold sweep takes 55.5% of time because connected-component analysis is performed at 14 threshold values. This could be sped up by binary search on the thresholds, or by attempting GPU acceleration. This system was tested on an Intel i7 CPU. Real-time performance was not evaluated.
| Processing Stage | Mean (ms) | Std (ms) | % of Total |
| Grayscale Conversion | 0.38 | 1.18 | 1.4 |
| Gaussian Blur (5×5) | 0.51 | 0.66 | 1.9 |
| Crop Central 70% | 0.01 | 0.00 | 0.0 |
| Threshold Sweep (14 thresholds) | 15.10 | 1.01 | 55.5 |
| Centroid Computation | <0.01 | <0.01 | 0.0 |
| Radius Estimation (r/R) | 6.27 | 0.04 | 23.1 |
| Coordinate Map Generation | 2.73 | 0.03 | 10.0 |
| OpenCV Remap | 2.19 | 0.29 | 8.0 |
| Total Pipeline | 27.18 | 3.09 | 100 |
Sample Results from the QV-Pipe Dataset
Figures 1–3 show sample frames of the QV-Pipe database processed by the center-detection algorithm. Each image shows the original forward-looking circular view with the detected pipe center as a blue dot, the estimated inner radius as a green circle and outer pipe boundary as a red circle. The detected inner radius r and outer radius R for each frame is shown in the top left.
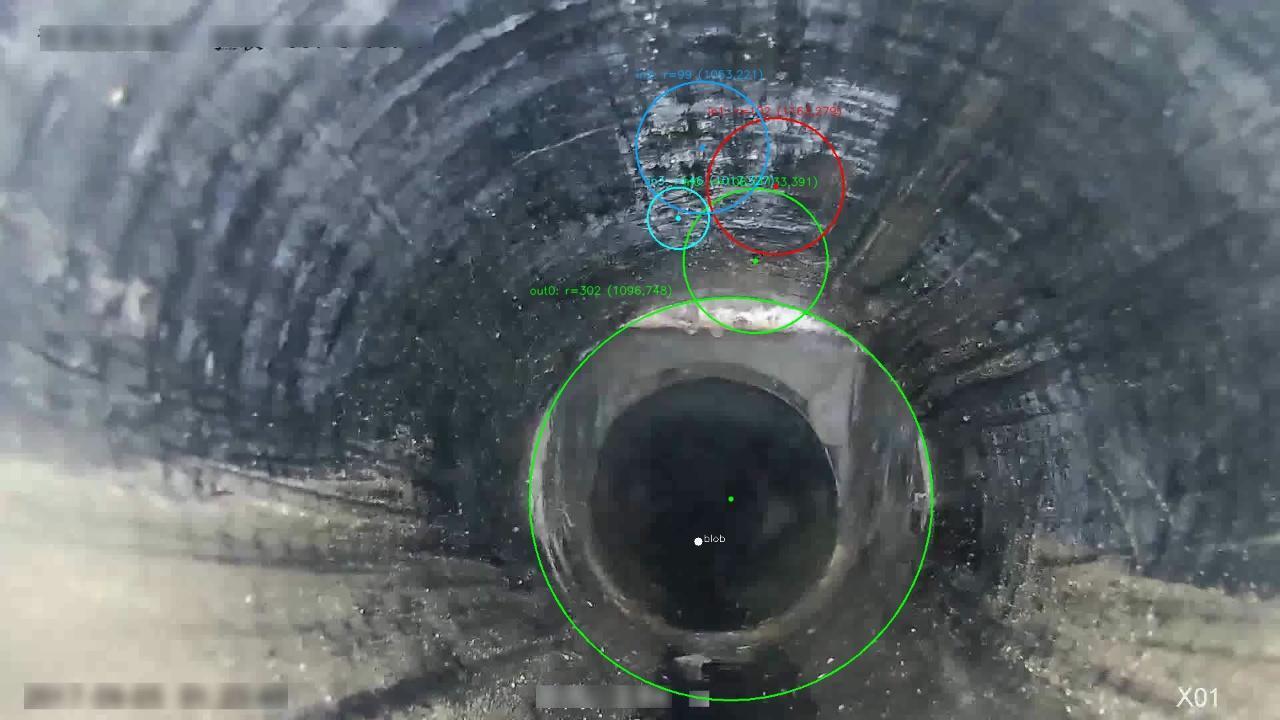

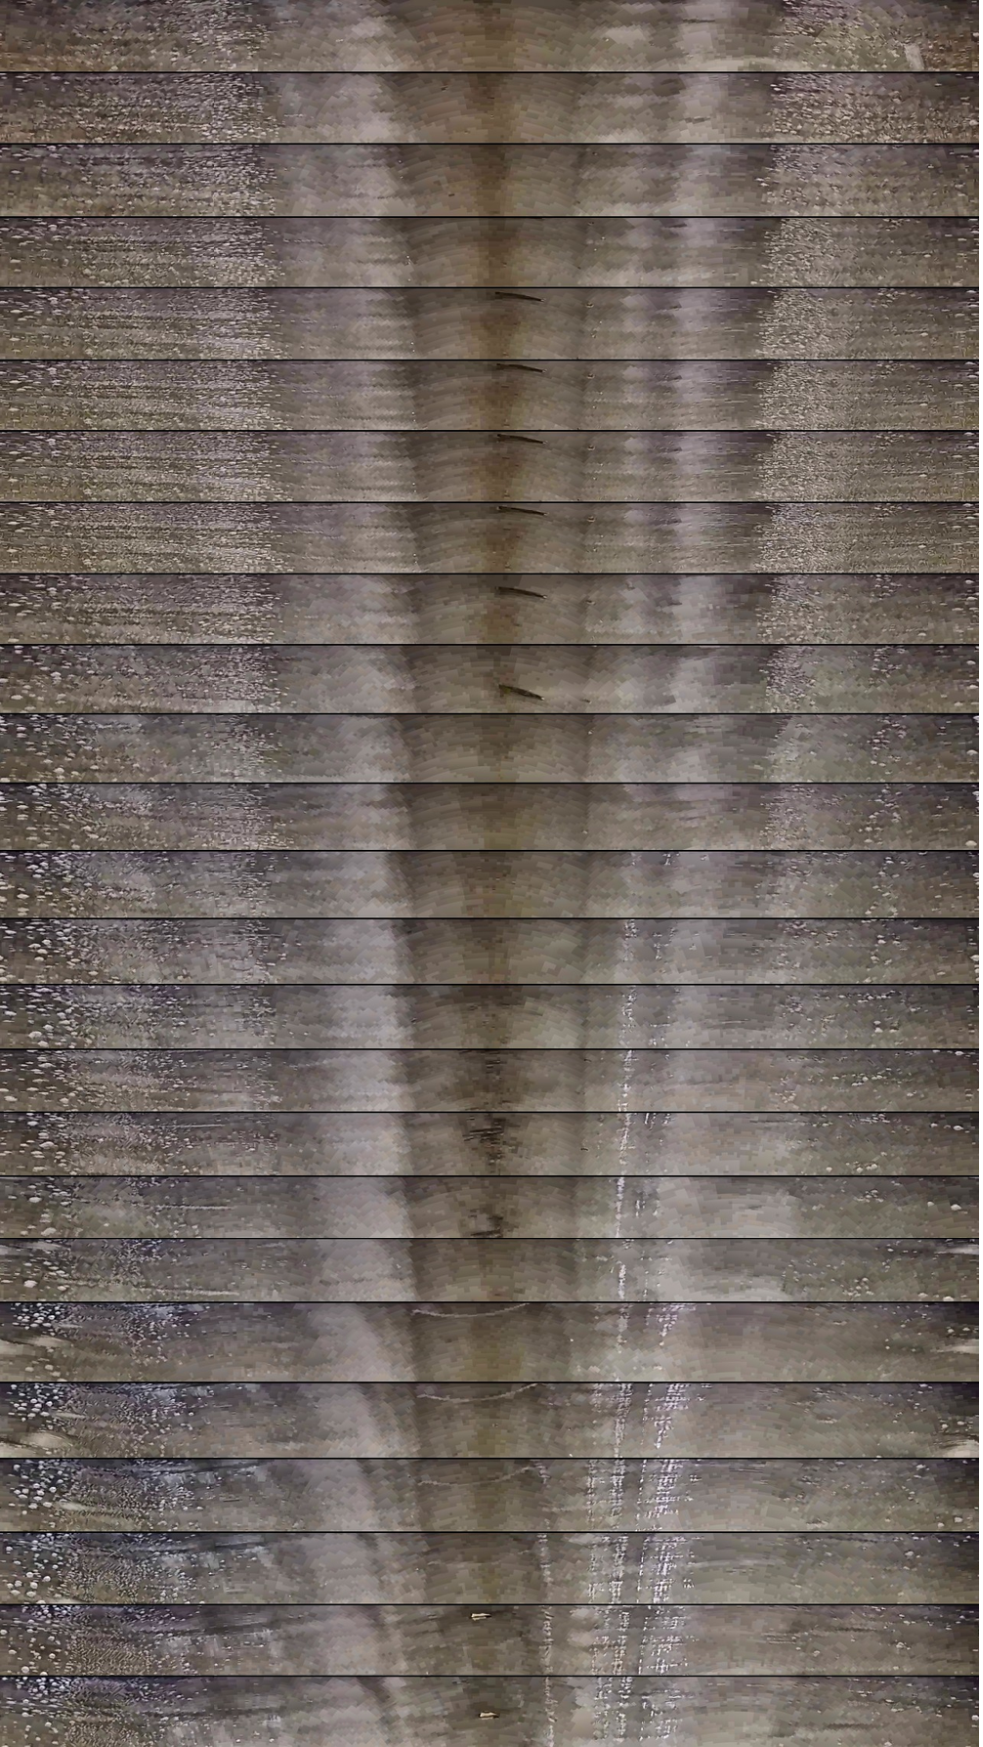
The sample frames highlight the strengths and weaknesses of the approach used in this paper. In frames without any obstructions, the estimated center is quite accurate when compared to the manual reference center, providing a basis for image unwrap. However, in frames with sediment or water, the process becomes significantly more challenging for the program. The center can still be estimated as long as the circular wall is visible. However, the sediment and water often tends to break up the circular shape of the pipe, making center estimation inaccurate. This means that image unwrapping is possible when the pipe’s contours are visible, but becomes difficult when obstructions limit the usable wall area.
Discussion
The pipe images assume that the pipe is circular, the water low enough for the pipe wall to be visible, and that the camera is parallel to the pipe axis. The assumption that the pipeline has a circular cross section is valid for the majority of sewer pipes but does not focus on non-circular geometries. For such cross sections, the polar unwrapping would not work, causing non-uniform stretching or compression in the output. Expanding the method to fit non-circular pipes would require detecting the boundary contour and applying an adaptive radial mapping. QV-Pipe imagery was used to examine a wide range of pipe conditions. The images show visual distortion of pipe features, which is expected when unwrapping a cylinder into a rectangle. This distortion is a tradeoff of the method. The original camera frame preserves the tunnel-like view of the pipe, but it is difficult to inspect because the wall curves around the center. The rectangular representation may make the wall easier to examine, but it cannot perfectly preserve the geometry of a curved surface. For inspection purposes, this tradeoff is acceptable because the goal is to improve visual interpretation and documentation rather than create a perfect three-dimensional reconstruction. This paper demonstrates that unwrapping pipe imagery into a remapped image can improve the visual interpretability of inspection images by making the pipe wall easier to examine. In the original circular camera view, defects are hard to view because they are curved around the center and appear radially distorted. Defects visible in the source image are remapped into the rectangular representation. The results suggest that rectangular representations can serve as an intermediate representation between raw camera footage and potential downstream automated analysis17,18,19,20. Lighting conditions are a major factor that directly affects the algorithm’s ability to accurately detect the center. The algorithm utilizes the detection of the dark central region to identify the pipe center. However, this assumption fails when water creates a reflection that can hide the dark center, when light enters and creates a bright spot, or when dust and debris cover the pipe opening, removing the dark region. In other studies, water level has been treated as a separate problem for computer vision through estimations with deep-learning21, demonstrating that water levels are an important visual condition in pipe inspection. In the QV-Pipe dataset, such frames were classified as a POOR-tier and excluded from the analysis. In true deployment, various strategies such as histogram equalization or multi frame averaging could mitigate the effects of lighting variability but these strategies were not evaluated in this paper. Future systems could first unwrap the pipe wall and then analyze the rectangular representation instead of trying to detect cracks or deposits from the pipe. This would make defect locations easier to describe because each point on the pipe wall would have a more consistent position in the output image. For example, a crack running along the pipe wall could be followed more easily across a remapped output than in the original circular view.
Comparison with Prior Work
Compared with prior pipe and borehole image-processing methods, this work emphasizes a simpler and lower-cost processing system for forward-facing pipe inspection images. Deng et al.9 also transform forward-looking imagery into a cylindrical panorama, but their work focuses on borehole analysis rather than drainage-pipe robot imagery.
| Method | Camera / Input Type | Approach | Uses 3D Geometry? | Main Output | Complexity |
| Z. Deng, M. Cao, Y. Geng, L. Rai | Forward-facing borehole video | Cylindrical panorama generation for borehole analysis | No | Panoramic borehole view | Medium |
| J. Künzel, T. Werner, R. Möller, P. Eisert, J. Waschnewski, R. Hilpert | Monocular fisheye pipeline imagery | Automatic sewer-pipe analysis by unrolling imagery | No | Unrolled pipe representation | Medium |
| P. Hansen, H. Alismail, P. Rander, B. Browning | Monocular fisheye imagery | Pipe mapping using camera imagery | No, map-focused | Pipe map | High |
| D. Zhang, W. Jackson, G. Dobie, G. West, C. MacLeod | Small-bore pipe inspection imagery | Structure-from-motion-based image unwrapping and stitching | Yes | Unwrapped and stitched pipe panorama | High |
| This paper | Forward-facing imagery | Center detection and polar-to-Cartesian unwrapping | No | Polar-remapped rectangular representation | Low |
Künzel et al.10 and Hansen et al.11 use imagery from fisheye lenses for sewer-pipe analysis and for pipe mapping whereas the process in this paper uses forward-facing camera images. Zhang et al.12 use a structure-from-motion-based method that uses movement across several frames in order to support image unwrapping and stitching. It also requires 3D construction and specialized imaging hardware, something this paper does not use. However, the method used in this paper does depend on several assumptions about pipe shape and inspection conditions. The pipe cross-section is assumed to be circular and the water low enough for the majority of the pipe wall to be viewable. The proposed image-processing method was tested using QV-Pipe dataset imagery. Thus, conclusions about deployment must only be limited to tested image-processing conditions. As such, no evaluation-ready footage from the robot’s camera was utilized in this paper. Thus, external datasets were used to evaluate footage from partially filled pipes. The QV-Pipe results show that real-world sewer footage is far more complex than ideal imagery. Most of the dataset was classified as ARCH rather than GOOD, which suggests that water level and partial visibility are major challenges. However, this does not invalidate the method but instead defines the conditions in which the method is most useful. The algorithm is optimal for dry pipes, storm drains, or pipe sections where the circular pipe geometry is clearly visible. For sewer pipes that are partially filled, a modified approach may be needed. This could be unwrapping only the visible upper arch or combining the camera with depth sensing. Another important aspect of the methodology used is distortion. When unwrapping a cylindrical surface onto a rectangular plane, some geometric distortion is to be expected. If the camera is not at the center of the pipe, distortion can become severe. Distortion can occur if the pipe wall is not evenly illuminated, or if the center detection system selects an inaccurate center. These factors can greatly decrease the accuracy of the final output image and must be addressed in future versions of the algorithm. A current limitation of the approach is that it assumes that the camera is aligned with the pipe axis. However, in real inspections, the robot can tilt, rotate, or even move off-center as it travels through the pipe. When the camera is not parallel to the pipe, then the pipe would not appear as a symmetric circle. Even without a full circular frame, an estimated center can still be calculated, however inaccuracies may make parts of the image stretched and other regions compressed. This means that the rectangular representation created by the algorithm is best used as an aid in inspection, not a perfect reconstruction of the pipe. Another limitation that the algorithm has is that it is too dependent on brightness differences. The center estimation works by assuming that the pipe center is darker than the pipe wall. This works well in many situations, but can fail when shadows, stains, or even water are darker than the actual pipe center. Uneven lighting can also create false dark regions. Updated versions of the algorithm could improve this flaw by combining darkness-based center detection with edge detection, circular Hough transforms, optical flow, or machine-learning-based segmentation. Despite the flaws, the approach remains a useful low-cost image-processing tool for pipeline inspection. This demonstrates that even with simple computer-vision methods, pipeline imagery can be converted into a representation that is easier to interpret. From an engineering perspective, the value of this approach lies with its simplicity and low cost. The method does not require specialized equipment, expensive sensors, or complex training data. Instead, it uses standard image processing tools and operates on ordinary camera frames. The current method is simple and does not require any specialized equipment and thus is practical for student-built robots, small municipalities, and early-stage prototypes. Currently, the method cannot operate under every field condition, but it does demonstrate how software processing can be useful in robotic inspection imagery. A few things must be worked on for future versions. First, the algorithm must be altered so that other factors such as shadows and uneven lighting no longer influence the accuracy of center detection accuracy. Second, the system should be tested with a waterproof robot so that partially filled pipes can be tested more rigorously. Third, a frame-to-frame stitching method should be created so that the final output can form a continuous rectangular wall map. Fourth, a downstream analysis module could be integrated after unwrapping to assist in identifying pipe conditions such as cracks, sediment buildup, corrosion, or blockages. Fifth, confidence scores should be added in the algorithm to display how trustworthy the rectangular representation will be per frame. A high confidence score would mean that the frame does not have any unsuitable factors and has adequate center-wall contrast. Low confidence scores would warn that shadows, water, and a lack of circular geometry make the unwrapped representation less reliable. This would allow the system to automatically identify high-confidence frames that are suitable for wall analysis and low-confidence frames that would need additional processing. These improvements would make the algorithm into more of a complete inspection tool rather than just visual enhancement. Existing methods have applied neural networks, hierarchical classifications, or other transforms to defect detection in CCTV footage. Cheng and Wang18, Kumar et al.19, Hassan et al.20, and Meijer et al.22 developed neural network based methods for defect detection whereas Li et al.23 and Xie et al.24 used hierarchical classification to break up the defect detection into different tasks. Hierarchical approaches have been created to address the uneven distribution of sewer defect classes23,24,25. These methods maintain the original tunnel perspective and produce labels for defect analysis. However, this study doesn’t classify defects but instead remaps the pipe walls into a rectangular representation. Labels could be used with these remapped images but the model would have to be specifically trained for that type of image before analysis26. Other studies locate defects within the original image rather than assigning labels27,28,29,30,31,32. These approaches produce bounding boxes that are tied to the original camera point of view. This study’s rectangular representation could describe a detected location in angular and radial coordinates, which could make its position in the pipe easier to describe. However, bounding-box methods currently used cannot be directly used as they must be transformed to account for the changed coordinate system. Other approaches combine multiple frames when tracking defects or utilize 3D constructions of the pipes33,34. These methods use multiple frame geometry whereas the current system remaps individual frames without creating a three-dimensional structure. Other complex methods utilize semantic segmentation or pixel segmentation to assign defects at the pixel level35,36. The method described in the paper is a lot more computationally simple but lacks some of the detailed spatial output provided by previously mentioned methodologies. Overall, the polar-remapped representation is not a classifier or detector. It is intended to act as a possible intermediate step before specific detection methods are applied. The present study does not demonstrate that image remapping improves defect detection performance or accuracy.
Conclusion
The project demonstrates that pipe inspection images acquired in a forward-looking mode can be transformed into a polar-remapped rectangular representation using low-cost computer-vision techniques. The main contribution of this work is an image-processing pipeline to convert circular views of pipes into polar-remapped rectangular representations. This representation organizes pipe wall imagery into angular and radial coordinates. We present a Python-based image processing system that maps circular forward-looking pipe images to polar-remapped rectangular representations using polar-to-Cartesian remapping. Grayscale blob analysis was used to estimate pipe center and images were unwrapped around the central 70% of the image. The quantitative evaluation on 50 GOOD frames shows that the center-detection algorithm has a mean center error of 20.79 pixels with 76% of the frames within 10% of R. The uneven lighting and large shadows affected the estimated center conditions and therefore the process accuracy was decreased. The tests on the QV-Pipe dataset demonstrated that the process can be applied practically and can successfully process the selected images. Moreover, the accuracy can be reduced by the reflections and obscured areas of the pipe walls, which make it difficult to measure partially filled pipes. In sum, this paper clearly shows that low cost computer-vision techniques can create a structured representation of the pipe and it can be used to improve inspection and maintenance of pipeline infrastructure. However, the results also clearly show that there are limitations to the methods used. The QV-Pipe classification is most effective in frames where the pipe is circular and there is sufficient light. The method is ineffective with ARCH-type videos. Future improvements of this study must focus on improving stitching, center detection, confidence score for every frame and finding appropriate analysis tools to do post-processing. It works best on a pipe wall that is mostly visible and evenly lit in a circle. Accuracy is decreased by heavy shadows and weak visibility of center, partly filled pipes. But these limitations are useful in that they point out the next system engineering challenge. This method can be made a more powerful tool for maintaining drainage infrastructure by improving center detection, stitching, adding a confidence score, and an automated pipeline condition analysis tool.
References
- U.S. Environmental Protection Agency. Water efficiency for water suppliers. 2026. [↩]
- American Society of Civil Engineers. 2025 report card for America’s infrastructure. 2025. [↩]
- Water Environment Federation. Wastewater collection systems management, manual of practice no. 7 (7th ed.). Water Environment Federation, 2021. [↩]
- U.S. Environmental Protection Agency. Demonstration of innovative sewer system inspection technology. U.S. Environmental Protection Agency, 2014. [↩]
- U.S. Environmental Protection Agency. Collection systems O&M fact sheet: sewer cleaning and inspection. n.d. [↩]
- National Association of Sewer Service Companies. Pipe condition assessment using CCTV: guideline specification. 2020. [↩]
- R. R. Marangoni, R. Baron. Pipeline inspection robot. Proceedings of the 58th Ilmenau Scientific Colloquium, Technische Universität Ilmenau, 2014. [↩]
- A. Tony, A. Noushad, A. Ninan, A. V. Alwin, K. V. Naveen Prakash. Design and fabrication of an in-pipe inspection robot for crack analysis and detection using OpenCV and visual odometry. International Research Journal of Engineering and Technology. Vol. 10, pg. 353-357, 2023. [↩]
- Z. Deng, M. Cao, Y. Geng, L. Rai. Generating a cylindrical panorama from a forward-looking borehole video for borehole condition analysis. Applied Sciences. Vol. 9, pg. 3437, 2019, https://doi.org/10.3390/app9163437. [↩] [↩] [↩]
- J. Künzel, T. Werner, R. Möller, P. Eisert, J. Waschnewski, R. Hilpert. Automatic analysis of sewer pipes based on unrolled monocular fisheye images. 2019. [↩] [↩]
- P. Hansen, H. Alismail, P. Rander, B. Browning. Pipe mapping with monocular fisheye imagery. IEEE/RSJ International Conference on Intelligent Robots and Systems (IROS), 2013. [↩] [↩]
- D. Zhang, W. Jackson, G. Dobie, G. West, C. MacLeod. Structure-from-motion based image unwrapping and stitching for small bore pipe inspections. Computers in Industry. Vol. 139, pg. 103664, 2022, https://doi.org/10.1016/j.compind.2022.103664. [↩] [↩]
- S. S. Yoo, H.-S. Lee. An inverse perspective mapping-based approach for generating panoramic images of pipe inner surfaces. Sensors. Vol. 23, pg. 5363, 2023, https://doi.org/10.3390/s23125363. [↩]
- N. Zong, W. Al-Nuaimy, P. Worthington. Borehole inner surface visualization system with vibration cancellation and trajectory smoothing based on optical monocular video camera. SN Computer Science. Vol. 6, pg. 453, 2025, https://doi.org/10.1007/s42979-025-03967-6. [↩]
- M. M. Salvatore, A. Galloro, L. Muzzi, G. Pullano, P. Odry, G. Carbone. Design of PEIS: a low-cost pipe inspector robot. Robotics. Vol. 10, pg. 74, 2021, https://doi.org/10.3390/robotics10020074. [↩]
- Y. Liu, X. Zhang, Y. Li, G. Liang, Y. Jiang, L. Qiu, H. Tang, F. Xie, W. Yao, Y. Dai, Y. Qiao, Y. Wang. QV-Pipe: a large-scale video dataset for urban pipe inspection (VideoPipe Challenge at ICPR 2022). 2022. [↩]
- J. B. Haurum, T. B. Moeslund. Sewer-ML: a multi-label sewer defect classification dataset and benchmark. Proceedings of the IEEE/CVF Conference on Computer Vision and Pattern Recognition (CVPR), 2021. [↩]
- J. C. P. Cheng, M. Wang. Automated detection of sewer pipe defects in closed-circuit television images using deep learning techniques. Automation in Construction. Vol. 95, pg. 155-171, 2018, https://doi.org/10.1016/j.autcon.2018.08.006. [↩] [↩]
- S. S. Kumar, D. M. Abraham, M. R. Jahanshahi, T. Iseley, J. Starr. Automated defect classification in sewer closed circuit television inspections using deep convolutional neural networks. Automation in Construction. Vol. 91, pg. 273-283, 2018, https://doi.org/10.1016/j.autcon.2018.03.028. [↩] [↩]
- S. I. Hassan, L. M. Dang, I. Mehmood, S. Im, C. Choi, J. Kang, Y. Park, H. Moon. Underground sewer pipe condition assessment based on convolutional neural networks. Automation in Construction. Vol. 106, pg. 102849, 2019, https://doi.org/10.1016/j.autcon.2019.102849. [↩] [↩]
- J. B. Haurum, C. H. Bahnsen, M. Pedersen, T. B. Moeslund. Water level estimation in sewer pipes using deep convolutional neural networks. Water. Vol. 12, pg. 3412, 2020, https://doi.org/10.3390/w12123412. [↩]
- D. Meijer, L. Scholten, F. Clemens, A. Knobbe. A defect classification methodology for sewer image sets with convolutional neural networks. Automation in Construction. Vol. 104, pg. 281-298, 2019, https://doi.org/10.1016/j.autcon.2019.04.013. [↩]
- D. Li, A. Cong, S. Guo. Sewer damage detection from imbalanced CCTV inspection data using deep convolutional neural networks with hierarchical classification. Automation in Construction. Vol. 101, pg. 199-208, 2019, https://doi.org/10.1016/j.autcon.2019.01.017. [↩] [↩]
- Q. Xie, D. Li, J. Xu, Z. Yu, J. Wang. Automatic detection and classification of sewer defects via hierarchical deep learning. IEEE Transactions on Automation Science and Engineering. Vol. 16, pg. 1836-1847, 2019, https://doi.org/10.1109/TASE.2019.2900170. [↩] [↩]
- L. M. Dang, S. Kyeong, Y. Li, H. Wang, T. N. Nguyen, H. Moon. Deep learning-based sewer defect classification for highly imbalanced dataset. Computers & Industrial Engineering. Vol. 161, pg. 107630, 2021, https://doi.org/10.1016/j.cie.2021.107630. [↩]
- C. F. Siu, M. Wang, J. C. P. Cheng. A framework for synthetic image generation and augmentation for improving automatic sewer pipe defect detection. Automation in Construction. Vol. 137, pg. 104213, 2022, https://doi.org/10.1016/j.autcon.2022.104213. [↩]
- S. S. Kumar, M. Wang, D. M. Abraham, M. R. Jahanshahi, T. Iseley, J. C. P. Cheng. Deep learning-based automated detection of sewer defects in CCTV videos. Journal of Computing in Civil Engineering. Vol. 34, pg. 04019047, 2020, https://doi.org/10.1061/(ASCE)CP.1943-5487.0000866. [↩]
- A. Hawari, M. Alamin, F. Alkadour, M. Elmasry, T. Zayed. Automated defect detection tool for closed-circuit television (CCTV) inspected sewer pipelines. Automation in Construction. Vol. 89, pg. 99-109, 2018, https://doi.org/10.1016/j.autcon.2018.01.004. [↩]
- D. Li, Q. Xie, Z. Yu, Q. Wu, J. Zhou, J. Wang. Sewer pipe defect detection via deep learning with local and global feature fusion. Automation in Construction. Vol. 129, pg. 103823, 2021, https://doi.org/10.1016/j.autcon.2021.103823. [↩]
- S. Goharinezhad, A. Hadi, S. Mirzaei. Automated defect classification and localization in sewer pipelines using hybrid ResNet50-Swin Transformer and modified YOLOv8 on CCTV inspection images. Scientific Reports. Vol. 15, pg. 41755, 2025, https://doi.org/10.1038/s41598-025-27765-5. [↩]
- J. Zhang, X. Liu, X. Zhang, Z. Xi, S. Wang. Automatic detection method of sewer pipe defects using deep learning techniques. Applied Sciences. Vol. 13, pg. 4589, 2023, https://doi.org/10.3390/app13074589. [↩]
- Y. Tan, R. Cai, J. Li, P. Chen, M. Wang. Automatic detection of sewer defects based on improved You Only Look Once algorithm. Automation in Construction. Vol. 131, pg. 103912, 2021, https://doi.org/10.1016/j.autcon.2021.103912. [↩]
- R. Liu, Z. Shao, Q. Sun, Z. Yu. Defect detection and 3D reconstruction of complex urban underground pipeline scenes for sewer robots. Sensors. Vol. 24, pg. 7557, 2024, https://doi.org/10.3390/s24237557. [↩]
- M. Wang, S. S. Kumar, J. C. P. Cheng. Automated sewer pipe defect tracking in CCTV videos based on defect detection and metric learning. Automation in Construction. Vol. 121, pg. 103438, 2021, https://doi.org/10.1016/j.autcon.2020.103438. [↩]
- Y. Li, H. Wang, L. M. Dang, M. J. Piran, H. Moon. A robust instance segmentation framework for underground sewer defect detection. Measurement. Vol. 190, pg. 110727, 2022, https://doi.org/10.1016/j.measurement.2022.110727. [↩]
- G. Pan, Y. Zheng, S. Guo, Y. Lv. Automatic sewer pipe defect semantic segmentation based on improved U-Net. Automation in Construction. Vol. 119, pg. 103383, 2020, https://doi.org/10.1016/j.autcon.2020.103383. [↩]