Abstract
This paper examines how well generative AI (GenAI) systems engage in proactive reasoning—whether they can detect problems on their own, draw on relevant knowledge, and adjust their analysis without explicit instruction. To investigate this, we conducted an exploratory study focusing on three widely used GenAI systems: ChatGPT, Claude, and Copilot. Each system was asked to analyze charts intentionally designed to be misleading. We used structured prompts to evaluate whether the systems understood the chart flaws, applied that understanding proactively when answering both open-ended and closed-ended questions, and how their performance changed when analyzing the same charts without flaws. Our results show that while GenAI systems can detect misleading chart designs, they apply that knowledge inconsistently. At times, they correctly identify the flaw and provide an accurate interpretation. In other cases, they ignore the flaw entirely and confidently present an incorrect analysis. Sometimes they avoid analyzing the chart at all and instead rely on outside knowledge to answer the question. Overall, the study finds that while GenAI systems are capable of proactive reasoning, their performances are inconsistent across tasks and prompts. More research is needed to understand when these systems apply proactive reasoning effectively and how to improve their reliability.
Keywords: GenAI systems, proactive reasoning, misleading charts, exploratory research
Introduction
Generative AI (GenAI) is a transformative technology that redefines many aspects of how we learn and work. R. He et al. (2025) define GenAI as “a group of AI algorithms and models that are capable of producing new content, including texts, images, videos and problem-solving strategies, with human-like creativity and adaptability1.” Many applications in science and in other fields demonstrate GenAI’s transformative nature. It is used to generate patient-friendly radiology summary reports2, advance climate modeling and prediction3, discover novel antibiotics effective against resistant pathogens4, personalize learning5, and detect financial fraud6.
GenAI applications employ generative models, and there are two common types: LLMs (large language models) and LMMs (large multimodal models). LLMs can write essays, answer questions, summarize articles and more. LMMs, on the other hand, can not only handle text but also images. For example, LMMs can read a chart and explain what it is showing.
The reasoning of GenAI systems differs fundamentally from human thinking. Instead of understanding ideas and logic the way people do, these models learn patterns from huge amounts of text. When asked a question, they generate an answer by predicting what words are most likely to come next based on those patterns. Because GenAI applications use probabilities to generate responses, they may give different answers to the same question at different times. They can convincingly and fluently present wrong answers, a well-known behavior known as hallucinating7. Since these models rely on pattern recognition rather than true understanding, they can be creative and helpful but may struggle with tasks that require consistent reasoning.
Most studies on the reasoning behind GenAI systems have focused on how they respond to prompts—this is known as reactive reasoning. In other words, researchers have looked at how GenAI improves its responses when a user provides clear instructions (prompts) or examples. However, this paper focuses on a less explored topic: proactive reasoning8; the unsolicited application of relevant knowledge during task execution [1]. What initiative does a generative model take when solving a problem? Which of its sources of knowledge does it rely on? Understanding GenAI’s proactive reasoning capabilities is important for several reasons: (1) It helps us better understand GenAI’s underlying processes and the gaps that reactive reasoning needs to fill, and (2) GenAI systems are widely used by everyday users who aren’t trained in prompt engineering (knowing what prompts to ask). These users typically rely on simple prompts and depend heavily on the model’s built-in ability to take initiative rather than taking it themselves.
As GenAI becomes more integrated into our daily activities, it’s crucial to understand how it reacts and thinks ahead. The remainder of this paper is structured as follows. We begin with a literature review. Next, we outline the design of our research study, including the research questions we are exploring. Following, we present and analyze the results of our experiment. Finally, we conclude with a summary of findings, discuss the study’s limitations, and propose directions for future research.
Literature Review
This paper combines ideas from visual analysis and artificial intelligence. Visual analysis focuses on how people read charts and use them to make decisions. Researchers have closely studied how people process visual information9,10,11. Some of this research examines how changes to a chart’s design can affect the message people take from it9,12,13. For example, Lo, Gupta, Shigyo, Wu, Berini, and Qu (2022)13 identify seventy-four different ways a chart’s design can be manipulated. Deceptive charts are visuals that are intentionally designed to mislead viewers and distort the conclusions they draw.
Artificial intelligence (AI) involves building computer systems that can perform tasks that normally require human intelligence. As mentioned earlier, GenAI is a type of AI that can create new content, such as text, images, or charts, using large language models14. A growing body of research examines how GenAI systems can read, interpret, and analyze charts. For example, Liu et al. (2024)15 study how these systems extract information from different types of charts. Liu et al. (2023)16 demonstrate how GenAI systems can efficiently reason about information in a chart by first converting it into data tables.
A few studies explore the extent to which GenAI systems can detect and handle misleading visual designs. Alexander et al. (2024)17 examine how different prompting techniques affect the accuracy of GenAI systems in detecting specific misleaders. Similarly, Lo and Qu (2025)18 analyze the impact of different prompting strategies on the ability of GenAI systems to identify and explain misleading charts. These studies focus on how GenAI systems respond to prompts. In other words, researchers have looked at how GenAI improves its responses when a user provides clear instructions (prompts) or examples. By contrast, this paper explores proactive reasoning by GenAI systems in the analysis of misleading charts.
Research Design
This study uses an exploratory research approach because the proactive use of knowledge by GenAI systems is still a relatively new and poorly understood phenomenon. The goal is to identify and describe proactive behavior when analyzing flawed charts and to suggest areas for future research. Because exploratory research focuses on initial observations, the findings should be considered preliminary. Additional research is needed to determine how common and reliable these behaviors are.
We conducted an experiment in which GenAI systems were prompted to analyze charts containing intentional design flaws we created. Successful completion of this task requires GenAI systems to not only have basic chart interpretation skills but also an awareness of how visual elements can distort analysis. Our goal is to examine whether these GenAI systems possess such knowledge and whether they apply it proactively during analysis. This section proceeds in four stages: first, we describe the misleading charts used in the experiment; second, we outline the specific prompts given to the GenAI systems; third, we detail this study’s research questions; fourth, we describe what systems we used and how we set them up.
Misleading Charts
For this experiment, we created three misleading charts. Table 1 displays them in a two-column format, with misleading visualizations in the left column and their corrected counterparts in the right column. The misleading features of each chart are discussed below.
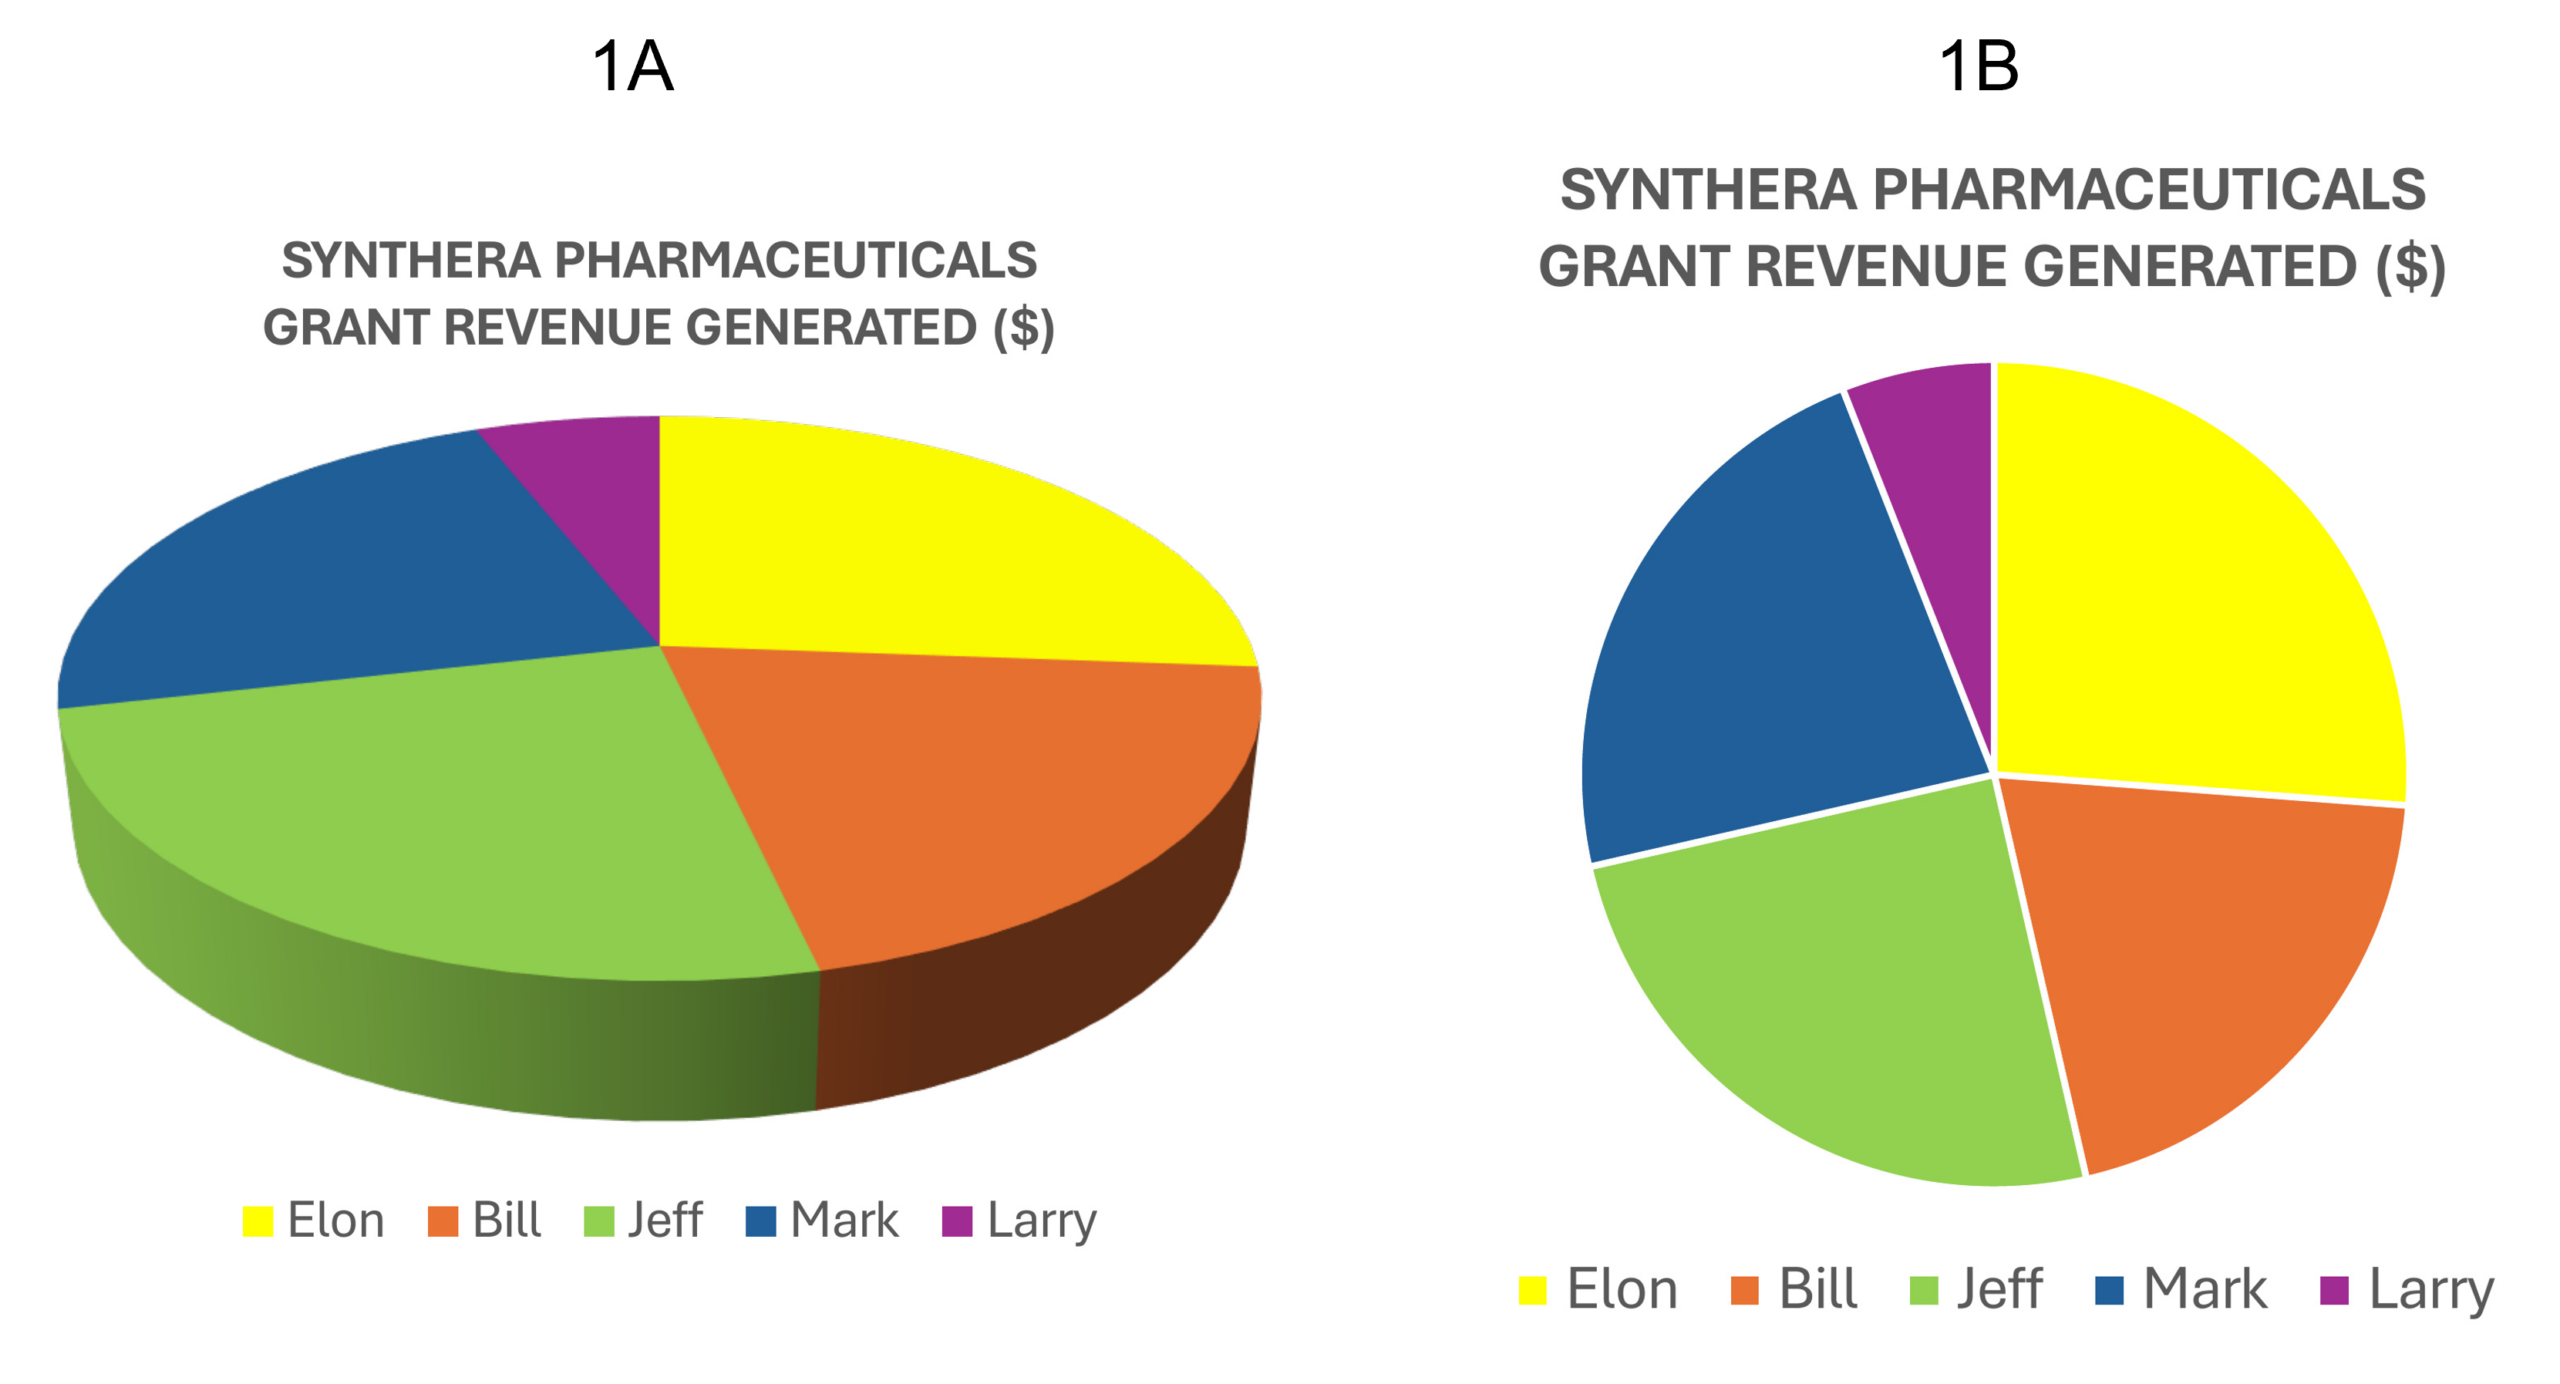
Chart#1. A pie chart shows how an amount is divided into parts. A slice represents how much a part contributes to the whole. In Figure 1(A), the chart shows how much grant money each employee at a pharmaceutical company brought in. Each slice stands for one employee’s relative share of the total grant money.
Figure 1(A) uses a three-dimensional (3D) pie chart, a format known to introduce visual distortions19,20. In particular, slices positioned near the front of the chart tend to appear larger than they actually are, while those placed toward the back seem smaller. For example, Jeff’s portion of the pie appears exaggerated, whereas Elon’s contribution is visually minimized. Figure 1(B) displays the same data using a two-dimensional pie chart, which avoids such distortions.
It should be noted that neither humans nor GenAI can derive the exact underlying numbers from pie charts10. The actual numbers used to generate this chart are Elon 26.19%, Jeff 25%, Bill 20.24%, Mark 22.62%, and Larry 5.95%.
Table 1 | Charts
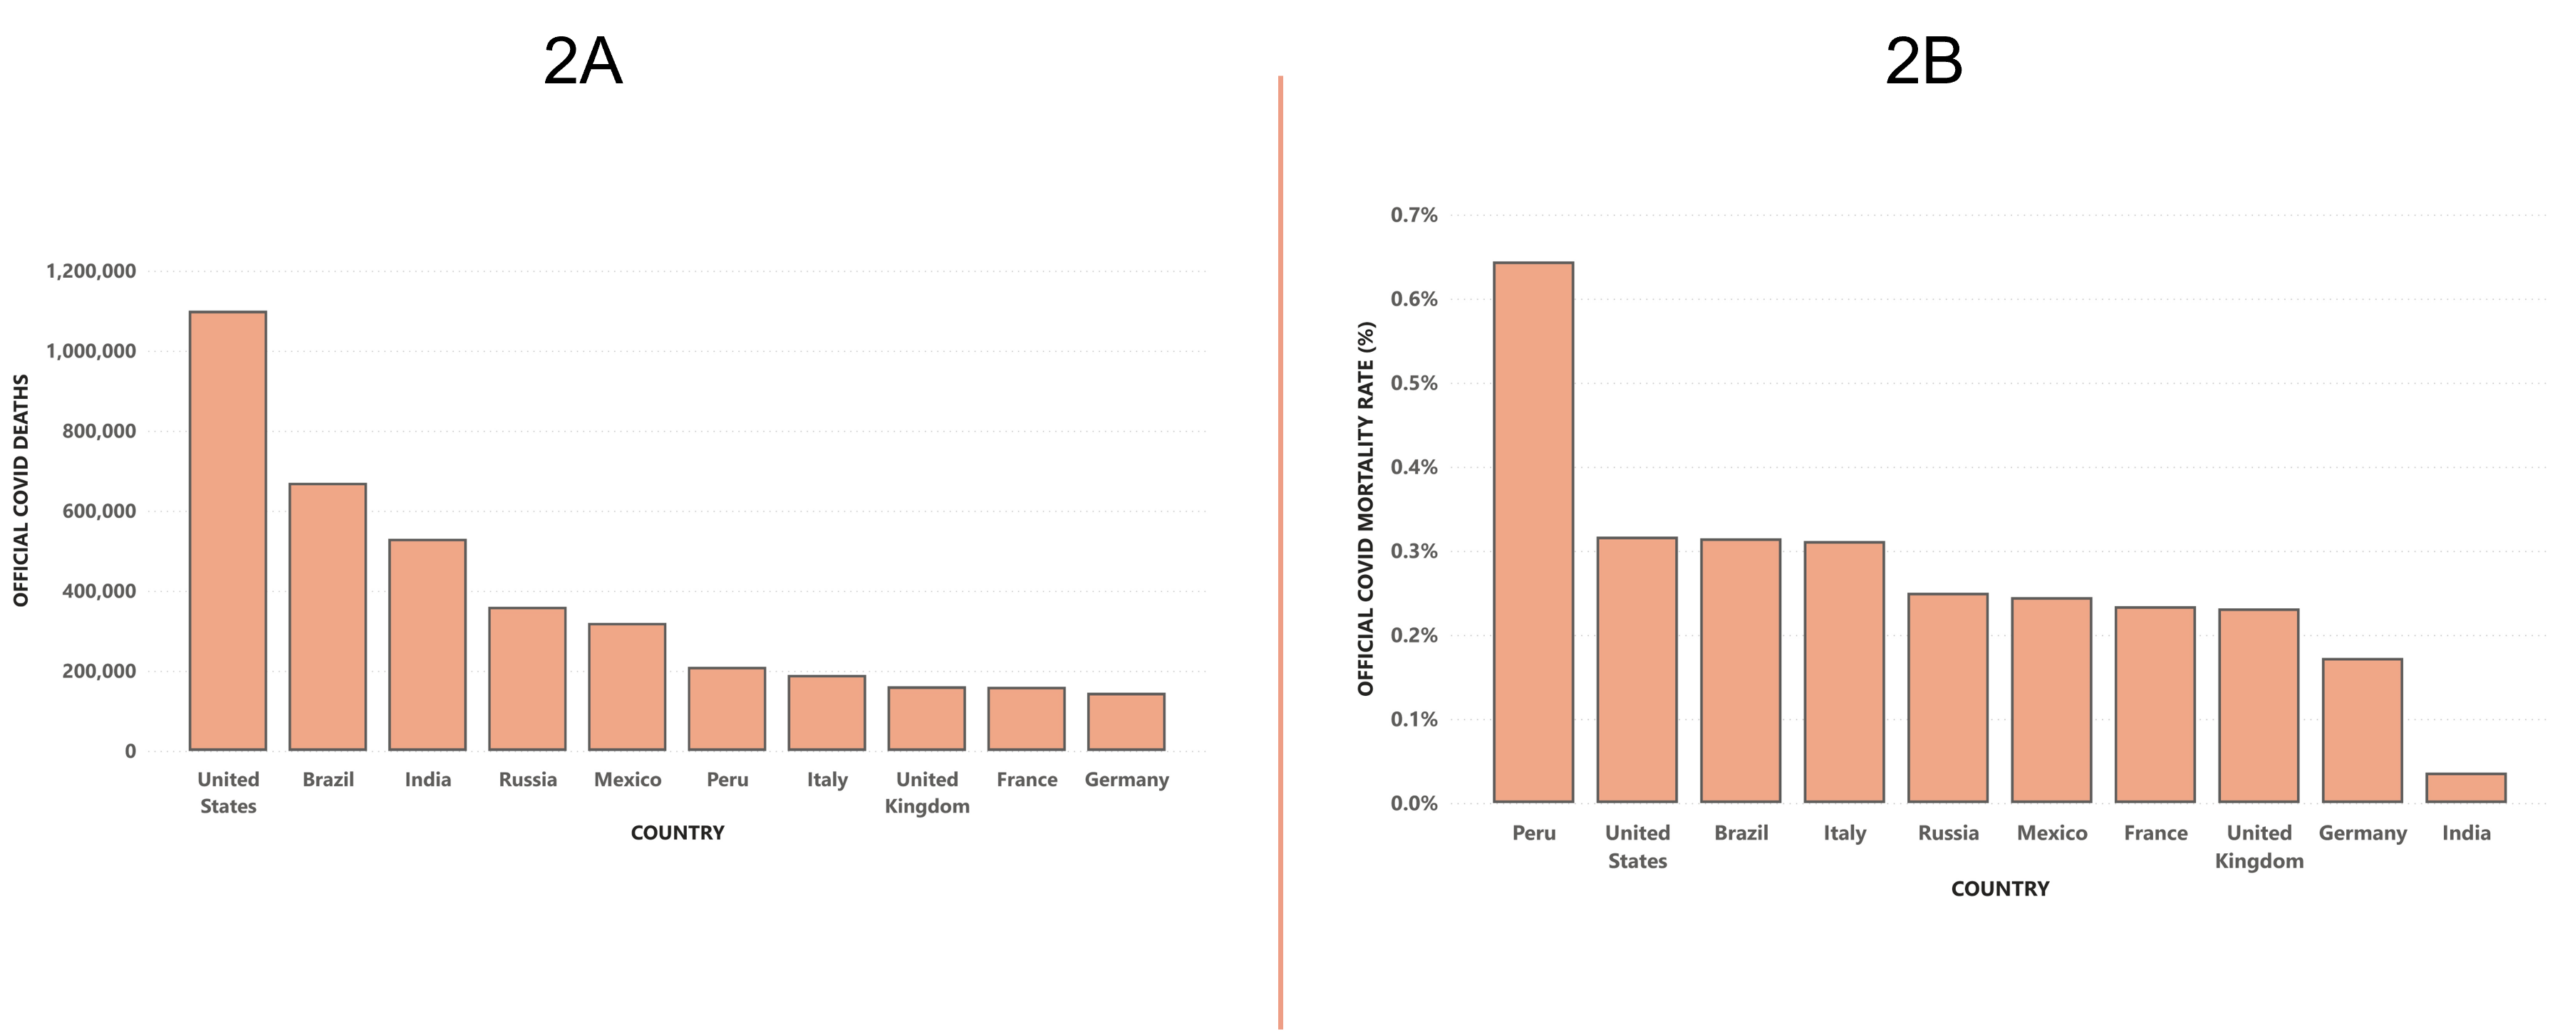
Chart#2. Figure 2(A) displays a column chart showing the total number of COVID-related deaths by country, ranked from highest to lowest. The horizontal axis lists the countries being compared, while the vertical axis indicates the number of deaths reported in each country.
Although the chart presents factual data, its design introduces a significant flaw: it gives the misleading impression that individuals in the United States were more likely to die from COVID than those in other countries. This misinterpretation stems from a well-documented issue known as denominator distortion20, which occurs when raw totals are presented without accounting for relevant context—such as differences in population size amongst the listed countries. Figure 2(B) offers a corrected version of the chart. By adjusting the data to reflect deaths per capita, the rankings shift considerably, providing a more accurate and meaningful comparison across countries.
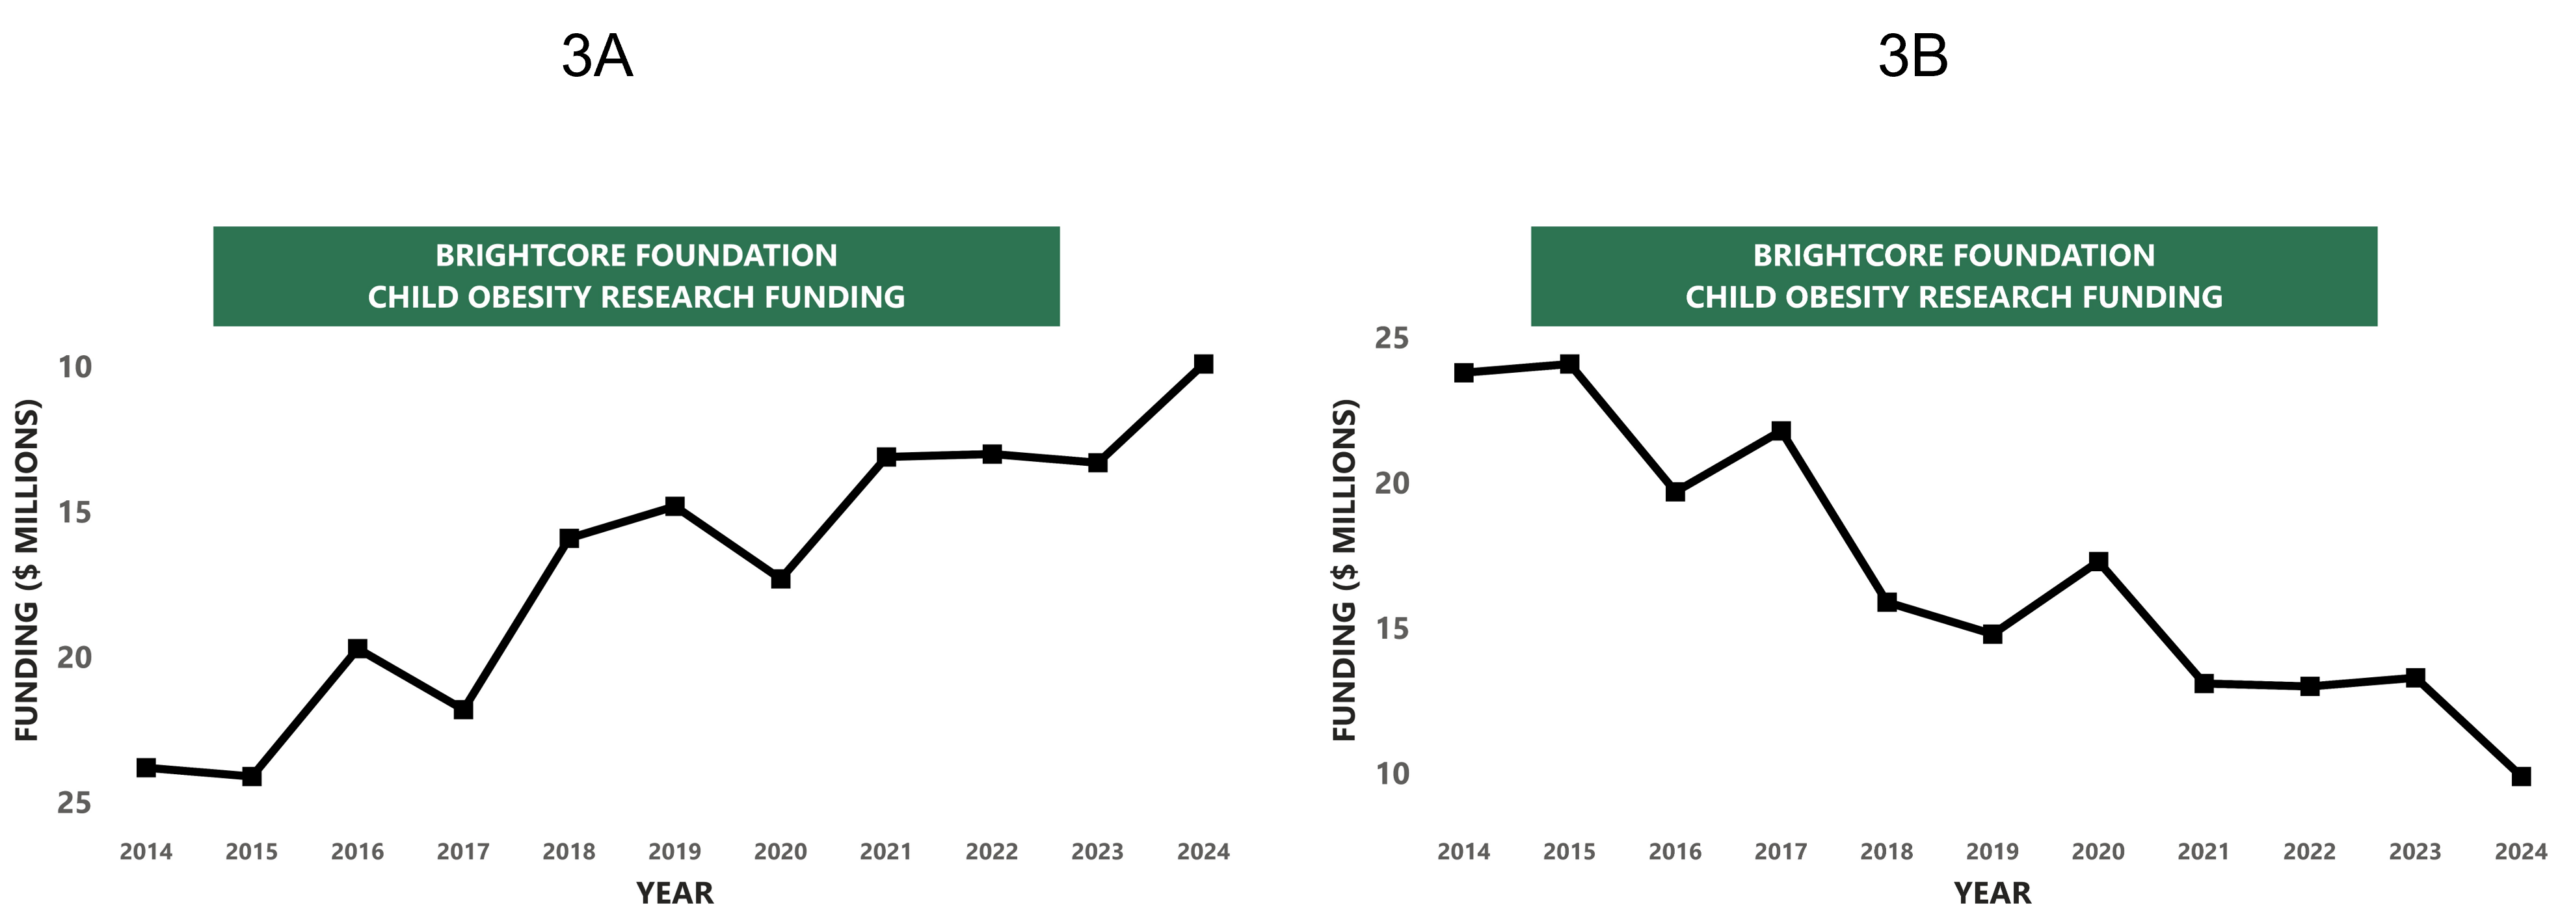
Chart#3. Line charts are commonly used to show how a particular value changes over time. In these charts, the vertical axis (Y-axis) usually represents the variable being measured, while the horizontal axis (X-axis) shows the time intervals.
In Figure 3(A), the chart tracks funding amounts over multiple years, allowing viewers to observe trends and shifts. The design flaw in this chart lies in the inversion of the Y-axis: higher values are positioned at the bottom, while lower values appear at the top. This reversal is widely recognized as misleading21. In standard visual conventions, upward movement typically signifies growth or improvement, whereas downward movement suggests decline. By flipping the axis, the chart distorts this familiar pattern, making a decrease in funding appear as an upward trend and thereby misrepresenting the underlying data. Figure 3(B) presents the corrected version of the chart. The negative funding trend becomes clear when the Y-axis is displayed conventionally, with higher values at the top.
The flawed design of the three charts (left column of Table 1) is intentional and tailored to the goals of our study. In addition, charts 1 and 3 are fictional to ensure that GenAI systems cannot rely on prior knowledge and must instead reason solely from the visual information presented.
Prompts
This study investigates proactive reasoning in GenAI systems by examining how they interpret and respond to charts that contain misleading design elements. To guide this investigation, we developed the following structured set of prompts.
Prompts applied to misleading charts:
P1. Is this a misleading chart?
P2. What insights can you generate from this chart?
P2f. Did you consider the chart’s misleading design? [2]
The prompts in Table 2 are used for this purpose.
P3. Chart-specific prompts that require a single correct answer (deterministic).
The prompts in Table 3 are used for this purpose.
P3f. Did you consider the chart’s misleading design? The prompts in Table 2 are used for this purpose.
Prompts applied to correct charts:
P4. Chart-specific prompts that require a single correct answer (deterministic). The prompts in Table 3 are used for this purpose.
| Chart# | Follow-Up Question |
| 1 | Did you notice that this is a 3D chart, which can distort how the data are perceived? |
| 2 | Did you notice that the numbers are misleading if the population is not being considered? |
| 3 | Did you notice that the Y-axis is inverted? |
| Chart# | Deterministic Question | Expected Outcomes |
| 1 | At the end of the year, you plan to distribute a $10,000 bonus among five employees, proportionate to the grant revenue each has generated. How would you fairly allocate the bonus—both in percentages and dollar amounts—across the team? | Elon $2,619, Jeff $2,500, Mark $2,262, Bill $2,024, Larry $595. These are the actual numbers used to generate the chart. However, these numbers or their related percentages cannot be determined from a pie chart. |
| 2 | In what country are you most likely to die from Covid? | It is impossible to answer this question without knowing the population size. |
| 3 | Given the trend during the last 10 years, do you expect funding to grow or to decline in the next five years? | Decline. |
Table 4 shows the full prompt structure used for each of the three GenAI systems in the experiment.
| Chart# | Prompt# | Prompt |
| 1 | P1 | Is this a misleading chart? |
| 1 | P2 | What insights can you generate from this chart? |
| 1 | P2f | Did you notice that this is a 3D chart, which can distort how the data are perceived? |
| 1 | P3 | At the end of the year, you plan to distribute a $10,000 bonus among five employees, proportionate to the grant revenue each has generated. How would you fairly allocate the bonus—both in percentages and dollar amounts—across the team? |
| 1 | P3f | Did you notice that this is a 3D chart, which can distort how the data are perceived? |
| 1 | P4 | At the end of the year, you plan to distribute a $10,000 bonus among five employees, proportionate to the grant revenue each has generated. How would you fairly allocate the bonus—both in percentages and dollar amounts—across the team? |
| 2 | P1 | Is this a misleading chart? |
| 2 | P2 | What insights can you generate from this chart? |
| 2 | P2f | Did you notice that the numbers are misleading if the population is not being considered? |
| 2 | P3 | In what country are you most likely to die from Covid? |
| 2 | P3f | Did you notice that the numbers are misleading if the population is not being considered? |
| 2 | P4 | In what country are you most likely to die from Covid? |
| 3 | P1 | Is this a misleading chart? |
| 3 | P2 | What insights can you generate from this chart? |
| 3 | P2f | Did you notice that the Y-axis is inverted? |
| 3 | P3 | Given the trend during the last 10 years, do you expect funding to grow or to decline in the next five years? |
| 3 | P3f | Did you notice that the Y-axis is inverted? |
| 3 | P4 | Given the trend during the last 10 years, do you expect funding to grow or to decline in the next five years? |
Research Questions
The prompts were developed to investigate research questions about how GenAI systems reason proactively. We used the exact same prompts for all three systems. Below, we will examine each research question in more detail and explain how it contributes to our research.
RQ1: What relevant knowledge does the GenAI system possess for solving the problem?
Before evaluating how effectively a GenAI system applies its understanding, we must first determine what it knows. This initial step establishes a baseline for assessing its reasoning. Prompt P1 is designed to determine whether a system can identify the presence of a design flaw. Based on GenAI’s response, we classify the outcome as either:
Yes – the GenAI system correctly identifies the flaw in the chart’s design and/or provides an accurate explanation.
No – the GenAI system does not recognize the flaw and/or does not explain it correctly.
RQ2: How effectively does the GenAI system proactively apply its knowledge when responding to open-ended questions?
This research question evaluates a GenAI system’s ability to extract meaningful information from a chart despite its flawed design. We use prompts P2 and P2f to assess this. These prompts ask the system to analyze the chart (P2) and assess whether it uses its knowledge of the chart’s design flaw (P2f). Based on the responses, we classify the GenAI system’s performance into four categories:
No / No – The analysis is inaccurate, and the GenAI system does not use its knowledge about the design flaw.
No / Yes – The analysis is inaccurate, but the GenAI system uses its knowledge about the design flaw.
Yes / No – The analysis is accurate, but the GenAI system does not use its knowledge about the design flaw.
Yes / Yes – The analysis is accurate, and the GenAI system uses its knowledge of the design flaw.
RQ#3: How effectively does the GenAI system proactively apply its knowledge when responding to closed-ended questions?
This research question examines whether a GenAI system’s answer to a deterministic question is accurate and accounts for the chart’s design flaw. We use prompts P3 and P3f to evaluate this. These prompts ask the system to answer a chart-specific question (P3) and assess whether it uses its knowledge of the chart’s design flaw (P3f). Based on the responses, we classify the system’s performance into four categories:
No / No – The answer is incorrect, and the GenAI system does not use its knowledge about the design flaw.
No / Yes – The answer is incorrect, but the GenAI system uses its knowledge about the design flaw.
Yes / No – The answer is correct, but the GenAI system does not use its knowledge about the design flaw.
Yes / Yes – The answer is correct, and the GenAI system uses its knowledge of the design flaw.
RQ#4: Can the GenAI system solve the problem?
This question explores whether a GenAI system can accurately answer a chart-specific question when given the correct chart. P4 is designed to provide us with this information. Based on its response, we can classify the outcome as Yes or No.
Software Setup
We ran our experiment using three GenAI systems: ChatGPT, Claude, and Copilot. ChatGPT is a GenAI system developed by OpenAI, and we used the GPT-5-powered version, which was released on August 7, 2025. Claude is a GenAI system developed by Anthropic, and we used Sonnet 4.5, which was released on September 29, 2025. ChatGPT and Claude follow a discrete release model with periodic, major version drops. Copilot is a GenAI system developed by Microsoft. We used the November 1st, 2025 version. Copilot follows a continuous deployment model with ongoing updates and no public version numbers. All three systems are multimodal and have the ability to upload and analyze charts.
We created the charts using Excel and Power BI, took screenshots of them, saved them, and then imported them into each GenAI system.
GenAI systems have memory capabilities. We wanted to ensure that prompts were not affected by other prompts or previous related conversations with the systems. Therefore, we used different memory reset mechanisms specific to each system. For ChatGPT, we ran our sessions[2] in incognito mode. For Claude, we started a new conversation for each session. For CoPilot, we manually cleaned the memory for each session. At the beginning of each session, we asked the GenAI system what was in its memory to confirm it was empty.
Results and Discussion
Table 5 shows the results of our experiment. It follows the prompt structure shown in Table 4. Each chart was tested with six prompts. Prompt 1 addresses RQ1; Prompts 2 and 2f address RQ2; Prompts 3 and 3f address RQ3; and Prompt 4 addresses RQ4. The same set of 18 prompts was used for each GenAI system. Overall, the three systems showed similar patterns. The main differences appeared in ChatGPT’s responses to Chart 2, Prompts 3 and 3f, and Chart 3, Prompt 2f. We discuss these results in more detail below.
| Copilot | ChatGPT | Claude | ||||||||||||||||
| RQ1 | RQ2 | RQ3 | RQ4 | RQ1 | RQ2 | RQ3 | RQ4 | RQ1 | RQ2 | RQ3 | RQ4 | |||||||
| CHART# | P1 | P2 | P2f | P3 | P3f | P4 | P1 | P2 | P2f | P3 | P3f | P4 | P1 | P2 | P2f | P3 | P3f | P4 |
| 1 | Y | N | N | N | N | N | Y | N | N | N | N | N | Y | N | N | N | N | N |
| 2 | Y | Y | Y | Y | Y | Y | Y | Y | Y | N | N | Y | Y | Y | Y | Y | Y | Y |
| 3 | Y | N | N | N | N | Y | Y | N | Y | N | N | Y | Y | N | N | N | N | Y |
RQ1. All three GenAI systems demonstrated their understanding of basic chart design principles and the ability to spot flaws that could mislead analysis. For example, with regard to chart#1, ChatGPT states that “The 3D perspective creates visual distortion. Segments closer to the viewer appear much larger than they actually are, while those farther back appear smaller.[3]” The responses provided by the three GenAI systems were notably consistent, indicating comparable expertise in chart design principles.
RQ2. We observed inconsistent behavior when the systems answered the open-ended questions. All three systems identified a design flaw in the second chart (2A) but largely overlooked the issues in the remaining two charts — even though they knew of those flaws (as shown by the responses to P1). For example, for chart#1, we asked: “Did you notice that this is a 3D chart, which can distort how the data are perceived?” Where applicable, we also explicitly asked whether they used their knowledge regarding misleading chart design in their reasoning. For charts 1 and 3, the systems confirmed that they had the knowledge but wouldn’t use it unless encouraged to do so. Although this kind of introspective explanation is useful for exploratory research, it may itself lead to hallucinations and therefore may not accurately reflect the reasoning process the GenAI system actually used to answer the question. Concerning chart#1, ChatGPT stated: “I didn’t explicitly take the 3D distortion into account in my initial analysis. I made observations based on the apparent size of the slices without considering how the 3D effect might skew those observations.” Concerning the same chart, Claude stated: “This is a good lesson in critical thinking – when analyzing data visualizations, the first step should always be evaluating whether the chart design allows for accurate interpretation.” An exception to this behavior occurred when ChatGPT proactively identified the inverted Y-axis for chart#3. However, although it identified the issue, its analysis was still incorrect: “Funding shows a general increase from 2014 to 2024”.
These observations suggest that GenAI systems do not consistently apply relevant knowledge proactively when answering open-ended questions. In some cases, the systems appeared able to recognize a design flaw when asked directly but did not use that knowledge on their own during the initial analysis.
The responses associated with RQ2 also revealed two additional behaviors. First, the GenAI systems produced hallucinated responses when analyzing flawed charts. For chart#1, all three systems discussed strategic implications, starting from their incorrect analysis. For example, Claude mentions a “significant revenue concentration risk with Jeff generating such a large portion,” while Elon’s portion is slightly larger (1B). Also, after being asked whether it considered the 3D distortion in its reasoning, Claude stated: “I presented detailed insights as if they were reliable when they were based on a fundamentally flawed visualization.” Second, the systems sometimes relied on external knowledge (beyond what was shown in the chart) to accurately answer the prompts. For example, when analyzing chart#2, Copilot proactively employed additional knowledge in its reasoning. More specifically, it mentioned information about a country’s population size: “Peru, with a population of around 34 million, had a disproportionately high death rate when adjusted per capita.” When asked about its reasoning, Copilot further shared that “When I analyzed the chart, I considered not just the raw numbers but also the implications of comparing countries with vastly different population sizes.” This reasoning applied only to the chart displaying real-life data. The systems can’t possess any additional knowledge regarding the fictitious examples.
RQ3. Overall, the system’s reasoning behavior did not change much when we asked closed-ended questions. However, two behaviors are worth mentioning. First, Copilot again proactively applied additional knowledge when analyzing chart #2. It identified the issue and then presented an analysis based on “the most recent global data”, ignoring the data provided in the chart. Second, while ChatGPT correctly identified the design issue for chart#3 when asked an open-ended question (RQ2), it no longer did when asked a closed-ended question (RQ3). These behaviors demonstrate inconsistencies in proactive reasoning across and within systems.
RQ4. The responses for P4 were consistent across systems, but the answers provided for chart#1 require additional attention. Humans can’t derive accurate percentages from pie charts22. The same is true for GenAI systems. None of the systems should be able to determine the correct percentages or even rank the employees in the correct order since it was not provided. However, the incorrect results—the answers that GenAI made up on their own—were presented convincingly, another instance of hallucination and thus unreliable insights.
Conclusions and Further Research Directions
This paper investigates the proactive reasoning ability of GenAI systems. Using an experiment with misleading charts, we observed several reasoning behaviors. First, GenAI systems can identify and explain design flaws in charts. Second, the systems demonstrate proactive reasoning but do so inconsistently. Sometimes they use relevant knowledge about misleading chart designs, and sometimes they do not. Third, the way questions are framed—whether open-ended or closed-ended—had only a small effect on the results. Fourth, in some cases, the systems seemed to ignore the design flaws and still gave accurate insights by relying on outside information. Fifth, the GenAI systems were prone to hallucinations when analyzing misleading charts, sometimes presenting incorrect information convincingly.
Overall, this paper suggests that GenAI systems can help users spot possible flaws in charts before they are used to support decisions. This may be especially helpful for less experienced analysts, who may not notice these problems on their own. At the same time, the experiment showed that the systems are not always reliable or consistent, so their responses should be checked carefully. In practice, these systems should support human judgment, not replace it.
Although the study points to several interesting behavioral patterns, the findings should be interpreted with caution given the study’s limitations. These limitations also help shape the future research agenda.
First, our findings are based on three types of misleading charts: a 3D pie chart, denominator distortion, and an inverted Y-axis. They were chosen to test whether GenAI systems would detect common visual problems and adjust their reasoning accordingly. Previous research has shown that there are dozens of possible chart flaws13. A broader set of charts would likely lead to richer and more reliable insights.
Second, we tested only three GenAI systems: ChatGPT, Claude, and Copilot. These are widely used, but they do not represent the wider range of systems available. Future research should include additional systems, such as Gemini and Grok, to determine whether the behaviors we observed are common across systems or specific to certain systems.
Third, we ran each set of prompts only once for each system. While this produced useful insights, a single run is not enough to support broader conclusions about the systems’ behaviors. Prior studies suggest that this would require many more runs23. Future research could examine each of the behaviors identified in this paper through larger-scale empirical studies.
Fourth, we intentionally used simple prompts to test whether the systems would apply relevant knowledge on their own, without strong guidance from the user. This choice fits our focus on proactive reasoning. However, it also leaves open an important question: would the results change if the prompts were more detailed or if techniques such as retrieval-augmented generation (RAG)24,25 were used to give the systems access to external knowledge sources? Future research should investigate this question further.
Fifth, another way to improve the analysis would be to examine the confidence levels reported by the GenAI systems in their responses. This would show not only whether an answer was correct or incorrect, but also how certain the system was when giving it. A confidence-based analysis could reveal important patterns, such as cases where a system gives an incorrect answer with high confidence or a correct answer with low confidence.
Sixth, other factors—such as the quality and format of the screenshots and interface behavior—may also have influenced the results of our experiment. Future studies could systematically vary these conditions to better understand how they affect the performance of GenAI systems in visual analysis.
[1] We thank an anonymous reviewer for this description.
[2] Although this kind of introspective explanation is useful for exploratory research, it may itself contain hallucinations and therefore not accurately reflect the reasoning process the GenAI system actually used to answer the question.
[3] For the purpose of this paper, we define a session as a conversation with a GenAI system centered on a single research question.
[4] Particularly referring to the “Elon” section.
References
- R. He, J. Cao, T. Tan. Generative artificial intelligence: a historical perspective. National Science Review. Vol. 12, nwaf050, 2025, https://doi.org/10.1093/nsr/nwaf050. [↩]
- J. Park, K. Oh, K. Han, Y. H. Lee. Patient-centered radiology reports with generative artificial intelligence: adding value to radiology reporting. Scientific Reports. Vol. 14, pg. 13218, 2024, https://doi.org/10.1038/s41598-024-49738-3. [↩]
- T. Schneider, S. Behera, G. Boccaletti, C. Deser, K. Emanuel, R. Ferrari, L. R. Leung, N. Lin, T. Müller, A. Navarra, O. Ndiaye, A. Stuart, J. Tribbia, T. Yamagata. Harnessing AI and computing to advance climate modelling and prediction. Nature Climate Change. Vol. 13, pg. 887–889, 2023, https://doi.org/10.1038/s41558-023-01769-3. [↩]
- K. Swanson, G. Liu, D. B. Catacutan, A. Arnold, J. Zou, J. M. Stokes. Generative AI for designing and validating easily synthesizable and structurally novel antibiotics. Nature Machine Intelligence. Vol. 6, pg. 338–353, 2024, https://doi.org/10.1038/s42256-024-00810-3 [↩]
- E. Kasneci, K. Sessler, S. Küchemann, M. Bannert, et al. ChatGPT for good? On opportunities and challenges of large language models for education. Learning and Individual Differences. Vol. 103, pg. 102274, 2023, https://doi.org/10.1016/j.lindif.2023.102274. [↩]
- A. Papasavva, S. Lundrigan, E. Lowther, S. Johnson, E. Mariconti, A. Markovska, N. Tuptuk. Applications of AI-based models for online fraud detection and analysis. Crime Science. Vol. 14, article number 7, 2025, https://doi.org/10.1186/s40163-025-00248-8. [↩]
- L. Huang, W. Yu, W. Ma, W. Zhong, Z. Feng, H. Wang, Q. Chen, W. Peng, X. Feng, B. Qin, T. Liu. A survey on hallucination in large language models: principles, taxonomy, challenges, and open questions. ACM Transactions on Information Systems. Vol. 43, pg. 1–45, 2025, https://doi.org/10.1145/3703155. [↩]
- A. Wang, Y. Lin, J. Liu, S. Wu, H. Liu, X. Xiao, J. Su. Beyond passive critical thinking: fostering proactive questioning to enhance human‑AI collaboration. arXiv:2507.23407, 2025, https://doi.org/10.48550/arXiv.2507.23407. [↩]
- E.R.Tufte, P. R. Graves-Morris. The visual display of quantitative information. Vol. 2, no. 9. Cheshire, CT: Graphics Press, 1983. [↩] [↩]
- W.S. Cleveland, R. McGill. Graphical perception: Theory, experimentation, and application to the development of graphical methods. Journal of the American Statistical Association. Vol. 79, pg. 531-554, 1984, https://doi.org/10.1080/01621459.1984.10478080. [↩] [↩]
- S. Few. Show me the numbers. Analytics Pres 2, 2004. [↩]
- A.V. Pandey, K. Rall, M. L. Satterthwaite, O. Nov, Enrico Bertini. How deceptive are deceptive visualizations? An empirical analysis of common distortion techniques. In Proceedings of the 33rd Annual ACM Conference on Human Factors in Computing Systems. pg. 1469-1478. 2015, https://doi.org/10.1145/2702123.2702608. [↩]
- L.Y.-H. Lo, A. Gupta, K. Shigyo, A. Wu, E. Bertini, and H. Qu. Misinformed by visualization: What do we learn from misinformative visualizations?. Computer Graphics Forum. Vol. 41, pg. 515-525, 2022, https://doi.org/10.1111/cgf.14559. [↩] [↩] [↩]
- S. Feuerriegel, J. Hartmann, C. Janiesch, P. Zschech. Generative AI. Business & Information Systems Engineering. Vol. 66, pg. 111-126, 2024,
https://doi.org/10.1007/s12599-023-00834-7. [↩] - F. Liu, X. Wang, W. Yao, J. Chen, K. Song, S. Cho, Y. Yacoob, D. Yu. MMC: Advancing multimodal chart understanding with large-scale instruction tuning. arXiv:2311.10774, 2024,
https://doi.org/10.48550/arXiv.2311.10774. [↩] - F. Liu, J. Eisenschlos, F. Piccinno, S. Krichene, C. Pang, K. Lee, M. Joshi, W. Chen, N. Collier, Y. Altun. DePlot: One-shot visual language reasoning by plot-to-table translation. Findings of the Association for Computational Linguistics: ACL 2023, pg. 10381-10399, 2023. https://doi.org/10.18653/v1/2023.findings-acl.660. [↩]
- J. Alexander, P. Nanda, K.C. Yang, A. Sarvghad. Can gpt-4 models detect misleading visualizations? 2024 IEEE Visualization and Visual Analytics (VIS), pg. 106-110, 2024, https://doi.org/10.1109/VIS55277.2024.00029. [↩]
- L.Y.-H. Lo, H. Qu. How good (or bad) are LLMs at detecting misleading visualizations? IEEE Transactions on Visualization and Computer Graphics. Vol. 31, pg. 1116-1125, 2024, https://doi.org/10.1109/TVCG.2024.3456333. [↩]
- G. Jones. How to lie with charts. iUniverse, 2000. [↩]
- A. Cairo. How charts lie: getting smarter about visual information. W. W. Norton & Company, 2019. [↩] [↩]
- J. Rho, M. A. Rau, S. K. Bharti, R. Luu, J. McMahan, A. Wang, J. Zhu. Various misleading visual features in misleading graphs: do they truly deceive us? Proceedings of the Annual Meeting of the Cognitive Science Society. Vol. 46, 2024. [↩]
- A. Hill. Are pie charts evil? An assessment of the value of pie and donut charts compared to bar charts. Information Visualization. Vol. 24, pg. 3–23, 2025, https://doi.org/10.1177/14738716241259432 [↩]
- E. Akata, L. Schulz, J. Coda-Forno, S.J. Oh, M. Bethge, E. Schulz. Playing repeated games with large language models. Nature Human Behaviour. Vol. 9, pg. 1380-1390, 2025, https://doi.org/10.1038/s41562-025-02172-y. [↩]
- K.W. Church, J. Sun, R.Yue, P. Vickers, W. Saba, R. Chandrasekar. Emerging trends: a gentle introduction to RAG. Natural Language Engineering. Vol. 30, pg. 870-881, 2024, https://doi.org/10.1017/S1351324924000044. [↩]
- N.S. Amarnath, R. Nagarajan. An intelligent retrieval augmented generation chatbot for contextually-aware conversations to guide high school students. 4th International Conference on Sustainable Expert Systems (ICSES). pg. 1393-1398, 2024, https://doi.org/10.1109/ICSES63445.2024.10762977. [↩]