
Abstract
Heart failure (HF) is a leading cause of death, yet standard risk models rely almost entirely on structured clinical variables, omitting the ECG, imaging, notes, ambulatory vitals, and longitudinal records clinicians use. This study asks whether integrating these modalities improves HF mortality prediction beyond structured variables alone. Because the 299-patient UCI Heart Failure Clinical Records cohort contains only structured variables, each UCI patient is matched to a demographically similar donor record (by age, sex, or ejection fraction) from PTB-XL, MIMIC-IV (Note/Hosp/Online Medical Record [OMR]), MIMIC-CXR, and EchoNet-Dynamic. Crucially, no non-structured modality is a patient’s own record, so the design tests whether similar real donor data helps prediction — a surrogate-modality augmentation — not whether a patient’s own multimodal data helps. Modality-specific encoders produce embeddings combined with structured features via classical models, graph neural networks, and early/late/cross-modal fusion, alongside Kaplan–Meier and Cox survival analyses. The central finding is methodological: after multiplicity correction (Holm, Benjamini–Hochberg), no donor-matched modality significantly improved on structured features, and the nominal best addition — echocardiography — traces to ejection-fraction leakage, since echo donors are EF-matched and the encoder predicts EF. No fusion strategy surpassed the structured Random Forest. On the independent 2,008-patient Zigong cohort, retrained Logistic Regression was strongest (AUROC 0.810); a frozen UCI model transferred with only modest discrimination (AUROC 0.66) and failed calibration under a tenfold lower event rate. Careful modality selection, not count, drives small-cohort performance.
Keywords: Heart failure, mortality prediction, multimodal machine learning, electronic health records, electrocardiogram, echocardiography, chest X-ray, clinical notes, graph neural network, Cox proportional hazards, surrogate-modality augmentation, donor matching.
Introduction
Heart failure affects roughly 64 million people worldwide, with five-year mortality approaching 50%. Traditional risk models draw on a small set of structured baseline variables, assume linear relationships, and assess a patient only once, even though routine care now generates ECGs, echocardiograms, imaging reports, ambulatory vitals, and free-text notes that seldom appear together in benchmark datasets. Because the UCI HF cohort records only structured variables, this paper aligns six real-cohort modality encoders to it: each UCI patient is matched to a demographically similar donor record (by age, sex, or ejection fraction [EF]) drawn from PTB-XL, MIMIC-IV, MIMIC-CXR, and EchoNet-Dynamic. This is a surrogate-modality (donor-matching) design — the non-structured signals are real but come from different, unrelated donors, so the study tests whether similar real data improves prediction, not whether a patient’s own imaging, ECG, or notes do. Each modality is ablated against the structured baseline, and three fusion strategies are compared under a leak-free protocol.
This work evaluates seven clinical modalities for HF mortality prediction at the encoder level, fuses them via a heterogeneous patient graph, and benchmarks three fusion architectures. Beyond classical and structured-only GNN baselines, the contribution is threefold: first, each modality evaluated in isolation, second, a systematic structured-plus-one ablation, and third, head-to-head early fusion, late fusion (softmax-weighted LR ensemble), and cross-modal attention on the same split. Throughout, “multimodal” refers to donor-matched surrogate modalities rather than natively paired per-patient records (see Limitations). Because the non-structured streams are donor-matched surrogates, the study’s principal contribution is ultimately methodological: using permutation nulls, embedding residualization, multiple-comparison correction, and a frozen-model transportability test, it shows how surrogate-modality augmentation and leakage through a matched encoder (here, ejection fraction) can manufacture apparent multimodal gains that do not survive scrutiny — a caution for small-cohort multimodal prediction.
Research Objectives
This study pursues several aims. It establishes rigorous classical baselines on the UCI cohort, following Chicco and Jurman1, and evaluates structured-only Graph Convolutional Network (GCN) and Graph Attention Network (GAT) baselines over a k-nearest-neighbor patient graph. It trains six real-cohort modality encoders — Bio_ClinicalBERT on MIMIC-IV-Note and MIMIC-CXR, a one-dimensional convolutional neural network (1D-CNN) on PTB-XL, an R(2+1)D-18 video model on EchoNet-Dynamic, a Transformer on MIMIC-IV Hosp events, and a 1D-CNN with a gated recurrent unit (GRU) on the MIMIC-IV Online Medical Record (OMR) vitals — and projects each embedding onto UCI patients by age/sex/EF nearest-neighbor donor assignment. Every structured-plus-one-modality configuration is then ablated, and early, late (softmax-weighted), and cross-attention fusion are compared. Finally, the structured pipeline is replicated on the independent 2,008-patient Zigong cohort, and a companion Cox proportional-hazards survival analysis is reported on the same UCI covariates.
Background
Heart Failure: Clinical Context
HF carries roughly 50% five-year mortality, so accurate risk prediction matters. Clinicians rely on ejection fraction, a measure of pump efficiency, biomarkers such as B-type natriuretic peptide (BNP) and its N-terminal prohormone (NT-proBNP) that signal cardiac stress, and the New York Heart Association (NYHA) functional class. Prognosis is multimodal: imaging (echocardiography, chest X-ray), ECG, laboratory values, demographics, and history each carry complementary information, which motivates models that combine these sources jointly. Two variables central to this assessment, NYHA functional class and BNP/NT-proBNP, are not recorded in the UCI cohort and therefore enter none of the models reported here. Their absence limits direct clinical comparability and is revisited in the Limitations.
Machine Learning in Cardiovascular Medicine
Machine learning already has a track record in cardiovascular medicine. On the UCI cohort used here, Chicco and Jurman1 got about 74% accuracy from a Random Forest on structured features alone, with serum creatinine and EF carrying most of the signal. On individual modalities, models now match specialists. Convolutional networks pick out arrhythmias from ambulatory ECGs as well as cardiologists2 and read the full 12-lead ECG on their own3. An AI-enabled ECG can even flag a low ejection fraction4, and video models measure EF beat by beat from echocardiograms5. Work on longitudinal records came earlier: Doctor AI6 and the large-scale EHR models of Rajkomar et al.7 showed that patient representations can be learned straight from the data. Clinical language models like BERT8 and Bio_ClinicalBERT9 power the note and report encoders in this study.
Putting these streams together is more recent. Several primary studies have built and directly compared multimodal fusion models for clinical prediction: architecture search over structured electronic-health-record streams10, fusion of clinical time series with chest radiographs11, joint modeling of CT imaging and structured records12, an integrated framework spanning imaging, notes, and tabular data13, and multimodal deep learning for dementia assessment14. Heart failure has its own machine-learning risk models, both for preserved ejection fraction15 and for prognosis more generally16,17. Graph neural networks are a good match for patient-similarity data; the GCN18 and GAT19 are standard tools for node classification. On plain tabular data, gradient-boosted trees remain strong baselines. What has not been done is a straight comparison of fusion strategies for heart-failure mortality on a single cohort. That is the gap this study aims at, while being upfront about its surrogate-modality design (see Limitations). UCI is the discovery set, and the 2,008-patient Zigong cohort20 serves as an independent, hospital-scale replication of the structured-only pipeline.
Recent primary studies sharpen each of these threads. In heart failure specifically, machine-learning models have been developed and validated for acute and in-hospital mortality21,22, for readmission or death23, and for long-term incident risk24. On the electrocardiogram, deep networks now infer structural and echocardiographic findings from the trace alone: low ejection fraction in a pragmatic randomized trial25 and in emergency-department dyspnea26, left-ventricular diastolic function27, and incident or worsening heart failure28,29. For fusion and graph methods, recent work pairs EHR streams with transformers and graph neural networks to stratify heart-failure patients30 and fuses imaging with structured risk factors for cardiovascular31 and intensive-care32 outcomes. These studies motivate the present comparison, but nearly all use single-modality or paired real-patient data rather than the surrogate-donor design examined here.
Methods
Two independent HF cohorts are used. The discovery cohort is the 299-patient UCI Heart Failure Clinical Records Dataset33; every modality is aligned to it so all experiments share the same labels, 70/30 stratified split (n_test = 90, seed 42; see Train–Test Split), and primary metric. Independent replication uses the 2,008-patient Zigong cohort20 (166 columns/admission, 6-month all-cause mortality; see Independent Replication Cohort). Only the structured pipeline is retrained on Zigong, which does not release paired notes/ECG/imaging/vitals streams.
Core Structured Clinical Dataset
The UCI dataset has 13 columns: 11 baseline clinical variables, a follow-up time column, and DEATH_EVENT. Follow-up time introduces target leakage (shorter durations correlate with mortality), so it is excluded, leaving the 11 baseline covariates (age, anemia, creatinine phosphokinase (CPK), diabetes, EF, hypertension, platelets, serum creatinine, serum sodium, sex, smoking). Continuous variables are z-scored on the training partition.
Clinical Text — MIMIC-IV-Note Discharge Summaries
Each UCI patient was assigned a real MIMIC-IV-Note discharge summary34 by weighted-Euclidean matching on age and sex, drawn from a pool of 23,518 heart-failure admission notes (ICD-10-identified). Text was encoded with Bio_ClinicalBERT9, a clinical variant of BERT8, mean-pooling the first 512 tokens of each note into a frozen 768-dimensional embedding.
Electrocardiogram (ECG) Signals — PTB-XL
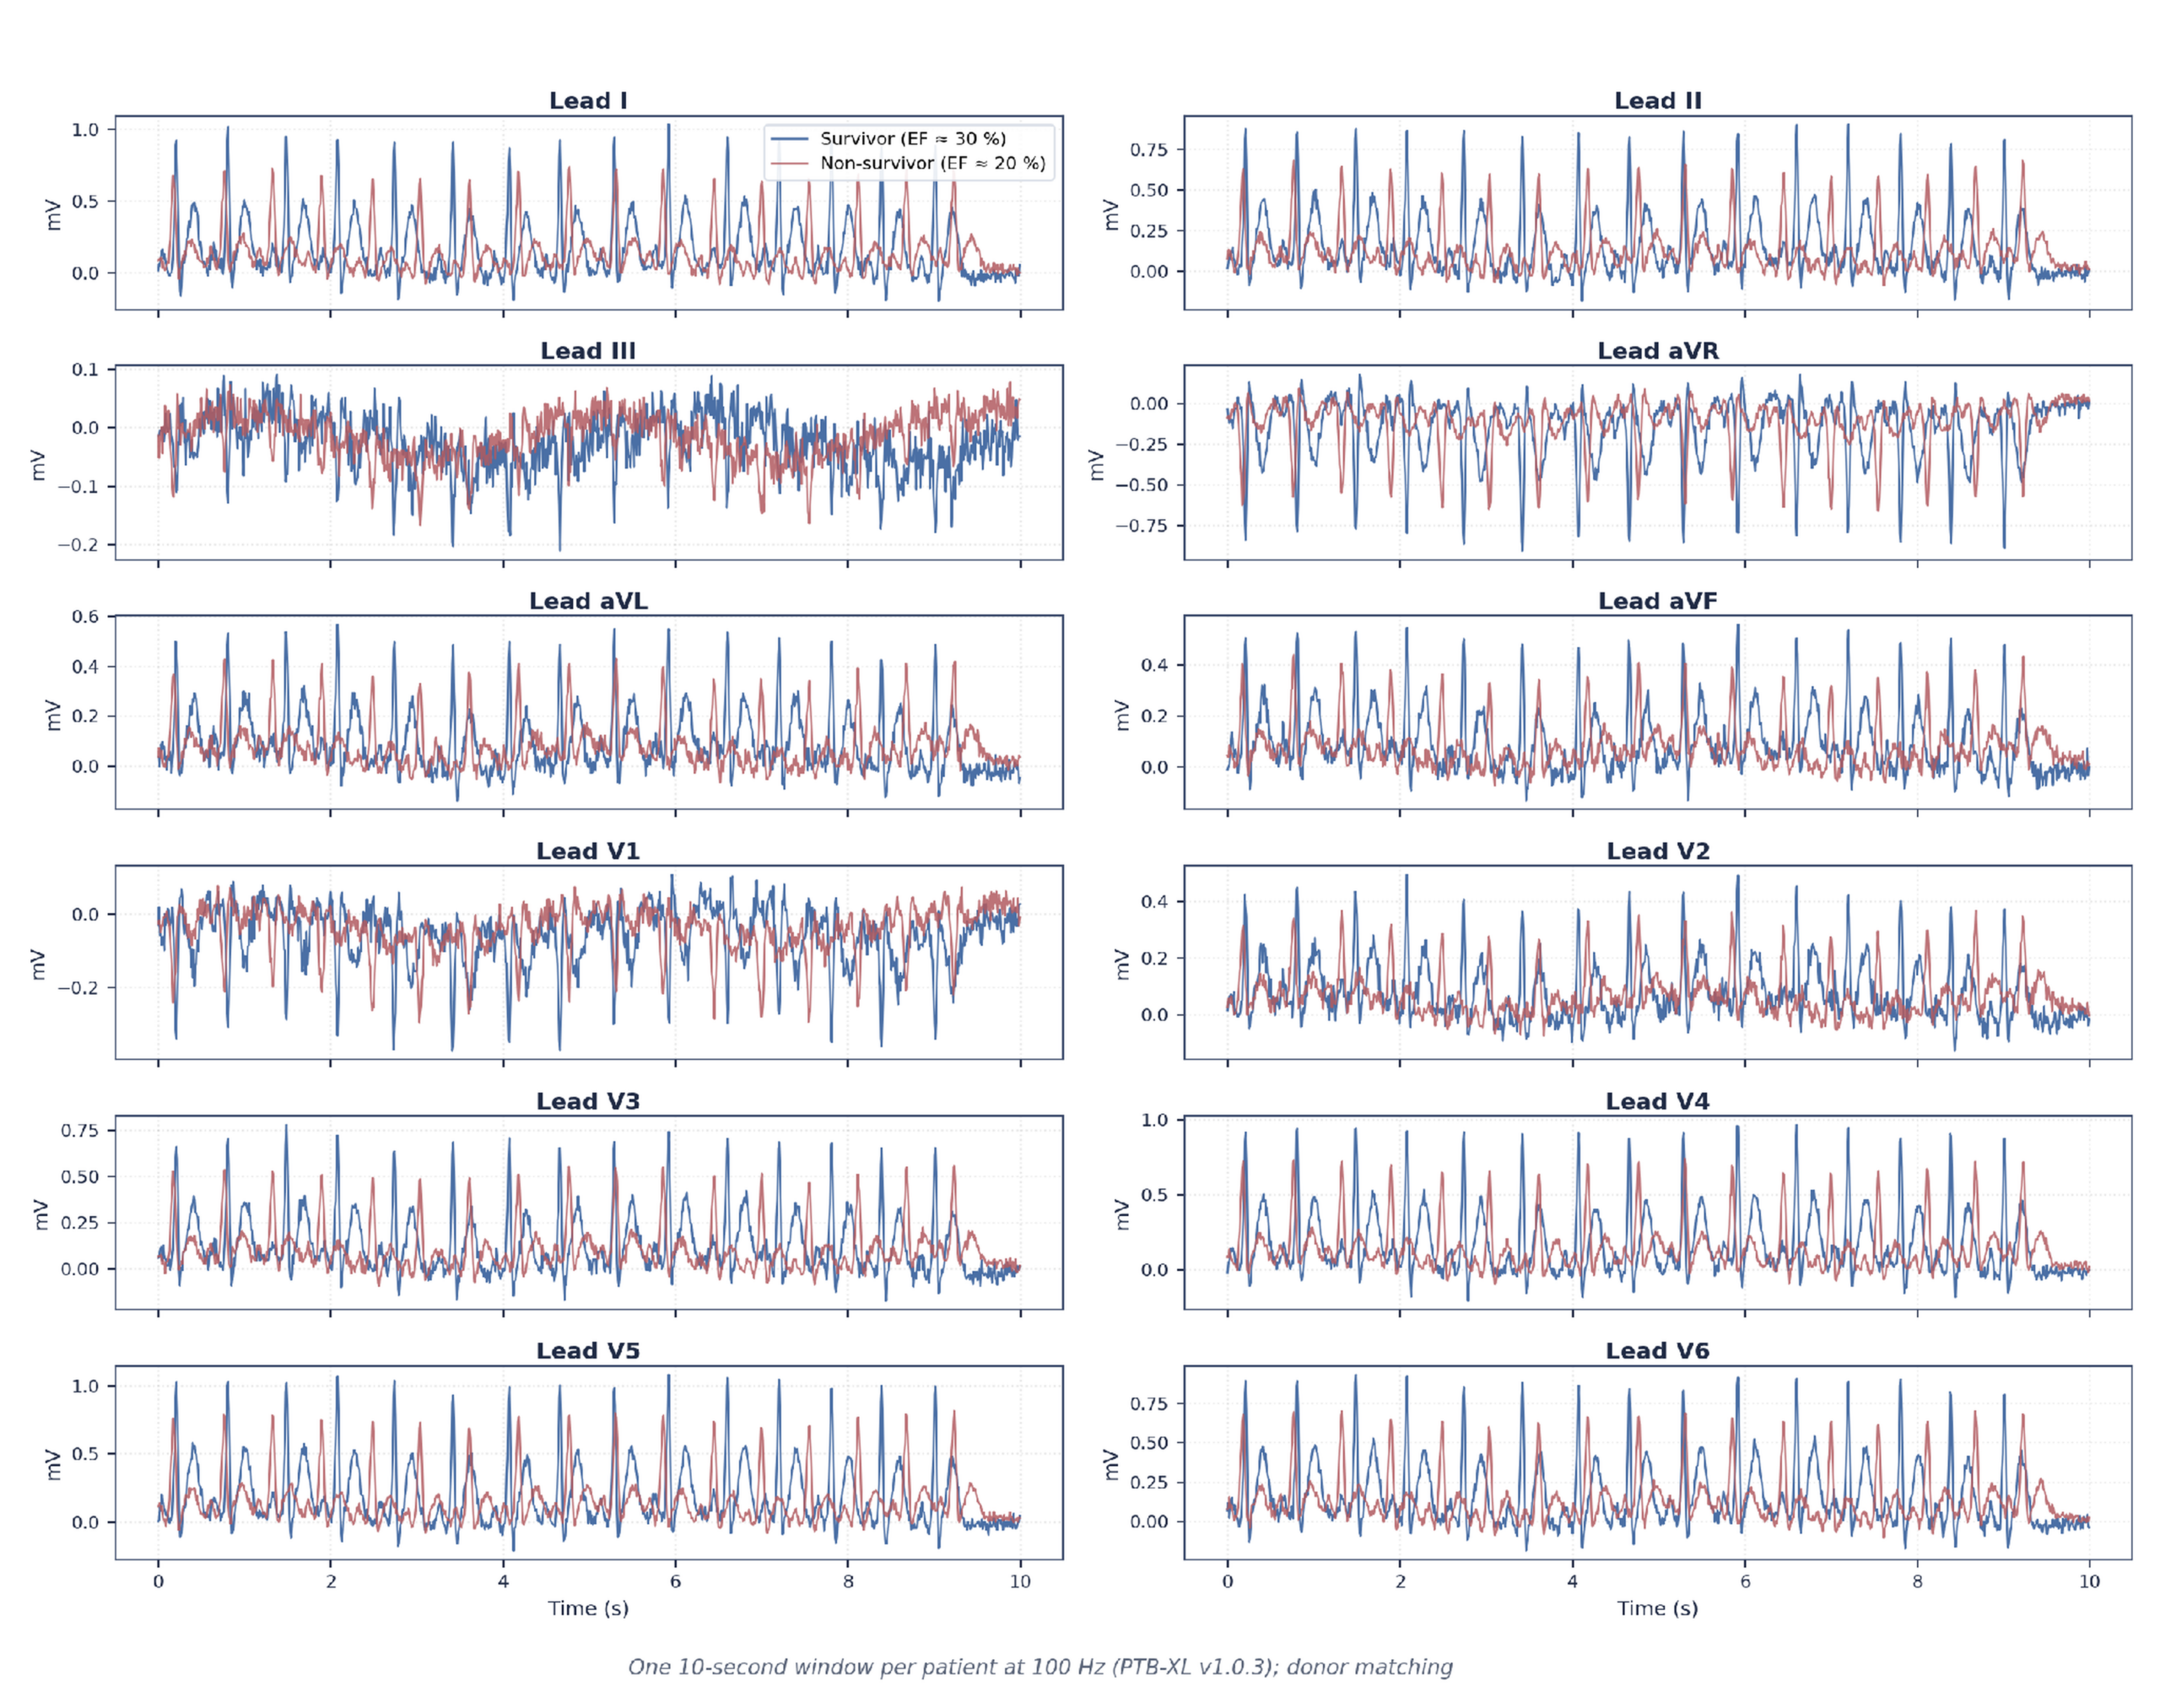
Each UCI patient was matched by age and sex to a 10-second, 12-lead PTB-XL ECG35 from a demographically similar donor. An encoder pre-trained on PTB-XL distinguishes normal from abnormal rhythms. In addition to raw waveforms, 27 clinical measurements were extracted per ECG (heart-rate variability (HRV) SDNN/RMSSD, QRS/QTc durations, and voltage amplitudes). Because these traces belong to donors rather than to the UCI patients themselves, no waveform difference is attributed to a UCI patient’s mortality outcome; the ECGs enter the models only as donor-matched surrogate features.
Medical Imaging: Chest X-Ray – MIMIC-CXR Reports
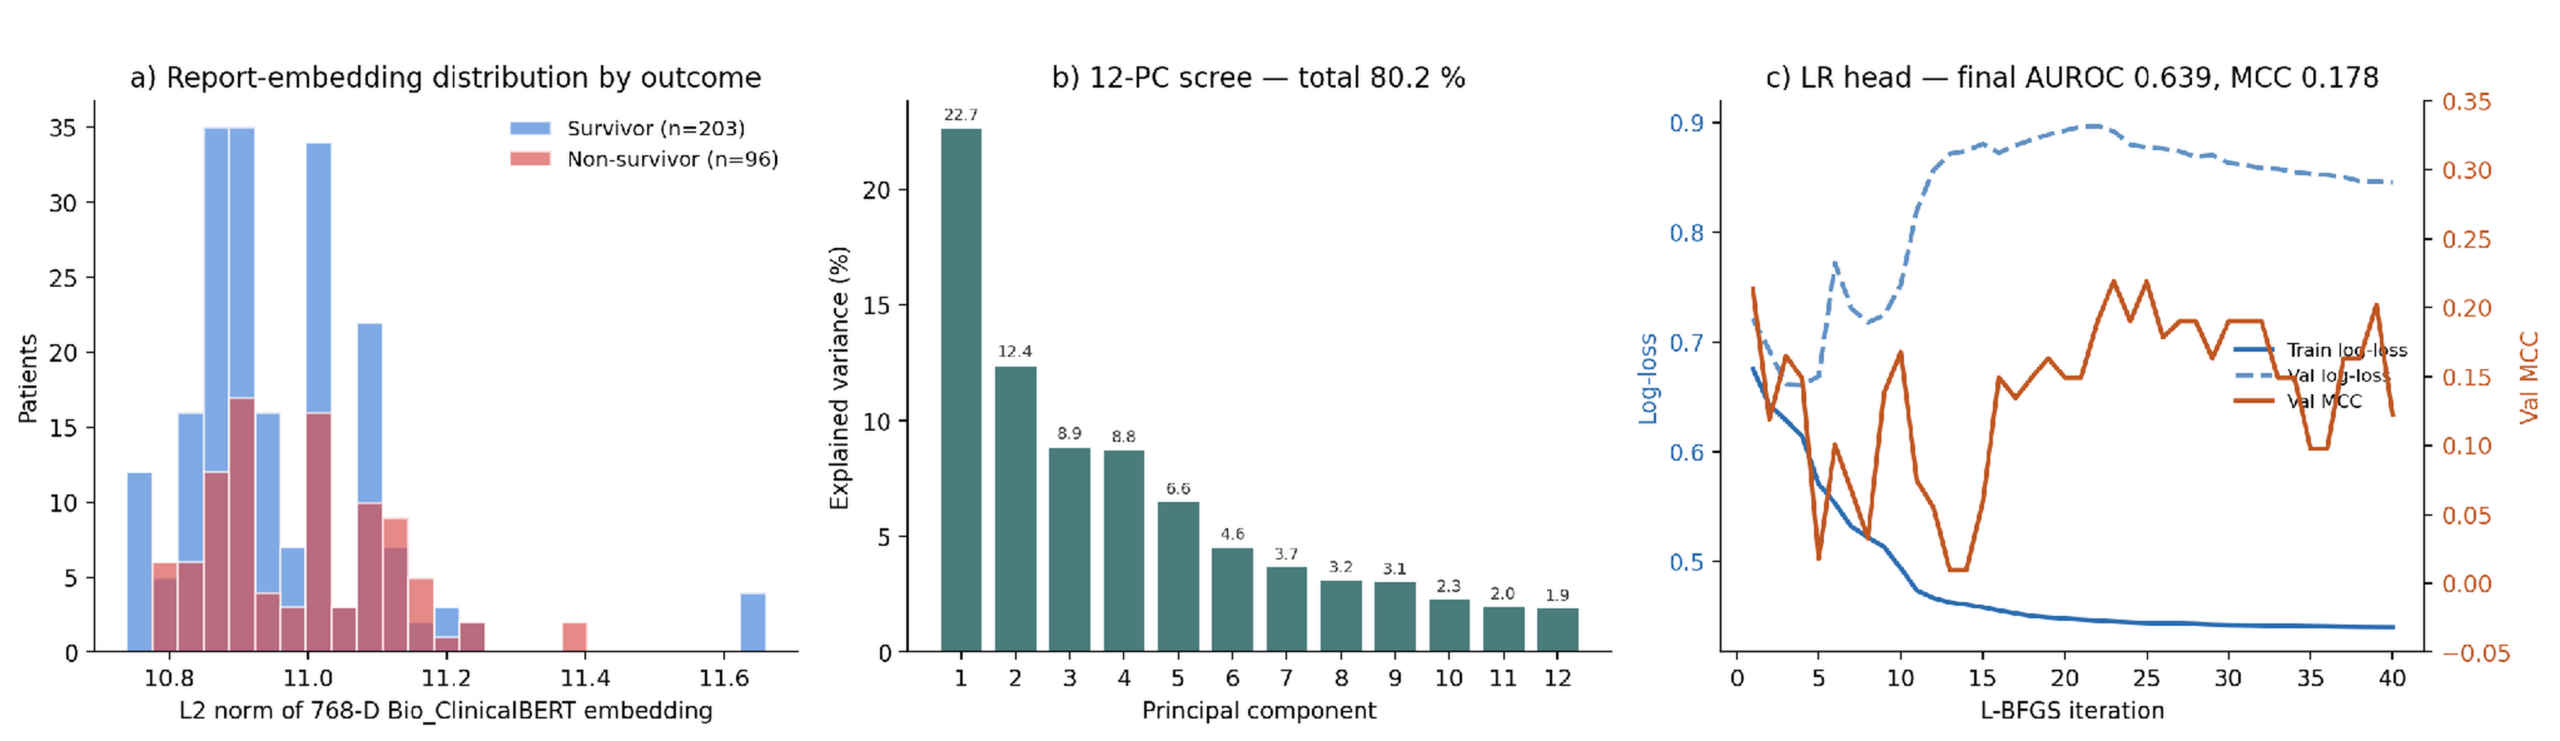
Radiology reports were gathered from MIMIC-CXR using HF-specific ICD-10 codes, yielding 5,000 reports matched to study patients. As with the discharge notes, the first 512 tokens of each report were encoded with frozen Bio_ClinicalBERT (no fine-tuning) into a 768-dimensional vector.
Medical Imaging: Ultrasound Videos – EchoNet-Dynamic
Dynamic ultrasound data came from EchoNet-Dynamic, a Stanford database of over 10,000 four-chamber-view clips. Each video carries a measured EF — the fraction of blood ejected per beat, a guideline-standardized echocardiographic measure36,37. Every UCI patient was paired with the donor video of exact (or closest) matching EF.
Longitudinal Outpatient Vitals – MIMIC-IV OMR
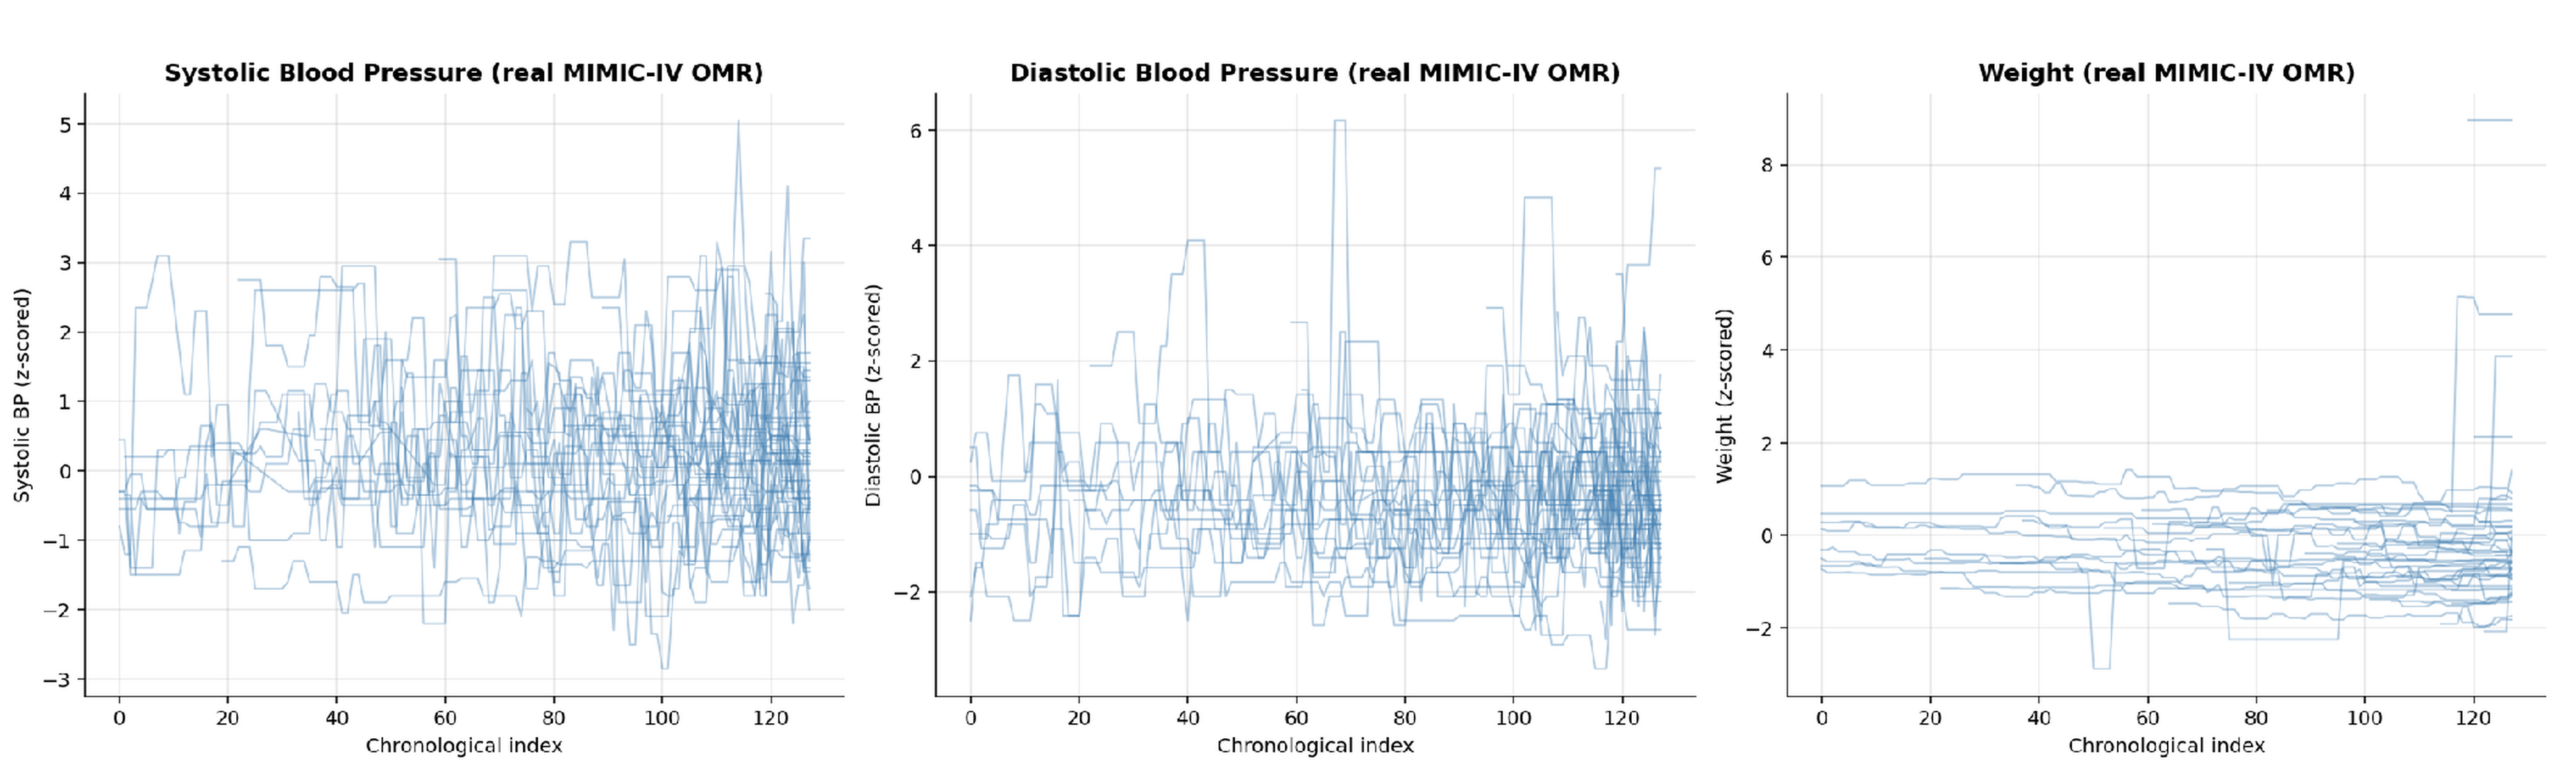
Longitudinal outpatient trends — blood pressure, weight, BMI, height — were taken from MIMIC-IV OMR, covering 16,254 HF patients with at least three visits each. Each history was standardized against normal ranges and formatted as a uniform sequence of up to 128 visits across 6 measurements. This periodic clinic data is not a continuous wearable tracker stream, but it is the closest public dataset for long-term outpatient cardiovascular health.
Longitudinal EHR History — MIMIC-IV Hosp
Long-term records for 43,142 HF admissions were drawn from MIMIC-IV Hosp. Each stay was converted into a timeline of medical events (diagnoses, prescriptions, abnormal labs), tokenized with a 4,013-term vocabulary and truncated at 512 events. Each UCI patient was then matched to a real admission record by age and sex.
Data Inventory Summary
| Modality | Source | Per-patient Shape | Encoder | Embedding Dim |
| Structured clinical | UCI Heart Failure Records | 11 features (follow-up-time excluded to prevent target leakage) | — | 11 |
| Clinical text | MIMIC-IV-Note (real, HF ICD-10 filtered)3834 | Discharge summary (up to 512 tokens) | Bio_ClinicalBERT (frozen)9 | 768 |
| ECG signals | PTB-XL v1.0.3 (real, n=21,799)35 | 12 × 1000 samples (10 s, 100 Hz) | 1D CNN (4 blocks), pretrained on PTB-XL (normal vs. abnormal, using SCP-ECG diagnostic labels) | 128 |
| Medical Imaging: Chest X-ray | MIMIC-CXR Reports v2.0 (real, HF ICD-10 filtered)39 | Radiology report (up to 512 tokens) | Bio_ClinicalBERT (frozen)9 | 768 |
| Medical Imaging: Ultrasound Videos | EchoNet-Dynamic (real, n=10,030)5 | AVI video, 112×112, 50 fps | R(2+1)D-18 (Kinetics pretrained) + EF head | 512 |
| Longitudinal Outpatient Vitals | MIMIC-IV OMR (real, HF ICD-10 filtered)38 | 128 × 6 channels (BP, weight, BMI, height, time) | 1D CNN + GRU (mortality-pretrained) | 128 |
| Longitudinal EHR History | MIMIC-IV Hosp (real, HF ICD-10 filtered)38 | Tokenized event sequence (≤ 512 tokens) | 2-layer Transformer encoder (mortality pretrained) | 128 |
Train-Test Split
The 299 patients were split 70/30 — 209 for training, 90 for final testing — with stratification preserving the mortality rate in both partitions.
Every model and fusion approach was evaluated on this same 90-patient test set, making all scores directly comparable; all tuning was confined to the training partition to prevent test-set leakage.
Independent Replication Cohort — Zigong Fourth People’s Hospital
A separate 2,008-patient cohort from Zigong Fourth People’s Hospital provided an independent replication of the structured model on real-world hospital data, predicting death within six months of discharge (rather than in-hospital). Because the models were retrained on Zigong and its feature space (166 columns per admission) and 6-month endpoint differ from UCI’s 11 predictors and variable-follow-up DEATH_EVENT, this analysis is a replication and independent model development on a second cohort, not a frozen-model transportability test of the UCI pipeline; results therefore speak to models trained on Zigong.
Data were split 70/15/15 (train/tune/test) after removing 14 post-discharge measurements that could leak the outcome. Because Zigong publishes only structured records — no paired X-rays, ECGs, or notes — only the structured model was evaluated on this cohort.
On Zigong, nine classical models were trained: the seven UCI baselines plus two gradient-boosted-tree libraries. XGBoost40 used the histogram tree method with subsample 0.9 and column subsample 0.9, an area under the precision-recall curve (AUPRC) evaluation metric, and scale_pos_weight set to the training class-imbalance ratio; its number of trees, maximum depth, and learning rate were tuned over {400, 600} trees, depth {4, 5}, and learning rate {0.05, 0.03}. LightGBM41 used balanced class weights, with trees tuned over {400, 600}, maximum depth {−1 (unlimited), 6}, and learning rate {0.05, 0.03}. Logistic Regression, SVM (RBF), Random Forest, and the tree ensembles used balanced class weights to address the 2.84% event rate. Every model was tuned by 5-fold cross-validation maximizing AUPRC on the training split, because 6-month mortality is rare (9 of 302 test positives), which makes area under the receiver operating characteristic curve (AUROC) and threshold-0.5 metrics unstable.
Modeling and Evaluation
Classical Baseline Models
Seven classical machine-learning algorithms were implemented on UCI following Chicco and Jurman1. Logistic Regression is a linear model with L2 regularization (C = 1.0). Naive Bayes is a Gaussian model assuming feature independence. The Support Vector Machine (SVM) uses a radial-basis-function (RBF) kernel (C = 1.0, γ = ‘scale’) for non-linear decision boundaries. K-Nearest Neighbors (KNN) predicts by majority vote over the k = 5 nearest patients (Euclidean distance). The Decision Tree is a Gini-split tree capped at maximum depth 5. Random Forest is a 200-tree bagging ensemble tuned for the Matthews Correlation Coefficient (MCC). Gradient Boosting uses 100 shallow trees (maximum depth 3, learning rate 0.1), each correcting its predecessor. Two additional gradient-boosted-tree libraries, XGBoost and LightGBM, were introduced only for the Zigong replication and are described in the Zigong modeling paragraph below.
Scale-sensitive models (Logistic Regression, SVM, KNN) were standardized with StandardScaler; tree-based models skipped scaling because their splits are threshold-based. Binary factors were passed as 0/1 integers. A fixed seed (random_state = 42) makes all runs reproducible.
Patient Similarity Graph
A patient-similarity network connects each patient to their 5 nearest neighbors on standardized clinical features, forming 2,116 edges. Each node carries its structured features concatenated with whichever extra embeddings (ECG, notes, imaging, etc.) are under test. The graph was frozen across all experiments so that any change in performance reflects the added modality, not a changed graph.
Graph Neural Network Baselines & Backbones Architectures
Two graph models — a Graph Convolutional Network (GCN) and a Graph Attention Network (GAT) — process the patient network via neighborhood message passing42 over the 11 structured features. For the Zigong replication a third backbone, GraphSAGE43, was added with a mean neighborhood aggregator; on UCI, GCN and GAT are the structured-only baselines. Because survivors outnumber non-survivors 2.11:1, training up-weighted the mortality class.
The same 2-layer GCN configuration (hidden size, dropout) was reused across all multimodal tests; only the input-layer width changed to accommodate each added modality.
ECG Encoder Architecture
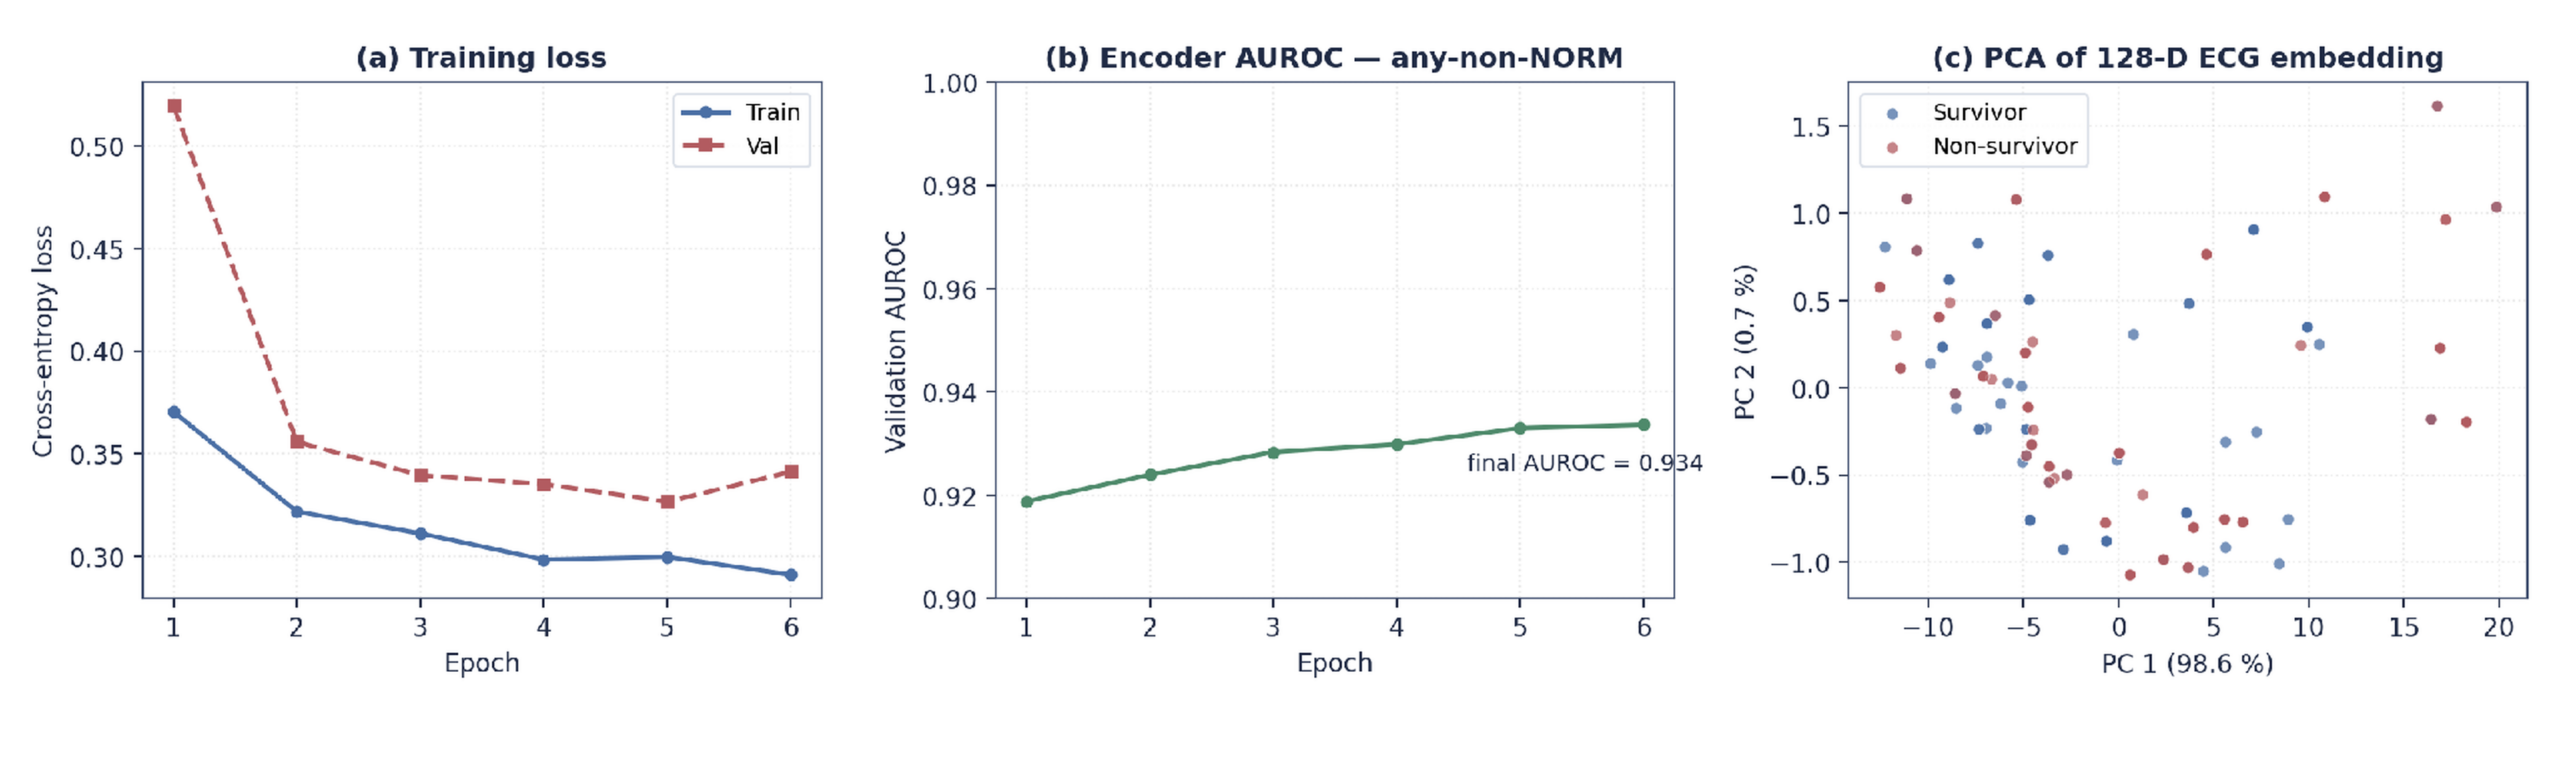
To process ECG waveforms, a 4-layer 1D-CNN was built for waveform classification; deep neural networks have reached cardiologist-level 12-lead diagnosis3. Successive layers apply progressively smaller filters, normalization, and pooling to capture both broad rhythms and subtle wave patterns, condensing each trace into a 128-dimensional embedding.
Pre-trained on PTB-XL to detect abnormal rhythms, the encoder reached 0.934 AUROC on held-out data. Because UCI lacks raw traces, each patient inherited a 128-D ECG embedding from an age/sex-matched PTB-XL donor.
Imaging & Radiology Encoders
An R(2+1)D-18 video model, trained on 16-frame echo clips to predict EF, reached a 7.32 % mean absolute error and yielded a 512-D embedding per patient. MIMIC-CXR reports were encoded with Bio_ClinicalBERT into 768-D vectors (averaged across a patient’s reports). Lacking native ultrasound and X-ray data, UCI patients inherited these embeddings from age/sex-matched donors.
Longitudinal Outpatient Vitals Encoder(1D CNN + GRU) — MIMIC-IV OMR
Outpatient histories were modeled with a 3-layer 1D CNN (short-term changes) feeding a 2-layer GRU (long-term trends), condensing each multi-year history into a 128-D profile. Trained on MIMIC-IV OMR to predict mortality, it reached roughly 0.60 validation AUROC. Lacking longitudinal outpatient records, each UCI patient inherited a 128-D profile from an age/sex-matched donor.
EHR Encoder (Transformer) — MIMIC-IV Hosp
A 2-layer Transformer44 read admission records encoded as a 4,013-code vocabulary, following sequence-model representations of longitudinal records such as Doctor AI6, pooling event embeddings into a 128-D per-stay profile. Trained on a 15,000-admission subset of the 43,142 MIMIC-IV Hosp HF admissions (see the Longitudinal EHR History section) to predict in-hospital mortality, it reached 0.962 AUROC. Lacking event sequences, each UCI patient inherited a 128-D profile from an age/sex-matched donor.
Multimodal Fusion Strategies
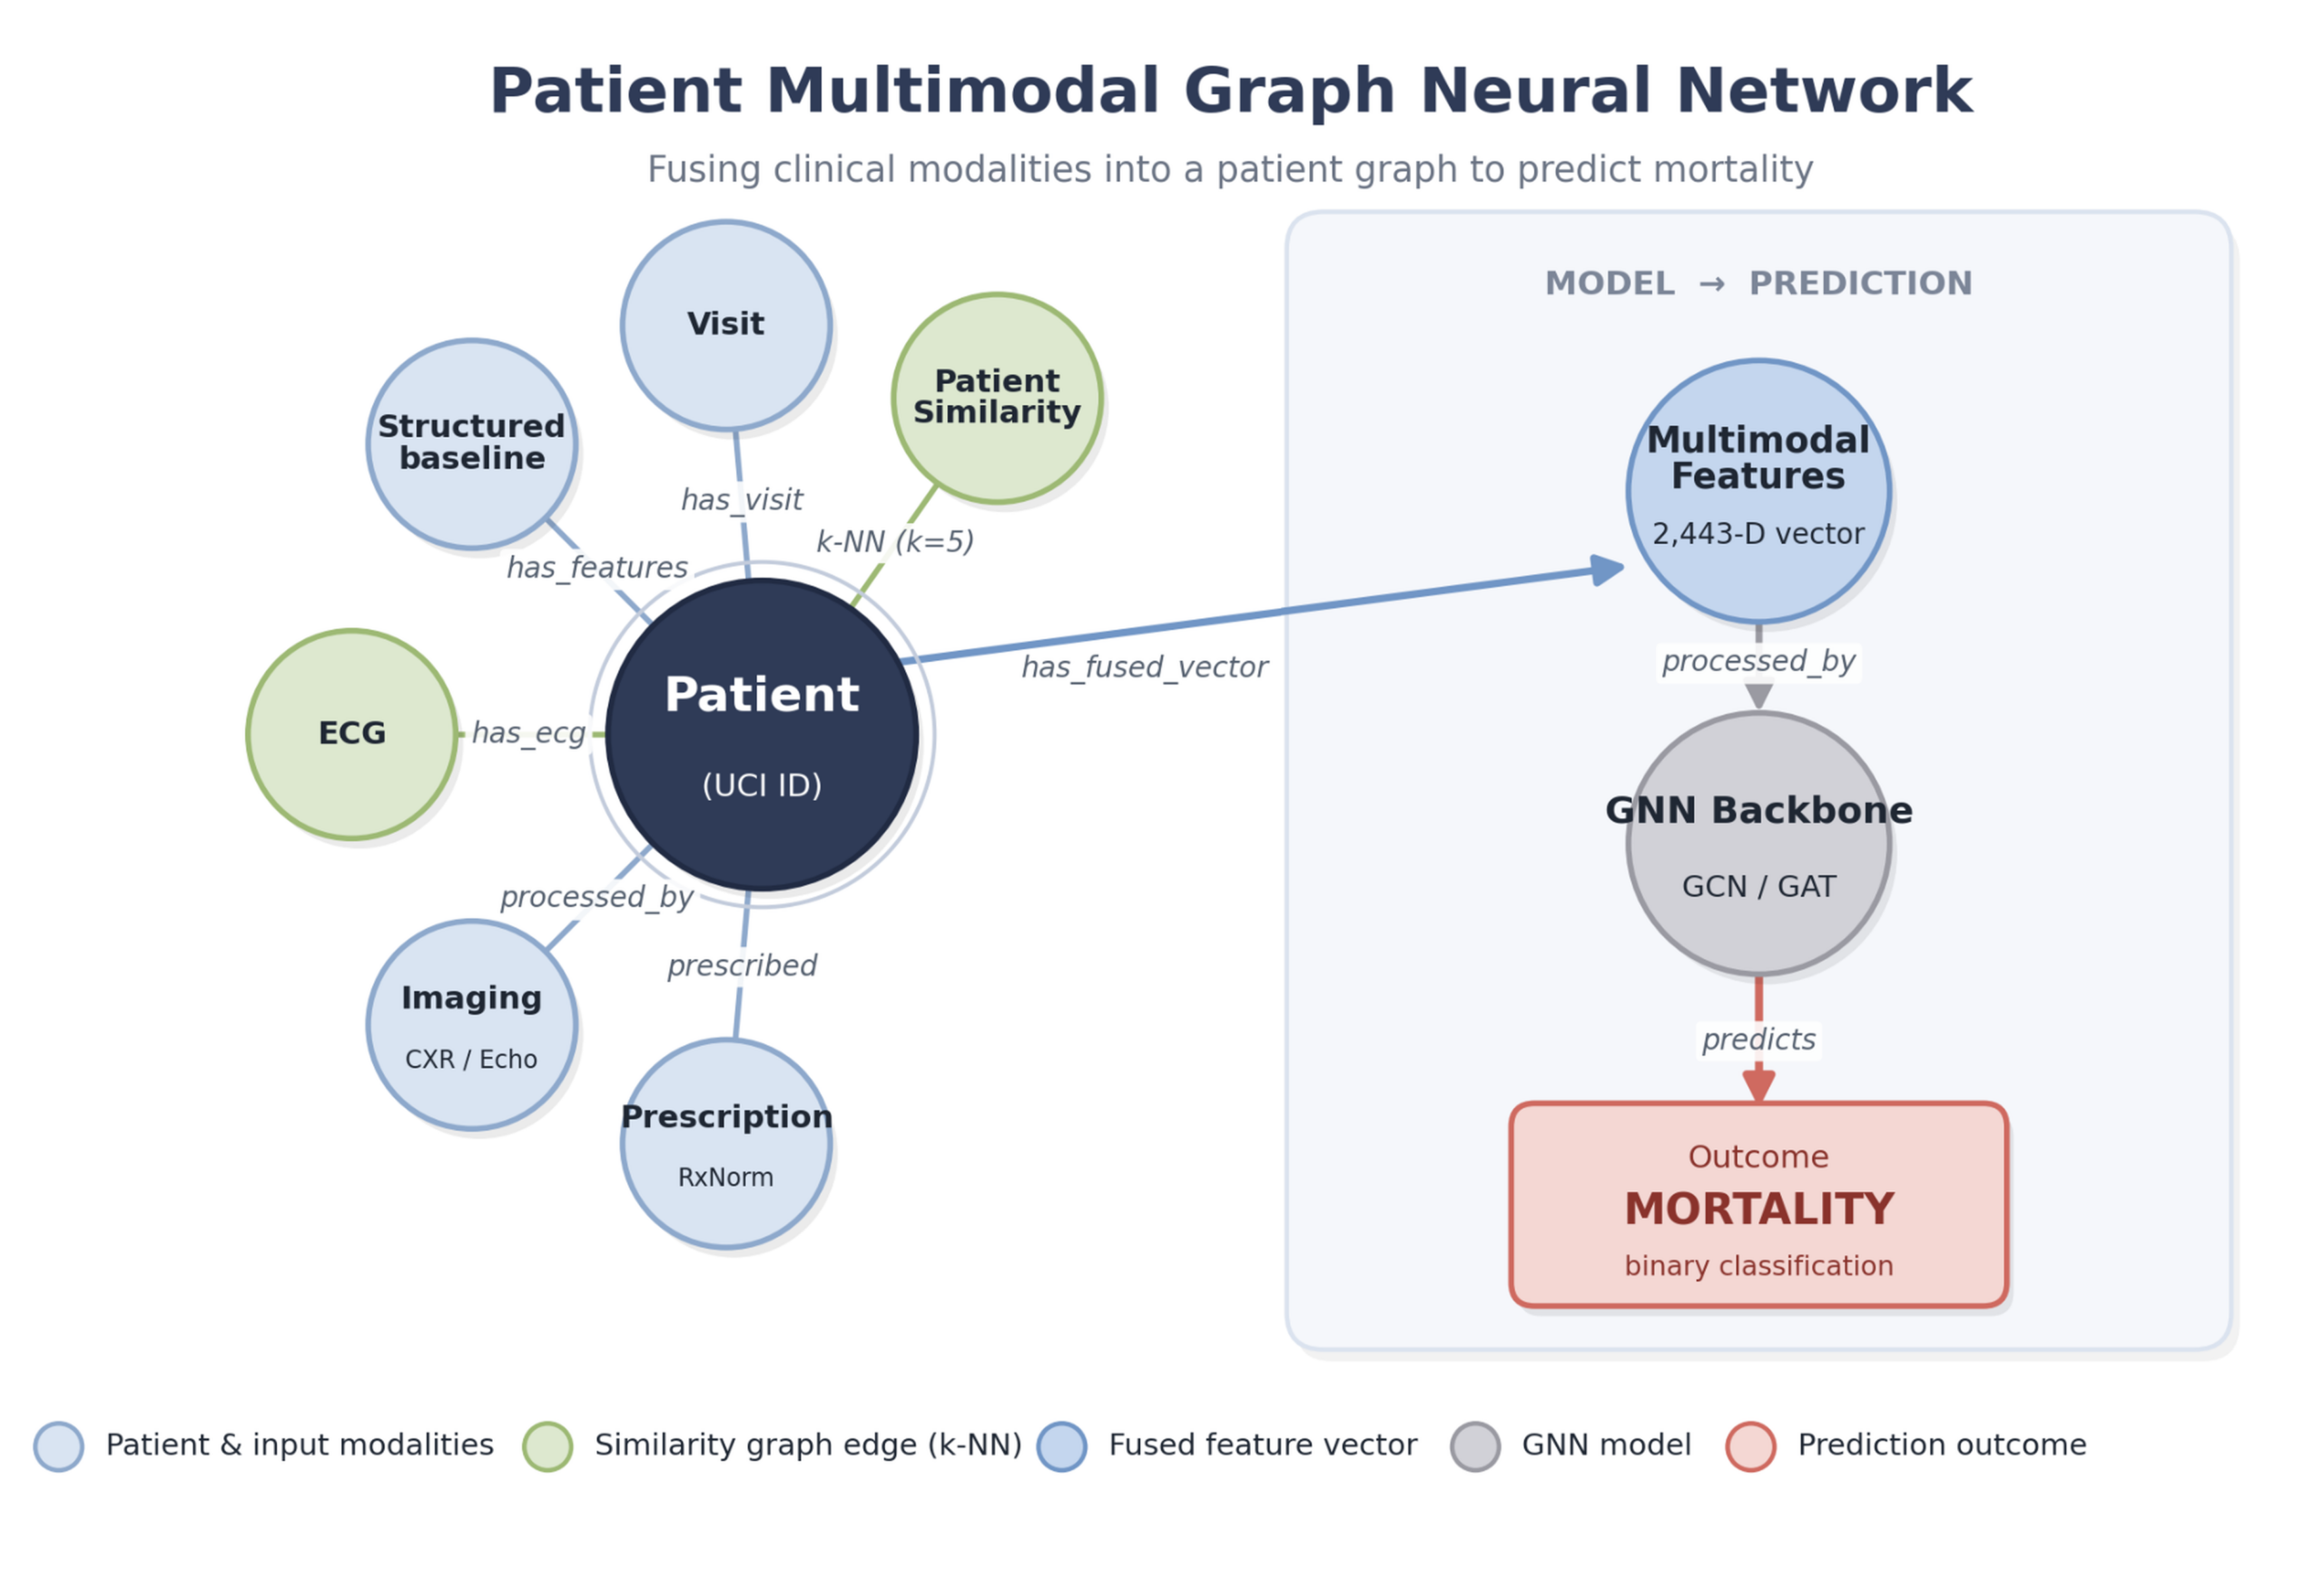
All three strategies combine seven data sources—11 standard clinical features plus six AI profiles (notes, ECG, ultrasound, hospital records, outpatient trends, and X-ray reports)—totaling a 2,443-dimensional vector per patient. They were evaluated on 299 patients split into 209 for training and 90 for testing (the overall pipeline is summarized in Figure 1).
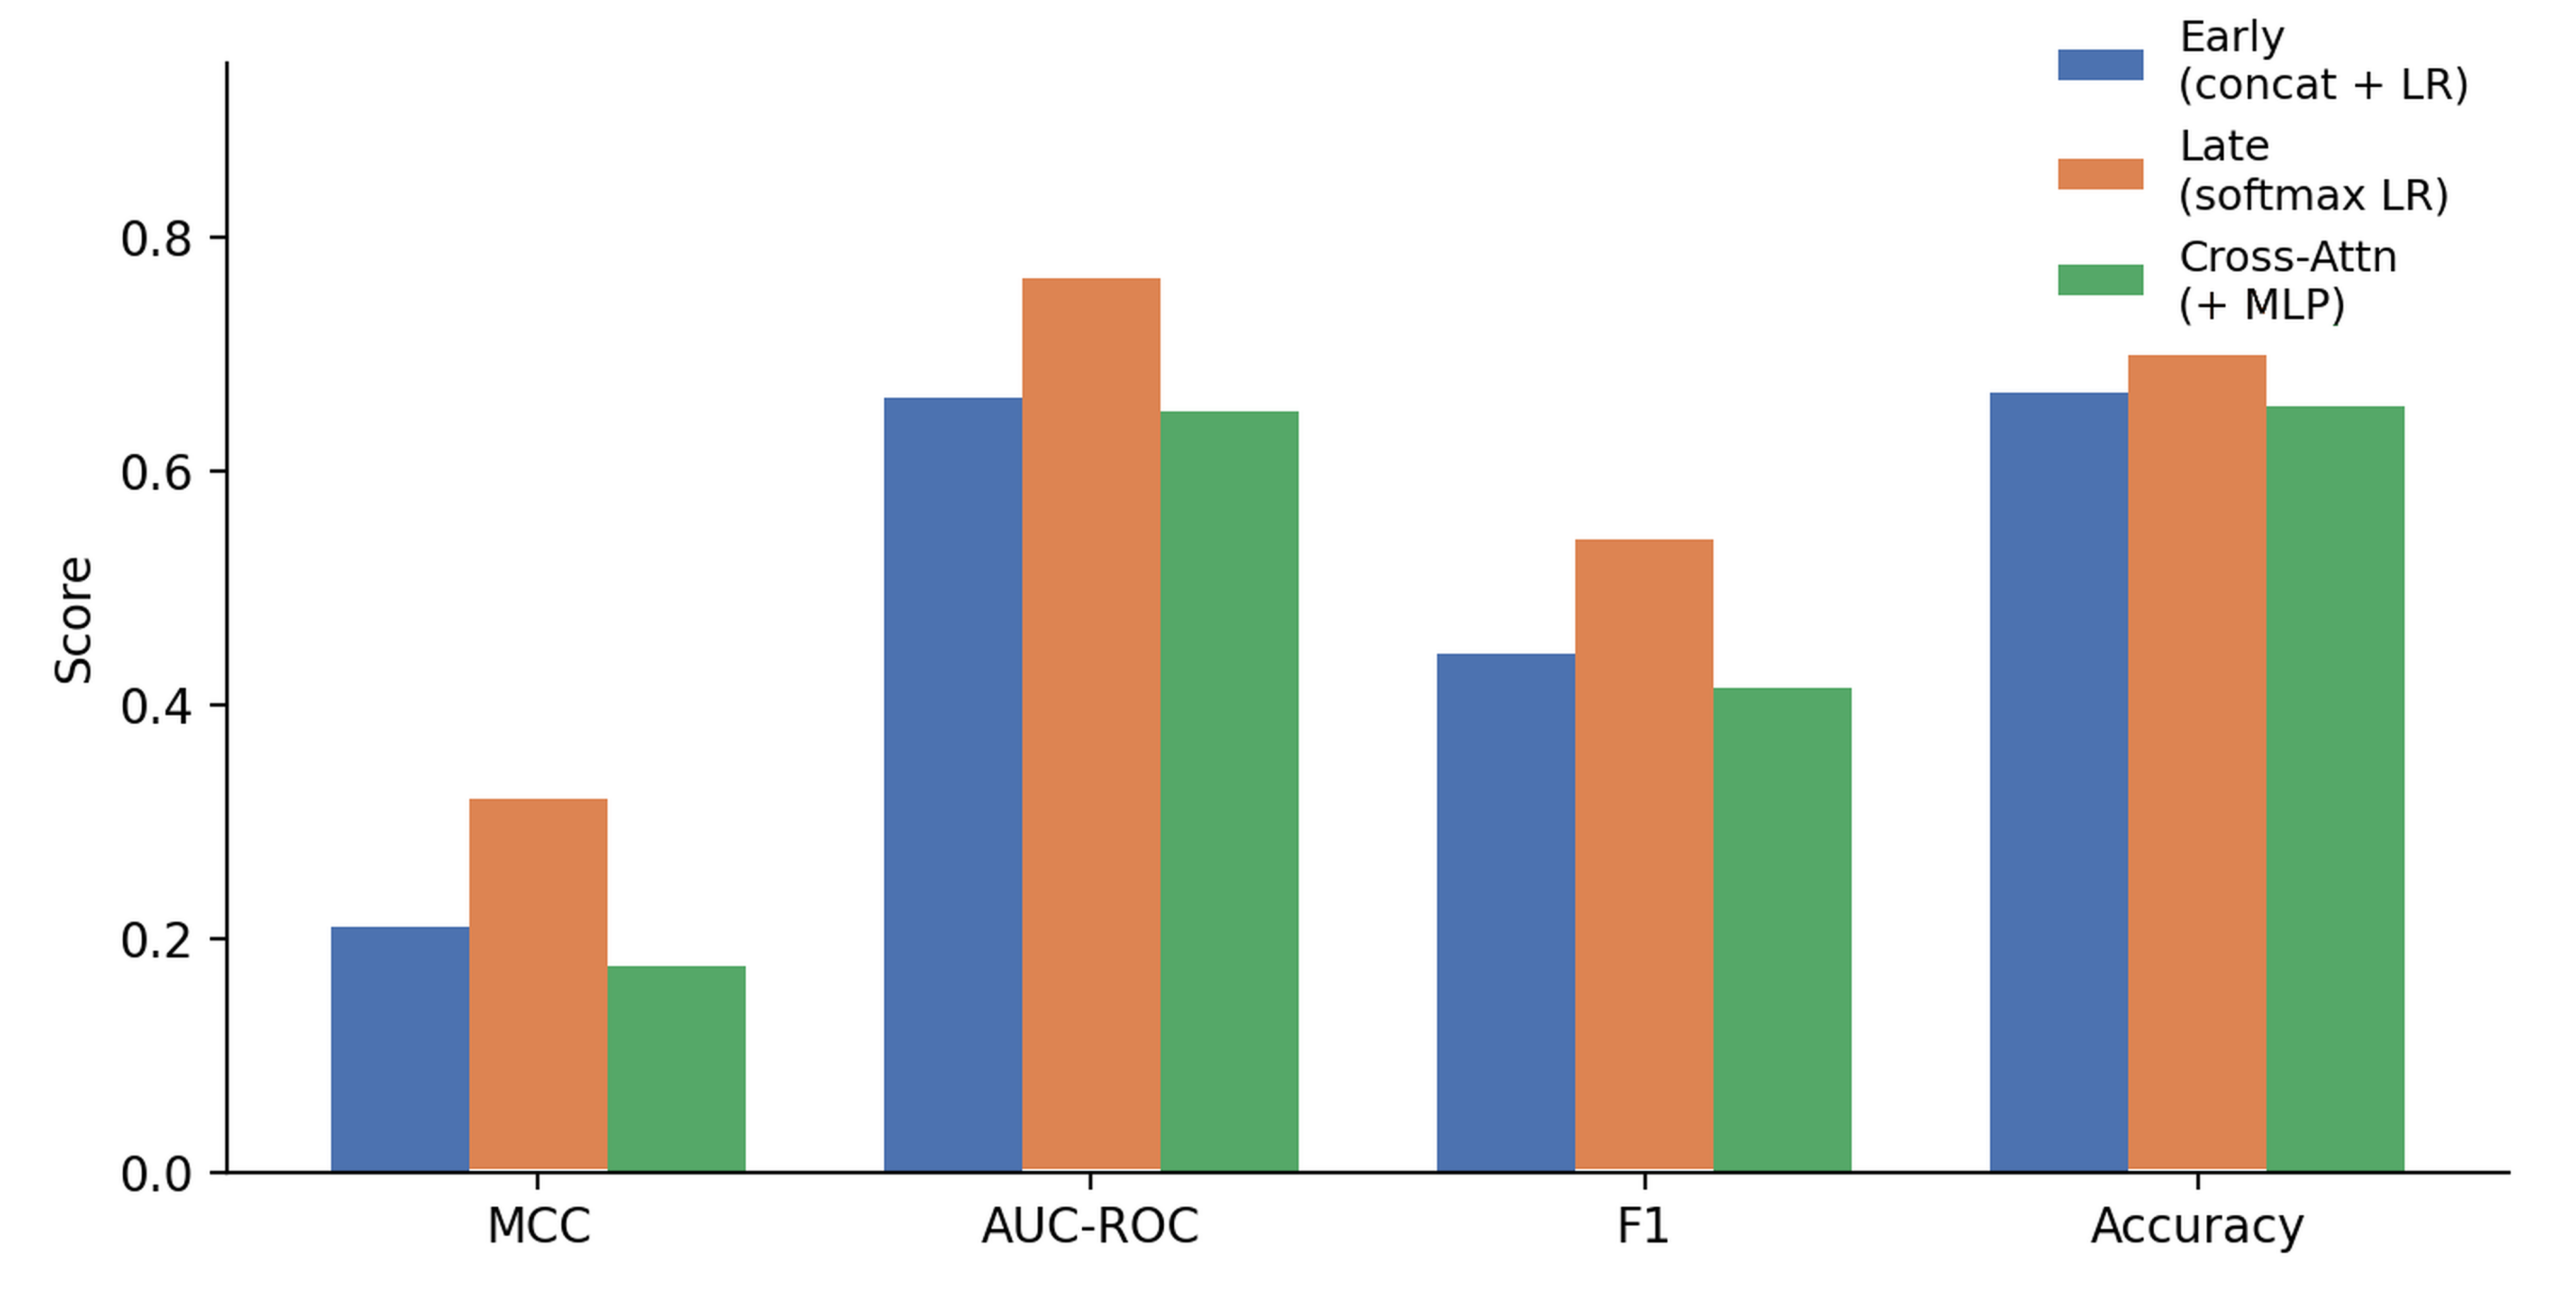
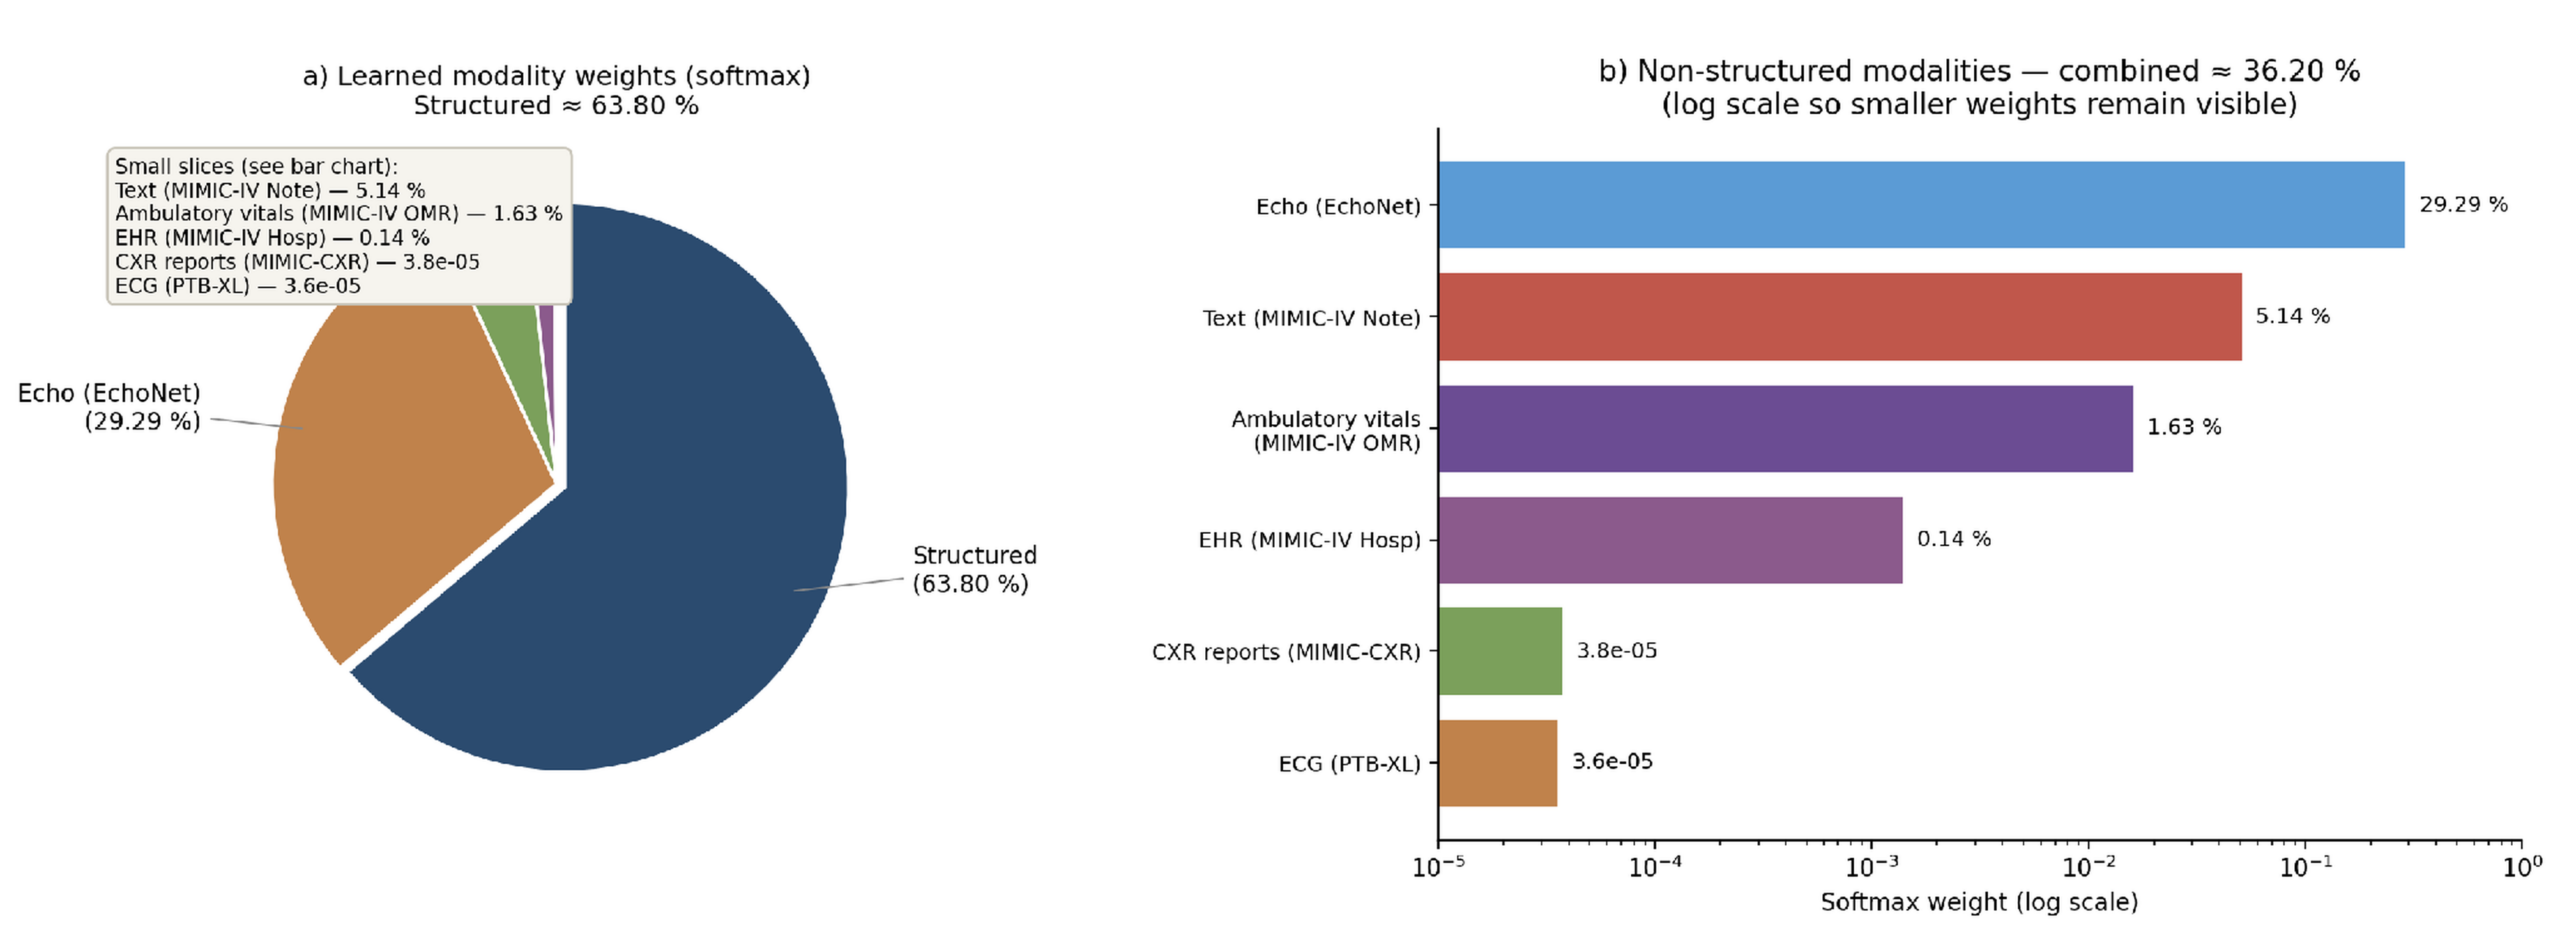
Three fusion strategies were compared. Early Fusion concatenates all seven sources into one 2,443-dimensional vector and fits a single Logistic Regression. Late Fusion fits a per-source Logistic Regression and combines their outputs with learned softmax weights. Cross-Modal Attention with a multilayer perceptron (MLP) treats each of the seven sources as a token, letting an attention layer mix them before the final prediction.
Software Environment
All experiments use Python 3.8+, scikit-learn 1.0.2, pandas 1.4.2, numpy 1.22.3, matplotlib 3.5.1, seaborn 0.11.2, PyTorch, and PyTorch Geometric45. All runs use a fixed random seed (random_state = 42) to ensure reproducibility.
Results
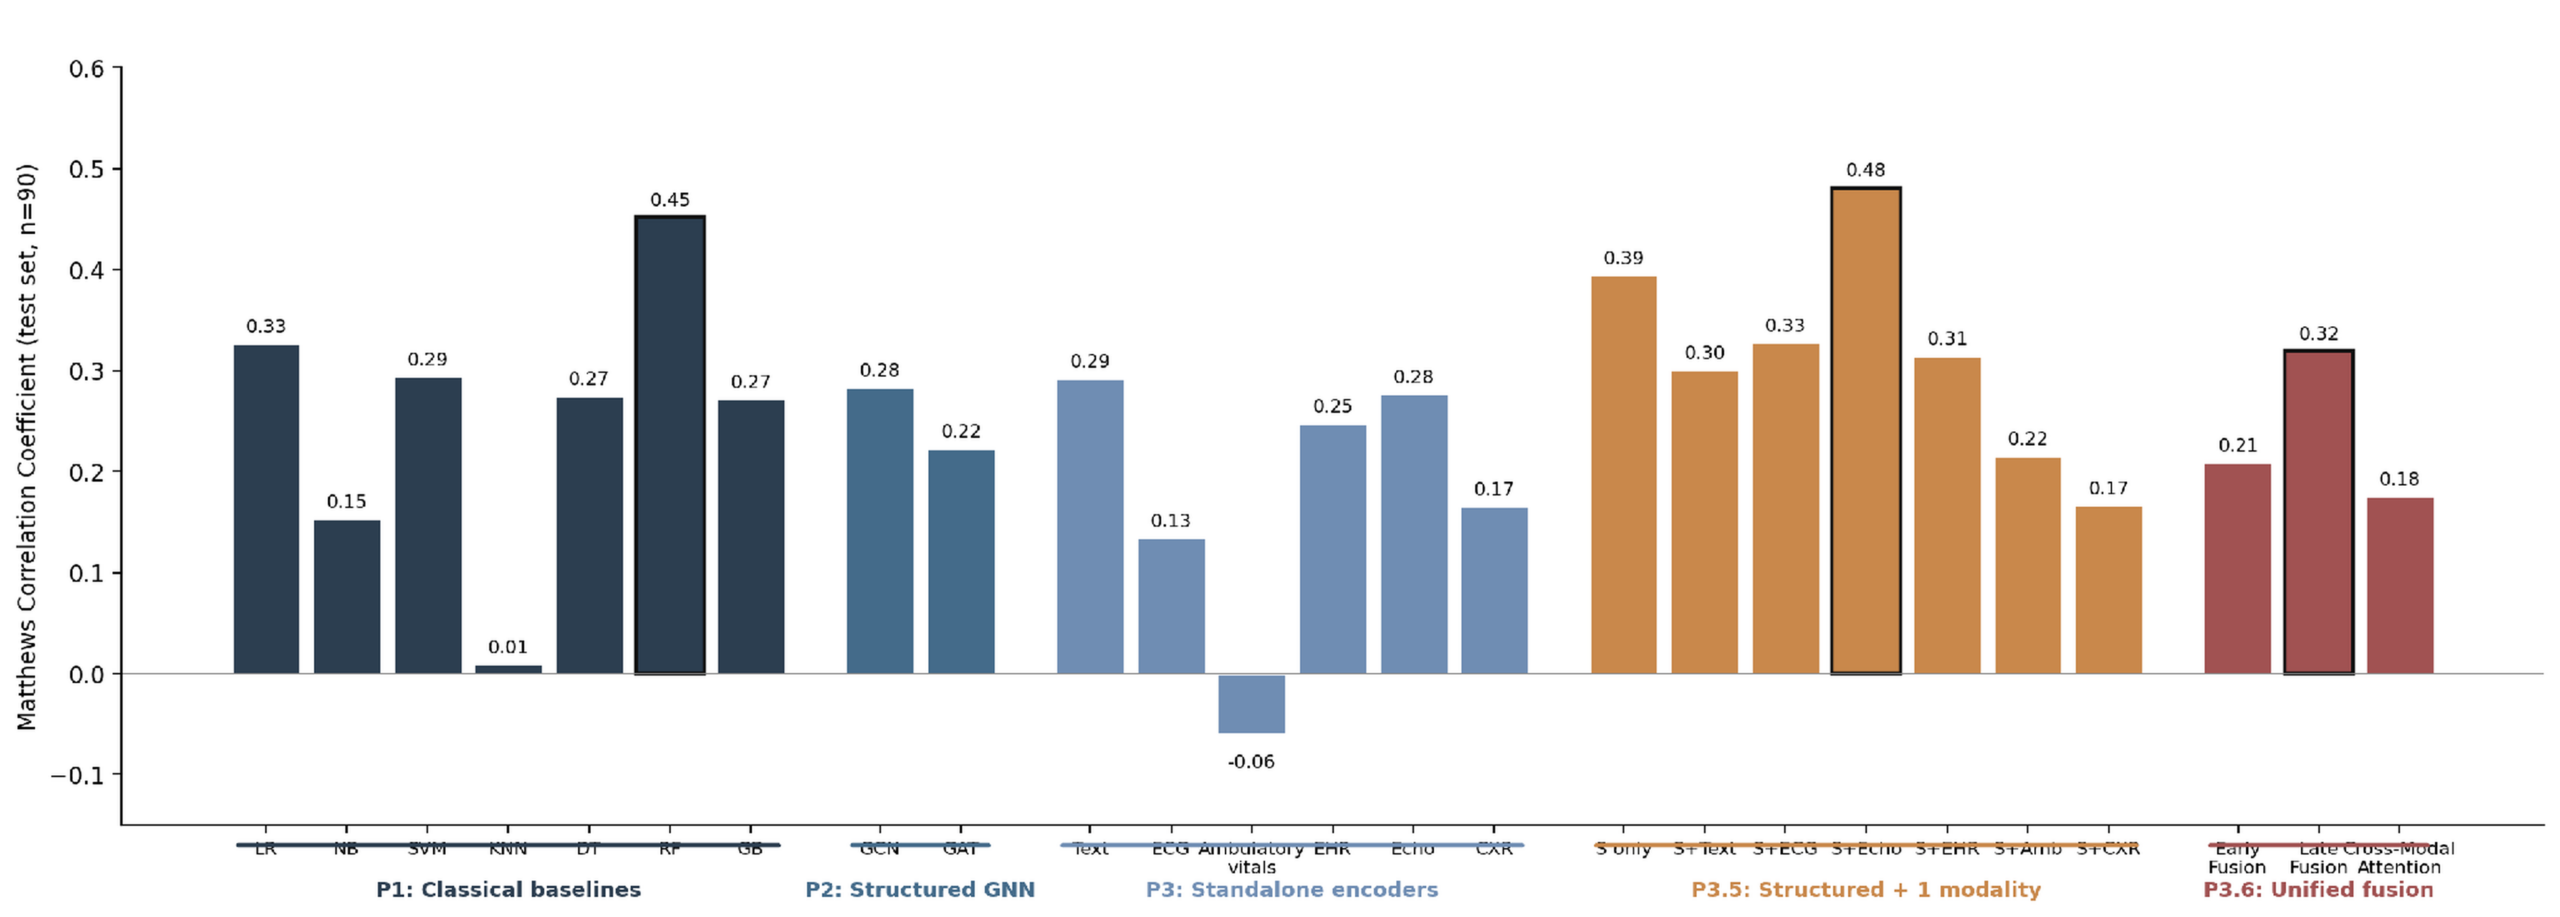
Throughout the Results and figures, phase labels denote the modeling stages of this study: P1 refers to the classical baselines; P2 to the structured-only graph neural networks; P3 to the per-modality standalone encoders; P3.5 to the structured-plus-one-modality ablation; and P3.6 to the unified multimodal fusion.
Baseline Population Characteristics
Baseline demographic and clinical characteristics are shown in Table 2.
| Characteristic | Overall (N=299) | Survivors (n=203) | Non-survivors (n=96) |
| Age, years — mean ± SD | 60.8 ± 11.9 | 58.8 ± 10.6 | 65.2 ± 13.2 |
| Age, years — median [IQR] | 60 [51–70] | 60 [50–65] | 65 [55–75] |
| Sex — male, n (%) | 194 (64.9%) | 132 (65.0%) | 62 (64.6%) |
| Sex — female, n (%) | 105 (35.1%) | 71 (35.0%) | 34 (35.4%) |
| Ejection Fraction, % — mean ± SD | 38.1 ± 11.8 | 40.3 ± 10.9 | 33.5 ± 12.5 |
| HFrEF (EF <40%), n (%) | 182 (60.9%) | 109 (53.7%) | 73 (76.0%) |
| HFmrEF (EF 40–49%), n (%) | 57 (19.1%) | 48 (23.6%) | 9 (9.4%) |
| HFpEF (EF ≥50%), n (%) | 60 (20.1%) | 46 (22.7%) | 14 (14.6%) |
| Anaemia, n (%) | 129 (43.1%) | 83 (40.9%) | 46 (47.9%) |
| Diabetes, n (%) | 125 (41.8%) | 85 (41.9%) | 40 (41.7%) |
| Hypertension, n (%) | 105 (35.1%) | 66 (32.5%) | 39 (40.6%) |
| Smoking, n (%) | 96 (32.1%) | 66 (32.5%) | 30 (31.2%) |
| CPK, U/L — median [IQR] | 250 [116–582] | 245 [109–582] | 259 [129–582] |
| Platelets, ×10³/μL — mean ± SD | 263 ± 98 | 267 ± 98 | 256 ± 99 |
| Serum creatinine, mg/dL — median [IQR] | 1.10 [0.90–1.40] | 1.00 [0.90–1.20] | 1.30 [1.08–1.90] |
| Serum sodium, mEq/L — mean ± SD | 136.6 ± 4.4 | 137.2 ± 4.0 | 135.4 ± 5.0 |
| Follow-up, days — median [IQR] | 115 [73–203] | 172 [95–213] | 44 [26–102] |
| Mortality (DEATH_EVENT), n (%) | 96 (32.1%) | 0 (0.0%) | 96 (100.0%) |
Classical Baseline Performance
Accuracy ranges from 63 % (KNN) to 77 % (Random Forest) and AUROC from 0.63 to 0.81 — structured features alone carry substantial prognostic signal. Random Forest is strongest (MCC 0.452, accuracy 76.7 %), consistent with Chicco & Jurman1. SVM (RBF) reaches AUROC 0.783; KNN is weakest (MCC 0.009), and Naive Bayes lags (MCC 0.153), likely due to its independence assumption.
| Model | Accuracy | MCC | AUROC | F1 | Precision | Recall |
| Logistic Regression | 0.722 [0.644, 0.800] | 0.327 [0.126, 0.534] | 0.752 [0.638, 0.852] | 0.510 [0.348, 0.667] | 0.591 | 0.448 |
| Naive Bayes | 0.667 [0.589, 0.744] | 0.153 [-0.053, 0.369] | 0.737 [0.623, 0.841] | 0.348 [0.182, 0.511] | 0.471 | 0.276 |
| SVM (RBF) | 0.711 [0.622, 0.789] | 0.294 [0.084, 0.498] | 0.783 [0.684, 0.873] | 0.480 [0.304, 0.640] | 0.571 | 0.414 |
| K-Nearest Neighbors | 0.633 [0.567, 0.700] | 0.009 [-0.185, 0.229] | 0.627 [0.516, 0.737] | 0.195 [0.050, 0.356] | 0.333 | 0.138 |
| Decision Tree | 0.689 [0.600, 0.778] | 0.275 [0.067, 0.483] | 0.635 [0.531, 0.737] | 0.500 [0.333, 0.644] | 0.519 | 0.483 |
| Random Forest | 0.767 [0.678, 0.844] | 0.452 [0.251, 0.651] | 0.808 [0.710, 0.891] | 0.618 [0.471, 0.759] | 0.654 | 0.586 |
| Gradient Boosting | 0.700 [0.611, 0.778] | 0.272 [0.051, 0.475] | 0.744 [0.637, 0.839] | 0.471 [0.296, 0.618] | 0.545 | 0.414 |
Structured-Only Graph Neural Networks
On structured features alone, GCN reached MCC 0.283 / AUROC 0.757 and GAT reached 0.223 / 0.696 — both below the top classical models. On a 299-patient cohort, patient-similarity edges alone are not enough; graph gains require richer multi-source features.
Standalone Per-Encoder Performance
Each modality-specific encoder is first evaluated as a standalone classifier on the shared 70/30 stratified split (n_test = 90). Results are summarized in Table 4.
| Encoder | Modality | MCC | AUROC | F1 | Accuracy |
| Random Forest (reference) | Structured (11-D) | 0.452 [0.251, 0.651] | 0.808 [0.710, 0.891] | 0.618 [0.471, 0.759] | 0.767 [0.678, 0.844] |
| Gradient Boosting (reference) | Structured (11-D) | 0.272 [0.051, 0.475] | 0.744 [0.637, 0.839] | 0.471 [0.296, 0.618] | 0.700 [0.611, 0.778] |
| GCN (reference) | Structured (11-D) | 0.283 [0.069, 0.489] | 0.757 [0.651, 0.850] | 0.491 [0.318, 0.642] | 0.700 [0.611, 0.778] |
| GAT (reference) | Structured (11-D) | 0.223 [0.002, 0.422] | 0.696 [0.579, 0.808] | 0.464 [0.302, 0.610] | 0.667 [0.578, 0.756] |
| Bio_ClinicalBERT (MIMIC-IV-Note, real) | Real HF text (768-D) | 0.292 [0.093, 0.484] | 0.711 [0.598, 0.813] | 0.556 [0.432, 0.667] | 0.644 [0.544, 0.744] |
| 1D CNN (PTB-XL, real) | Real 12-lead ECG (128-D) | 0.134 [-0.073, 0.340] | 0.590 [0.458, 0.717] | 0.466 [0.338, 0.585] | 0.567 [0.467, 0.667] |
| 1D CNN + GRU (MIMIC-IV OMR, real) | Real ambulatory vitals (128-D) | -0.060 [-0.272, 0.149] | 0.491 [0.364, 0.620] | 0.328 [0.185, 0.457] | 0.500 [0.400, 0.600] |
| Transformer-EHR (MIMIC-IV Hosp, real) | Real HF admission events (128-D) | 0.247 [0.035, 0.451] | 0.643 [0.506, 0.772] | 0.508 [0.364, 0.636] | 0.656 [0.556, 0.744] |
| R(2+1)D-18 + head (EchoNet-Dynamic, real; full 10,030) | Real echo video (512-D) | 0.276 [0.084, 0.470] | 0.666 [0.542, 0.784] | 0.543 [0.424, 0.657] | 0.644 [0.544, 0.744] |
| Bio_ClinicalBERT (MIMIC-CXR reports, real) | Real HF CXR reports (768-D) | 0.165 [-0.050, 0.372] | 0.640 [0.516, 0.753] | 0.479 [0.348, 0.597] | 0.589 [0.478, 0.689] |
Note: the structured-baseline MCC differs across tables because the reference model differs — Table 4 uses Random Forest (MCC 0.452) while Table 6 uses the Logistic Regression head for like-for-like ablation (MCC 0.394).
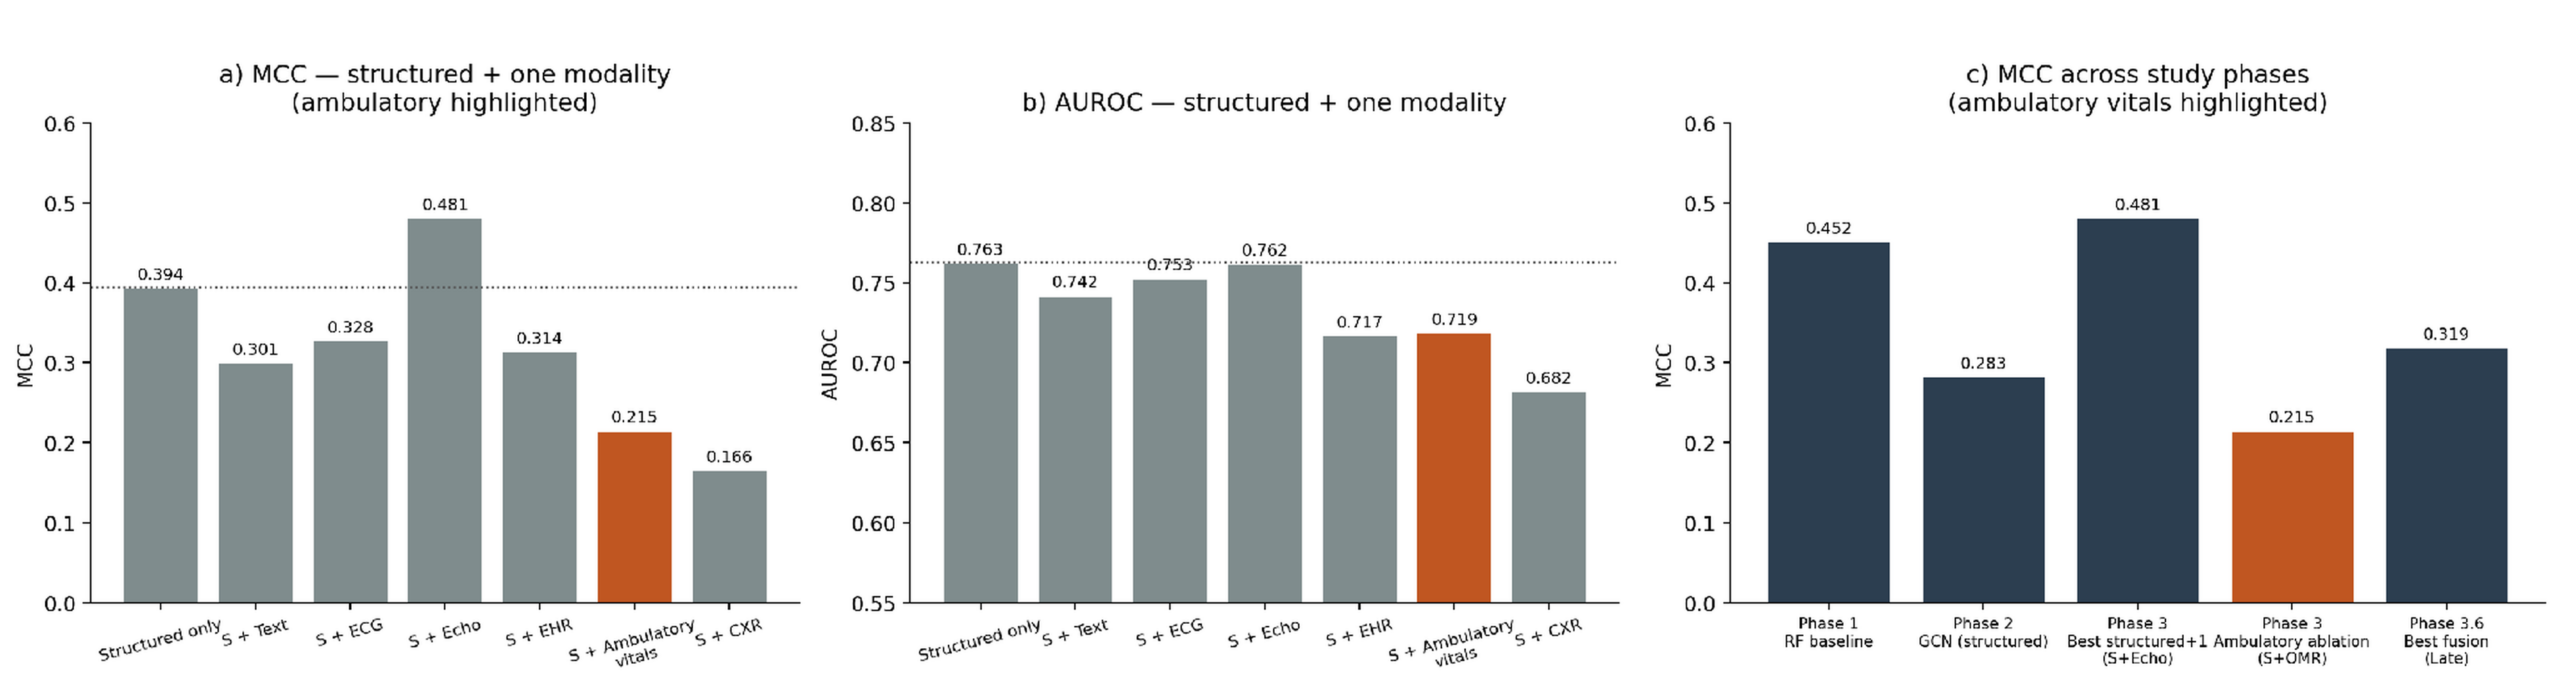
Table 4 and Figure 10 give standalone encoder performance on the shared 90-patient slice against classical and structured-GNN references. Three findings: first, no single real encoder beats the structured 11-D Random Forest (AUROC 0.808), expected under demographic donor matching at n = 299; second, the strongest encoders by AUROC are clinical notes (0.711), echocardiography (0.666), and hospital events (0.643), with CXR reports (0.640), ECG (0.590), and ambulatory vitals (0.491) behind; third, the ambulatory-vitals encoder learns real signal in-cohort (val AUROC ≈ 0.60) but does not transfer to UCI (0.491) — the honest sub-chance result of the study.
Comparison of Fusion Strategies on Real Embeddings
Three fusion methods were evaluated over all seven sources — 11 structured features plus six real-cohort embeddings (text, ECG, echocardiography, hospital history, ambulatory vitals, and X-ray reports), 2,443 features per patient (Figures 8–9), on the same 90-patient split used throughout so that accuracy and F1 stay comparable across Tables 3–6. Cross-Modal Attention (7 tokens over a 2,443-D input) is over-parameterized at n_train = 209, so its lower point estimate in Table 5 is expected and its CIs overlap the other strategies. Because many configurations were compared with overlapping bootstrap CIs and correcting for multiple comparisons across the six single-modality additions (Holm and Benjamini–Hochberg), no addition significantly improved discrimination over the structured baseline (every ΔAUROC ≤ 0; adjusted p ≈ 0.98), so the leading configurations — echocardiography, late fusion, and the hybrid graph among them — are treated as exploratory rather than established.
| Fusion Strategy | MCC | AUROC | F1 | Accuracy | Precision | Recall |
| A — Early Fusion (concat + LR) | 0.209 [-0.001, 0.422] | 0.663 [0.543, 0.781] | 0.444 [0.286, 0.593] | 0.667 [0.578, 0.756] | 0.480 | 0.414 |
| B — Late Fusion (per-modality LR + softmax) | 0.319 [0.119, 0.523] | 0.766 [0.651, 0.866] | 0.542 [0.400, 0.678] | 0.700 [0.611, 0.789] | 0.533 | 0.552 |
| C — Cross-Modal Attention (7 tokens) + MLP | 0.176 [-0.029, 0.391] | 0.652 [0.525, 0.779] | 0.415 [0.250, 0.571] | 0.656 [0.567, 0.744] | 0.458 | 0.379 |
Structured-Plus-One-Modality Ablation
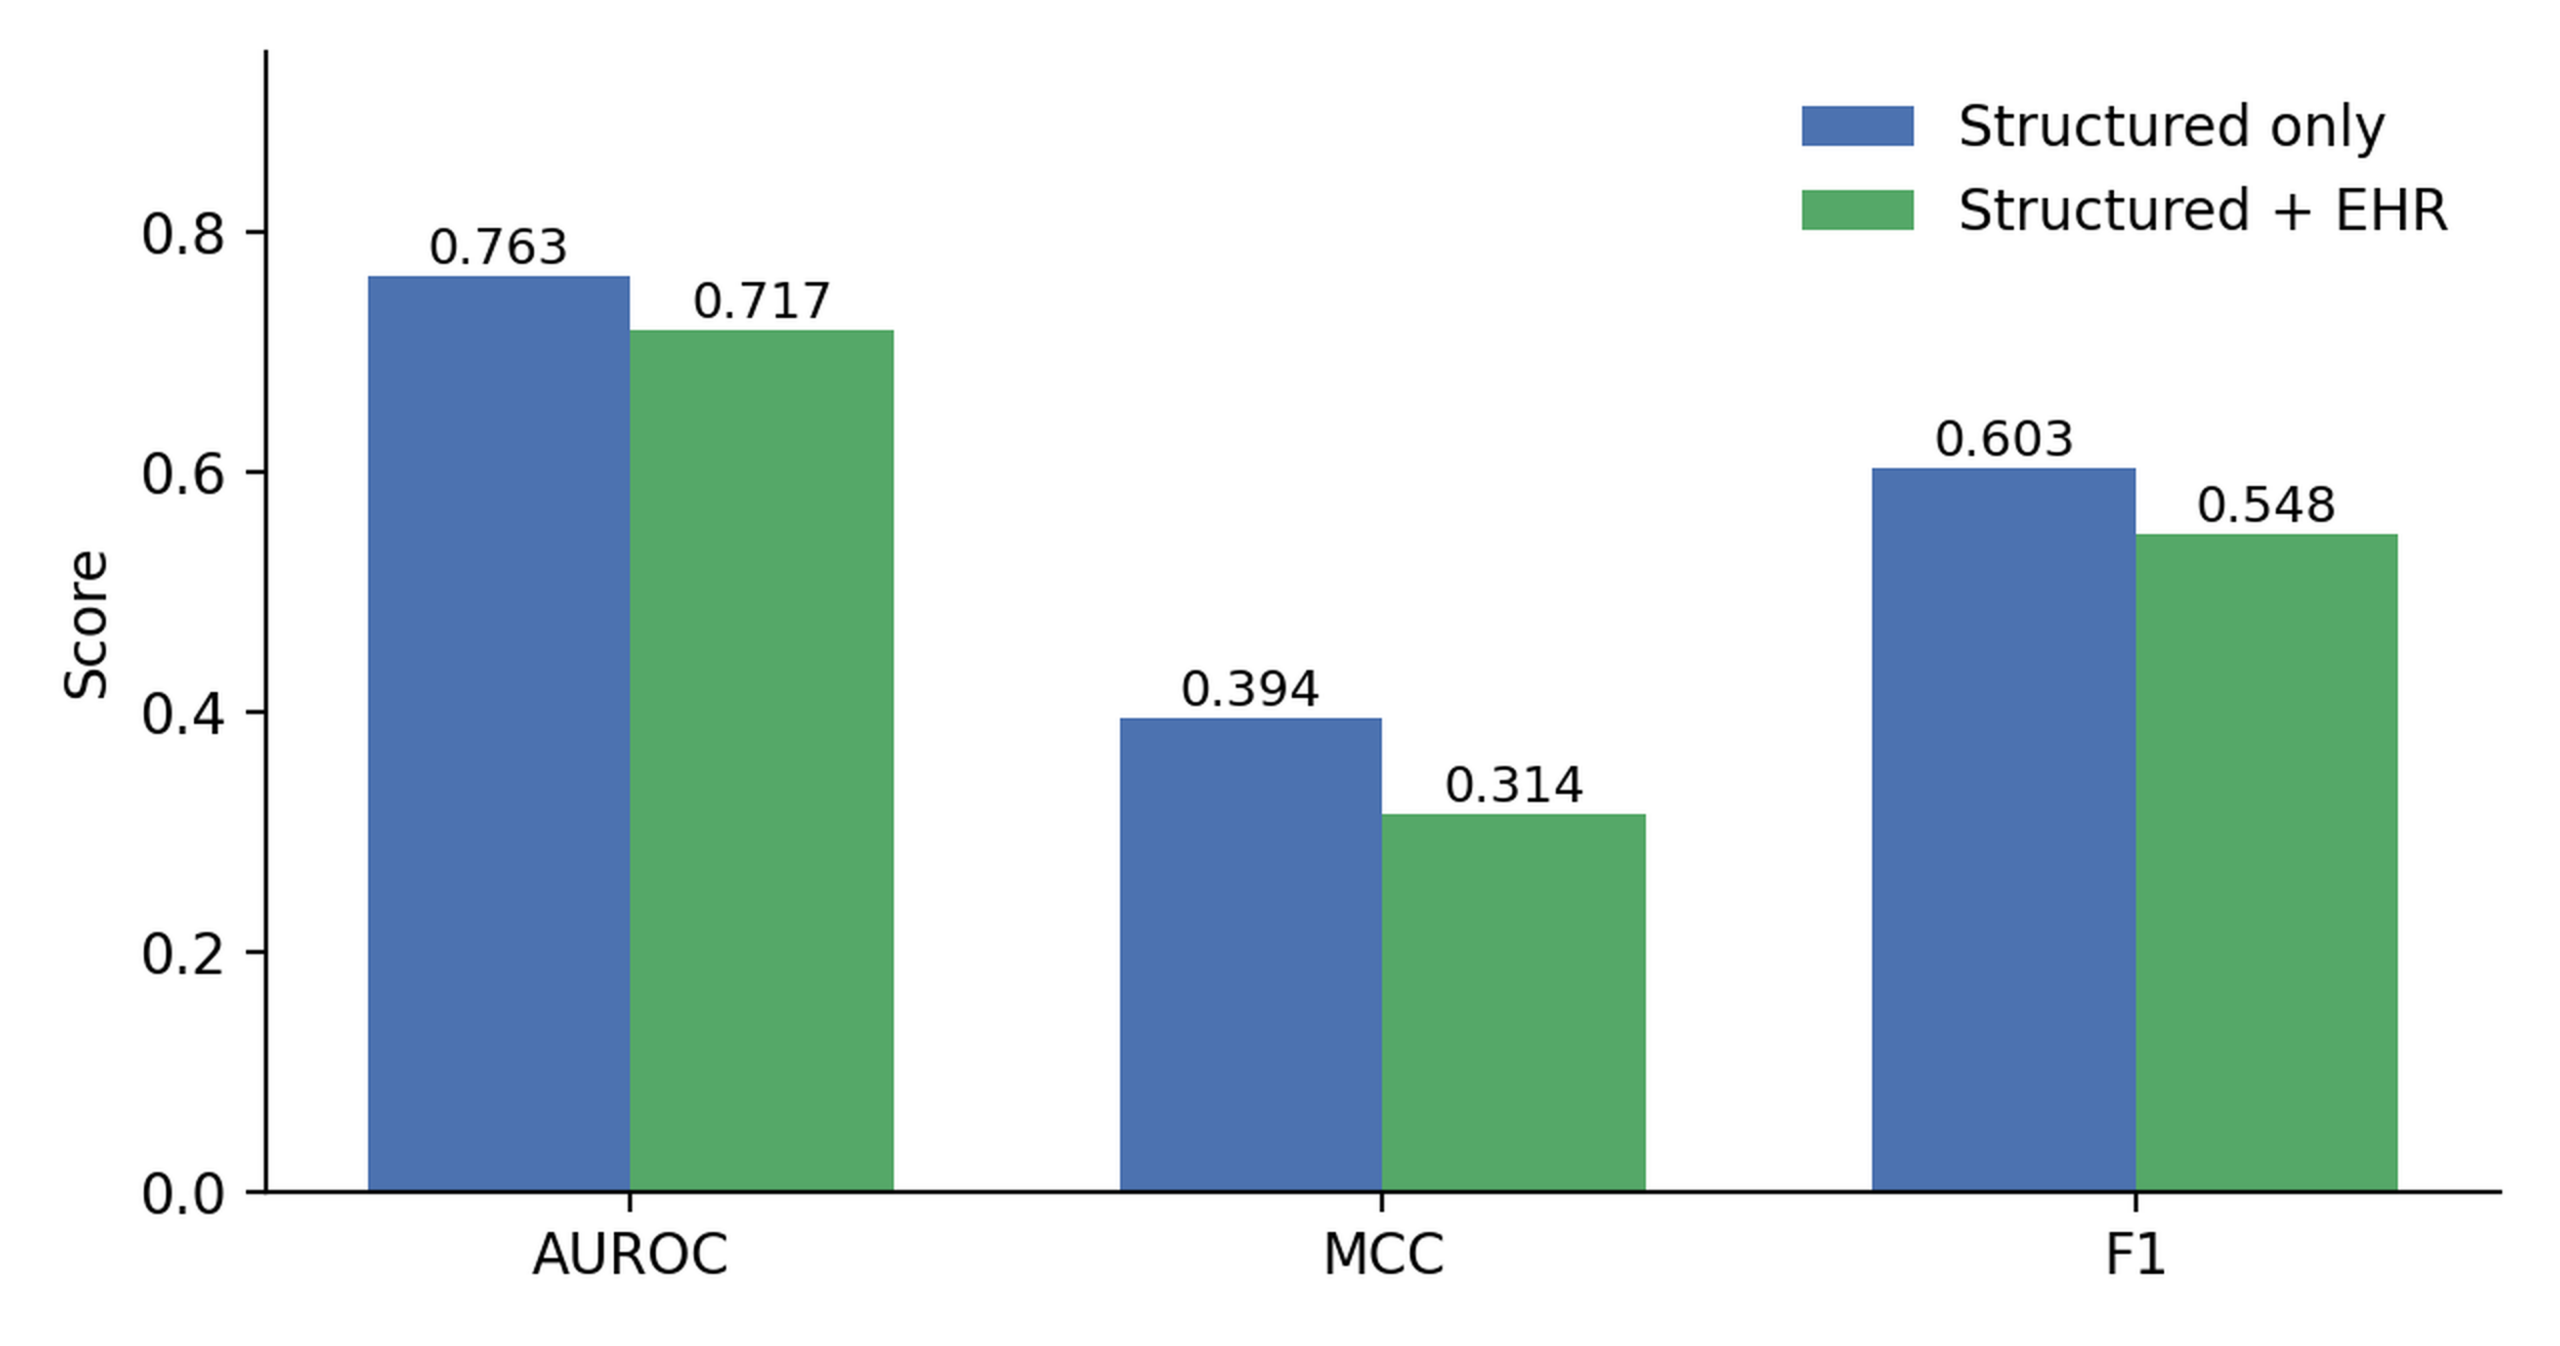
In the initial ablation, echocardiography was the only addition that did not reduce MCC relative to the structured-only baseline. However, echo donors were matched on EF and the echo encoder was trained to predict EF — the strongest structured covariate (Table 2, Figure 13) — so any apparent gain may partly restate EF; the required controls were therefore run (see the Robustness Controls note below). Under a reproducible re-analysis the Structured+Echo advantage did not persist: with EF present, adding echo did not improve on structured-only (MCC 0.382 to 0.363; AUROC 0.749 to 0.733), so the result is reported as exploratory. The other five modalities reduced MCC vs. structured-only LR (ECG 0.328, EHR 0.314, Text 0.301, ambulatory vitals 0.215, CXR reports 0.166): under donor matching at n = 299, weakly aligned embeddings add noise faster than signal. The baseline row in Table 6 uses the same LR head as the ablation; Table 3’s Random Forest remains the strongest structured model overall.
| Modality | Encoder / Source | MCC | AUROC | F1 | Accuracy |
| Structured only | UCI Clinical Features | 0.394 [0.198, 0.584] | 0.763 [0.653, 0.860] | 0.603 [0.476, 0.725] | 0.722 [0.633, 0.811] |
| Structured + Text | Bio_ClinicalBERT (MIMIC-IV-Note) | 0.301 [0.100, 0.501] | 0.742 [0.630, 0.839] | 0.533 [0.386, 0.667] | 0.689 [0.600, 0.778] |
| Structured + ECG | 1D CNN (PTB-XL) | 0.328 [0.133, 0.531] | 0.753 [0.647, 0.851] | 0.562 [0.433, 0.689] | 0.689 [0.600, 0.778] |
| Structured + Echo | R(2+1)D-18 (EchoNet-Dynamic) | 0.481 [0.288, 0.669] | 0.762 [0.644, 0.868] | 0.656 [0.519, 0.780] | 0.767 [0.678, 0.856] |
| Structured + EHR | Transformer (MIMIC-IV Hosp) | 0.314 [0.118, 0.511] | 0.717 [0.604, 0.819] | 0.548 [0.414, 0.676] | 0.689 [0.600, 0.778] |
| Structured + Longitudinal Vitals | 1D CNN + GRU (MIMIC-IV OMR) | 0.215 [0.014, 0.421] | 0.719 [0.611, 0.820] | 0.484 [0.340, 0.618] | 0.644 [0.544, 0.733] |
| Structured + CXR | Bio_ClinicalBERT (MIMIC-CXR) | 0.166 [-0.047, 0.373] | 0.682 [0.562, 0.793] | 0.452 [0.308, 0.590] | 0.622 [0.522, 0.711] |
Robustness controls across all donor-matched modalities. Because any apparent multimodal gain could reflect the donor-matching design rather than independent modality signal, the full battery of controls was run for all six donor-matched modalities under one reproducible pipeline (global z-scoring, a logistic-regression head, 70/30 split; n_test = 90), with per-modality results in Table 6b. Three results hold across the board. First, no modality improved on the structured-only baseline (MCC 0.382): every Structured+Modality configuration lowered MCC, echo by the smallest margin (−0.018). Second, a matched-vs-random-donor permutation test (1,000 shuffles) was non-significant for all six (p = 0.19–0.99), so matched donors never added signal beyond a random donor from the same cohort. Third, residualizing each embedding on age, sex, and EF recovered no gain. Donor reuse was pervasive — 77 to 89 of the 90 test patients shared a training donor in every modality — and most extreme for echo, which drew on only 17 unique donors so that 89 of 90 test patients shared a training donor, leaving the Structured+Echo test set almost entirely non-independent. Echo was also the only EF-specific case: with EF removed from the structured block, echo recovered almost exactly the performance its removal had cost (MCC 0.245 rising to 0.363), confirming the embedding stands in for EF. Every addition — echo included — is therefore retained only as exploratory, pending confirmation on natively paired data.
| Modality | S+Mod MCC (ΔMCC) | Unique donors | Test sharing train donor | Permutation p | Residualized MCC |
| Structured only | 0.382 | — | — | — | — |
| Clinical notes | 0.319 (−0.062) | 77 | 77/90 | 0.19 | 0.332 |
| ECG | 0.294 (−0.088) | 74 | 78/90 | 0.70 | 0.294 |
| Echocardiography | 0.363 (−0.018) | 17 | 89/90 | 0.32 | 0.314 |
| Chest X-ray | 0.283 (−0.099) | 75 | 77/90 | 0.28 | 0.247 |
| EHR events | 0.214 (−0.168) | 77 | 77/90 | 0.80 | 0.247 |
| Ambulatory vitals | 0.149 (−0.233) | 74 | 78/90 | 0.99 | 0.149 |
Independent Replication — Zigong Cohort
To test genuine transport rather than re-development, the UCI-trained structured pipeline — feature definitions, median imputation, standardization, and the fitted classifier — was frozen and applied to Zigong without any refitting, using seven predictors common to both cohorts (age, sex, ejection fraction, serum creatinine, serum sodium, platelets, and diabetes, with laboratory units reconciled) and an all-cause-mortality endpoint. Evaluated on all 2,008 Zigong patients (57 six-month deaths), the frozen Logistic Regression retained modest discrimination (AUROC 0.66, 95% CI 0.58–0.74; Random Forest 0.61, 95% CI 0.53–0.69), against internal UCI cross-validation of 0.75 and 0.78. Both models were severely miscalibrated (mean predicted risk 0.51 and 0.36 versus 0.028 observed; calibration slope 0.53 and 0.34), because UCI’s 32% event rate is roughly tenfold higher than Zigong’s 2.8% six-month rate. Discrimination therefore partially transfers — Logistic Regression again ahead of Random Forest — but the frozen model cannot be deployed off the shelf without recalibration.
Nine classical models were retrained on Zigong for 6-month mortality (Table 7), tuned by 5-fold cross-validation with AUPRC as the primary metric (model hyperparameters and grids are given in the Methods) — 6-month mortality is rare (2.84 % train; 9/302 test positives), making AUROC less reliable. Several tree-based models default to the majority class at threshold 0.5 (F1 = 0, MCC ≈ 0) despite competitive AUROC, so AUPRC is the fair comparator. Naive Bayes’s Brier of 0.662 reflects miscalibration at this prevalence and should be read alongside its AUPRC of 0.051.
| Model | Modality | AUROC | AUPRC | F1 | MCC | Brier |
| Logistic Regression | Structured | 0.810 | 0.422 | 0.270 | 0.280 | 0.068 |
| Gradient Boosting | Structured | 0.729 | 0.390 | 0.429 | 0.435 | 0.023 |
| KNN | Structured | 0.672 | 0.361 | 0.000 | 0.000 | 0.026 |
| SVM (RBF) | Structured | 0.702 | 0.288 | 0.200 | 0.329 | 0.025 |
| Random Forest | Structured | 0.667 | 0.194 | 0.000 | 0.000 | 0.027 |
| LightGBM | Structured | 0.700 | 0.162 | 0.000 | 0.000 | 0.030 |
| XGBoost | Structured | 0.680 | 0.124 | 0.000 | -0.014 | 0.031 |
| Decision Tree | Structured | 0.623 | 0.068 | 0.150 | 0.133 | 0.090 |
| Naive Bayes | Structured | 0.696 | 0.051 | 0.081 | 0.113 | 0.662 |
Three GNN backbones (GCN, GAT, and GraphSAGE; each 2 layers, hidden width 128, dropout 0.5) were tested on Zigong across three patient-similarity graphs: knn10_euclidean, a k-nearest-neighbor graph (k = 10) on the full 246-dimensional feature space; knn10_clinical, a k = 10 graph on a curated 10-feature clinical subspace; and hybrid, the union (element-wise maximum) of the knn10_euclidean similarities with unit-weight domain edges linking patients who share heart-failure type, age category, and Killip class. Endpoint homophily ranged 93.5–96.1% across graphs. All three graphs were evaluated for every model; the configuration reported in Table 8 is the one with the highest validation AUPRC, which was the hybrid graph for all three backbones, with the two k-NN variants within a few points. Models were trained with Adam (learning rate 5×10⁻³, weight decay 5×10⁻⁴) for up to 200 epochs with early stopping (patience 25) on validation AUPRC, averaged over 5 seeds. To isolate the contribution of graph structure, the GNNs were compared with a structurally identical 2-layer MLP (hidden 128, dropout 0.5) that shares the features but has no edges. For completeness, the full graph-by-model grid on the 6-month Zigong test set (AUPRC, with AUROC in parentheses; mean over 5 seeds) was: GCN — knn10_euclidean 0.374 (0.702), knn10_clinical 0.231 (0.773), hybrid 0.399 (0.729); GAT — knn10_euclidean 0.299 (0.729), knn10_clinical 0.218 (0.742), hybrid 0.387 (0.719); GraphSAGE — knn10_euclidean 0.365 (0.650), knn10_clinical 0.329 (0.737), hybrid 0.374 (0.711).
| Model | Graph | AUROC (mean ± SD) | AUPRC (mean ± SD) | F1 | MCC |
| GCN | hybrid | 0.729 ± 0.004 | 0.399 ± 0.018 | 0.152 | 0.177 |
| GAT | hybrid | 0.719 ± 0.030 | 0.387 ± 0.033 | 0.221 | 0.223 |
| GraphSAGE | hybrid | 0.711 ± 0.028 | 0.374 ± 0.002 | 0.349 | 0.340 |
| MLP (ablation) | none | 0.672 ± 0.024 | 0.348 ± 0.025 | 0.333 | 0.314 |
The MLP ablation shares the GNN features without graph structure. Values are mean ± SD over 5 seeds (the reported uncertainty measure); the reported graph was selected by validation AUPRC and was the hybrid graph for every backbone. Bootstrap 95 % CIs (2,000 resamples, per seed and averaged) are wide and overlap heavily across all backbones and the no-graph MLP, so graph and no-graph models are not statistically distinguishable on this cohort; full CIs are released with the code and data.
Two findings emerge. First, the best graph model (GCN on the hybrid graph, AUPRC 0.399) beat the MLP baseline (0.348) by ~5 pp and eight of nine classical models — graph edges add measurable value on Zigong. Second, no graph model beat Logistic Regression (AUPRC 0.422 / AUROC 0.810), largely because the training split has only 40 positive events. Graph methods enhance existing structural patterns rather than creating new predictive signal.
Survival Analysis (Kaplan–Meier + Cox Proportional-Hazards)
Follow-up time was excluded from the classification models to prevent target leakage; here it is used correctly as a time-to-event outcome. The companion survival analysis46 reports Kaplan–Meier curves, a Cox model over the 11 baseline features, and Harrell’s C-index (the survival analogue of AUROC), measuring risk over time without compromising the classification pipeline.
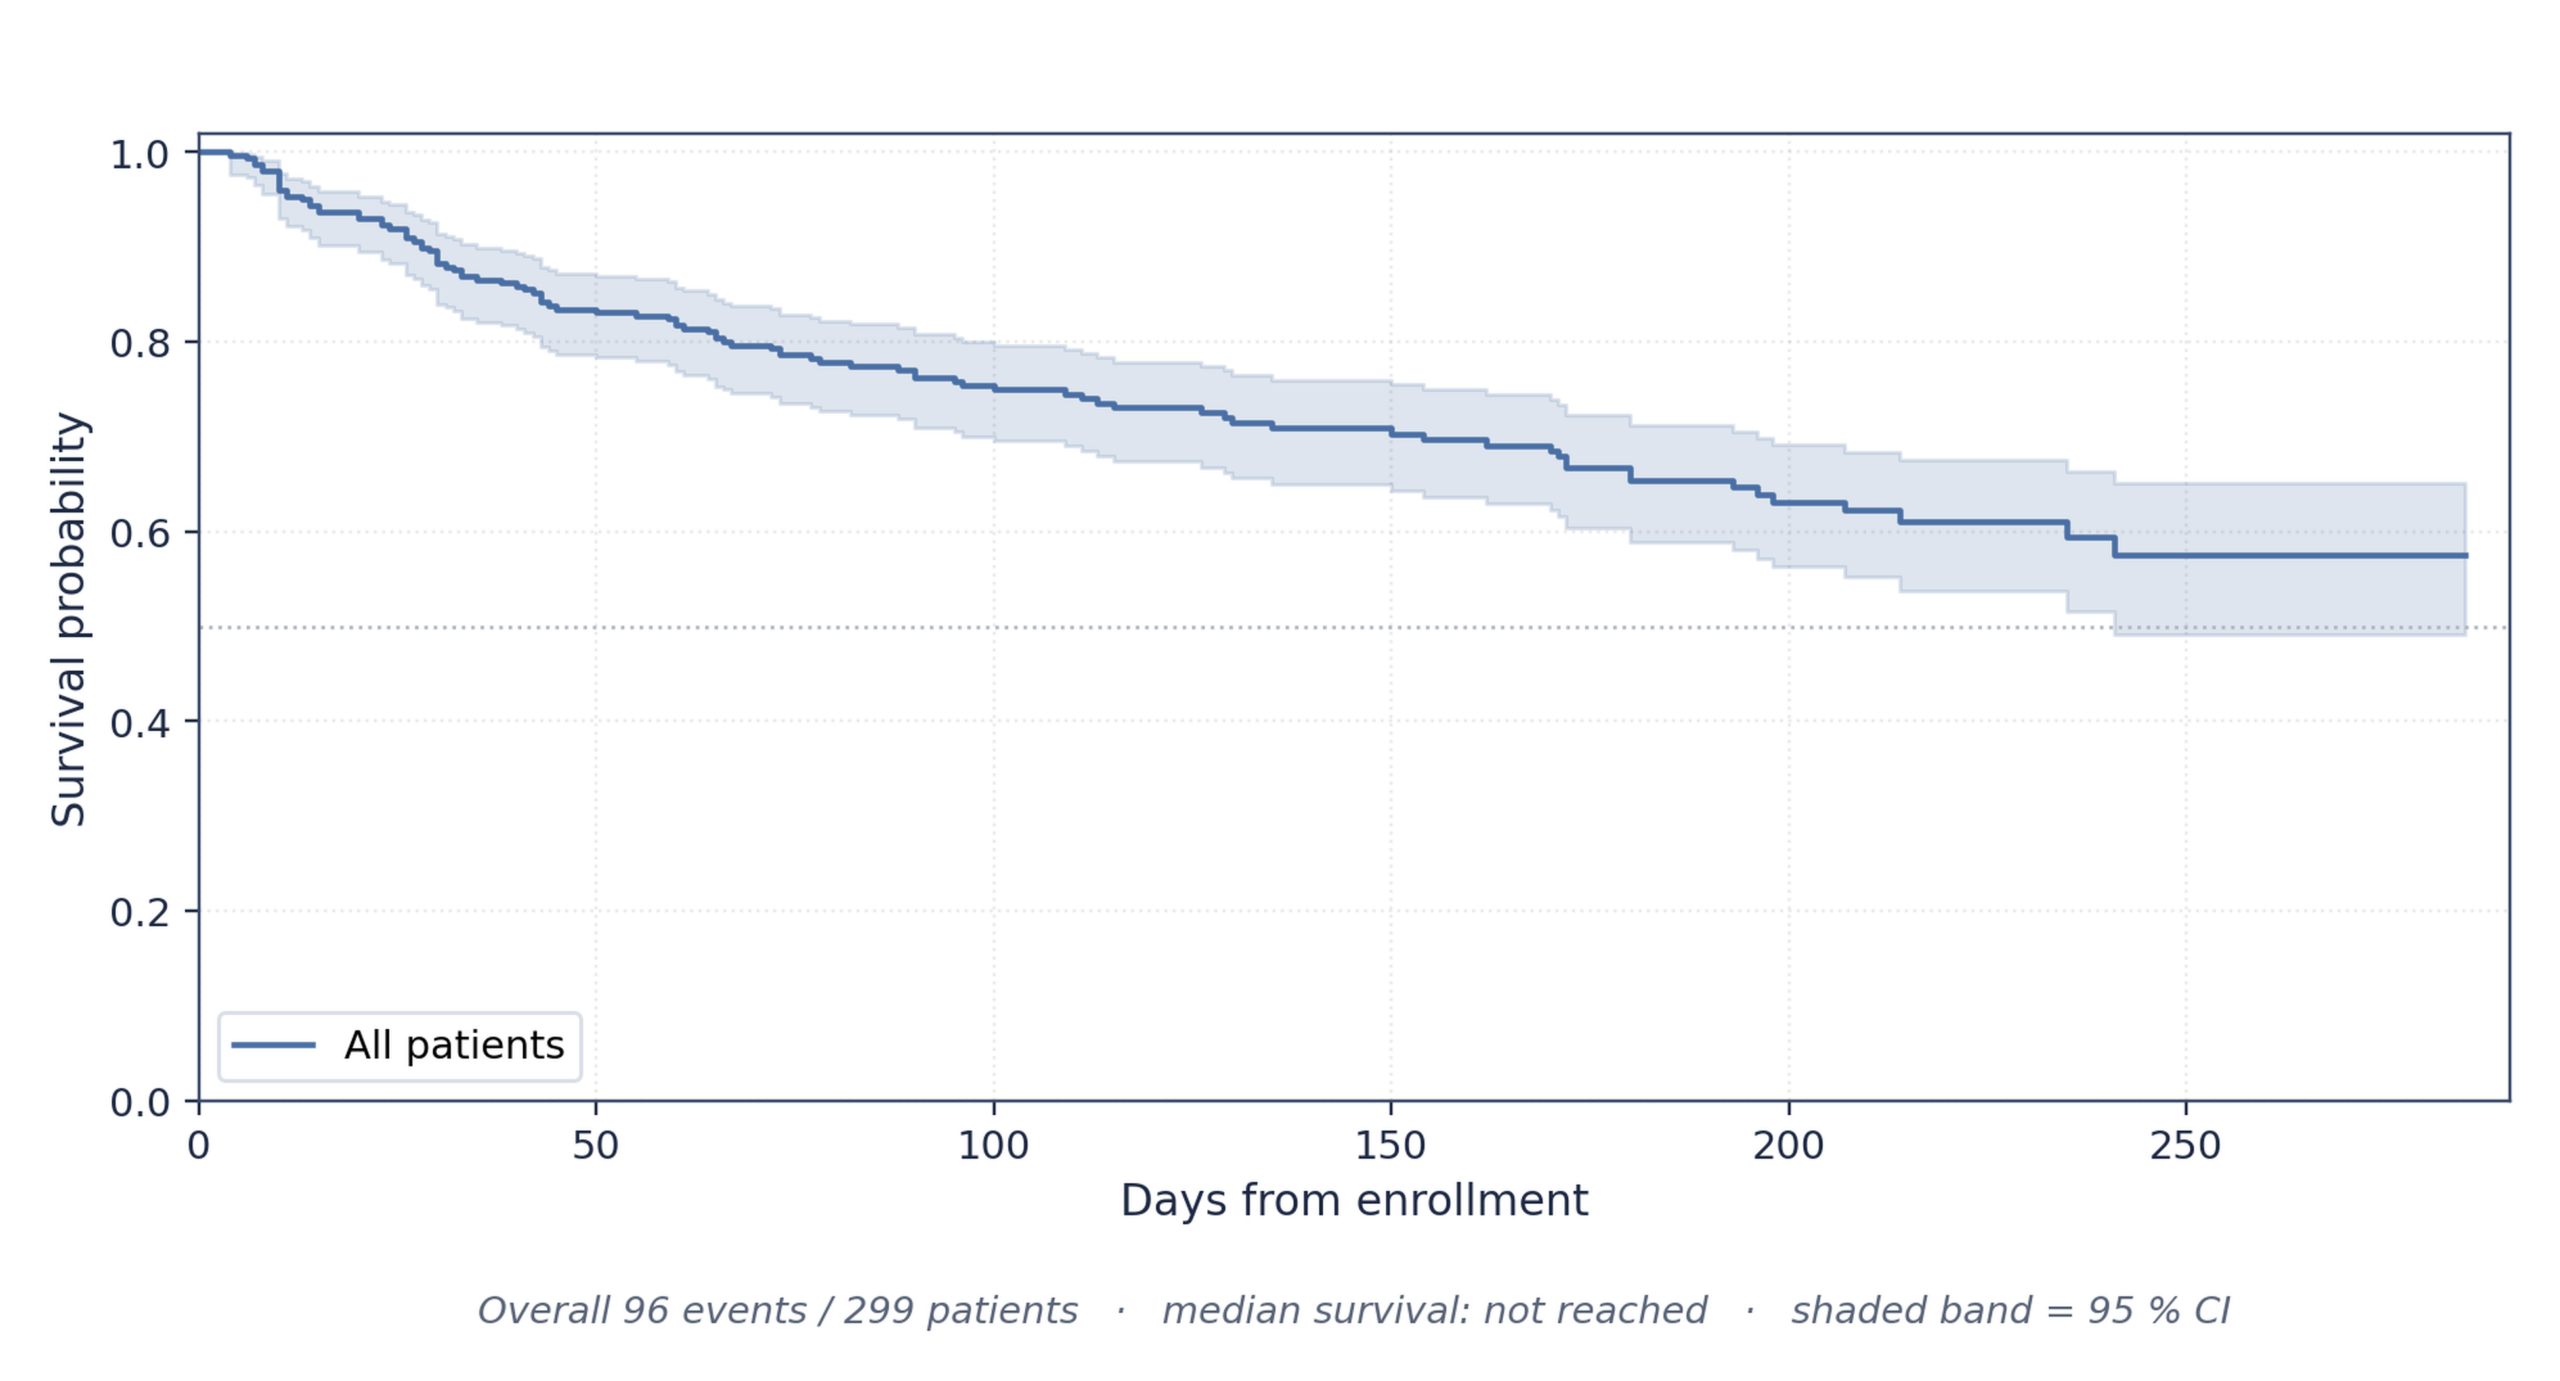
Overall Kaplan–Meier: 96 / 299 patients died over a 4–285-day follow-up (median 115 days); 203 were right-censored. Survival was ≈ 79 % at 100 days, 66 % at 200 days, and 60 % by end of follow-up; median survival was not reached. Figure 11 shows the curve with its 95 % CI.
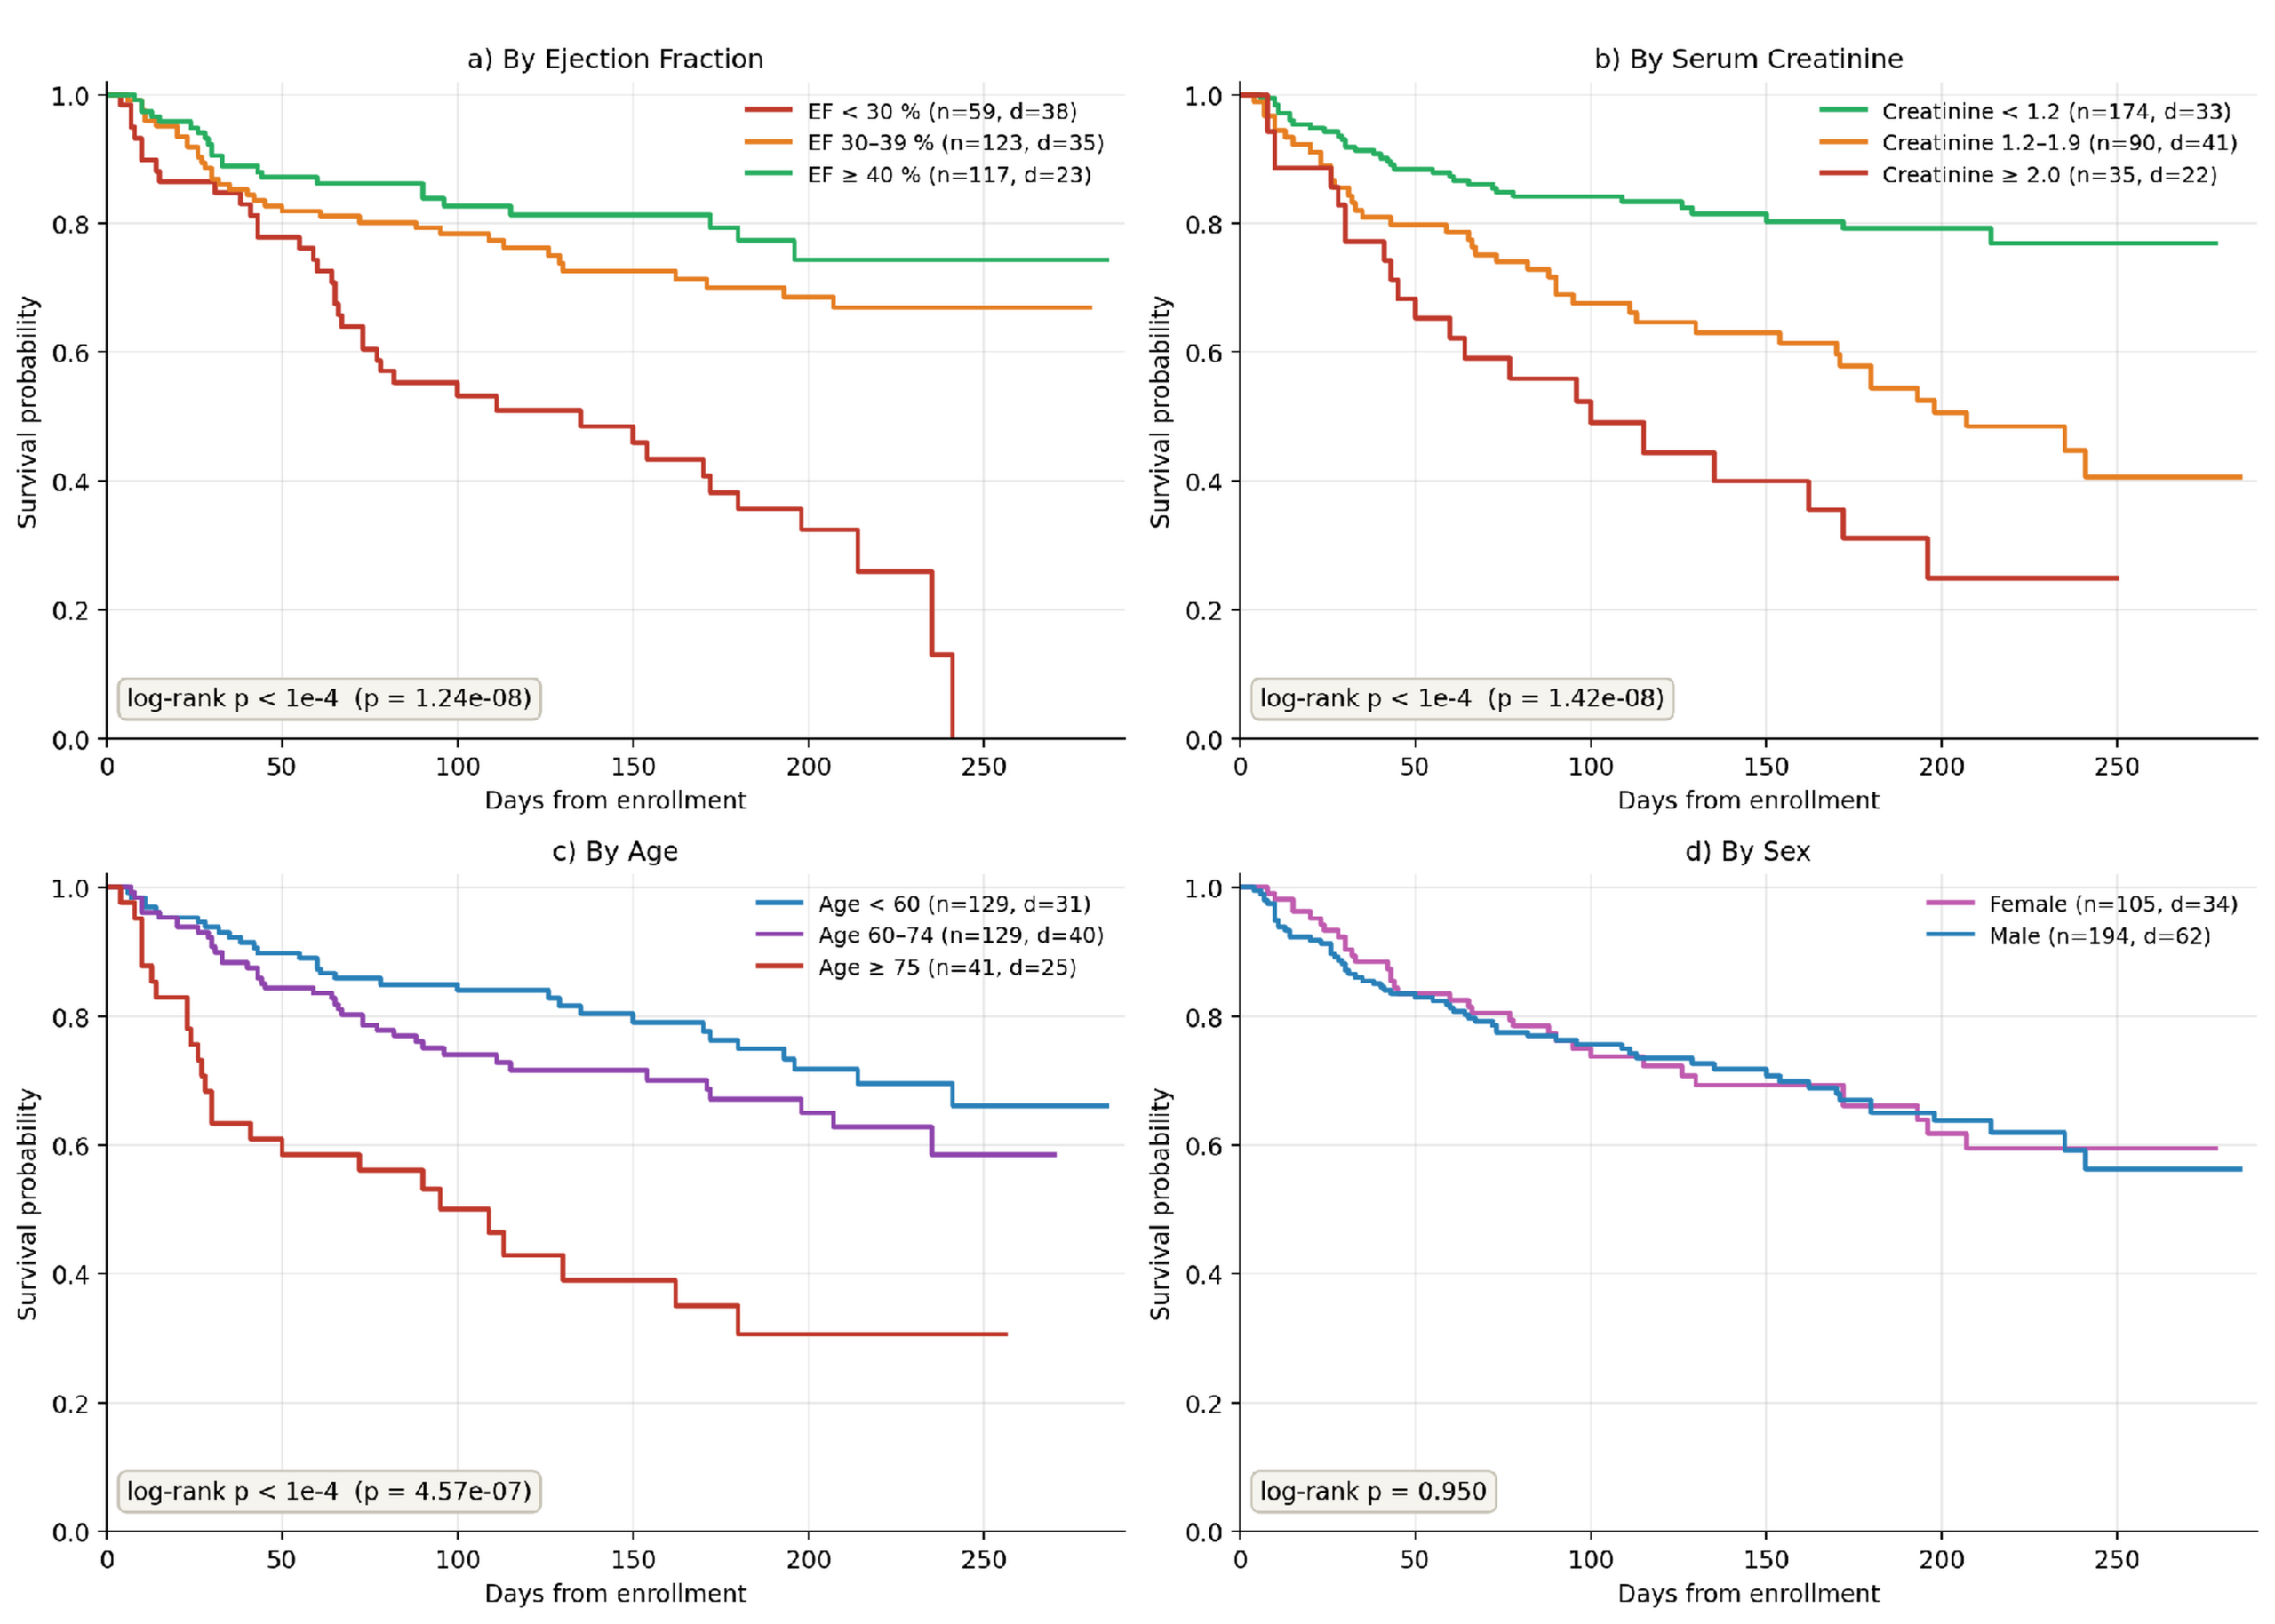
Stratified Kaplan–Meier Analysis. When patients were grouped by EF (<30%, 30–39%, ≥40%), serum creatinine (<1.2, 1.2–1.9, ≥2.0 mg/dL), or age (<60, 60–74, ≥75 years), survival rates showed strong, statistically significant differences across groups (p < 0.0001 for all three). In contrast, patient sex showed no significant relationship with survival (p = 0.95). Figure 12 displays these four comparison panels.
Cox Proportional-Hazards Model : Using all 11 baseline features, the Cox model reached Harrell’s C-index = 0.741. Six features were significant: older age, higher serum creatinine, higher CPK, hypertension, and anemia raised mortality risk, whereas higher EF was protective (44 % lower risk per SD). Sex, diabetes, platelets, sodium, and smoking were not significant. Figure 13 shows the hazard ratios as a forest plot.
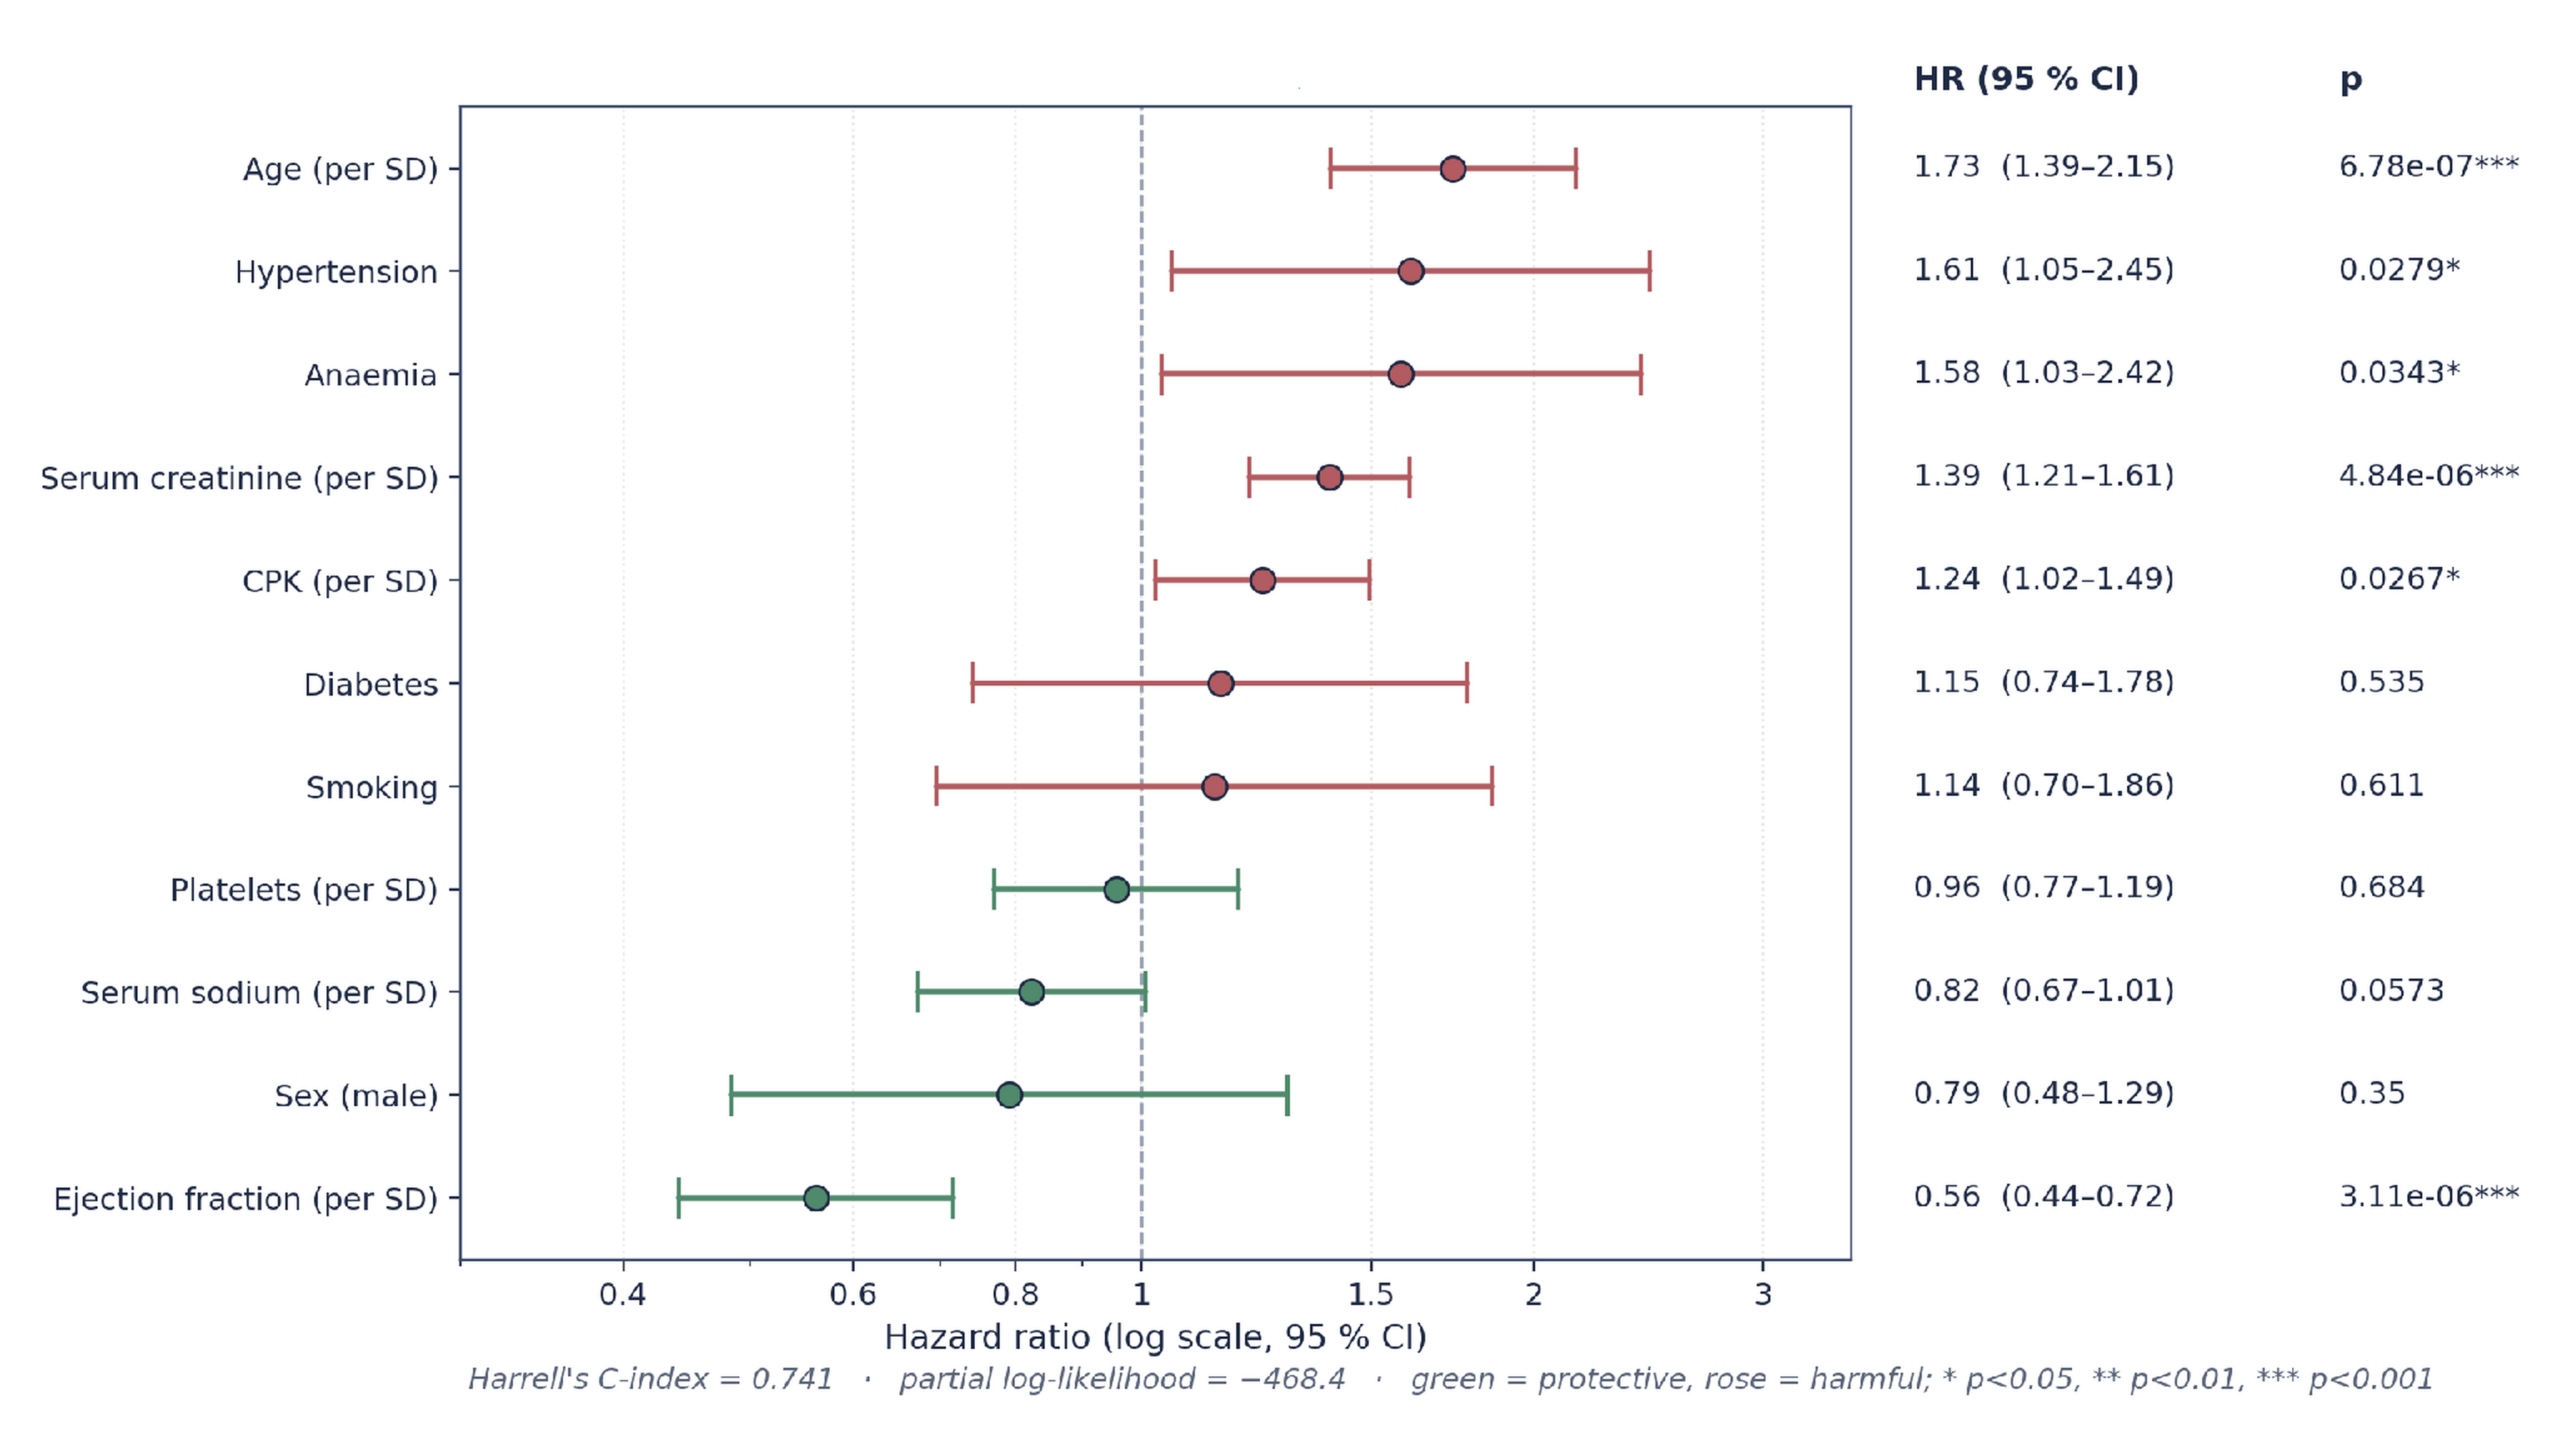
The classification models and survival analysis provide two complementary views of patient outcomes: classification predicts whether a patient will die, while survival analysis explains when and how that risk accumulates over time. Both highlight EF and serum creatinine as the top predictors. The Cox model (C-index 0.741) tracks Logistic Regression on the same 11 features (AUROC 0.752, Table 3); the strongest structured model overall, Random Forest, reaches AUROC 0.808.
Discussion
This study set out to test whether donor-matched modalities improve heart-failure mortality prediction across seven clinical data streams. Once multiplicity correction and donor-matching controls are applied, adding these surrogate modalities does not improve on the structured baseline on this small cohort — the study’s central, and cautionary, result. The following subsections discuss the study’s limitations, the clinical framing of the results, and directions for future work.
For context, established HF scores report broadly similar discrimination externally: MAGGIC c-statistics ≈ 0.70–0.74 for all-cause mortality; SHFM ≈ 0.68–0.76 for 1–3-year survival. The Cox model reaches C-index 0.741 and Random Forest reaches AUROC 0.808 on the same 90-patient slice — both using only 11 baseline covariates, without labs, NYHA class, or medications. Results are consistent with (not superior to) MAGGIC/SHFM; the multimodal ceiling here reflects donor matching (see Limitations), not an upper bound on what paired multimodal data could achieve.
Limitations
Several limitations apply. First, UCI is small (n = 299) and single-center; the 90-patient test slice yields wide CIs, so the echocardiography gain falls within the margin of error. Second, multimodal encoders could not be externally validated on Zigong, which lacks paired notes/ECG/imaging/vitals. Most importantly, the non-structured signals are not intrinsically paired with UCI patients — each inherits a real ECG, note, echocardiogram, CXR report, hospital sequence, and vitals trajectory from an age/sex-matched MIMIC-IV/PTB-XL/EchoNet donor. Demographic matching preserves realistic within-modality statistics but cannot recover within-patient cross-modal correlation, so the per-modality AUROCs (0.49–0.67) and the fact that five of six modalities reduce MCC when appended should be read as a ceiling on demographic-only matching at n = 299, not as evidence the modalities lack prognostic value. Full multimodal external validation is left to future work on larger paired datasets (UK Biobank, All of Us), and the survival analysis is descriptive — formal Cox assumptions and time-dependent metrics were not evaluated. Because no non-structured modality is a patient’s own record, establishing that any modality adds signal beyond the matching variables requires dedicated controls; these were run for all six donor-matched modalities and are reported in the Robustness Controls note and Table 6b, and no modality showed an advantage that persisted as an independent effect. All modality-level comparisons therefore remain exploratory, pending confirmation on natively paired data. Finally, although the six single-modality additions were corrected for multiple comparisons (Holm and Benjamini–Hochberg; no addition remained significant), the other configuration families evaluated (classical models, GNNs, standalone encoders, fusion strategies, and Zigong graph variants) were not jointly corrected, so at n_test = 90 some apparent differences among them may still reflect chance.
Conclusions
This paper presents a unified multimodal machine-learning framework for heart-failure mortality prediction, evaluated on the UCI cohort (n = 299), independently replicated on the Zigong cohort (n = 2,008), and paired with a companion survival analysis.
Three findings stand out. Using structured clinical features alone, Random Forest was the strongest model (AUROC 0.808). Echocardiography initially appeared to be the strongest single-modality addition, but robustness controls — prompted because echo donors were EF-matched and the encoder predicts EF — showed the apparent gain restates EF rather than adding independent signal and did not persist under a reproducible re-analysis; it is therefore reported as exploratory, and no addition or fusion strategy surpassed the structured baseline. On the independent Zigong cohort, retrained Logistic Regression, not Random Forest, was the strongest structured model (AUROC 0.810); a genuine transportability test — the UCI pipeline frozen and applied without refitting — retained modest discrimination (AUROC 0.66, 95% CI 0.58–0.74) but was badly miscalibrated because Zigong’s 6-month event rate is roughly tenfold lower, so off-the-shelf deployment would require recalibration. Overall, careful modality selection matters more than modality count for small cohorts; the study’s clearest contribution is methodological — quantifying how surrogate-modality augmentation and matched-encoder leakage can create multimodal gains that vanish under multiplicity correction, robustness checks, and honest transportability testing.
Data and Code Availability
All datasets used in this study are publicly available under their respective data-use agreements: the UCI Heart Failure Clinical Records dataset; PTB-XL, MIMIC-IV (Note/Hosp/OMR), MIMIC-CXR, and the Zigong Fourth People’s Hospital cohort through PhysioNet under credentialed access; and EchoNet-Dynamic through Stanford AIMI. No new patient data were collected. All code for the pipeline, modality encoders, fusion experiments, and survival analysis is available at https://github.com/pranav-ananth/research-projects/tree/main/MultiModalAIProject.
Acknowledgments
The author thanks the Inspirit AI Research Mentorship Program and mentors, Ronil and Sabrina, for their guidance. The author acknowledges the investigators who released the study data: PhysioNet (MIMIC-IV Note/Hosp/OMR, MIMIC-CXR, PTB-XL, and the Zigong Fourth People’s Hospital HF cohort), the UCI Machine Learning Repository (HF Clinical Records), and Stanford AIMI (EchoNet-Dynamic). All analyses used publicly available, de-identified data under the applicable DUAs; no direct funding supported this work.
References
- D. Chicco, G. Jurman. Machine learning can predict survival of patients with heart failure from serum creatinine and ejection fraction alone. BMC Medical Informatics and Decision Making. Vol. 20, pg. 16, 2020, https://doi.org/10.1186/s12911-020-1023-5. [↩] [↩] [↩] [↩]
- A. Y. Hannun, P. Rajpurkar, M. Haghpanahi, G. H. Tison, C. Bourn, M. P. Turakhia, A. Y. Ng. Cardiologist-level arrhythmia detection and classification in ambulatory electrocardiograms using a deep neural network. Nature Medicine. Vol. 25, pg. 65–69, 2019, https://doi.org/10.1038/s41591-018-0268-3. [↩]
- A. H. Ribeiro, M. H. Ribeiro, G. M. M. Paixao, D. M. Oliveira, P. R. Gomes, J. A. Canazart, M. P. S. Ferreira, C. R. Andersson, P. W. Macfarlane, W. Meira, T. B. Schon, A. L. P. Ribeiro. Automatic diagnosis of the 12-lead ECG using a deep neural network. Nature Communications. Vol. 11, pg. 1760, 2020, https://doi.org/10.1038/s41467-020-15432-4. [↩] [↩]
- Z. I. Attia, S. Kapa, F. Lopez-Jimenez, P. M. McKie, D. J. Ladewig, G. Satam, P. A. Pellikka, M. Enriquez-Sarano, P. A. Noseworthy, T. M. Munger, S. J. Asirvatham, C. G. Scott, R. E. Carter, P. A. Friedman. Screening for cardiac contractile dysfunction using an artificial intelligence-enabled electrocardiogram. Nature Medicine. Vol. 25, pg. 70–74, 2019, https://doi.org/10.1038/s41591-018-0240-2. [↩]
- D. Ouyang, B. He, A. Ghorbani, N. Yuan, J. Ebinger, C. P. Langlotz, P. A. Heidenreich, R. A. Harrington, D. H. Liang, E. A. Ashley, J. Y. Zou. Video-based AI for beat-to-beat assessment of cardiac function. Nature. Vol. 580, pg. 252–256, 2020, https://doi.org/10.1038/s41586-020-2145-8. [↩] [↩]
- E. Choi, M. T. Bahadori, A. Schuetz, W. F. Stewart, J. Sun. Doctor AI: predicting clinical events via recurrent neural networks. Machine Learning for Healthcare Conference (PMLR 56). pg. 301–318, 2016, https://proceedings.mlr.press/v56/choi16.html. [↩] [↩]
- A. Rajkomar, E. Oren, K. Chen, A. M. Dai, N. Hajaj, M. Hardt, P. J. Liu, X. Liu, J. Marcus, M. Sun, P. Sundberg, H. Yee, K. Zhang, Y. Zhang, G. Flores, G. E. Duggan, J. Irvine, Q. Le, K. Litsch, A. Mossin, J. Tansuwan, D. Wang, J. Wexler, J. Wilson, D. Ludwig, S. L. Volchenboum, K. Chou, M. Pearson, S. Madabushi, N. H. Shah, A. J. Butte, M. D. Howell, C. Cui, G. S. Corrado, J. Dean. Scalable and accurate deep learning with electronic health records. npj Digital Medicine. Vol. 1, pg. 18, 2018, https://doi.org/10.1038/s41746-018-0029-1. [↩]
- J. Devlin, M.-W. Chang, K. Lee, K. Toutanova. BERT: pre-training of deep bidirectional transformers for language understanding. Proceedings of NAACL-HLT. pg. 4171–4186, 2019, https://doi.org/10.18653/v1/N19-1423. [↩] [↩]
- E. Alsentzer, J. Murphy, W. Boag, W.-H. Weng, D. Jindi, T. Naumann, M. McDermott. Publicly available clinical BERT embeddings. Proceedings of the 2nd Clinical Natural Language Processing Workshop, NAACL. pg. 72–78, 2019, https://doi.org/10.18653/v1/W19-1909. [↩] [↩] [↩] [↩]
- Z. Xu, D. R. So, A. M. Dai. MUFASA: multimodal fusion architecture search for electronic health records. Proceedings of the AAAI Conference on Artificial Intelligence. Vol. 35, pg. 10532–10540, 2021, https://doi.org/10.1609/aaai.v35i12.17260. [↩]
- N. Hayat, K. J. Geras, F. E. Shamout. MedFuse: multi-modal fusion with clinical time-series data and chest X-ray images. Machine Learning for Healthcare Conference (PMLR 182). pg. 479–503, 2022, https://proceedings.mlr.press/v182/hayat22a.html. [↩]
- S.-C. Huang, A. Pareek, R. Zamanian, I. Banerjee, M. P. Lungren. Multimodal fusion with deep neural networks for leveraging CT imaging and electronic health record: a case-study in pulmonary embolism detection. Scientific Reports. Vol. 10, pg. 22147, 2020, https://doi.org/10.1038/s41598-020-78888-w. [↩]
- L. R. Soenksen, Y. Ma, C. Zeng, L. Boussioux, K. V. Carballo, L. Na, H. M. Wiberg, M. L. Li, I. Fuentes, D. Bertsimas. Integrated multimodal artificial intelligence framework for healthcare applications. npj Digital Medicine. Vol. 5, pg. 149, 2022, https://doi.org/10.1038/s41746-022-00689-4. [↩]
- S. Qiu, M. I. Miller, P. S. Joshi, J. C. Lee, C. Xue, Y. Ni, Y. Wang, I. D. Anda-Duran, P. H. Hwang, J. A. Cramer, B. C. Dwyer, H. Hao, M. C. Kaku, S. Kedar, P. H. Lee, A. Z. Mian, D. L. Murman, S. O’Shea, A. B. Paul, M.-H. Saint-Hilaire, E. A. Sartor, A. R. Saxena, L. C. Shih, J. E. Small, M. J. Smith, A. Swaminathan, C. E. Takahashi, O. Taraschenko, H. You, J. Yuan, Y. Zhou, S. Zhu, M. L. Alosco, J. Mez, T. D. Stein, K. L. Poston, R. Au, V. B. Kolachalama. Multimodal deep learning for Alzheimer’s disease dementia assessment. Nature Communications. Vol. 13, pg. 3404, 2022, https://doi.org/10.1038/s41467-022-31037-5. [↩]
- S. Angraal, B. J. Mortazavi, A. Gupta, R. Khera, T. Ahmad, N. R. Desai, D. L. Jacoby, F. A. Masoudi, J. A. Spertus, H. M. Krumholz. Machine learning prediction of mortality and hospitalization in heart failure with preserved ejection fraction. JACC: Heart Failure. Vol. 8, pg. 12–21, 2020, https://doi.org/10.1016/j.jchf.2019.06.013. [↩]
- E. D. Adler, A. A. Voors, L. Klein, F. Macheret, O. O. Braun, M. A. Urey, W. Zhu, I. Sama, M. Tadel, C. Campagnari, B. Greenberg, A. Yagil. Improving risk prediction in heart failure using machine learning. European Journal of Heart Failure. Vol. 22, pg. 139–147, 2020, https://doi.org/10.1002/ejhf.1628. [↩]
- M. W. Segar, M. Vaduganathan, K. V. Patel, D. K. McGuire, J. Butler, G. C. Fonarow, M. Basit, V. Kannan, J. L. Grodin, B. Everett, D. Willett, J. Berry, A. Pandey. Machine learning to predict the risk of incident heart failure hospitalization among patients with diabetes: the WATCH-DM risk score. Diabetes Care. Vol. 42, pg. 2298–2306, 2019, https://doi.org/10.2337/dc19-0587. [↩]
- T. N. Kipf, M. Welling. Semi-supervised classification with graph convolutional networks. International Conference on Learning Representations (ICLR). 2017, https://arxiv.org/abs/1609.02907. [↩]
- P. Velickovic, G. Cucurull, A. Casanova, A. Romero, P. Lio, Y. Bengio. Graph attention networks. International Conference on Learning Representations (ICLR). 2018, https://arxiv.org/abs/1710.10903. [↩]
- Z. Zhang, L. Cao, Y. Zhao, Z. Xu, R. Chen, L. Lv, P. Xu. Hospitalized patients with heart failure: integrating electronic healthcare records and external outcome data. PhysioNet (v1.3). 2021, https://doi.org/10.13026/5m60-vs44. [↩] [↩]
- J.-M. Kwon, K.-H. Kim, K.-H. Jeon, S. E. Lee, H.-Y. Lee, H.-J. Cho, J. O. Choi, E.-S. Jeon, M.-S. Kim, J.-J. Kim, K.-K. Hwang, S. C. Chae, S. H. Baek, S.-M. Kang, D.-J. Choi, B.-S. Yoo, K. H. Kim, H.-Y. Park, M.-C. Cho, B.-H. Oh. Artificial intelligence algorithm for predicting mortality of patients with acute heart failure. PLOS ONE. Vol. 14, pg. e0219302, 2019, https://doi.org/10.1371/journal.pone.0219302. [↩]
- S. König, V. Pellissier, S. Hohenstein, A. Bernal, L. Ueberham, A. Meier-Hellmann, R. Kuhlen, G. Hindricks, A. Bollmann. Machine learning algorithms for claims data-based prediction of in-hospital mortality in patients with heart failure. ESC Heart Failure. Vol. 8, pg. 3026–3036, 2021, https://doi.org/10.1002/ehf2.13398. [↩]
- S. E. Awan, M. Bennamoun, F. Sohel, F. M. Sanfilippo, G. Dwivedi. Machine learning-based prediction of heart failure readmission or death: implications of choosing the right model and the right metrics. ESC Heart Failure. Vol. 6, pg. 428–435, 2019, https://doi.org/10.1002/ehf2.12419. [↩]
- M. W. Segar, B. C. Jaeger, K. V. Patel, V. Nambi, C. E. Ndumele, A. Correa, J. Butler, A. Chandra, C. Ayers, S. Rao, A. A. Lewis, L. M. Raffield, C. J. Rodriguez, E. D. Michos, C. M. Ballantyne, M. E. Hall, R. J. Mentz, J. A. de Lemos, A. Pandey. Development and validation of machine learning–based race-specific models to predict 10-year risk of heart failure: a multicohort analysis. Circulation. Vol. 143, pg. 2370–2383, 2021, https://doi.org/10.1161/circulationaha.120.053134. [↩]
- X. Yao, D. R. Rushlow, J. W. Inselman, R. G. McCoy, T. D. Thacher, E. M. Behnken, M. E. Bernard, S. L. Rosas, A. Akfaly, A. Misra, P. E. Molling, J. S. Krien, R. M. Foss, B. A. Barry, K. C. Siontis, S. Kapa, P. A. Pellikka, F. Lopez-Jimenez, Z. I. Attia, N. D. Shah, P. A. Friedman, P. A. Noseworthy. Artificial intelligence–enabled electrocardiograms for identification of patients with low ejection fraction: a pragmatic, randomized clinical trial. Nature Medicine. Vol. 27, pg. 815–819, 2021, https://doi.org/10.1038/s41591-021-01335-4. [↩]
- D. Adedinsewo, R. E. Carter, Z. Attia, P. Johnson, A. H. Kashou, J. L. Dugan, M. Albus, J. M. Sheele, F. Bellolio, P. A. Friedman, F. Lopez-Jimenez, P. A. Noseworthy. Artificial intelligence-enabled ECG algorithm to identify patients with left ventricular systolic dysfunction presenting to the emergency department with dyspnea. Circulation: Arrhythmia and Electrophysiology. Vol. 13, pg. e008437, 2020, https://doi.org/10.1161/CIRCEP.120.008437. [↩]
- N. Kagiyama, M. Piccirilli, N. Yanamala, S. Shrestha, P. D. Farjo, G. Casaclang-Verzosa, W. M. Tarhuni, N. Nezarat, M. J. Budoff, J. Narula, P. P. Sengupta. Machine learning assessment of left ventricular diastolic function based on electrocardiographic features. Journal of the American College of Cardiology. Vol. 76, pg. 930–941, 2020, https://doi.org/10.1016/j.jacc.2020.06.061. [↩]
- O. Akbilgic, L. Butler, I. Karabayir, P. P. Chang, D. W. Kitzman, A. Alonso, L. Y. Chen, E. Z. Soliman. ECG-AI: electrocardiographic artificial intelligence model for prediction of heart failure. European Heart Journal – Digital Health. Vol. 2, pg. 626–634, 2021, https://doi.org/10.1093/ehjdh/ztab080. [↩]
- J. P. Howard, N. Vasudevan, S. Sarkar, S. Landman, J. Koehler, D. Keene. Dynamic risk stratification of worsening heart failure using a deep learning-enabled implanted ambulatory single-lead electrocardiogram. European Heart Journal – Digital Health. Vol. 5, pg. 435–443, 2024, https://doi.org/10.1093/ehjdh/ztae035. [↩]
- S. Chowdhury, Y. Chen, P. Li, S. Rajaganapathy, A. Wen, X. Ma, Q. Dai, Y. Yu, S. Fu, X. Jiang, Z. He, S. Sohn, X. Liu, S. J. Bielinski, A. M. Chamberlain, J. R. Cerhan, N. Zong. Stratifying heart failure patients with graph neural network and transformer using Electronic Health Records to optimize drug response prediction. Journal of the American Medical Informatics Association. Vol. 31, pg. 1671–1681, 2024, https://doi.org/10.1093/jamia/ocae137. [↩]
- Y. C. Lee, J. Cha, I. Shim, W.-Y. Park, S. W. Kang, D. H. Lim, H.-H. Won. Multimodal deep learning of fundus abnormalities and traditional risk factors for cardiovascular risk prediction. npj Digital Medicine. Vol. 6, pg. 14, 2023, https://doi.org/10.1038/s41746-023-00748-4. [↩]
- C. Wang, X. Yang, M. Sun, Y. Gu, J. Niu, W. Zhang. Multimodal fusion network for ICU patient outcome prediction. Neural Networks. Vol. 180, pg. 106672, 2024, https://doi.org/10.1016/j.neunet.2024.106672. [↩]
- Heart failure clinical records [Dataset]. UCI Machine Learning Repository. 2020, https://doi.org/10.24432/C5Z89R. [↩]
- A. Johnson, T. Pollard, S. Horng, L. A. Celi, R. Mark. MIMIC-IV-Note: deidentified free-text clinical notes (v2.2). PhysioNet. 2023, https://doi.org/10.13026/1n74-ne17. [↩] [↩]
- P. Wagner, N. Strodthoff, R.-D. Bousseljot, D. Kreiseler, F. I. Lunze, W. Samek, T. Schaeffter. PTB-XL, a large publicly available electrocardiography dataset. Scientific Data. Vol. 7, pg. 154, 2020, https://doi.org/10.1038/s41597-020-0495-6. [↩] [↩]
- R. M. Lang, L. P. Badano, V. Mor-Avi, J. Afilalo, A. Armstrong, L. Ernande, F. A. Flachskampf, E. Foster, S. A. Goldstein, T. Kuznetsova, P. Lancellotti, D. Muraru, M. H. Picard, E. R. Rietzschel, L. Rudski, K. T. Spencer, W. Tsang, J.-U. Voigt. Recommendations for cardiac chamber quantification by echocardiography in adults: an update from the American Society of Echocardiography and the European Association of Cardiovascular Imaging. Journal of the American Society of Echocardiography. Vol. 28, pg. 1–39.e14, 2015, https://doi.org/10.1016/j.echo.2014.10.003. [↩]
- S. F. Nagueh, O. A. Smiseth, C. P. Appleton, B. F. Byrd, H. Dokainish, T. Edvardsen, F. A. Flachskampf, T. C. Gillebert, A. L. Klein, P. Lancellotti, P. Marino, J. K. Oh, B. A. Popescu, A. D. Waggoner. Recommendations for the evaluation of left ventricular diastolic function by echocardiography: an update from the American Society of Echocardiography and the European Association of Cardiovascular Imaging. Journal of the American Society of Echocardiography. Vol. 29, pg. 277–314, 2016, https://doi.org/10.1016/j.echo.2016.01.011. [↩]
- A. E. W. Johnson, L. Bulgarelli, L. Shen, A. Gayles, A. Shammout, S. Horng, T. J. Pollard, S. Hao, B. Moody, B. Gow, L.-W. H. Lehman, L. A. Celi, R. G. Mark. MIMIC-IV, a freely accessible electronic health record dataset. Scientific Data. Vol. 10, pg. 1, 2023, https://doi.org/10.1038/s41597-022-01899-x. [↩] [↩] [↩]
- A. E. W. Johnson, T. J. Pollard, S. J. Berkowitz, N. R. Greenbaum, M. P. Lungren, C.-Y. Deng, R. G. Mark, S. Horng. MIMIC-CXR, a de-identified publicly available database of chest radiographs with free-text reports. Scientific Data. Vol. 6, pg. 317, 2019, https://doi.org/10.1038/s41597-019-0322-0. [↩]
- T. Chen, C. Guestrin. XGBoost: a scalable tree boosting system. Proceedings of the 22nd ACM SIGKDD International Conference on Knowledge Discovery and Data Mining. pg. 785–794, 2016, https://doi.org/10.1145/2939672.2939785. [↩]
- G. Ke, Q. Meng, T. Finley, T. Wang, W. Chen, W. Ma, Q. Ye, T.-Y. Liu. LightGBM: a highly efficient gradient boosting decision tree. Advances in Neural Information Processing Systems 30. pg. 3146–3154, 2017, https://proceedings.neurips.cc/paper/2017/hash/6449f44a102fde848669bdd9eb6b76fa-Abstract.html. [↩]
- Y. Shi, Z. Huang, S. Feng, H. Zhong, W. Wang, Y. Sun. Masked label prediction: unified message passing model for semi-supervised classification. arXiv preprint. 2020, https://arxiv.org/abs/2009.03509. [↩]
- W. L. Hamilton, R. Ying, J. Leskovec. Inductive representation learning on large graphs. Advances in Neural Information Processing Systems 30. pg. 1024–1034, 2017, https://arxiv.org/abs/1706.02216. [↩]
- A. Vaswani, N. Shazeer, N. Parmar, J. Uszkoreit, L. Jones, A. N. Gomez, L. Kaiser, I. Polosukhin. Attention is all you need. Advances in Neural Information Processing Systems 30. pg. 5998–6008, 2017, https://arxiv.org/abs/1706.03762. [↩]
- M. Fey, J. E. Lenssen. Fast graph representation learning with PyTorch Geometric. ICLR Workshop on Representation Learning on Graphs and Manifolds. 2019, https://arxiv.org/abs/1903.02428. [↩]
- T. Ahmad, A. Munir, S. H. Bhatti, M. Aftab, M. A. Raza. Survival analysis of heart failure patients: a case study. PLOS ONE. Vol. 12, pg. e0181001, 2017, https://doi.org/10.1371/journal.pone.0181001. [↩]