
Abstract
Gerrymandering—the strategic manipulation of electoral district boundaries to shape political outcomes—is often studied at the congressional or state level. Yet in large, diverse cities like New York City (NYC), municipal boundaries can be equally consequential because City Council districts structure representation for everyday governance, including housing, language access, zoning, and local public services. This paper examines Flushing, Queens, a major Chinese-American community hub, to assess how city-level redistricting relates to perceived political representation. Using a mixed-methods design, we combine NYC Districting Commission demographic tables from the enacted 2022 City Council plan, publicly available district lookup and map comparison tools, an original survey (N = 77; October 30, 2025), and three semi-structured resident interviews. District-level data show that City Council District 20—closely associated with Flushing’s Chinese-American core—is Asian-majority by voting-age population, while nearby districts have substantially lower Asian shares. We describe this pattern and note its resemblance to the “packing” (concentration) and “cracking” (fragmentation) dynamics discussed in the redistricting literature, but we do not claim the enacted plan constitutes either: establishing intentional manipulation would require counterfactual map comparisons and block-level respondent-district linkage beyond the scope of this study. Survey findings reveal low perceived representation: only 22.1% report feeling represented, and 66.2% are unfamiliar with the term “gerrymandering.” Interviews suggest that residents often recognize boundary effects without technical vocabulary. We argue that municipal redistricting should be evaluated not only as electoral engineering but also as civic legibility: whether residents can understand districts, access services, and perceive government responsiveness.
Keywords: gerrymandering; municipal redistricting; electoral geography; Chinese-American community; civic legibility
Introduction
Electoral district boundaries may look like technical lines on a map, but they function as political infrastructure: they determine who votes together, which communities are kept intact, and whose voices become decisive in elections. Gerrymandering is commonly defined as drawing district lines to generate systematic partisan or racial advantage1,2. Two core tactics are “cracking,” which disperses a targeted group across multiple districts so it rarely forms a decisive bloc, and “packing,” which concentrates the group into fewer districts than it would otherwise occupy, limiting its influence elsewhere3. With modern data and mapping tools, these strategies can operate even without extremely irregular shapes2. New York City is a particularly important setting for studying these dynamics because districting takes place amid extreme density, extraordinary ethnic diversity, and complex neighborhood identities. Queens alone is immigrant-rich and linguistically diverse: 47.6% of residents are foreign-born and 55.2% speak a language other than English at home4. This matters because representation is not experienced only through election outcomes, but through residents’ everyday ability to access government information, communicate with elected officials, and benefit from public programs. This paper advances a central argument: in immigrant communities, municipal redistricting should be evaluated not only as electoral engineering—who wins which district—but as a question of civic legibility, the set of informational, linguistic, and institutional conditions that determine whether residents can interpret district lines, access public services, and perceive government as responsive. Civic legibility comprises four dimensions: (i) information availability (public tools, plan documents, hearing notices), (ii) language access (whether those materials and interactions reach limited-English-proficiency residents), (iii) institutional access (whether district boundaries align with community-of-interest networks that residents use to navigate government), and (iv) policy visibility (whether community-relevant policies are recognizable as targeted benefits). Unlike political representation (who holds office and whether they share group identity), responsiveness (whether officials act on constituent preferences), or political efficacy (the individual’s belief that participation matters), civic legibility foregrounds the information infrastructure through which district maps become actionable for everyday civic life. Using Flushing, Queens as a case, we show that descriptive patterns of Asian voter concentration in one district and comparatively lower shares in adjacent districts interact with language barriers and low policy visibility to produce weak feelings of representation even among residents who vote regularly and know their own district. The paper’s contribution is therefore both empirical (documenting this gap in a major Chinese-American community) and conceptual (introducing civic legibility as an analytical lens for evaluating municipal redistricting).
This paper focuses on Flushing, Queens, widely recognized as a hub of Chinese-American settlement, commerce, and community institutions. The city-level stakes are high because the New York City Council—the city’s 51-member legislative body, with each district representing roughly 160,000 residents—negotiates and oversees the city budget and plays a central role in land use and zoning, shaping development, housing affordability, and neighborhood change. For immigrant communities, Council offices are also key gateways for constituent services and links to agencies, programs, and translation resources5. Because New York’s redistricting debates often emphasize congressional or state maps, city-level districting can be underappreciated. Yet institutional differences clarify why municipal boundaries deserve independent attention. The State Assembly has 150 seats and the State Senate has 63 seats; members of both chambers serve two-year terms. District scale reinforces this distinction: using New York’s 2020 population (roughly 20.2 million), the average Assembly district contains about 135,000 residents and the average Senate district about 321,000. These rough averages help explain why City Council boundaries often feel more directly local and why small municipal boundary changes can reshape neighborhood accountability.
This study is motivated by a straightforward puzzle: why do many residents in a politically active community still report weak feelings of representation? Advocacy organizations argue that dividing cohesive neighborhoods across multiple districts can dilute Asian and immigrant electoral opportunity and weaken accountability6. We therefore ask:
- What do published district demographic tables suggest about the concentration and fragmentation of Asian voting-age populations around Flushing under the enacted City Council plan?
- How do residents perceive representation, and what do they know about gerrymandering and district structures?
- Which factors—voting participation, gerrymandering familiarity, district knowledge, or awareness of race-connected supportive policies—relate most strongly to perceived representation?
- How do resident interviews help interpret quantitative patterns, especially around language access and perceived voting power?
Literature Review
Defining and evaluating gerrymandering: classic mechanisms and modern metrics
Gerrymandering is often described as a conflict between democratic ideals and political incentives: when line-drawers can choose district boundaries, they may choose boundaries that protect incumbents or advantage a party. Vickrey (1961) offered an early, influential argument that map-drawing should be removed from self-interested actors and made more procedural, mechanical, or impersonal to reduce manipulation. Later work clarified that boundary manipulation can operate even when districts look “normal,” because what matters is the distribution of voters and the conversion of votes into seats2.
A major development in modern literature is the creation of quantitative measures that make gerrymandering arguments testable. Stephanopoulos and McGhee (2015) propose the “efficiency gap,” a partisan symmetry measure defined as the difference in each party’s wasted votes divided by total votes. Wasted votes include votes cast for losing candidates and votes cast beyond what a winning candidate needed. The efficiency gap provides a single statistic that summarizes how packing and cracking translate into seat advantage. More broadly, Gelman and King (1994)7 argue that redistricting interacts with electoral responsiveness and partisan bias: redistricting can increase responsiveness in some contexts, but it can also increase bias when political actors manipulate lines. These works show that “fairness” cannot be judged only from district shapes or from single election outcomes; it requires systematic evaluation of how the map structures competition and representation.
At the local level, partisan measures can be less straightforward because city elections may be less partisan, may use ranked-choice voting, and may be shaped by coalitions rather than two-party competition. This makes community integrity and minority electoral opportunity especially salient fairness criteria. The New York City Districting Commission publishes compactness measures—such as Polsby–Popper and Reock scores—because geometric irregularity can be a signal of manipulation or of attempts to connect communities8. But the literature also warns against overreliance on compactness alone: a compact district can still crack or pack voters if it is carefully positioned3. As a result, scholars increasingly recommend combining multiple evaluation lenses: demographic composition, community-of-interest integrity, compactness, and electoral outcomes when appropriate.
Beyond descriptive metrics, a growing computational literature uses Markov-chain ensemble methods (e.g., ReCom9 ) to test whether an enacted plan is a statistical outlier relative to legally valid alternatives. This paper does not conduct such an audit; we flag ensemble analysis as a priority for future work (see Conclusion).
Finally, scholarship has emphasized that gerrymandering is not only partisan; it also intersects with race and minority representation. Keena, Latner, McGann, and Smith (2019)10 provide a typology of gerrymandering techniques (including packing and cracking) and argue that institutional design—especially who draws lines and what criteria are enforced—strongly influences the prevalence of manipulation. This institutional emphasis is particularly relevant to New York, where reform efforts have aimed to limit partisan control but have faced major implementation challenges.
Minority representation, language access, and information barriers in urban governance
Legal and political debates about districting are deeply shaped by minority representation and civil rights doctrine. Under Section 2 of the Voting Rights Act, minority vote dilution claims are typically evaluated under the “totality of circumstances,” guided by the Gingles preconditions established in Thornburg v. Gingles (1986)11. The legal landscape has changed since Shelby County v. Holder (2013)12, which effectively neutralized the preclearance system by striking down the coverage formula, removing the requirement that previously covered jurisdictions obtain preclearance under Section 5 unless covered by separate court orders. In practice, this has heightened attention to Section 2 litigation and to local rules (such as city charters) that may provide additional protections.
Beyond legal doctrine, a substantial body of scholarship on Asian American politics documents the distinctive dynamics of immigrant political incorporation. Wong, Ramakrishnan, Lee, and Junn (2011) show that Asian Americans exhibit lower rates of party identification, political efficacy, and turnout than comparable non-Asian groups, and that these gaps reflect in part the newness of many Asian American communities and the relative thinness of co-ethnic mobilizing institutions rather than disengagement per se13. Masuoka and Junn (2013) emphasize that Asian American political identity is shaped by generational status, national origin, and local context rather than a single pan-ethnic orientation14. This heterogeneity matters for municipal redistricting: a “community of interest” claim about “Asian Flushing” aggregates Chinese, Korean, South Asian, and other subgroups whose civic networks, languages, and policy priorities are not identical. At the same time, the concentration of first- and second-generation Chinese-American residents in Flushing produces an unusually dense local civic infrastructure—community-based organizations, ethnic media, and mutual-aid networks—that shapes how district lines are interpreted and whether supportive policies are felt as reachable15.
Scholarship linking minority representation to perceived efficacy further clarifies why boundary-level concentration may not translate into felt representation. Bobo and Gilliam (1990) show that Black political empowerment—operationalized as descriptive representation in local office—raises perceived efficacy and participation16; Pantoja and Segura (2003) report analogous effects for Latino voters with co-ethnic representatives17. For Asian American residents, however, descriptive representation at the City Council level is recent and uneven, and the relationship between having a co-ethnic representative and feeling represented may depend heavily on in-language outreach, constituent-service capacity, and policy visibility. The Flushing case thus provides a useful site for examining whether—and through what informational conditions—the empowerment mechanism documented in the Black and Latino politics literatures operates in an immigrant Asian American context.
Beyond elections, urban representation is also administrative and informational. Residents experience government through services, agencies, and the ability to communicate with officials. Council district offices in NYC track and address issues ranging from affordable housing concerns to street conditions, and constituent-service capacity has been shown in other settings to shape who obtains effective access to government5. In immigrant neighborhoods, this service dimension interacts with language access and community organizations. Queens County’s high rates of foreign-born residents and non-English home languages suggest that language-access capacity can be an important determinant of whether policies feel real and reachable4. Recent research also highlights how unequal information flows can distort civic outcomes—an idea that resonates strongly with immigrant civic experiences. Stewart et al. (2019) define “information gerrymandering” as the distortion of collective decisions caused by biased patterns of information exposure within a network, even when groups are numerically balanced. Their work is not about geographic districts, but the analogy is useful: if civic information about districts, hearings, or supportive policies reaches some networks and not others, then democratic participation can become systematically unequal. NYC provides multiple public tools for district lookup and map access, but the existence of tools does not ensure that information reaches residents equitably, especially across language barriers.
NYC’s recent redistricting controversies illustrate these issues. Advocacy organizations have argued that dividing immigrant communities across multiple districts weakens effective representation and violates or undermines protections intended to preserve racial and language-minority electoral opportunity6. Commentary on New York’s state-level redistricting has also emphasized procedural breakdowns and institutional incentives that can erode trust and legitimacy. This paper builds on these literatures by linking district composition around a community of interest (Flushing) to resident perceptions and policy visibility, treating information accessibility as part of representation rather than a secondary outreach concern.
Data and Methodology
This study uses a mixed-methods design combining public districting data and civic mapping tools with an original survey and semi-structured interviews.
The goal is not to establish intentional manipulation—an evidentiary standard that requires internal records, counterfactual comparisons against alternative legally valid plans, and block- or tract-level respondent-district linkage, all of which are beyond the scope of this study. Instead, we pursue three more modest aims: (1) to describe publicly reported district-composition patterns around Flushing under the enacted 2022 plan; (2) to document how residents in a major Chinese-American community experience representation, district awareness, and civic information; and (3) to develop and illustrate civic legibility as an analytical lens that future empirical work can test more rigorously. Accordingly, we use the terms “packing,” “cracking,” and “dilution” only in their theoretical sense, as framing devices drawn from the redistricting literature; we do not claim the enacted plan constitutes any of these, and the “snake-tail corridor” we describe in District 24 should be read as a descriptive visual observation rather than as evidence of gerrymandering.
District-Level Data and Mapping Context
The district-composition analysis relies on the New York City Districting Commission’s Final Plan materials (October 2022), especially the published “Final Plan vs. 2013 Lines” demographic table. This table reports 2020 voting-age population (VAP) totals and VAP shares by race/ethnicity (Latino, Asian, Black, and “Other”) for each City Council district, along with the citywide average district population of 172,822 used for population-equality balancing8. In this paper, we focus on Queens districts that contain Flushing and adjacent neighborhoods, particularly District 20 (the Flushing core) and District 24 (a central Queens district whose boundaries overlap some Flushing-adjacent areas).
To contextualize boundary accessibility and the “information environment” through which residents learn district lines, we reference commonly used public-facing tools: the NYC Board of Elections district-map repository, the NYC Council’s address-based district lookup, and the interactive “Redistricting & You” portals for NYC and New York State that allow users to compare the 2013–2023 and 2023–2033 Council plans. These tools are treated as part of the civic infrastructure that shapes whether district boundaries are legible and actionable for residents.
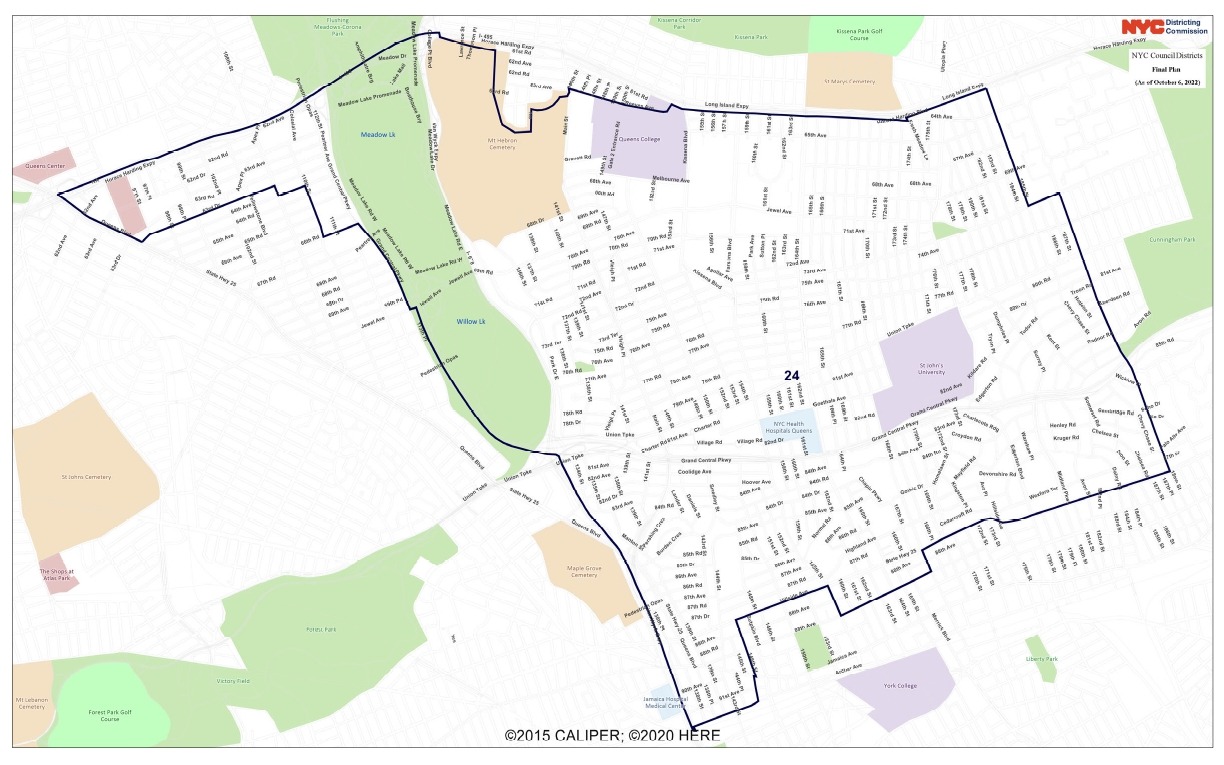
Park, which connects otherwise spatially distinct residential areas and illustrates what we describe in the text as a “snake-tail” boundary. Large parks and highways commonly function as social boundaries that separate school zones, shopping corridors, and language-service networks; corridor-like extensions that span such features remain legally contiguous but can cut across community-of-interest geography. We present this feature as a descriptive observation rather than as evidence of intentional manipulation (see Methods and Limitations). Source: NYC Districting Commission (2022)8.
The paper also draws on public information about the institutional role of the City Council—its participation in the city’s budget process (negotiation, review, modification, and oversight of revenues and expenditures, plus setting property tax rates) and its role in the city’s land use review process—and the comparative structure of the State Assembly (150 seats) and the State Senate (63 seats), to clarify why municipal boundaries have distinct implications for everyday governance.
Survey Design and Quantitative Analysis
The quantitative component uses an original survey (N = 77) collected on October 30, 2025. The survey includes demographic items (race, age range, ZIP code) and core civic knowledge and perception measures:
- Perceived representation: “Do you feel represented in the current government?” (Yes / Slightly / No)
- Gerrymandering familiarity: “Are you familiar with the term ‘gerrymandering’?” (Yes / No)
- Voting engagement: “Are you an active voter?” (Yes / No)
- District knowledge: “Do you know what city district you are a part of?” (Yes / No)
- Policy awareness: “Are you aware of any policies that are connected to helping your race [language programs, public support, funding]?” (Yes / Slightly aware / No)
The survey also included an open-ended prompt about perceptions of gerrymandering and redistricting. Because distribution occurred through community-linked networks, the sample should be interpreted as a convenience sample rather than a probability sample. Probability-based recruitment in Flushing’s linguistically diverse population would have required in-language sampling frames and CBO-partnered fielding infrastructure that were not available within the project’s scope; we return to recruitment methodology as a dedicated future research pathway in the Conclusion.
The study uses a non-standard three-category response format (Yes / Slightly / No for representation and policy awareness; Yes / No for dichotomous items) rather than a five- or seven-point Likert scale, for three reasons that reflect the exploratory, community-embedded nature of the project. First, the research aim is descriptive rather than scale-validation: we sought to detect broad patterns in perceived representation and civic knowledge in a community that has been under-surveyed in existing scholarship, not to establish psychometric properties of a representation construct. Second, response-format research in survey methodology has shown that simpler categorical formats can reduce cognitive burden and improve response quality among respondents with limited proficiency in the survey language or limited familiarity with Likert conventions18; given that Flushing’s target respondents include older Chinese-speaking residents and recent immigrants, a three-category format was selected to prioritize comprehension over granularity. Third, the middle category “Slightly” preserves the ordinal structure necessary for Spearman correlation and ordinal cross-tabulation, while avoiding the artificial precision of a five-point scale for single-item measures. We acknowledge that this choice limits comparability with established political-efficacy indices (e.g., ANES efficacy items) and precludes multi-item reliability estimates such as Cronbach’s α. Future research should administer validated multilingual Likert items (translated and cognitively tested) alongside the present instrument to assess convergent validity; we flag this as a methodological limitation in the Conclusion.
We report descriptive statistics and cross-tabulations. For associations between categorical variables, we use chi-square tests of independence and report Cramér’s V as an effect size. For ordered categories (e.g., No → Slightly → Yes), we compute Spearman’s rank correlation as a descriptive summary. Analyses were performed on the survey dataset as collected, with listwise deletion for missing values (minimal).
Semi-Structured Interviews
The qualitative component consists of three semi-structured interviews with residents connected to Flushing and Queens civic life. Interviews asked about familiarity with gerrymandering, whether district lines affect local elections, experiences of being heard by representatives, language-access barriers, and perceived effects of boundary changes on turnout and public resources.
Participants were recruited through purposive sampling from community-linked networks in Flushing, with selection criteria designed to capture variation along three dimensions relevant to the research questions: (1) length of residence in Flushing or adjacent Queens neighborhoods (minimum two years, to ensure familiarity with local civic life); (2) age range (to reflect generational differences in English proficiency and civic engagement, spanning 30s through 60s); and (3) differing levels of involvement with community institutions (from routine residents to those engaged with local organizations). Given the small sample, interviews are used as illustrative evidence to interpret and contextualize survey patterns rather than as a systematic qualitative dataset; this limitation is discussed in the Conclusion.
Interviews were conducted in a mix of English and Mandarin according to participant preference, audio-recorded with consent, transcribed, and (where applicable) translated into English for analysis. Transcripts were analyzed using thematic analysis with inductive open coding19: a first pass generated descriptive codes close to the text (e.g., “language barrier for elderly,” “community-level vs. individual voice,” “visible clustering without vocabulary”); a second pass grouped codes into higher-order themes aligned with the survey constructs (perceived representation, gerrymandering awareness, policy visibility, language access). The three themes reported in the Results section—collective vs. individual efficacy, pattern recognition without technical vocabulary, and language-access barriers to policy visibility—emerged from this process.
Interviews were conducted with consent and anonymized; quotations are labeled as Interview 1–3 with broad descriptors where provided. Interview evidence is integrated directly into the Results section to support or complicate specific empirical claims rather than presented as a standalone list. Survey responses were collected without publishing identifying information. Interview participants were informed that participation was voluntary and that their identities would not be disclosed. Because the project concerns political perceptions in immigrant communities, privacy protection was treated as essential.
This study was conducted as student research under institutional guidelines for minimal-risk human subjects work. All participants gave verbal informed consent, no identifying information was recorded, and participation was fully voluntary. Because the project involved anonymous adult participants responding to non-sensitive civic questions, it fell within standard exempt-category practice for educational research; documentation of voluntary consent was treated as the primary ethical safeguard.
Results
This section reports two sets of findings. Section ”District patterns and CD24’s “snake-tail” boundary corridor” summarizes district-level patterns around Flushing and highlights a salient boundary feature in City Council District 24 (CD24) that residents interpret as a corridor-like “snake-tail” connector. Section “Perceived representation and a “policy visibility” mechanism” then presents survey and interview evidence on perceived representation and evaluates whether an informational “policy visibility” mechanism helps explain residents’ experiences.
District patterns and CD24’s “snake-tail” boundary corridor
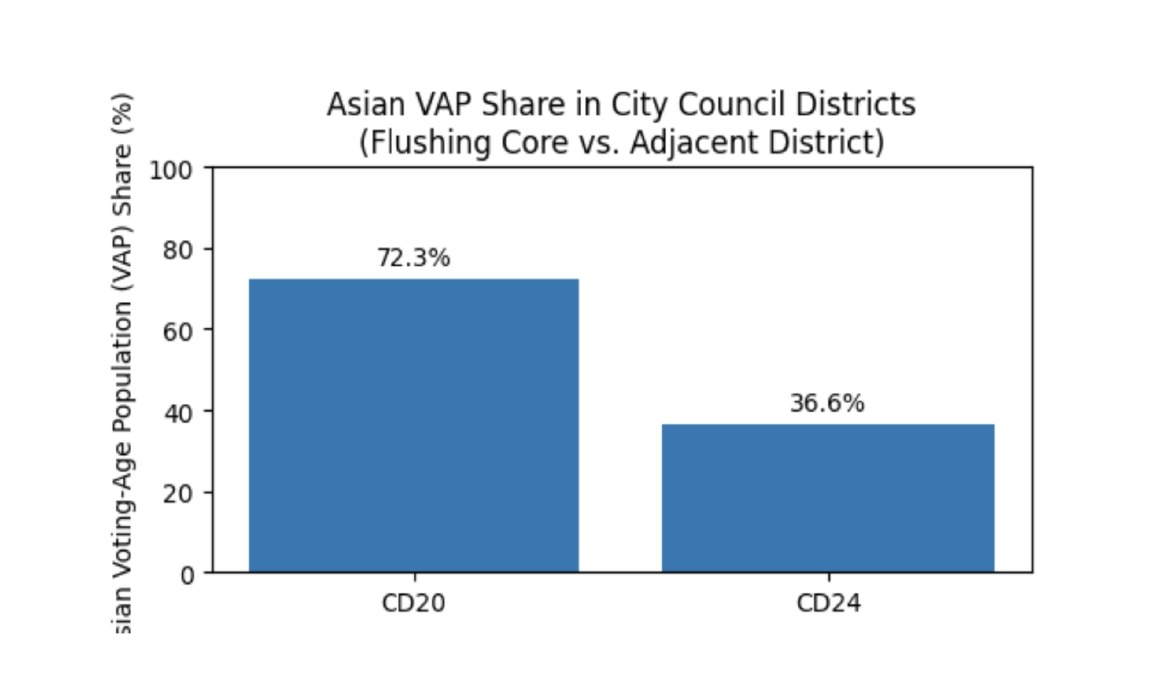
NYC’s enacted City Council plan contains a central demographic fact for understanding representation around Flushing: District 20 is an Asian-majority district by voting-age population. In the Districting Commission’s demographic table, District 20 has a total VAP of 144,989, of which 104,759 is Asian—72.3% Asian VAP8. Nearby districts, however, show much lower Asian VAP shares. District 24, for example, reports 36.6% Asian VAP (49,443 of 134,919), alongside 20.0% Latino and 10.6% Black VAP shares, with the remainder categorized as “Other”8. This contrast does not by itself prove intentional packing or cracking, since residential clustering can naturally produce concentration. Still, it establishes a descriptive baseline: when one district contains a very large share of a community, surrounding districts necessarily contain less of that community, which can reduce influence beyond the district—even when community institutions and language networks extend across boundaries.
That baseline becomes more consequential under the constraints that structure every redistricting cycle. City Council districts must satisfy population equality, and demographic change often requires boundary movement even when communities prefer stability. Using 2020 redistricting population data, the NYC Districting Commission reports an average district population of 172,822 and visualizes population deviation across districts8. In this context, shifting lines is often unavoidable; the question is how population balancing is achieved. Adjustments can preserve communities of interest, or they can fragment cohesive neighborhoods and reassign them into districts whose dominant constituency lies elsewhere. This is where snake-tail boundaries—narrow corridor-like extensions that preserve contiguity while spanning social or geographic barriers— become politically meaningful: they can satisfy legal requirements while still changing which neighborhoods vote together.
District 24 offers a particularly visible example of this snake-tail pattern under the enacted 2022 plan. In Queens redistricting debates, residents frequently argue that some boundaries appear to “reach” across barriers—parks, highways, or rail lines—to connect areas that do not experience themselves as one neighborhood. The enacted District 24 boundary includes a narrow east–west extension that traverses or hugs the edge of Flushing Meadows–Corona Park, visually resembling a “snake-tail” corridor linking otherwise distinct residential areas8. Because large parks and highways often function as social boundaries that separate school zones, daily shopping corridors, and language-service networks, snake-tail connections can feel misaligned with local community geography even while remaining legally contiguous. Importantly, contiguity rules make such extensions formally valid, and the presence of a snake-tail corridor does not establish intent on its own. The representational relevance lies instead in their effects: snake-tail boundaries can merge neighborhoods with different demographic profiles and service needs, or split an existing community of interest across multiple districts. The redistricting literature describes such fragmentation patterns as cracking, but establishing that the enacted plan constitutes cracking—rather than, say, constrained population balancing or accommodation of unrelated communities—would require a counterfactual audit comparing the enacted map with legally valid alternatives. We do not make that claim here and present this discussion as descriptive observation of what snake-tail boundaries can do in principle. The interpretive weight of the CD24 snake-tail corridor is further shaped by residents’ ability to see boundary changes and understand what they do. Publicly available plan-comparison tools show that the snake-tail corridor appears not only as a shape feature but also as a reassignment mechanism: it can move small areas into a district whose electoral center of gravity lies elsewhere, potentially reshaping which communities have “decisive” voice. NYC provides multiple tools for district lookup and map access, including the Council’s “Find My District” widget, the Board of Elections map repository, and third-party interfaces. In principle, these resources support transparency; in practice, technical availability does not guarantee meaningful accessibility, especially for residents with limited English proficiency. This matters because the representational impact of snake-tail boundaries depends not only on where lines are drawn, but also on whether residents can interpret those lines and connect boundary changes to services, policy benefits, and responsiveness.
Perceived representation and a “policy visibility” mechanism
The survey includes 77 responses collected on October 30, 2025. Respondents are predominantly East Asian (n = 63, 81.8%), with smaller numbers of White (n = 6, 7.8%), Hispanic (n = 3, 3.9%), South Asian (n = 3, 3.9%), Black (n = 1, 1.3%), and Middle Eastern (n = 1, 1.3%) respondents. The age distribution skews toward 36–50 (n = 46, 59.7%), followed by 51–65 (n = 18, 23.4%), 18–35 (n = 11, 14.3%), and 66–80 (n = 2, 2.6%). Because the study focuses on Flushing’s Chinese-American/East Asian civic networks, this composition fits the research goal but limits generalization to Queens overall.
| Indicator | Category | n | % |
| Feel represented | Yes | 17 | 22.1 |
| Familiar with “gerrymandering” | No | 51 | 66.2 |
| Active voter | Yes | 49 | 63.6 |
| Know City Council district | Yes | 66 | 85.7 |
| Aware of supportive policies | Yes | 12 | 15.6 |
Against this sample background, the first descriptive finding is that perceived representation is low. Only 22.1% (n = 17) reported “Yes” to feeling represented in the current government, while 41.6% (n = 32) reported “Slightly” and 36.4% (n = 28) reported “No.” Interview 1 juxtaposed individual and collective influence: “I don’t think my individual vote is very important, but I do think one community has a big impact” (Interview 1, Asian female, 30s).
Survey evidence also indicates a substantial awareness gap with respect to formal districting vocabulary. When asked whether they were familiar with the term “gerrymandering,” 66.2% (n = 51) answered “No.” Yet interviews indicate that residents recognize clustering and division without using formal vocabulary. Interview 1 noted, “We aren’t familiar with gerrymandering, but we do see that the communities are all in clusters” (Interview 1).
| Perceived Representation | Aware (Yes) | Slightly Aware | Not Aware (No) | Row Total |
| Yes | 6 (35.3%) | 6 (35.3%) | 5 (29.4%) | 17 |
| Slightly | 5 (15.6%) | 18 (56.2%) | 9 (28.1%) | 32 |
| No | 1 (3.6%) | 10 (35.7%) | 17 (60.7%) | 28 |
| Column Total | 12 | 34 | 31 | 77 |
A chi-square test of independence between perceived representation and policy awareness yields χ²(4) = 13.22, p =.010, with an effect size of Cramér’s V = 0.29 (conventionally a small-to-medium association). Because both variables are ordinal (No < Slightly < Yes), we also report Spearman’s rank correlation, which is positive and significant: ρ = 0.35, p =.002 (N = 77). Both the association test and the rank correlation indicate that respondents who report greater awareness of race-connected supportive policies also report higher perceived representation. By contrast, three additional candidate predictors show no significant association with perceived representation. Familiarity with the term “gerrymandering” is not associated with perceived representation (χ²(2) = 1.65, p =.438; Cramér’s V = 0.15; Spearman ρ = 0.11, p =.359). Active-voter status is likewise not associated (χ²(2) = 1.56, p =.457; Cramér’s V = 0.14; ρ = 0.10, p =.379), nor is knowing one’s City Council district (χ²(2) = 1.50, p =.472; Cramér’s V = 0.14; ρ = 0.06, p =.588). We note that because four association tests were conducted, a Bonferroni-adjusted threshold of p <.0125 would retain only the policy-awareness association as statistically significant; under the more conservative Holm step-down procedure, the same single association survives. We treat the three null results as substantively informative rather than as power failures: they indicate that perceived representation in this sample is not explained by generic political knowledge (gerrymandering vocabulary), by voting engagement, or by simple district identification. The single association that does hold—policy awareness—is the one most directly aligned with the civic-legibility argument developed in the Introduction: representation is experienced through the visibility of policies that reach the community, not through the formal mechanics of districting or the act of voting alone.
Interview evidence complements these patterns along two dimensions. Interview 3 described a language barrier to policy reach: “Most people in Flushing don’t speak English well, especially elderly immigrants” (Interview 3). Interview 2 described perceived resource distribution: “There has been little to no support in terms of public resources for Asians” (Interview 2). These are resident perceptions rather than direct audits of budget or service delivery.
Discussion
The Results highlight a gap between formal representation and lived representation in Flushing’s civic environment. While district boundaries and demographic composition shape who is grouped together politically, residents’ sense of being represented appears to depend less on turnout or district knowledge and more on whether civic information and supportive policies are visible and accessible in everyday life. This Discussion interprets that gap through the lens of policy visibility and “information gerrymandering,” and then outlines practical steps to strengthen community-of-interest protections and bilingual civic engagement.
Policy visibility and “information gerrymandering”
Building on this gap, the strongest survey finding is the link between perceived representation and awareness of race-connected supportive policies. This relationship suggests that representation is experienced through policy visibility. In immigrant neighborhoods, residents may evaluate representation not only by election outcomes but by whether they can access language programs, public support, and resources that feel targeted to community needs. The concept of “information gerrymandering” helps interpret this dynamic. Stewart et al. (2019) show that biased information networks can distort collective decisions. Translating this insight to an urban civic environment, information barriers can distort participation: residents who lack information about districts, hearings, or services may be less able to convert political preferences into influence, even if they vote. NYC provides multiple public portals for district information, yet the survey suggests that tool availability alone does not guarantee felt representation, and interviews highlight language barriers as a plausible bottleneck.
The Council’s institutional role reinforces why this bottleneck matters. The Council plays a broad role in negotiating, modifying, and overseeing the city budget, and also oversees land use processes. For residents, these responsibilities translate into tangible concerns: whether housing policy, business support, translation services, or community programming feels accessible. When residents cannot identify supportive policies, they may infer that government is not designed for them—even if policies exist. This is consistent with Interview 2’s perception that public resources for Asians are limited, and Interview 3’s emphasis on English proficiency barriers among elderly immigrants.
A practical implication is that representation can fail informationally before it fails electorally. Even if a community can elect candidates in one district, it may still feel underrepresented if government remains difficult to navigate, if district changes are hard to interpret, or if supportive programs are not communicated in-language. Conversely, improving policy visibility—through multilingual outreach, district education, and clearer communication about service pathways—may strengthen perceived representation even without immediate boundary changes. In this sense, gerrymandering debates should be evaluated not only as map design problems but also as civic infrastructure problems, where fairness depends on who can access the information needed to participate and claim resources. This framework motivates the recommendations in the next section, which focus on redistricting criteria, bilingual map literacy tools, and earlier, more inclusive community participation.
Redistricting criteria, civic tools, and community participation
The evidence supports recommendations in three domains—boundary criteria, civic information tools, and participation strategies—because the Results suggest that district structure and information access jointly shape lived representation. If residents experience underrepresentation primarily through low policy visibility and limited language-access pathways, then improving fairness requires both map-based protections for communities of interest and an information environment that helps residents interpret district change and navigate services.
First, redistricting criteria should treat language-minority communities as central communities of interest. Advocacy organizations have argued that splitting cohesive immigrant neighborhoods across districts can dilute effective representation and reduce minority electoral opportunity6. While legal standards such as Section 2 vote dilution doctrine are complex11, local decisionmakers can adopt stronger, more transparent norms: avoid splitting major language-minority clusters when feasible, and require clear written justification when splits are unavoidable. The Commission should also report how proposed boundary changes affect minority voting-age population shares using its demographic tables8. This is particularly relevant for snake-tail extensions, which can preserve contiguity while crossing social barriers and reassigning small communities into districts whose dominant constituency lies elsewhere. Even when such moves are justified as population balancing, transparency about trade-offs can make representational impacts visible and contestable3.
Second, NYC should invest in multilingual “map literacy” and policy navigation tools that translate district lines into actionable civic knowledge. The city already provides district lookup and map documents, but the Results suggest that tool availability is not equivalent to accessibility. A practical intervention would be an integrated bilingual interface that uses address search to return City Council, State Assembly, and State Senate districts; explains what each government level does; and links directly to constituent services and language assistance. Existing platforms could be complemented by community-facing explainers and workshops hosted through schools, libraries, and community organizations. Improving “map literacy” is not only about boundaries—it is also about making supportive policies visible in-language and easier to reach.
Third, participation should be supported earlier in the next redistricting cycle, with feedback loops that reduce unequal awareness. New York’s state-level redistricting process demonstrates that procedural ambiguity and political incentives can undermine trust even when reforms exist on paper. Community participation is most effective when it is early, sustained, and connected to clear standards: residents should be able to see which proposals were accepted, which were rejected, and why. Partnerships with organizations that already engage immigrant communities can improve representativeness and address “information gerrymandering,” where unequal information flow undermines democratic participation and election results20. These recommendations should be read as mutually reinforcing. Boundary design can preserve community influence, but information access determines whether that influence is mobilized and sustained. Improving language-access pathways and policy visibility may therefore be among the most actionable near-term strategies for strengthening representation, even while boundary debates continue.
Conclusion
This study examined how municipal redistricting relates to perceived representation in Flushing, Queens, using public districting materials, civic map tools, an original survey (N = 77), and resident interviews (N = 3). City Council District 20 is an Asian-majority district by voting-age population (72.3% Asian VAP), while neighboring District 24 records 36.6%8—a pattern that may reflect residential clustering but also coincides with diminished influence across adjacent districts when a broader community of interest is divided. Only 22.1% of respondents report feeling represented, despite high voting engagement (63.6%) and district knowledge (85.7%). Of four candidate predictors tested, only awareness of race-connected supportive policies is significantly associated with perceived representation (χ²(4) = 13.22, p =.010; Cramér’s V = 0.29; Spearman ρ = 0.35, p =.002); gerrymandering familiarity, voting status, and district knowledge are not (all p >.35). Interviews reinforce this pattern, citing language barriers—especially among elderly immigrants—and perceptions of limited public support targeted to Asian communities. These findings suggest that city-level redistricting should be evaluated through civic legibility—whether residents can understand their districts, access services, and see government acting for them—not only through electoral outcomes or district shapes. The paper’s contribution is both empirical and conceptual. Empirically, the pattern of one positive association alongside three nulls indicates that perceived representation in this community is not explained by generic political knowledge or participation but by whether supportive policies are visible. Conceptually, civic legibility complements the existing redistricting toolkit (compactness, efficiency gaps, ensemble outlier tests) by asking whether maps are fair in reception rather than only in production; it bridges the empowerment–efficacy tradition in Black and Latino politics16,17 with Asian American politics scholarship on heterogeneity and institutional thinness13,14,15; and it reframes municipal redistricting from a map-design problem into a civic-infrastructure problem in which boundary design, multilingual communication, constituent services, and information tools must be evaluated together. Advocacy and litigation continue to highlight similar dynamics in South Asian and Indo-Caribbean neighborhoods of Richmond Hill and South Ozone Park6, and even where legal standards for vote dilution are not met, repeated neighborhood splitting can weaken accountability in ways that civic-legibility interventions may offset in the near term.
Several limitations frame these conclusions. The convenience sample (N = 77) is heavily East Asian, fitting the Flushing focus but limiting generalization and precluding robust multivariate modeling; the three interviews are illustrative rather than systematic; and the three-category response format, chosen to reduce cognitive burden for limited-English-proficiency respondents18, trades granularity for comprehension and precludes multi-item reliability estimates. Most importantly, the design does not establish that the enacted 2022 plan constitutes gerrymandering: we do not audit the enacted map against alternative legally valid plans, we do not operationalize the snake-tail feature of District 24 through formal compactness or tract-level overlays, and we do not link individual respondents to their specific districts. Descriptive Asian VAP shares are consistent with multiple generative processes—residential clustering, population balancing, and neighborhood heterogeneity—that this design cannot adjudicate; accordingly, we use “packing,” “cracking,” and “dilution” only as theoretical framing devices drawn from the redistricting literature. The study was conducted as student research under institutional guidelines for minimal-risk work with verbal consent and anonymous data, and future extensions with larger samples should seek formal IRB determination.
These limitations define a concentrated agenda for future work, of which three priorities stand out. The most urgent is a counterfactual map audit applying Markov-chain ensemble methods9 to test whether District 20’s concentration and District 24’s adjacent composition are statistical outliers relative to legally valid alternatives, paired with formal GIS analysis of the snake-tail corridor using standard compactness metrics and community-of-interest overlays. Equally important is recruitment infrastructure: probability-based research in linguistically diverse immigrant communities is constrained less by analytical technique than by the absence of in-language sampling frames and CBO-partnered fielding capacity, and prior work documents that standard survey infrastructures systematically undercount first-generation and limited-English-proficiency respondents13,14. Co-developing recruitment capacity with community-based organizations, ethnic media, and in-language platforms is itself a research contribution, because it is what enables the larger multilingual samples, validated Likert instruments, and respondent-district linkages needed to test civic legibility rigorously. Finally, extending the design to South Asian, Indo-Caribbean, Black, and Latino neighborhoods in Queens would test whether the civic-legibility mechanism generalizes beyond the Chinese-American case.
Even with the limitations of a small, single-community study, the evidence presented here supports a clear message: in immigrant communities, representation is not only about who wins elections; it is also about whether residents can navigate the information and service environment that makes government feel present, responsive, and fair.
References
- V. Vickrey. On the prevention of gerrymandering. Political Science Quarterly 76, 105–110 (1961). [↩]
- N. O. Stephanopoulos, E. M. McGhee. Partisan gerrymandering and the efficiency gap. University of Chicago Law Review 82, 831–900 (2015). [↩] [↩] [↩]
- B. E. Cain. The reapportionment puzzle. University of California Press (1984). [↩] [↩] [↩]
- U.S. Census Bureau. QuickFacts: Queens County, New York. https://www.census.gov/quickfacts/fact/table/queenscountynewyork/PST045224 (n.d.). [↩] [↩]
- D. M. Butler, D. E. Broockman. Do politicians racially discriminate against constituents? A field experiment on state legislators. American Journal of Political Science 55, 463–477 (2011). [↩] [↩]
- Asian American Legal Defense and Education Fund. Redistricting commission’s NY Assembly plan divides Asian American communities in Queens and Brooklyn. https://www.aaldef.org/press-release/redistricting-commission-s-ny-assembly-plan-divides-asian s-american-communities-in-queens-and-brooklyn/ (2023). [↩] [↩] [↩] [↩]
- A. Gelman, G. King. Enhancing democracy through legislative redistricting. American Political Science Review 88, 541–559 (1994). [↩]
- NYC Districting Commission. Final plan materials (maps, data tables, and compactness). https://www.nyc.gov/site/districting/maps/maps.page (2022). [↩] [↩] [↩] [↩] [↩] [↩] [↩] [↩] [↩] [↩]
- D. DeFord, M. Duchin, J. Solomon. Recombination: A family of Markov chains for redistricting. Harvard Data Science Review 3, 1 (2021). [↩] [↩]
- A. Keena, M. Latner, A. J. McGann, C. A. Smith. Common forms of gerrymandering in the United States. Decyzje 32, 5–31 (2019). [↩]
- Thornburg v. Gingles, 478 U.S. 30 (1986). [↩] [↩]
- Shelby County v. Holder, 570 U.S. 529 (2013). [↩]
- J. Wong, S. K. Ramakrishnan, T. Lee, J. Junn. Asian American political participation: Emerging constituents and their political identities. Russell Sage Foundation (2011). [↩] [↩] [↩]
- N. Masuoka, J. Junn. The politics of belonging: Race, public opinion, and immigration. University of Chicago Press (2013). [↩] [↩] [↩]
- M. Zhou. Contemporary Chinese America: Immigration, ethnicity, and community transformation. Temple University Press (2009). [↩] [↩]
- L. Bobo, F. D. Gilliam. Race, sociopolitical participation, and Black empowerment. American Political Science Review 84, 377–393 (1990). [↩] [↩]
- A. D. Pantoja, G. M. Segura. Does ethnicity matter? Descriptive representation in legislatures and political alienation among Latinos. Social Science Quarterly 84, 441–460 (2003). [↩] [↩]
- J. A. Krosnick. Response strategies for coping with the cognitive demands of attitude measures in surveys. Applied Cognitive Psychology 5, 213–236 (1991). [↩] [↩]
- V. Braun, V. Clarke. Using thematic analysis in psychology. Qualitative Research in Psychology 3, 77–101 (2006). [↩]
- A. J. Stewart, M. Mosleh, M. Diakonova, A. A. Arechar, D. G. Rand, J. B. Plotkin. Information gerrymandering and undemocratic decisions. Nature 573, 117–121 (2019). [↩]


 and a Developing (India) Economy")