
Abstract
Financial scarcity can be commonly noted as being associated with spending behavior. Currently, most of the past research rarely examines how different forms of scarcity may lead to different patterns of spending behavior. This study examines whether income-related and debt-related scarcity are associated with different patterns of behavior in household food expenditure composition. The study’s analysis utilizes cross-sectional data from the 2022 Survey of Consumer Finances (SCF). In this study, households interpreted as income scarce if they were in the bottom 30% of the national income distribution (incpctlecat values 1-3) and as debt scarce if they were in the top 30% of the positive debt-to-income (DTI) distribution. The variable, DTI, was calculated as annual debt payments divided by annual household income. Food expenditure composition was measured as the share of total food spending allocated to food consumed away from home, calculated as foodaway / (foodaway + foodhome). The entire study relies on weights. The results display that households that were experiencing income-related scarcity had consistently allocated a smaller share of their total food budget to food consumed away from home, with the bottom 30% of income categories ranging from 15.16% to 20.99%. Households facing debt-related scarcity showed a weaker and less consistent association with food-away-from-home share, and debt scarcity was not statistically significant after demographic controls were added. Because this study uses cross-sectional survey data, the findings should be interpreted as associations and not causal effects.
Keywords: financial scarcity; debt-to-income ratio; Survey of Consumer Finances; food expenditure composition; food-away-from-home; household finance
Introduction
Wealth disparities shape how households make financial choices. The financial resources a household has may have a tendency to affect how households allocate spending and respond to price changes. Financial pressure is also closely linked with psychological distress among U.S. adults1. For households with limited income or required debt payments, everyday spending decisions often involve trade-offs among competing needs. These pressures make household spending composition an important area for examining how different forms of financial scarcity are associated with consumer behavior.
Financial scarcity comes from different sources. The main source this study will be evaluating would be low income and debt. Income-related scarcity occurs when earnings are too low or unstable to cover household needs. Debt-related scarcity occurs when required payments create pressure on everyday finances, including for households that may have higher incomes but also carry heavy debt burdens. Both forms of scarcity create financial pressure, but they may shape spending decisions in different ways.
Most of the current existing literature currently only looks at financial scarcity as a single broad condition, usually only measuring it by solely using income or wealth. Yet, it is important to note that financial pressure can come from various circumstances like limited income and high debt obligations. Thus, this leaves an important gap: it is unclear whether income-related scarcity and debt-related scarcity are associated with different household spending patterns. This study addresses that gap by comparing both forms of scarcity in the same dataset and examining their relationship to food-away-from-home share.
This study asks: To what extent are income-related and debt-related financial scarcity associated with differences in food-away-from-home share? Based on past research on scarcity and household spending, this study expects income-related scarcity to be associated with a lower food-away-from-home share. Because debt burdens can vary across income levels and household circumstances, the relationship between debt-related scarcity and food-away-from-home share is expected to be less consistent.
This study utilizes secondary data from the 2022 Survey of Consumer Finances (SCF). The SCF is a nationally representative household survey that is conducted by the Federal Reserve. The SCF provides detailed information on household income, debt, and consumption. This information allows it to be useful for comparing income-related and debt-related financial scarcity in a large and diverse sample. The use of secondary data from SCF will allow this study to examine real-world spending behavior that’s hard to capture from other methods, such as an original survey or experiment. This study focuses on U.S. households and examines associations between financial scarcity and food expenditure composition using cross-sectional survey data.
Literature Review
Past literature on this topic explains that households that are currently facing financial pressure tend to make different spending decisions. Researchers Saez and Zucman describe how economic resources are highly concentrated, meaning that they are unevenly distributed across the population2. Adding onto this foundation, Aguiar and Bils look into consumption patterns across the entire income distribution. They show how income differences are strongly related to household consumption behavior3. Their findings suggest that households with fewer financial resources may tend to consume less overall, and they also allocate their spending a lot more differently than wealthier households3. Taken together, these studies display how income and wealth differences indeed have a strong relationship to household consumption patterns.
When income is limited for a household, they may start to reduce spending in categories that are easier to adjust. The primary example in this study is food consumed away from home, which allows households to easily cut back on unnecessary expenses to save money. This idea supports the expectation that income-related scarcity may be related to a lower food-away-from-home share because limited current resources can restrict discretionary spending choices.
Research on food expenditure also shows that food spending varies by income, household characteristics, and socioeconomic status. Researchers French et al. found that household income was associated with differences in food sources and food items purchased, showing that lower-income and higher-income households differ in how they buy food4. Venn et al. found that food expenditure is shaped by income, education, geography, and time, suggesting that household food spending reflects both financial and nonfinancial constraints5.
Food-away-from-home spending is relevant because it is different from food-at-home spending in cost and convenience. Researchers Jensen and Yen looked into food expenditures away from home by meal type and discovered that economic and demographic characteristics were associated with differences in spending on meals away from home6. Codjia and Saghaian also studied U.S. food expenditure patterns during COVID-19 price shocks and discovered that household food spending was shaped by income and other household characteristics7. Binkley further shows that food-away-from-home behavior is also associated with nutrition-related knowledge, attitudes, and concerns8. This adds to the idea that food-away-from-home spending reflects several household characteristics rather than income alone. This literature supports using food-away-from-home share as a measure of food expenditure composition, while also showing that it may reflect both financial constraints and household preferences.
Prior research also shows that food-away-from-home spending shouldn’t be interpreted only as discretionary or avoidable spending. Jensen and Yen found that food-away-from-home expenditures differed by meal type and were associated with household demographic and economic characteristics6. Venn et al. found that food expenditure patterns were shaped by income, education, geography, and time, showing that household food spending reflects both financial and nonfinancial constraints5. Codjia and Saghaian also found that U.S. food expenditure patterns during COVID-19 price shocks were associated with income and other household characteristics7. This data is important because food-away-from-home share may reflect both financial constraint and household circumstances. Therefore, the outcome is interpreted as food expenditure composition rather than as a direct measure of cost-conscious behavior.
Behavioral and cognitive research also suggests that financial scarcity can be a factor in shaping how people make decisions. Prominent researchers, Mani, Mullainathan, Shafir, and Zhao, all argue that poverty has an effect on cognitive function and decision-making9. In addition, scholars Shah, Mullainathan, and Shafir similarly argue that scarcity changes how people allocate attention, causing individuals to focus more heavily on immediate financial demands10. This perspective may suggest that financial constraint may shape spending through attention, stress, and short-term trade-offs.
However, research has shown that scarcity does not affect all households in the same exact way. Rick, Cryder, and Loewenstein introduce the “tightwad-spendthrift” model to show that people respond differently to spending decisions11. They conclude that emotional sensitivity to the pain of paying helps explain why some people become more cautious with spending while others continue to spend more freely11. Researcher Hamilton et al. also explain that financial constraints can influence consumer behavior through multiple pathways, including resource scarcity, psychological constraint, and changes in decision-making12. These studies suggest that financial pressure may be associated with different behavioral responses depending on household circumstances and individual differences.
Debt burden may also shape spending behavior differently from income scarcity. Researchers Gross and Souleles show that liquidity constraints and required debt payments can affect household consumption by limiting short-term financial flexibility13. Adding onto their theory, research after the Great Recession also supports the idea that household debt can be associated with reduced consumption. Dynan found that households with higher debt burdens showed weaker consumption growth after the housing bust, suggesting that debt overhang may limit spending14. Scholars Mian, Rao, and Sufi also similarly found that household balance-sheet shocks were strongly related to declines in consumption during the economic slump15. Researchers Andersen, Duus, and Jensen also found that highly indebted households reduced spending more during the financial crisis16. Debt-related scarcity is therefore not the same as income-related scarcity because households with high debt may still differ in income, assets, credit access, and repayment obligations. A household with low income may reduce food-away-from-home spending because current resources are limited, while a household with high debt may face a different constraint based on required payments relative to income.
Recent studies that used household-level and transaction-level data further display the consumption changes when liquid resources change. Carvalho, Meier, and Wang found that low-income households surveyed before payday behaved as if they were more present-biased than similar households surveyed after payday17. Adding on, Parker et al. found that U.S. households spent substantial portions of the 2008 economic stimulus payments, with larger responses among older, lower-income, and home-owning households18. Ganong and Noel found that spending fell sharply when unemployment insurance benefits were exhausted, showing that predictable income declines can still produce large spending changes19. Fuster, Kaplan, and Zafar also found heterogeneous spending responses to gains, losses, news, and loans, suggesting that available resources and adjustment frictions help explain differences in consumption behavior20.
Further household finance research also supports the idea of looking at debt burden and low income as two different conditions. Researcher Di Maggio et al. have found that lower mortgage payments tend to increase consumption for some households, but were also partly used for voluntary deleveraging21. Researchers Cloyne, Ferreira, and Surico found that households with mortgage debt had different reactions to monetary policy than renters or outright homeowners because balance sheets shape spending responses22. In addition, Researcher Melzer found that payday loan access increased difficulty paying mortgage, rent, and utility bills, showing that high-cost credit can intensify household financial strain23. Meier and Sprenger found that present-biased consumers were more likely to hold credit card debt. Linking debt accumulation to consumer decision-making differences even after accounting for income24.
Food-source and time-use research also supports the idea of making sure to interpret food-away-from-home share cautiously. Scholars, including Smith, Ng, and Popkin, found that U.S. adults decreased home food preparation over several decades, and that lower-income adults still consumed more energy from home sources than higher-income adults in 2007-200825. Drewnowski and Rehm showed that U.S. energy intake differs by food purchase location and that restaurants contribute a substantial share of dietary energy26. You et al. found that food consumed away from home can sometimes fit within a healthy and affordable diet. This suggests that food-away-from-home spending shouldn’t be treated automatically as wasteful or nonessential27. In addition to You et al, Davis and You carefully modeled the trade-off between money and time in meeting a low-cost food plan. This research showed why household food choices can reflect both financial and time constraints28. Zick and Stevens found long-run changes in Americans’ food-related time use, and Zick, Stevens, and Bryant showed that time-use choices are associated with health-related outcomes29,30. Together, this evidence supports using food-away-from-home share as a composition measure, also acknowledging that income, debt, time, and household circumstances may all shape the outcome.
It is still very important to note that food-away-from-home spending shouldn’t be interpreted only as discretionary spending because some households may rely on prepared food for many different reasons. This means that a lower food-away-from-home share could reflect cost-conscious substitution toward food at home, but it is important to note that it may also reflect household preferences, access, or time constraints. Because of that, this study therefore only uses food-away-from-home share as a measure of food expenditure composition, meaning that the study does not use anything as direct proof of cost-conscious behavior.
Income and debt represent two very different forms of financial constraint; Due to this, it is important to note that treating all different types of financial scarcity as one single thing can be a reason that may hide important differences in household behavior. Income scarcity reflects limited current resources, while debt scarcity reflects required payments relative to income. These constraints could overlap, but they can also affect households differently. This study builds on existing literature as it compares income-related scarcity and debt-related scarcity in the same dataset and examines whether each form of scarcity is associated with food-away-from-home share. This study clearly addresses a gap in the literature and tests whether different sources of financial pressure are associated with different patterns of food expenditure composition.
Methods
This study uses cross-sectional secondary data from the 2022 Survey of Consumer Finances (SCF). The SCF is a triennial, nationally representative household survey conducted by the Federal Reserve Board, with interviews administered by NORC at the University of Chicago. The dataset has detailed information on household income, assets, debt, debt payments, demographic characteristics, and most importantly, consumption measures. The unit of analysis in this study is the household. Since this study only uses anonymized public-use data and involves no direct contact with human participants, institutional review board approval was not required for this secondary analysis.
The 2022 SCF dataset was chosen because it is the most recent public-use SCF available at the time of analysis. In addition, this dataset also captures household financial conditions after the COVID-19 pandemic, meaning most households faced elevated prices, rising living costs, and tighter budgets during this period. The public-use SCF includes five implications that can address any missing or incomplete financial information. All variables were constructed separately within each implicate. Descriptive estimates were calculated separately within each implicate and then averaged across the five implicates. Weighted descriptive estimates and weighted regression models used the SCF household weight variable, wgt. Regression coefficients and variance estimates were combined across implicates using a Rubin’s-rules-style procedure. Any replication of this study would require the 2022 SCF public-use data and the R scf package.
The analytic sample contains households in the 2022 SCF with a valid food-away-from-home share. Food-away-from-home share was coded as missing when the total food spending was zero or missing. In all of the regression models, the overall average analytic sample size across all of the five implicates was 4,591 households. All analyses in this study were conducted at the household level.
This study operationalizes three main concepts: income-related scarcity, debt-related scarcity, and food-away-from-home share. The dependent variable, which is the food-away-from-home share, was made from the SCF summary variables foodaway and foodhome. Total food spending was calculated as foodaway + foodhome, and food-away-from-home share was calculated as foodaway / (foodaway + foodhome). Any of the households with zero or missing total food spending were excluded from analyses using this outcome.
Income-related scarcity was made from the SCF household income percentile variable incpctlecat. Households with any of the incpctlecat values of 1, 2, or 3 were all classified as income-scarce: representing the bottom 30 percent of the national income distribution. All other Households that had valid income percentile categories were coded as not income-scarce. This measure effectively captures the relative income position to compare the households. The analysis did not use equivalized income, so household-composition differences are addressed only partially through regression controls, including the number of children. This limitation is discussed later in the paper.
Debt-related scarcity was made by total monthly debt payments, tpay, and annual household income, income. Annual required debt payments were calculated as tpay × 12. Debt-to-income ratio (DTI) was then calculated as annualized required debt payments divided by annual household income, or (tpay × 12) / income. DTI was coded as missing when any income was missing, zero, or negative. Households with DTI = 0 were treated as households with no required debt payments. Among households with positive DTI, percentile categories were created using the positive-DTI distribution. Debt-related scarcity was defined as being at or above the 70th percentile of positive DTI, while households with DTI = 0 or positive DTI below the 70th percentile were coded as not debt-scarce.
The 30 percent thresholds that were constructed were used as transparent, symmetric descriptive cutoffs. The bottom 30 percent of the income distribution identifies households in the lower tail of relative income. The top 30 percent of positive DTI identifies households in the upper tail of debt burden. For transparency, these thresholds are not formal poverty or hardship thresholds. Since the cutoff for deciding who is “income-scarce” or “debt-scarce” is somewhat arbitrary, this study checked whether findings still held using different methods. Thus, both income scarcity and debt scarcity were included in the same regression model, and four types of households were compared: those with neither type of scarcity, only income scarcity, only debt scarcity, and both types of scarcity.
In this study, food-away-from-home share is interpreted as a measure of food expenditure composition. Yet, it is important to keep in mind that it is not a direct survey measure of cost-conscious behavior, and should not be treated as any direct proof. This is because the SCF does not include direct measures such as price comparison, coupon use, intentional substitution toward lower-cost goods, etc. Therefore, a lower share of food away from home may reflect budget constraints, but it may also reflect household preferences, time constraints, caregiving responsibilities, or other circumstances. Because of this, this study will avoid treating any outcomes as direct proof of cost-conscious decision-making.
The analysis for this study is basically done in three steps. To start, weighted mean food-away-from-home shares were calculated by income percentile category and by positive-DTI percentile category, with household counts and household-level standard deviations reported for each descriptive table. Next, households were divided into the four scarcity groups. And then after that, weighted regression models were estimated with food-away-from-home share as the dependent variable. Model 1 included income scarcity and debt scarcity only. Model 2 added demographic controls for age, education, marital status, number of children, and race. All of the analyses done in this study were conducted in R using the scf, dplyr, and survey packages. The main variables used were wgt, foodaway, foodhome, income, tpay, incpctlecat, age, educ, married, kids, and race.
It is very important to note that because the SCF data are cross-sectional, all of the results from this study are interpreted as associations and not causal effects. The weighted estimates are more appropriate for the SCF sampling design than unweighted descriptive comparisons, but the analysis does not use the full SCF replicate-weight design for standard errors. This remaining limitation is addressed in the Limitations section.
Results
This section shows the weighted descriptive estimates and weighted regression results examining the association between financial scarcity and food-away-from-home share. Descriptive results were calculated separately across the five SCF implicates and then averaged across implicates. The tables report weighted mean food-away-from-home shares, household counts, and household-level standard deviations. Table 1 reports weighted food-away-from-home shares by income percentile category.
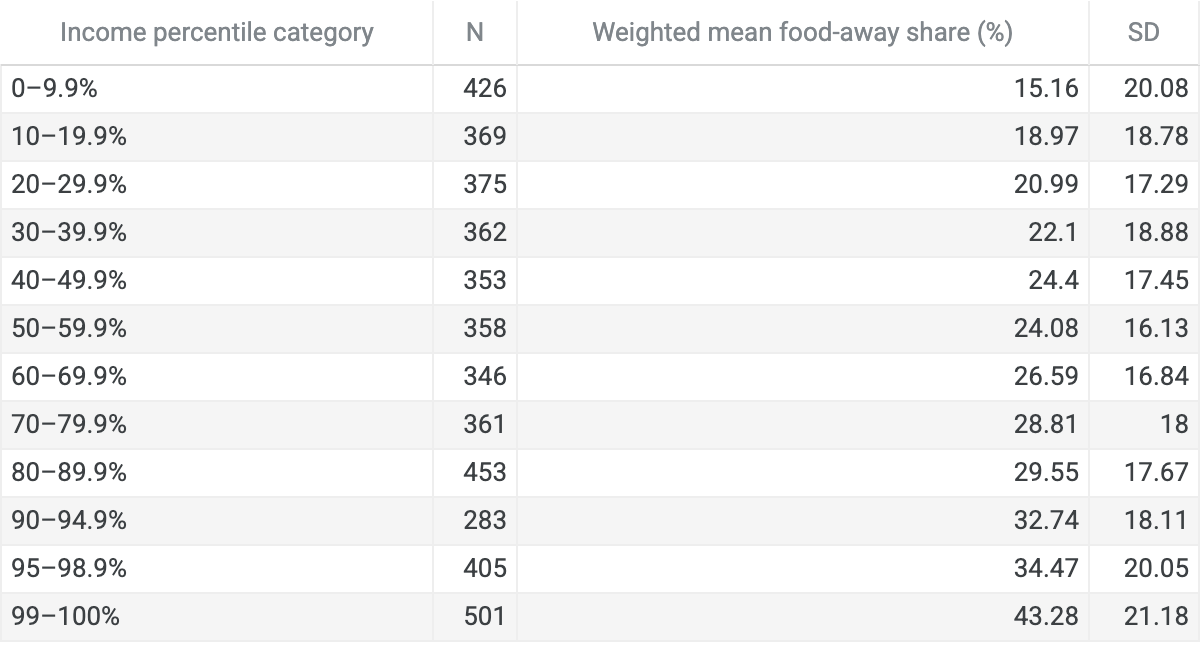
Note. N refers to household count averaged across the five SCF implicates. Weighted mean food-away share was calculated using SCF household weights. SD refers to the household-level standard deviation of food-away share within each category.
As shown in Table 1, food-away-from-home share generally increased as income percentile increased. Households in the lowest income category, the 0-9.9% income percentile group, allocated an average of 15.16% of total food spending to food away from home. This share increased to 18.97% for households in the 10-19.9% income percentile group and 20.99% for households in the 20-29.9% group. Across the bottom 30% of the income distribution, food-away-from-home shares were lower than in most higher-income categories. Table 2 shows weighted food-away-from-home shares across positive debt-to-income percentile categories.
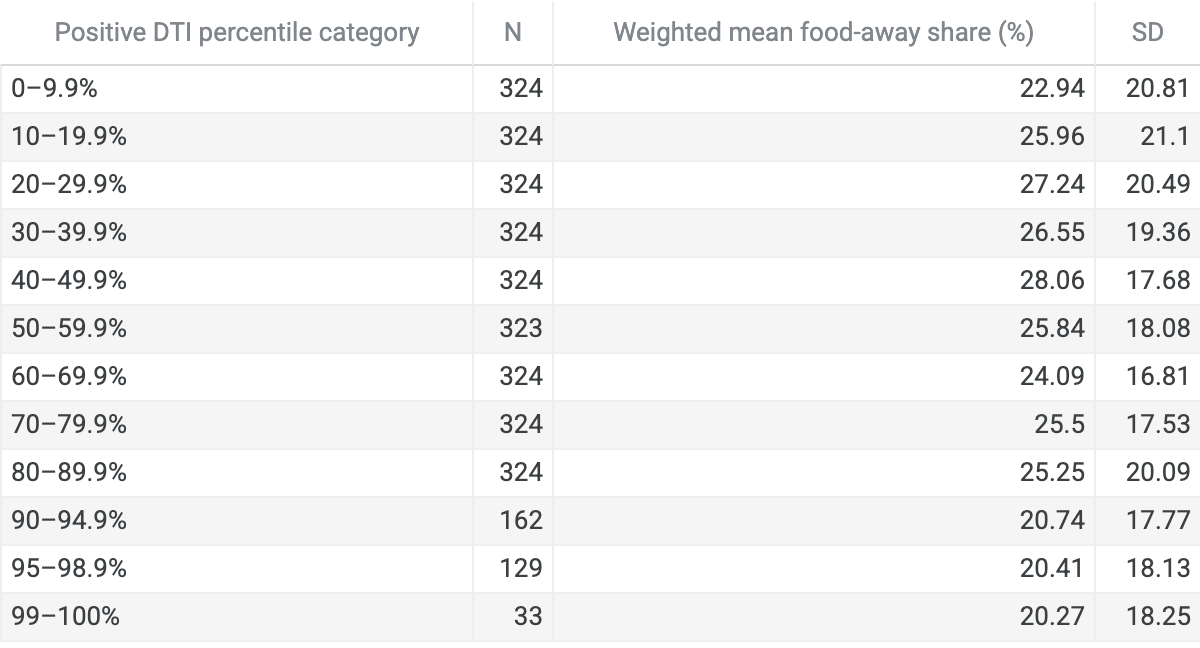
Note. DTI was calculated as annualized required debt payments divided by annual household income: (tpay × 12) / income. DTI categories are percentiles among households with positive DTI only.
As shown in Table 2, food-away-from-home share did not have a very notiable clear monotonic pattern across the positive-DTI categories. Households in the 70-79.9% DTI category allocated 25.50% of total food spending to food away from home, while households in the 80-89.9% category allocated 25.25%. Shares were lower in the highest DTI categories, with 20.74% in the 90-94.9% category, 20.41% in the 95-98.9% category, and 20.27% in the 99-100% category. This mixed pattern may mean that debt-related scarcity was more variable than income-related scarcity. Table 3 separates households into four groups and is based on whether they were income-scarce, debt-scarce, both, or neither.
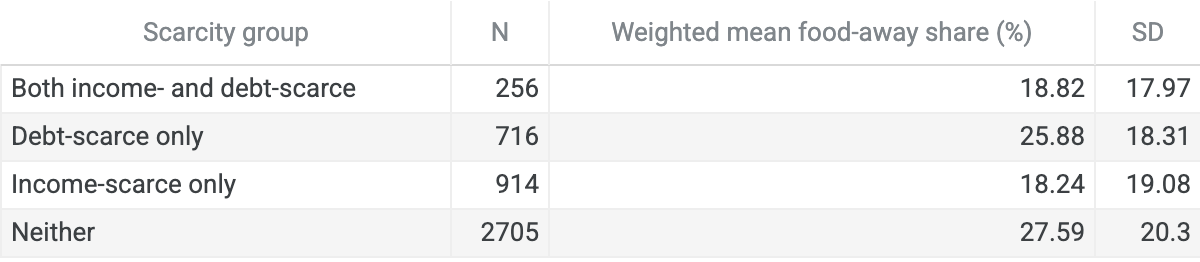
Note. Income-scarce households were defined as households in the bottom 30% of the income distribution. Debt-scarce households were defined as households in the top 30% of the positive-DTI distribution.
Table 3 purposely separates households into four groups to show overlap between income-related and debt-related scarcity. Households that were classified as income-scarce had lower food-away-from-home shares than households that were not income-scarce. Income-scarce-only households allocated 18.24% of total food spending to food away from home, and households classified as both income- and debt-scarce allocated 18.82%. By comparison, households that were neither income- nor debt-scarce allocated 27.59%, and debt-scarce-only households allocated 25.88%. These patterns suggest that income-related scarcity was more consistently associated with lower food-away-from-home share than debt-related scarcity. Table 4 presents weighted regression models predicting food-away-from-home share.
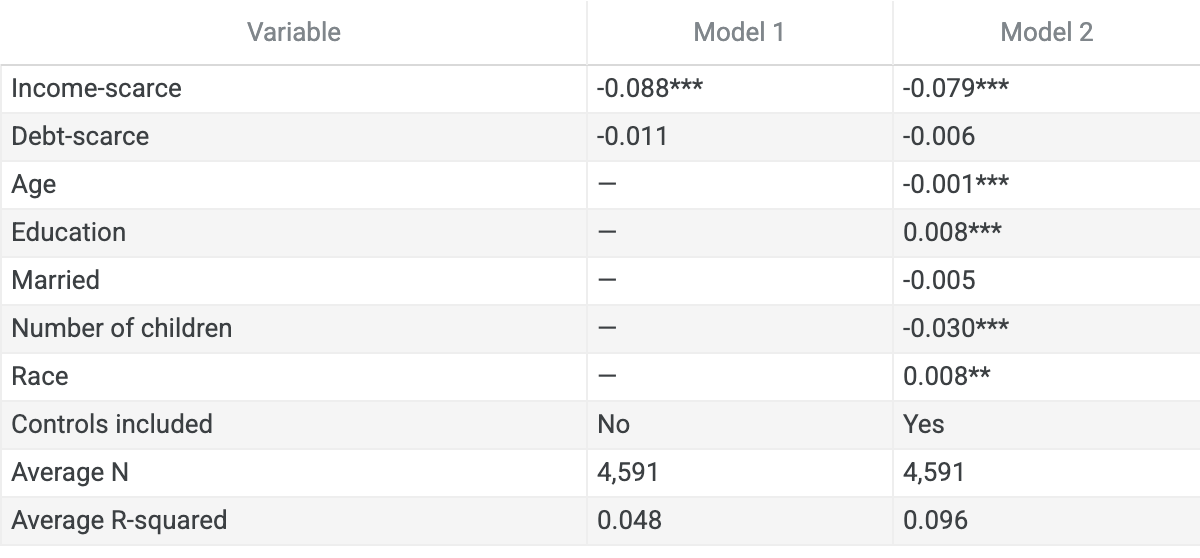
Note. Estimates, standard errors, and p-values were combined across the five SCF implicates using a Rubin’s-rules-style procedure. Statistical significance is shown using stars
Table 4 reports weighted regression models that predict the food-away-from-home share. From Model 1, it can be seen that income scarcity was associated with an 8.81 percentage-point lower food-away-from-home share. After demographic controls were added in Model 2, income scarcity still remained associated with a 7.87 percentage-point lower food-away-from-home share. And debt scarcity was not statistically significant in the adjusted model. These results support a stronger observed association for income-related scarcity than for debt-related scarcity.
As seen from the results, the weighted descriptive and regression results do indeed show a clearer association between income-related scarcity and lower food-away-from-home share than between debt-related scarcity and food-away-from-home share. To be specific, Income-scarce households allocated a smaller share of total food spending to food away from home, and this association remained statistically significant even after demographic controls were added. Debt scarcity showed a weaker and less consistent association. The analysis uses cross-sectional survey data, which could mean that these results should only be interpreted as associations and should not be interpreted as causal effects.
Discussion
This study examines the relationship between income-related scarcity and debt-related scarcity by using the food-away-from-home share variable. The findings demonstrated that income-related scarcity was significantly more strongly and consistently related to the food-away-from-home share compared with debt-related scarcity. This association can be also seen in the descriptive income-related results, in the four-group scarcity comparison, and in the adjusted regression model.
First of all, in relation to the income-related scarcity findings, households that belonged to the bottom 30 percent of the income distribution spent relatively fewer shares on food-away-from-home compared to the households in higher income categories. However, the findings should be considered as associations rather than evidence of causal relationships.
Debt-related scarcity displays a weaker and inconsistent association with food-away-from-home share. In the case of the DTI descriptive results, there was no obvious or consistent relationship found, and debt scarcity was not statistically significant after the controls for demographic variables. This situation may be explained in various ways. One interpretation is that high DTI does not represent the same constraint for every household. Some households with high DTI may also have higher incomes, different assets, different debt types, or greater access to credit, while others may face more severe monthly payment pressure. This heterogeneity may explain why debt-related scarcity was less consistently associated with food-away-from-home share.
This study’s main contribution to the literature is its categorization of scarcity based on income and that based on debts. Assuming that there is only one type of financial scarcity could ignore important differences in household conditions. In this study, income scarcity was more consistently associated with lower food-away-from-home share, and income scarcity was found to be more strongly related to low food-away-from-home share, whereas debt scarcity showed a more mixed pattern. Future research on household financial strain should therefore consider all types of scarcity and not only rely on a single measure of financial pressure.
Limitations
There are multiple limitations that should be taken into mind. First, the study utilizes a cross-sectional design, which means that it cannot establish any causal relationships between financial scarcity and food expenditure composition. It is important to note that the observed associations do not show that income-related scarcity or debt-related scarcity directly caused changes in food-away-from-home spending. In addition to this, the SCF is a household survey, so the findings may not generalize to institutionalized populations or people outside the household sampling frame
Next, even though this study uses the SCF household weight variable and combines results across the five SCF implicates, it’s especially important to note that it does not use the full SCF replicate-weight design for variance estimation. Adding on, the regression controls also do not eliminate all possible omitted-variable bias. There are still factors like region, local food prices, urban or rural residence, work schedules, commuting time, caregiving responsibilities, disability, household size, and food access that may influence food-away-from-home share.
Third, the food-away-from-home share is only an indirect measure of food expenditure composition. This means that it should not be interpreted as a direct measure of cost-conscious behavior. Food-away-from-home was used because the SCF dataset does not directly measure direct indicators of spending restraint. There are limitations in the Food-away-from-home variable as well, as spending may also reflect preferences, convenience, time constraints, cultural norms, local restaurant prices, or limited ability to prepare food at home, etc. Because of this, the findings should be interpreted as patterns in food spending composition and not as direct evidence.
Fourth, the income-related and debt-related scarcity measures have used classifications based on percentiles. In this analysis, the bottom 30 percent of the income distribution and the top 30 percent of the positive-DTI distribution were used as descriptive thresholds. This implies that these numbers do not constitute official definitions of poverty declared by the government. The analysis did not use equivalized income, so differences in household size and composition were only partly accounted for through demographic controls. For debt-related scarcity, DTI measures require payments relative to income but do not distinguish between debt types, which can be a factor in different spending patterns as well.
Future research can help strengthen this analysis in various ways, for example, s could utilize longitudinal data, which can better look into whether changes in income or debt burden are followed by changes in food expenditure composition. Future work could also use direct measures of cost-conscious behavior. Some examples of this include price comparison, coupon use, substitution toward cheaper goods, etc. Future work can also distinguish between different types of debt, For example, credit card debt, student loans, mortgages, auto loans, and medical debt, etc. Since different debt types may create different kinds of financial pressure.
Taken together, these limitations suggest that the findings should be interpreted cautiously. The results show associations between different forms of financial scarcity and food expenditure composition, but they do not prove causal effects. Even with these limitations, the study suggests that separating income-related scarcity from debt-related scarcity may be useful for understanding variation in household spending patterns.
Appendix
Appendix A. Codebook: Variables Used in the Study
| Construct | Study variable | SCF variable(s) | Meaning and coding |
| Survey weight | wgt | WGT, X42001 | SCF household analysis weight. In the Federal Reserve summary extract, WGT = X42001 / 5 so pooled implicate estimates are correctly weighted. |
| Food at home spending | foodhome | FOODHOME, X3024, X3025 | Annualized food-at-home spending from reported amount X3024 and frequency X3025. |
| Food away from home spending | foodaway | FOODAWAY, X3029, X3030 | Annualized food-away-from-home spending from reported amount X3029 and frequency X3030. |
| Food-away-from-home share | food_away_share | foodaway, foodhome | Constructed dependent variable: foodaway / (foodaway + foodhome). Missing when total food spending is zero or missing. |
| Household income | income | INCOME, X5729 | Annual household income from the SCF summary extract. The Federal Reserve summary-variable program constructs INCOME from X5729, bottoms negative values at zero, and adds qualifying IRA/tax-deferred pension withdrawals. |
| Income percentile category | incpctlecat | INCPCTLECAT | Federal Reserve summary percentile category created from INCOME using percentile cut points at 0, 10, 20, 30, 40, 50, 60, 70, 80, 90, 95, and 99 percent. |
| Income-related scarcity | income_scarce | incpctlecat | Coded 1 when incpctlecat = 1, 2, or 3, representing the bottom 30% of the income distribution; otherwise coded 0. |
| Total monthly debt payments | tpay | TPAY | Total monthly required debt payments, summed across nonnegative debt payment components in the Federal Reserve summary-variable program. |
| Debt-to-income ratio | dti | tpay, income | Constructed as (tpay × 12) / income. Coded missing when income was missing or nonpositive. |
| Debt-related scarcity | debt_scarce | dti | Coded 1 for households at or above the 70th percentile of positive DTI; DTI = 0 and lower positive-DTI households coded 0. |
| Age | age | AGE, X14 | Age of the reference person, taken from X14, the reconciled age variable. |
| Education | educ | EDUC, X5931, X5932 | For 2016 and later SCF data, EDUC is taken from X5931, highest school level completed or highest degree received. |
| Marital status | married | MARRIED, X8023 | MARRIED = 1 if X8023 indicates married or living with a partner; MARRIED = 2 otherwise. |
| Number of children | kids | KIDS, X108-X132, X202-X226 | Counts natural children, stepchildren, and foster children of the reference person or spouse/partner in the primary economic unit. |
| Race/ethnicity | race | RACE, X6809, X6810 | Coded from X6809 in the public summary data: 1 = White non-Hispanic, 2 = Black/African-American, 3 = Hispanic, 4 = Asian, 5 = other. |
| SCF implicate | implicate / imputation replicate | Five SCF implicates | The 2022 public-use SCF includes five imputed versions of each family. Variables were constructed separately within each implicate. |
| Analytic sample flag | valid_food_share | foodaway, foodhome | Included when foodaway and foodhome produced a non-missing positive total food spending denominator. |
Appendix B. Supplemental Coding Notes
| Note | Explanation |
| Unit of analysis | The SCF unit used in this study is the household or primary economic unit. |
| Multiple imputation | The 2022 public-use SCF includes five implicates for each family. This study treats implicates as imputed versions of the same households, not independent samples. |
| Food spending outcome | Food-away-from-home share is a composition measure, not a direct behavioral survey item. It should be interpreted as food spending composition. |
| Debt scarcity threshold | Debt scarcity was defined using the top 30% of the positive-DTI distribution. Households with DTI = 0 stayed in the broader sample as not debt-scarce. |
| Weighting | Weighted descriptive estimates and weighted regression models used wgt. The study did not use the full replicate-weight design for standard errors, which is noted as a limitation. |
Appendix C. Official SCF Sources Used for the Codebook
| Source | Use in Appendix |
| Federal Reserve 2022 Survey of Consumer Finances page | Confirmed the 2022 SCF dataset, public-use files, and official documentation links. |
| Federal Reserve Codebook for 2022 Survey of Consumer Finances | Verified raw questionnaire variables including X42001, X14, X8023, X5931, X6809/X6810, X3024-X3030, and X5729. |
| Federal Reserve Summary Extract Data Program / Bulletin macro | Verified construction of summary variables including WGT, FOODHOME, FOODAWAY, FOODDELV, INCOME, TPAY, AGE, EDUC, MARRIED, KIDS, RACE, and INCPCTLECAT |
References
- S. Ryu, L. Fan. The relationship between financial worries and psychological distress among U.S. adults. Journal of Family and Economic Issues. Vol. 44, pg. 16-33, 2023, https://doi.org/10.1007/s10834-022-09820-9. [↩]
- E. Saez, G. Zucman. Wealth inequality in the United States since 1913: Evidence from capitalized income tax data. Quarterly Journal of Economics. Vol. 131, pg. 519-578, 2016, https://doi.org/10.1093/qje/qjw004. [↩]
- M. Aguiar, M. Bils. Has consumption inequality mirrored income inequality? American Economic Review. Vol. 105, pg. 2725-2756, 2015, https://doi.org/10.1257/aer.20120599. [↩] [↩]
- S. A. French, M. Wall, N. R. Mitchell. Household income differences in food sources and food items purchased. International Journal of Behavioral Nutrition and Physical Activity. Vol. 7, Article 77, 2010, https://doi.org/10.1186/1479-5868-7-77. [↩]
- D. Venn, J. Dixon, C. Banwell, L. Strazdins. Social determinants of household food expenditure in Australia: The role of education, income, geography and time. Public Health Nutrition. Vol. 21, no. 5, pg. 902-911, 2018, https://doi.org/10.1017/S1368980017003342. [↩] [↩]
- H. H. Jensen, S. T. Yen. Food expenditures away from home by type of meal. Canadian Journal of Agricultural Economics. Vol. 44, no. 1, pg. 67-80, 1996, https://doi.org/10.1111/j.1744-7976.1996.tb00143.x. [↩] [↩]
- C. O. Codjia, S. H. Saghaian. Determinants of food expenditure patterns: Evidence from U.S. consumers in the context of the COVID-19 price shocks. Sustainability. Vol. 14, no. 13, Article 8156, 2022, https://doi.org/10.3390/su14138156. [↩] [↩]
- J. K. Binkley. The effect of demographic, economic, and nutrition factors on the frequency of food away from home. Journal of Consumer Affairs. Vol. 40, no. 2, pg. 372-391, 2006, https://doi.org/10.1111/j.1745-6606.2006.00062.x. [↩]
- A. Mani, S. Mullainathan, E. Shafir, J. Zhao. Poverty impedes cognitive function. Science. Vol. 341, pg. 976-980, 2013, https://doi.org/10.1126/science.1238041. [↩]
- A. K. Shah, S. Mullainathan, E. Shafir. Some consequences of having too little. Science. Vol. 338, no. 6107, pg. 682-685, 2012, https://doi.org/10.1126/science.1222426. [↩]
- S. I. Rick, C. E. Cryder, G. Loewenstein. Tightwads and spendthrifts. Journal of Consumer Research. Vol. 34, pg. 767-782, 2008, https://doi.org/10.1086/523285. [↩] [↩]
- R. W. Hamilton, C. Mittal, A. K. Shah, D. V. Thompson, V. Griskevicius. How financial constraints influence consumer behavior: An integrative framework. Journal of Consumer Psychology. Vol. 29, no. 2, pg. 285-305, 2019, https://doi.org/10.1002/jcpy.1074. [↩]
- D. B. Gross, N. S. Souleles. Do liquidity constraints and interest rates matter for consumer behavior? Quarterly Journal of Economics. Vol. 117, pg. 149-185, 2002, https://doi.org/10.1162/003355302753399472. [↩]
- K. Dynan. Is a household debt overhang holding back consumption? Brookings Papers on Economic Activity. Spring 2012, pg. 299-362, 2012. 10.1353/eca.2012.0001. [↩]
- A. Mian, K. Rao, A. Sufi. Household balance sheets, consumption, and the economic slump. Quarterly Journal of Economics. Vol. 128, no. 4, pg. 1687-1726, 2013, https://doi.org/10.1093/qje/qjt020. [↩]
- A. L. Andersen, C. Duus, T. L. Jensen. Household debt and spending during the financial crisis: Evidence from Danish micro data. European Economic Review. Vol. 89, pg. 96-115, 2016, https://doi.org/10.1016/j.euroecorev.2016.06.006. [↩]
- L. S. Carvalho, S. Meier, S. W. Wang. Poverty and economic decision-making: Evidence from changes in financial resources at payday. American Economic Review. Vol. 106, no. 2, pg. 260-284, 2016, https://doi.org/10.1257/aer.20140481. [↩]
- J. A. Parker, N. S. Souleles, D. S. Johnson, R. McClelland. Consumer spending and the economic stimulus payments of 2008. American Economic Review. Vol. 103, no. 6, pg. 2530-2553, 2013, https://doi.org/10.1257/aer.103.6.2530. [↩]
- P. Ganong, P. Noel. Consumer spending during unemployment: Positive and normative implications. American Economic Review. Vol. 109, no. 7, pg. 2383-2424, 2019, https://doi.org/10.1257/aer.20170537. [↩]
- A. Fuster, G. Kaplan, B. Zafar. What would you do with $500? Spending responses to gains, losses, news, and loans. The Review of Economic Studies. Vol. 88, no. 4, pg. 1760-1795, 2021, https://doi.org/10.1093/restud/rdaa076. [↩]
- M. Di Maggio, A. Kermani, B. J. Keys, T. Piskorski, R. Ramcharan, A. Seru, V. Yao. Interest rate pass-through: Mortgage rates, household consumption, and voluntary deleveraging. American Economic Review. Vol. 107, no. 11, pg. 3550-3588, 2017, https://doi.org/10.1257/aer.20141313. [↩]
- J. Cloyne, C. Ferreira, P. Surico. Monetary policy when households have debt: New evidence on the transmission mechanism. The Review of Economic Studies. Vol. 87, no. 1, pg. 102-129, 2020, https://doi.org/10.1093/restud/rdy074. [↩]
- B. T. Melzer. The real costs of credit access: Evidence from the payday lending market. Quarterly Journal of Economics. Vol. 126, no. 1, pg. 517-555, 2011, https://doi.org/10.1093/qje/qjq009. [↩]
- S. Meier, C. Sprenger. Present-biased preferences and credit card borrowing. American Economic Journal: Applied Economics. Vol. 2, no. 1, pg. 193-210, 2010, https://doi.org/10.1257/app.2.1.193. [↩]
- L. P. Smith, S. W. Ng, B. M. Popkin. Trends in US home food preparation and consumption: Analysis of national nutrition surveys and time use studies from 1965-1966 to 2007-2008. Nutrition Journal. Vol. 12, Article 45, 2013, https://doi.org/10.1186/1475-2891-12-45. [↩]
- A. Drewnowski, C. D. Rehm. Energy intakes of US children and adults by food purchase location and by specific food source. Nutrition Journal. Vol. 12, Article 59, 2013, https://doi.org/10.1186/1475-2891-12-59. [↩]
- W. You, G. Zhang, B. M. Davy, A. Carlson, B.-H. Lin. Food consumed away from home can be a part of a healthy and affordable diet. Journal of Nutrition. Vol. 139, no. 10, pg. 1994-1999, 2009, https://doi.org/10.3945/jn.109.107615. [↩]
- G. C. Davis, W. You. Not enough money or not enough time to satisfy the Thrifty Food Plan? A cost difference approach for estimating a money-time threshold. Food Policy. Vol. 36, no. 2, pg. 101-107, 2011, https://doi.org/10.1016/j.foodpol.2010.09.001. [↩]
- C. D. Zick, R. B. Stevens. Trends in Americans’ food-related time use: 1975-2006. Public Health Nutrition. Vol. 13, no. 7, pg. 1064-1072, 2010, https://doi.org/10.1017/S1368980009992138. [↩]
- C. D. Zick, R. B. Stevens, W. K. Bryant. Time use choices and healthy body weight: A multivariate analysis of data from the American Time Use Survey. International Journal of Behavioral Nutrition and Physical Activity. Vol. 8, Article 84, 2011, https://doi.org/10.1186/1479-5868-8-84. [↩]