Abstract
Negative feedback controls how strongly and for how long nuclear factor kappa B (NF-kB) stays active. Using a canonical ordinary differential equation model, it was tested how CYLD inhibition and four A20-related parameters change NF-kB activity during and after a finite pulse of tumor necrosis factor (TNF). COPASI was used to extend the model and to export it as Systems Biology Markup Language (SBML) and libRoadRunner was used to run simulations. Stimulus was removed at 60,000 s, and each simulation continued to 160,000 s. Every parameter was scaled from 0.01 to 100 times its baseline value. Total excess area under the curve (activity above the pre-stimulation baseline), post withdrawal excess area, peak concentration, resolution delay, fixed-time concentrations were recorded, and a composite index was created. Changing A20 transcription (c1), translation (c4), or feedback coupling (k2) by the same factor produced identical nuclear NF-kB trajectories, although A20 mRNA and protein levels differed among those three cases. Therefore, Nuclear NF-kB alone couldn’t distinguish these mechanisms, but measuring A20 mRNA and protein could. In contrast, A20 degradation (c5) changed the feedback-loop pattern. The composite index was highest when c5 was high and CYLD inhibition was low. Finer scans showed that recovery relies on the oscillatory state right when TNF is withdrawn, although late excess activity stayed very small. Different parameters can yield the same output, so accumulated activity and recovery should be measured separately. These results do not rank the regulatory mechanisms by biological importance.
Keywords: NF-kB signaling, computational modeling, negative feedback, CYLD, A20
Introduction
Canonical NF-kB signaling connects inflammatory stimuli to gene expression through feedback involving inhibitor of kappa B alpha (IkBalpha) and A20. Experiments and modeling distinguish their temporal roles in the TNF response1. Recent primary-macrophage imaging identified six features of NF-kB trajectories that distinguish immune stimuli2. Microfluidic studies showed that responses to changing cytokine concentrations depend on recent input changes3, while sequential stimulation experiments linked short-term memory to the negative feedback engagement4. These findings make stimulus timing and feedback regulation central to interpreting NF-kB activity.
The biological consequences depend on more than response size. In macrophages, oscillatory and non-oscillatory NF-kB activity produced different chromatin changes5. Models fitted to chromatin-accessibility time courses connected transcription-factor timing to nucleosome remodeling6, and experiments combined with transcriptomics linked macrophage memory to both NF-kB dynamics and chromatin accessibility7. In a separate interleukin 1 (IL-1) stimulation system, splitting the same cumulative cytokine exposure into pulses prolonged inhibitor of kappa B kinase (IKK) assemblies and nuclear NF-kB retention8. These studies support examining temporal outcomes separately; they do not calibrate the finite TNF protocol used here.
Dynamic responses also depend on the cellular setting. Small expression differences among fibroblast clones accompanied distinct NF-kB trajectories9. Temperature experiments and modeling altered oscillation onset and period10, while timed p65 activity affected different stages of blood-cell development in zebrafish, with supporting human stem-cell experiments11. Information-theoretic analysis identified early, intermediate, and late phases of stimulus information in NF-kB time courses12. A single peak or integral can therefore omit features relevant to a particular response.
CYLD is a deubiquitinase whose inhibition of NF-kB activation by TNF receptor family members motivated its inclusion here13. Recent biochemical work identified phosphorylation-dependent control of CYLD activity14. In synovial fibroblasts, CYLD restricted TNF-driven signaling through transforming growth factor beta-activated kinase 1 (TAK1) and IKK215. Other experiments linked its inhibitory action during lipopolysaccharide signaling to a complex containing TNF receptor-associated factor 6 (TRAF6)16. However, CYLD promoted NF-kB activation during ADP-heptose signaling in Helicobacter pylori infection17, and constitutive microglial CYLD overexpression did not protect mice in the tested neuroinflammation models18. These findings motivate simplified inhibition but do not establish its mathematical form or parameter values.
A20, encoded by TNF alpha induced protein 3 (TNFAIP3), is likewise regulated at several levels. TNF receptor signaling induced A20 through signal transducer and activator of transcription 3 (STAT3) in mouse fibroblasts19. Induced A20 expression reduced TNF-responsive cytokine transcripts in human stem-cell-derived macrophages20, whereas autophagy-associated A20 degradation accompanied increased NF-kB activation in lupus-nephritis podocyte experiments21. Studies also identified A20 interactions with the ubiquitin regulator Nrdp122, protection against receptor-interacting protein kinase 1 (RIPK1)-dependent death in activated T cells23, and altered lymphocyte homeostasis in patients with A20 haploinsufficiency24. These findings motivate separating A20 production, degradation, and effective feedback strength, while recognizing that one coupling coefficient cannot represent all A20 functions.
The Lipniacki framework represents IKK activation, nuclear NF-kB movement, and delayed IkBalpha/A20 feedback25. Recent modeling has addressed parameter identifiability in a reduced version26, receptor-level sources of heterogeneous macrophage responses27, and differences between response inhibition and stimulus specificity under simulated drug perturbations28. These approaches establish that model structure, measured outputs, and outcome definitions affect interpretation. The present analysis asks a narrower question within a CYLD-extended canonical model: whether matched parameter changes are distinguishable from nuclear NF-kB alone, and whether their effects differ during stimulation and recovery.
The specific aim was to compare CYLD inhibition (k_cyld) with A20 transcription (c1), translation (c4), degradation (c5), and feedback coupling (k2) using matched relative parameter scans under finite TNF stimulation. A second aim was to determine whether A20 mRNA and protein trajectories distinguish changes that produce equivalent nuclear NF-kB responses. The analysis uses ODE simulations without microglia-specific calibration or a biological ranking of regulatory mechanisms.
Methods
Model Implementation
An existing Lipniacki model was imported in COPASI, extended with CYLD, and exported as an SBML file titled LipniackiWithCYLD.xml. The model includes cytoplasmic and nuclear species, IKK states, NF-kB-IkB-alpha complexes, A20-mRNA, and A20. The SBML specifies relevant reaction laws, stoichiometry, assignment rules, and initial values. The equations below use the same identifiers used in the XML file (for easy reference). Variables in square brackets denote concentrations, which are also traceable in the SBML file.
CYLD is fixed at 1 micromol/L because no reaction or rule changes it. The parameter k_cyld inhibits IKKn_activation, the conversion of IKK_neutral to IKK_active:
IKKn_activation = (Cytosol * k1 * TNF * [IKK_neutral]) / (1 + k_cyld * [CYLD])
This reaction removes IKK_neutral and adds IKK_active. Increasing k_cyld reduces that activation, and k_cyld = 0 removes the added inhibition.
A20-dependent IKKa_inactivation_1 converts IKK_active to IKK_inact. Here, Cytosol is the volume of the cytoplasmic compartment:
IKKa_inactivation_1 = Cytosol * k2 * TNF * [A20] * [IKK_active]
TNF-based stimulation is switched on or off using a runtime variable as below:
TNF = TNF_R
TNF_R is 1 during stimulation and 0 after withdrawal. The explicit A20-dependent outcome therefore becomes zero after withdrawal. The concentrations established beforehand still influence recovery.
At baseline, compartment volumes are fixed and c2 is set to 0. Therefore, A20_mRNA and A20 concentration equations can be shown as:
d[A20_mRNA]/dt = (c1 * [NFKB_nuc]) – (c3 * [A20_mRNA])
d[A20]/dt = ( (c4 * [A20_mRNA]) / Cytosol) – (c5 * [A20] )
The Nucleus volume factor cancels when the rates of mRNA reaction are converted to concentrations. The translation rate contains no volume factor, so it must be divided by Cytosol.
Time is measured in seconds, and concentrations are measured in micromol/L. The cytoplasmic and nuclear compartment volumes are each set to 1 L for computational purposes rather instead of representing actual cell volumes. Kv = 5 is a scaling factor. It represents the cytoplasm-to-nucleus volume ratio from the first Lipniacki model. The CYLD inhibition parameter, k_cyld, is measured in L/micromol. The SBML file doesn’t have units for some parameters, so their units are inferred from the equations. The baseline k2 = 0.1 matches Lipniacki et al., Table 2, which labels it as25. The exported equation shows units of L/(micromol*s) because A20 is expressed as a concentration and TNF doesn’t have a unit. Since this difference remains unresolved, the equation was retained without modification.
Simulation Protocol
The XML used follows SBML Level 2 Version 4 and contains COPASI export annotations. Simulations have been run on Python 3.12.0 with libRoadRunner 2.10.0. The stiff CVODE integrator used relative tolerance of 1e-8, absolute tolerance of 1e-14, and at most 20,000 internal steps between output points. The protocol and relaxed initializations are the same in figures below.
Before TNF was applied, the model was run with TNF off until all species concentrations were stable. Checks were made every 10,000 s. For each species, both the concentration change since the previous check and the current rate of change multiplied by 10,000 s had to be below a small tolerance: 1e-10 micromol/L plus one millionth of the larger concentration magnitude at the two checks. All species had to pass three consecutive checks, with a maximum settling time of 10,000,000 s. Four IKK states that remain zero without TNF were held at zero to prevent drift. Settled states were reused only for parameters that do not affect TNF-off dynamics. The resulting XML was saved. TNF_R was 1 until exactly 60,000 s and 0 thereafter, without a jump in species concentrations. Simulations ended at 160,000 s, giving 100,000 s of follow-up. Outputs every 20 s included the switch. TNF is dimensionless, with no conversion to ng/mL. An optional short protocol uses a 3,600 s pulse and the same follow-up; it is not shown in the primary figures.
Each positive axis contains 25 logarithmically spaced values from 0.01 to 100 times baseline. Consecutive values differ by 10^(1/6), approximately 1.47. Absolute values equal baseline multiplied by the fold factor. Four 25 by 25 grids plus 25 k_cyld = 0 controls per A20 parameter require 2,600 simulations. Other parameters remain at baseline. Tables 1 and 2 give scanned ranges and all exported global baselines.
| Parameter | Baseline | Absolute scan range |
| c1 | 5e-07 1/s | 5e-09 to 5e-05 1/s |
| c4 | 0.5 L/s | 0.005 to 50 L/s |
| c5 | 0.0003 1/s | 3e-06 to 0.03 1/s |
| k2 | 0.1 L/(micromol*s) | 0.001 to 10 L/(micromol*s) |
| k_cyld | 10 L/micromol | 0.1 to 1000 L/micromol |
| Parameter | Value | Parameter | Value |
| Kv | 5.0 | k2 | 0.1 |
| a1 | 0.5 | k3 | 0.0015 |
| a2 | 0.2 | Kprod | 2.5e-05 |
| t1 | 0.1 | Kdeg | 0.000125 |
| a3 | 1.0 | i1 | 0.0025 |
| t2 | 0.1 | e2a | 0.01 |
| c1a | 5e-07 | i1a | 0.001 |
| c2a | 0.0 | e1a | 0.0005 |
| c3a | 0.0004 | c1c | 5e-07 |
| c4a | 0.5 | c2c | 0.0 |
| c5a | 0.0001 | c3c | 0.0004 |
| c6a | 2e-05 | TNF_R | 0.0 |
| c1 | 5e-07 | k_cyld | 10.0 |
| c2 | 0.0 | ModelValue_1 | 5.0 |
| c3 | 0.0004 | NFKB_total | 0.06 |
| c4 | 0.5 | IkB_mRNA_amp | 0.0 |
| c5 | 0.0003 | A20_mRNA_amp | 0.0 |
| k1 | 0.0025 | cgen_mRNA_amp | 0.0 |
Outcome Metrics and the Composite Index
Nuclear NF-kB activity was measured relative to its baseline concentration before TNF stimulation. Any activity below this baseline was treated as zero. Total excess area under the curve (AUC) measures the accumulated activity over the entire 160,000 s simulation, while Post-withdrawal excess AUC measures activity only after TNF was removed at 60,000 s. Both were calculated using trapezoidal integration and are reported in micromol*s/L. Peak concentration was defined as the highest nuclear NF-kB concentration during the simulation. Peak excess was defined as the baseline concentration minus this value. Peak time refers to the time between TNF onset and the highest concentration. Nuclear NF-kB concentrations were also recorded at 1,800, 2,900, 3,600, 10,800, 21,600, 43,200, and 86,400 s intervals after TNF withdrawal.
A Composite index was created to summarize overall NF-kB activity and the amount remaining near the end of the simulation:
I = (0.7 * ME) + (0.3 * LE)
Here, Mean excess (ME) represents average NF-kB activity above baseline across the entire simulation. It was calculated by dividing Total excess AUC by the simulation duration. Late excess (LE) measures the average concentration during the final 10% of the simulation (144,000 to 160,000 s), after subtracting baseline. Negative LE values were set to zero. Both components and the resulting index are measured in micromol/L. The index gives 70% weight to ME and 30% to LE, placing more emphasis on overall activity than on activity near the end. These weights were chosen for this analysis and are not based on measured data. LE was much smaller than ME in the simulations, so it contributed relatively little to the index. The index also does not directly predict cytokine production or tissue damage.
The Composite index depends on the length of the simulation. Extending the simulation with little additional activity can reduce ME even if the earlier response endures the same. Similarly, LE only describes activity within its selected time window and does not prove that NF-kB activity persists over longer periods. This is why, ME and LE were also examined separately.
Resolution delay was used to measure how long NF-kB took to return close to baseline after TNF withdrawal. The response was considered resolved once excess activity fell to or below approximately 0.0135 micromol/L and remained there, provided at least 3,600 s of follow-up remained. This threshold was set at 5% of the peak excess from a separate baseline simulation using a 3,600 s TNF pulse. A delay of zero indicates that activity was already below the threshold at withdrawal and stayed there. Cases where resolution could not be confirmed were recorded separately, along with intervals and cases with insufficient follow-up. This measure describes recovery within the model rather than a confirmed biological threshold.
To examine how the Composite index depended on its definition, the weight assigned to ME was varied between 0, 0.3, 0.5, 0.7, and 1, with the remaining weight assigned to LE. The late-activity window was also changed to the final 5%, 10%, or 20% of the simulation. Four endpoints were tested: 81,600, 100,000, 103,200, and 160,000 s. Together, these choices produced 60 index definitions for each trajectory, calculated using the existing simulation results. Additional simulations had been run to examine patterns that were otherwise difficult to distinguish in the parameter grids. Four smaller, one-dimensional scans were carried out, each containing 193 parameter values. These were generated by dividing 12 intervals from the earlier grid into 16 smaller steps, giving approximately 2.43% changes between values and 772 simulations in total. At baseline CYLD inhibition, k2 was scanned from 1 to 100 times its baseline and c5 from 0.1 to 10 times its baseline. CYLD inhibition was also scanned from 0.316 to 31.623 times baseline, with k2 fixed at 10 times the baseline and then with c5 fixed at 0.316 times the baseline. Initialization and stimulation settings were the same for those runs. These additional scans helped examine selected patterns in greater detail but did not test the resolution of the entire two-dimensional grids.
Code and Data Availability
The code and data are contained in 2 files: RoadRunner-Lipniacki-V2.ipynb (URL: https://github.com/1Riya-Shukla/NF-kB-Pathways/blob/main/MicroglialRegulations/RoadRunner-Lipniacki-V2.ipynb) and LipniackiWithCYLD.xml (URL: https://github.com/1Riya-Shukla/NF-kB-Pathways/blob/main/MicroglialRegulations/LipniackiWithCYLD.xml). These go in the same directory. The notebook (ipynb file) includes comments on usage and explanations on custom output generation.
Results
Changing c1, c4, or k2 by the same proportion produced nearly identical nuclear NF-kB responses, even though A20 mRNA and A20 protein levels differed. Changes in c5 (A20 degradation) affected the timing and strength of A20 feedback. Stronger CYLD inhibition sometimes lowered overall NF-kB activity but increased the activity that was remaining after TNF withdrawal. This shows that total NF-kB activity and the recovery period should be evaluated separately.
Model Structure and Interpretation of the Parameter Scans
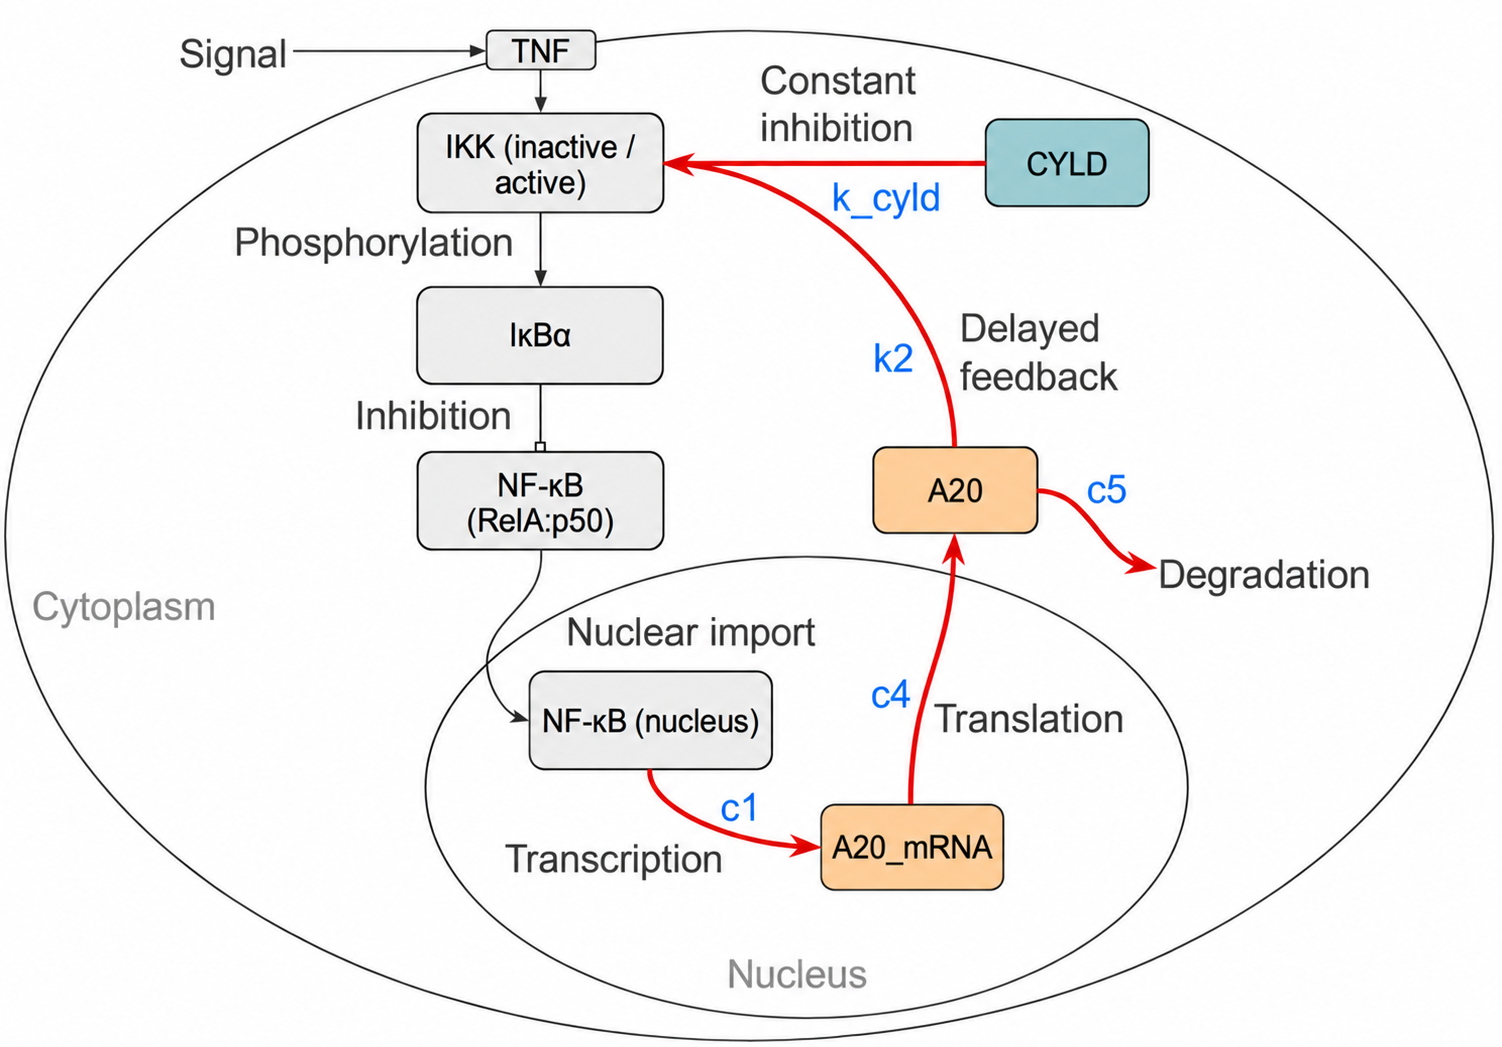
Figure 1 shows how CYLD inhibition was added to Lipniaki’s NF-kB model. CYLD remains at a constant level right from the beginning with k_cyld = 10, while A20 levels change in response to NF-kB activity. The model uses a simplified form of CYLD inhibition without including the detailed ubiquitin-related reactions. After TNF withdrawal, A20 no longer directly causes IKK inactivation through the modeled reaction, but the concentrations established during stimulation still affect how the system recovers.
CYLD Inhibition Affects Response Size, Timing, and Recovery
Figure 2 compares k2 = 0.1 (baseline) and 10 (100-fold), each at k_cyld = 0, 5, and 10. All six runs use 60,000 s stimulation and a 160,000 s endpoint. Oscillation period and damping were not quantified.
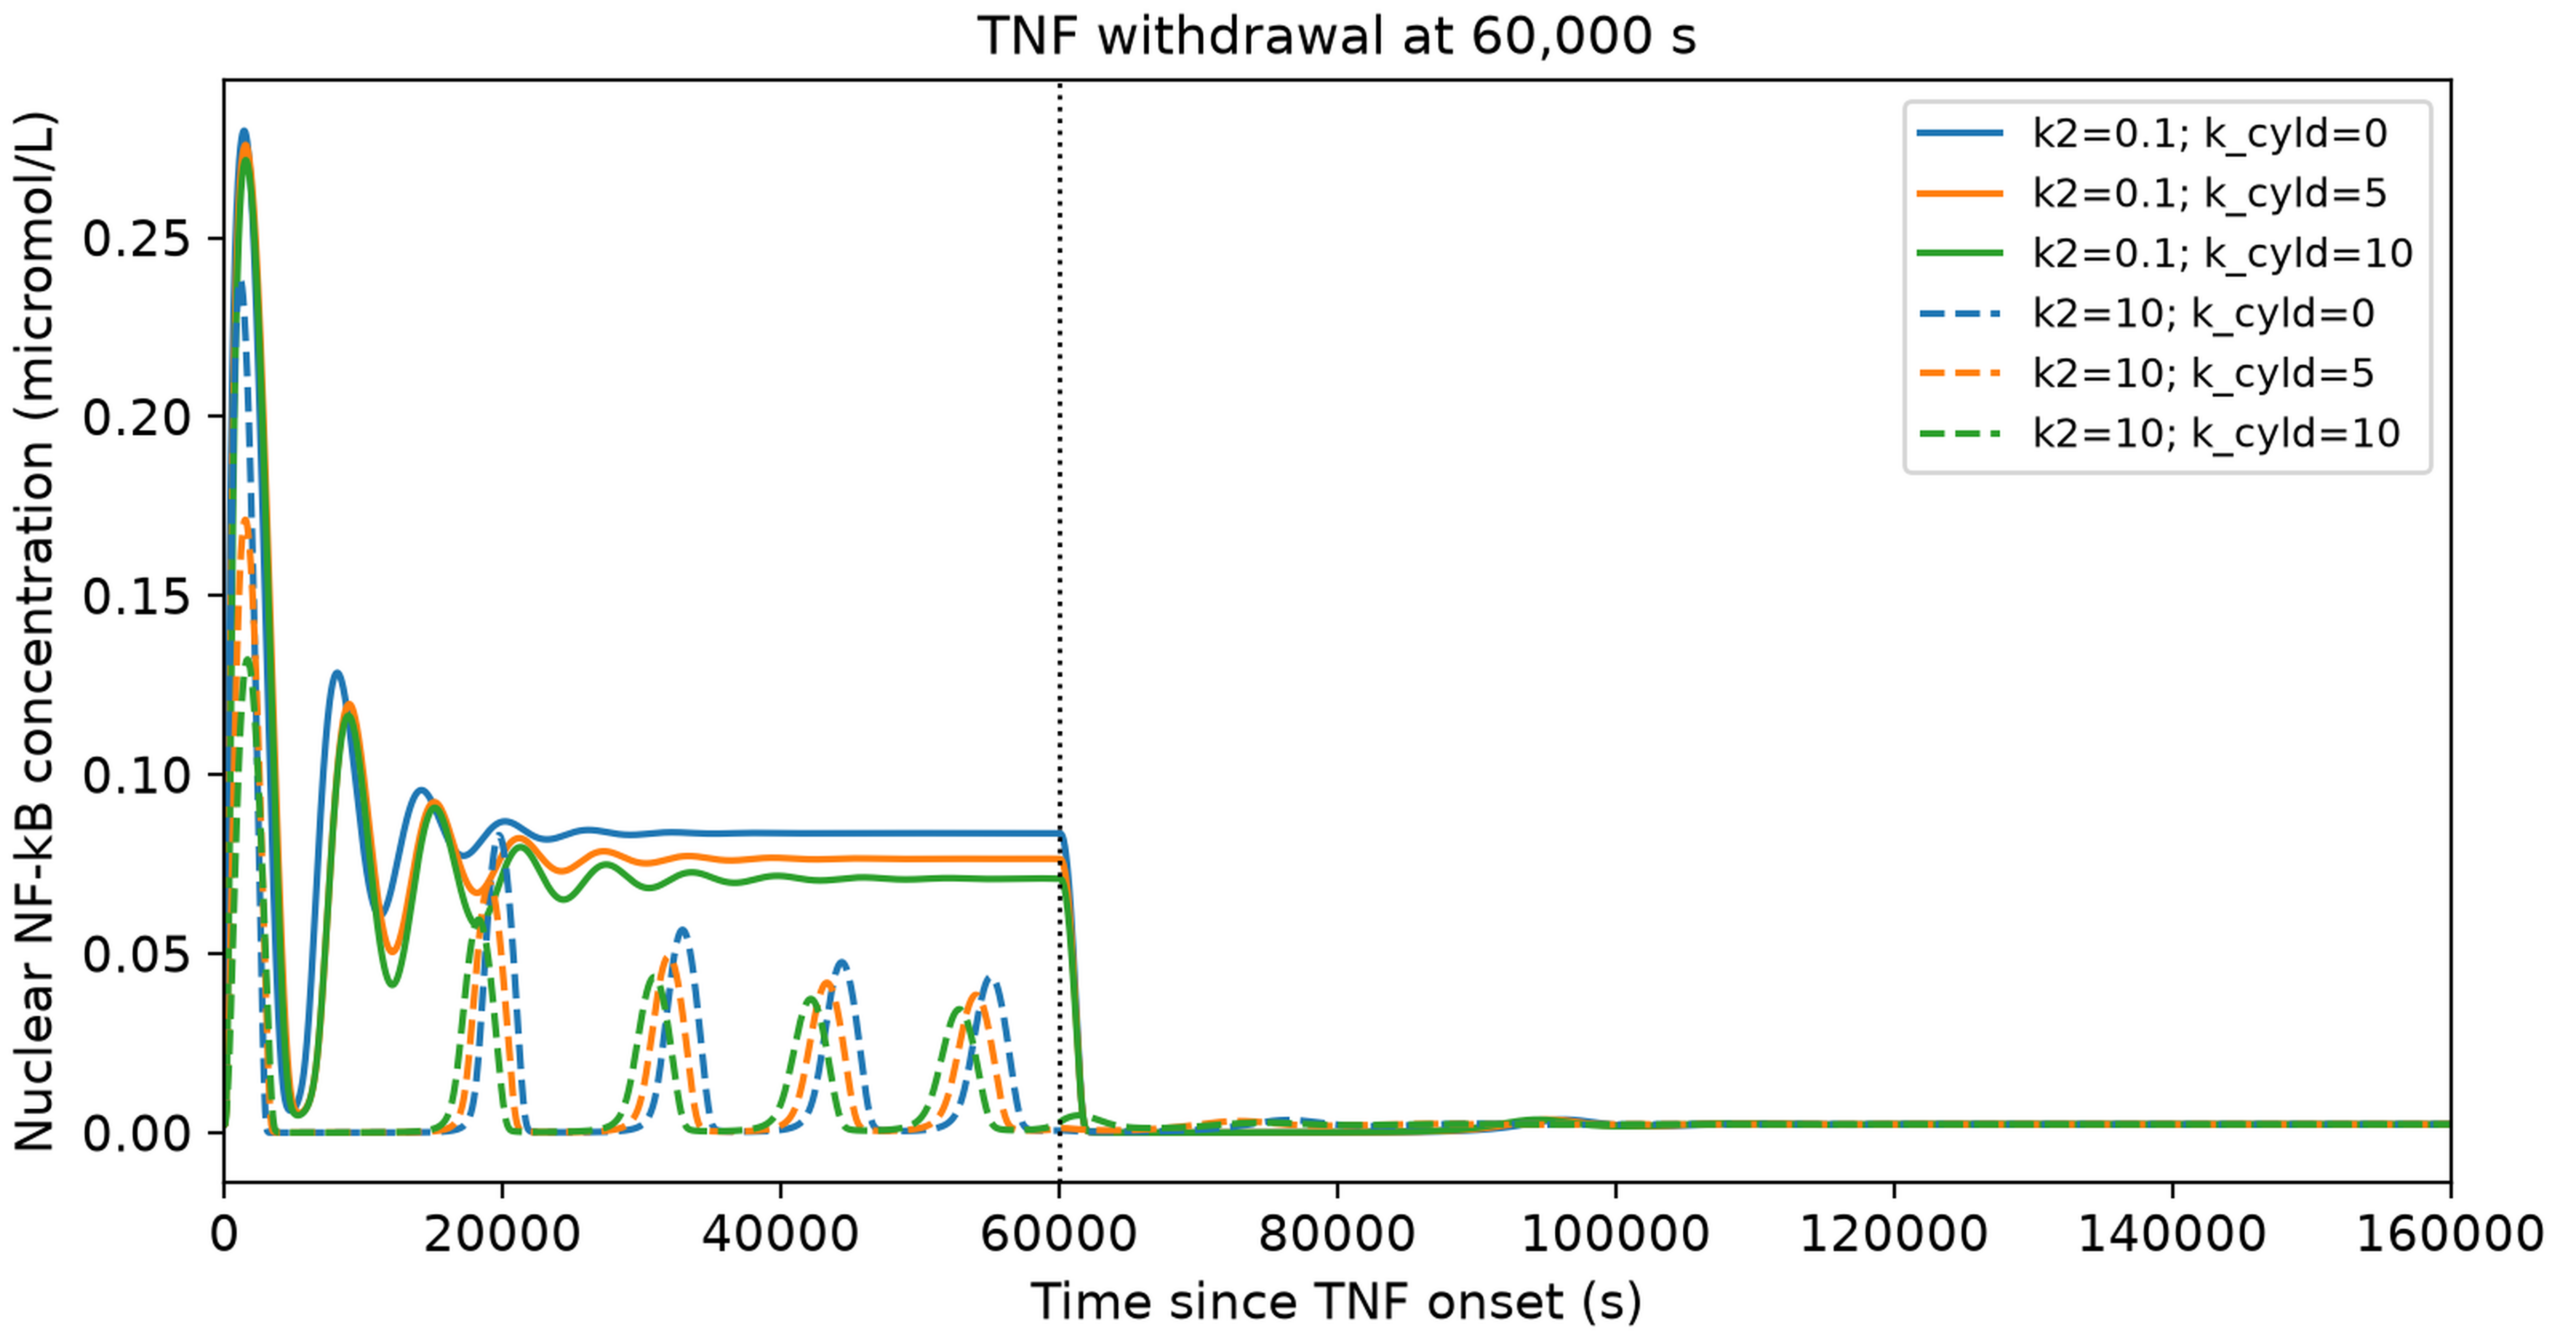
At k2 = 0.1, increasing k_cyld from 0 to 10 reduced Total excess AUC from 5,250.60 to 4,509.39 micromol*s/L and Peak concentration from 0.27988 to 0.27163 micromol/L; Peak time shifted from 1,420 to 1,540 s. At k2 = 10, the corresponding changes were 978.56 to 694.74 micromol*s/L, 0.23835 to 0.13215 micromol/L, and 1,140 to 1,660 s. Post-withdrawal excess AUC decreased with k_cyld at baseline k2. At k2 = 10, however, it fell from 5.56 to 4.35 at k_cyld = 5, then rose to 8.54 micromol*s/L at k_cyld = 10. A smaller total response therefore did not guarantee less post-withdrawal activity (Table 3).
At k2 = 10, Resolution delay was zero because activity remained below threshold throughout follow-up. This does not mean zero activity. At k2 = 0.1, delays were 1,500, 1,480, and 1,460 s for k_cyld = 0, 5, and 10, differing by one or two 20 s sampling intervals.
| k2 | k_cyld | Total excess AUC | Post-withdrawal excess AUC | Peak concentration | Concentration 1,800 s after withdrawal | Concentration 86,400 s after withdrawal |
| 0.1 | 0.0 | 5250.60 | 94.51 | 0.27988 | 0.002321 | 0.002295 |
| 0.1 | 5.0 | 4850.62 | 86.77 | 0.27590 | 0.002383 | 0.002296 |
| 0.1 | 10.0 | 4509.39 | 80.77 | 0.27163 | 0.002438 | 0.002296 |
| 10.0 | 0.0 | 978.56 | 5.56 | 0.23835 | 0.000313 | 0.002296 |
| 10.0 | 5.0 | 810.06 | 4.35 | 0.17119 | 0.000830 | 0.002296 |
| 10.0 | 10.0 | 694.74 | 8.54 | 0.13215 | 0.004704 | 0.002296 |
Matched Changes in c1, c4, and k2 Produce Equivalent Responses
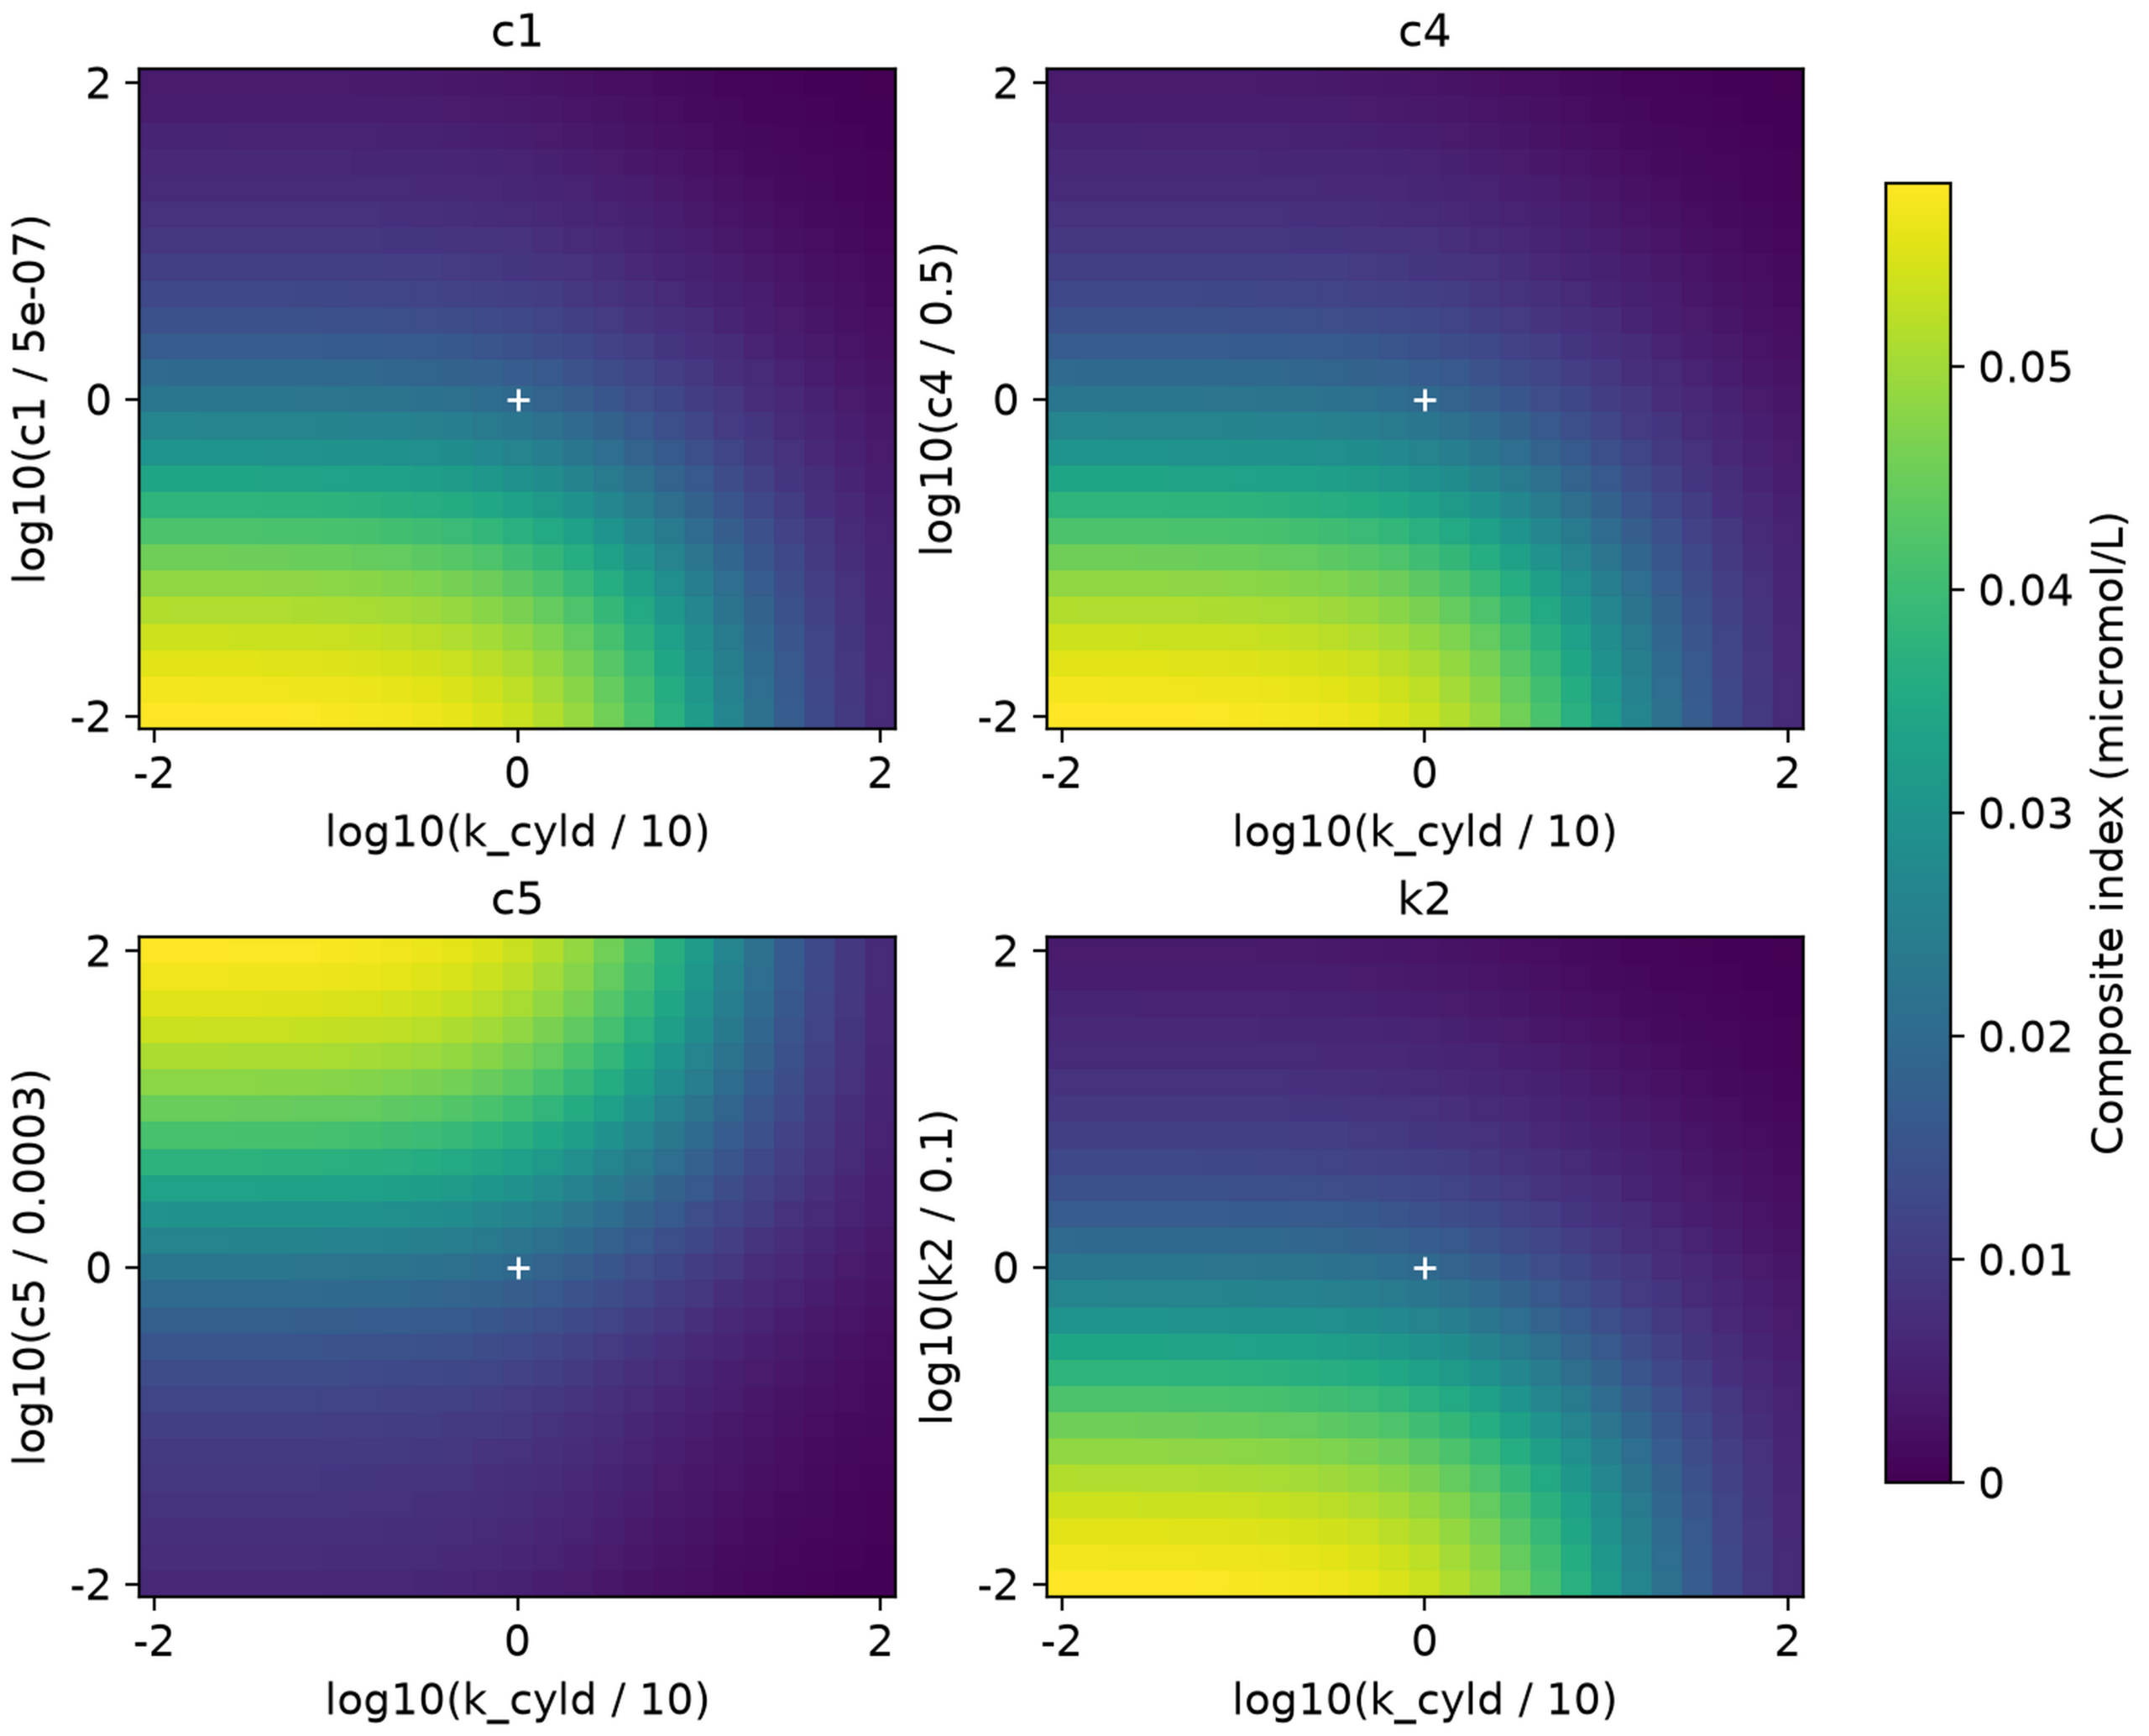
Figure 3 shows the Composite index heatmaps using the same color scale for all four parameters. The results for c1, c4, and k2 were nearly identical, with values ranging from approximately 0.000217 to 0.058171 micromol/L. Each parameter is shown relative to its baseline value. The horizontal axis, log10(k_cyld / 10), is centered at k_cyld = 10. Results for k_cyld = 0 were calculated separately but are not shown because zero cannot be plotted on a logarithmic scale.
The similarity between c1, c4, and k2 can be seen in the model equations. A20 feedback depends on B = k2 * [A20], which is influenced by the product c1 * c4 * k2. When the initial conditions are compatible, changing any one of these parameters by the same relative amount produces the same A20 feedback and nuclear NF-kB response, even though A20 mRNA and protein levels may differ. This means that nuclear NF-kB measurements alone cannot identify which of the three parameters changed. However, this relationship applies specifically to the model and does not mean these biological processes work identically or that other model parameters can be uniquely identified.
A20 Degradation Changes Feedback Kinetics and the Composite Index
Changing c5 affects the rate at which A20 protein is broken down. The c5 values ranged from 0.000003 to 0.03 per second, representing 0.01 to 100 times the baseline value. The highest Composite index of 0.058039 micromol/L was found when c5 was 100 times the baseline and k_cyld was 0.01 times the baseline. The lowest value of 0.000271 micromol/L occurred when these conditions were reversed. This evidence shows how changes in A20 degradation influence NF-kB activity under the tested simulation conditions.
Effects of k2 and c5 on Response Magnitude and Recovery
Figure 4 shows Total excess AUC, Post-withdrawal excess AUC, and Peak excess for k2 and c5. The results for c1 and c4 match those of k2. Changing these parameters affects the timing of NF-kB oscillations, so TNF withdrawal at 60,000 s occurs at different stages of the cycles, resulting in differences in activity after withdrawal. The 25-point logarithmic grids use steps of approximately 47%, such as 1, 1.47, and 2.15 times baseline. Because of these relatively large steps, smaller changes between neighboring points may not be captured.
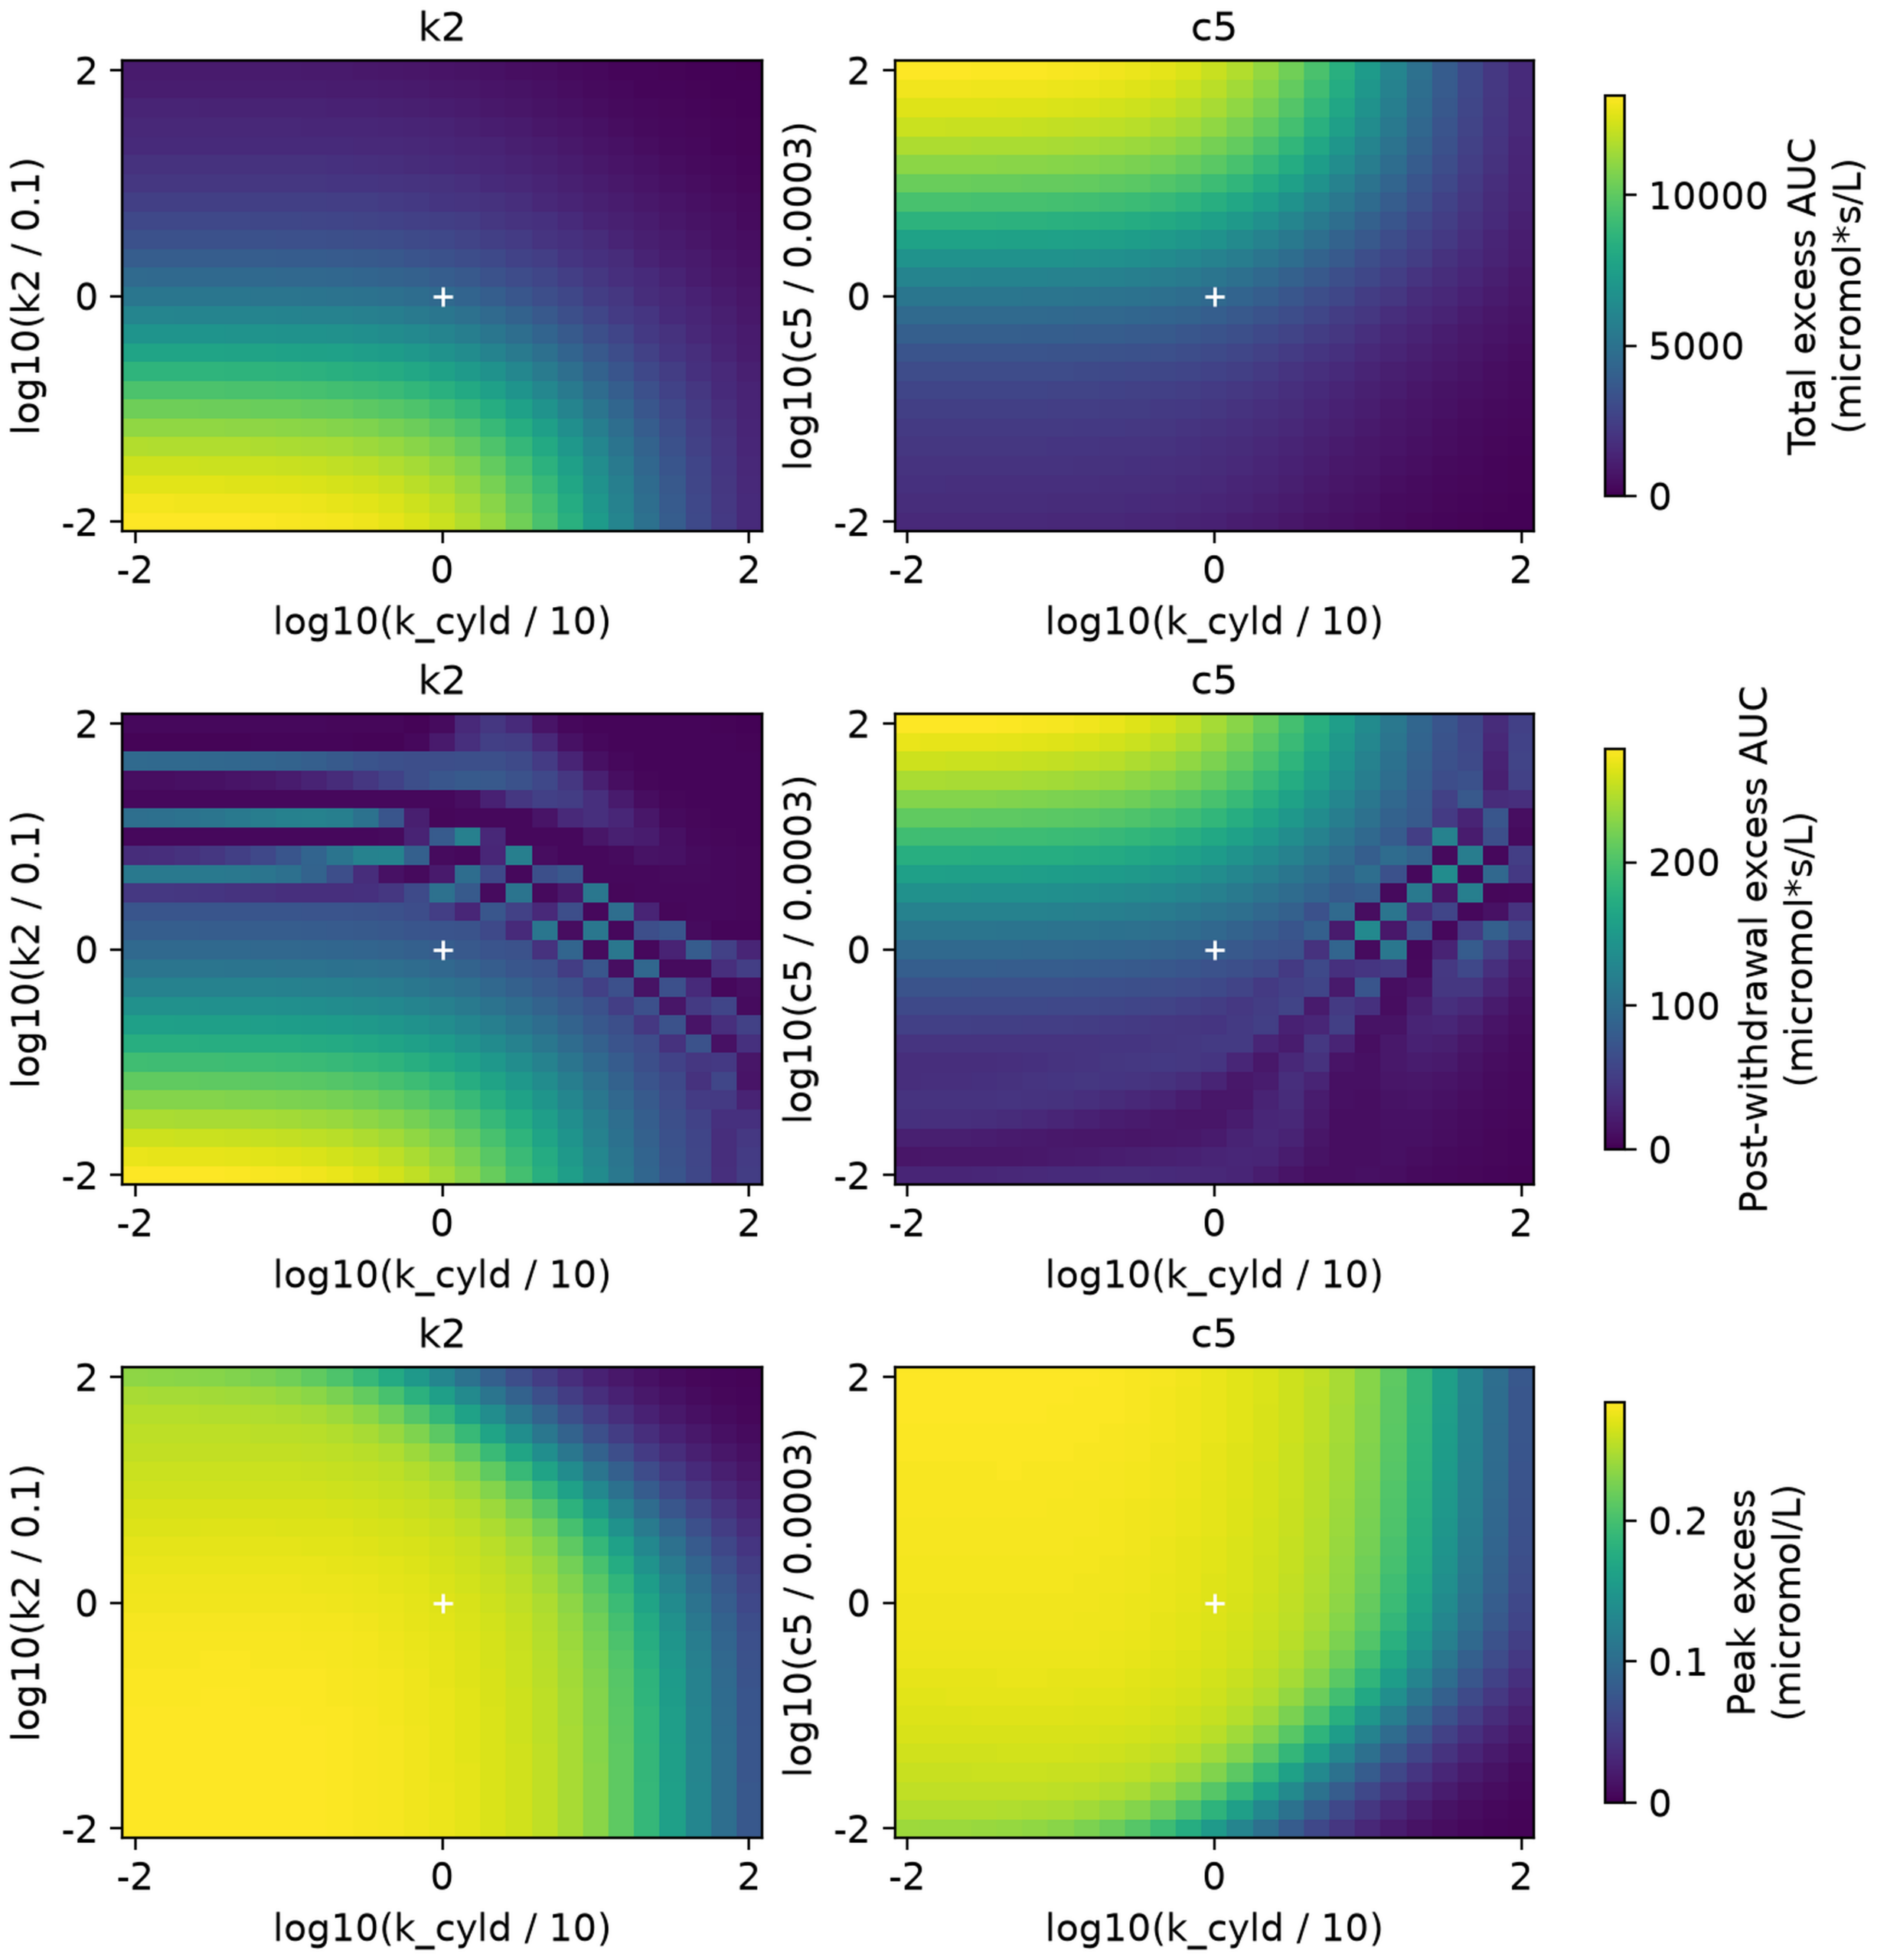
To examine these patterns more closely, specific time-periods were divided into 16 smaller steps, reducing the difference between parameter values to approximately 2.43%. The peaks and troughs remained visible in the finer scans which confirms the model behavior rather than just the spacing of the earlier one. This also helps surface the uneven regions in the heatmap.
Effects of k2 and c5 on Composite Index Components and Robustness
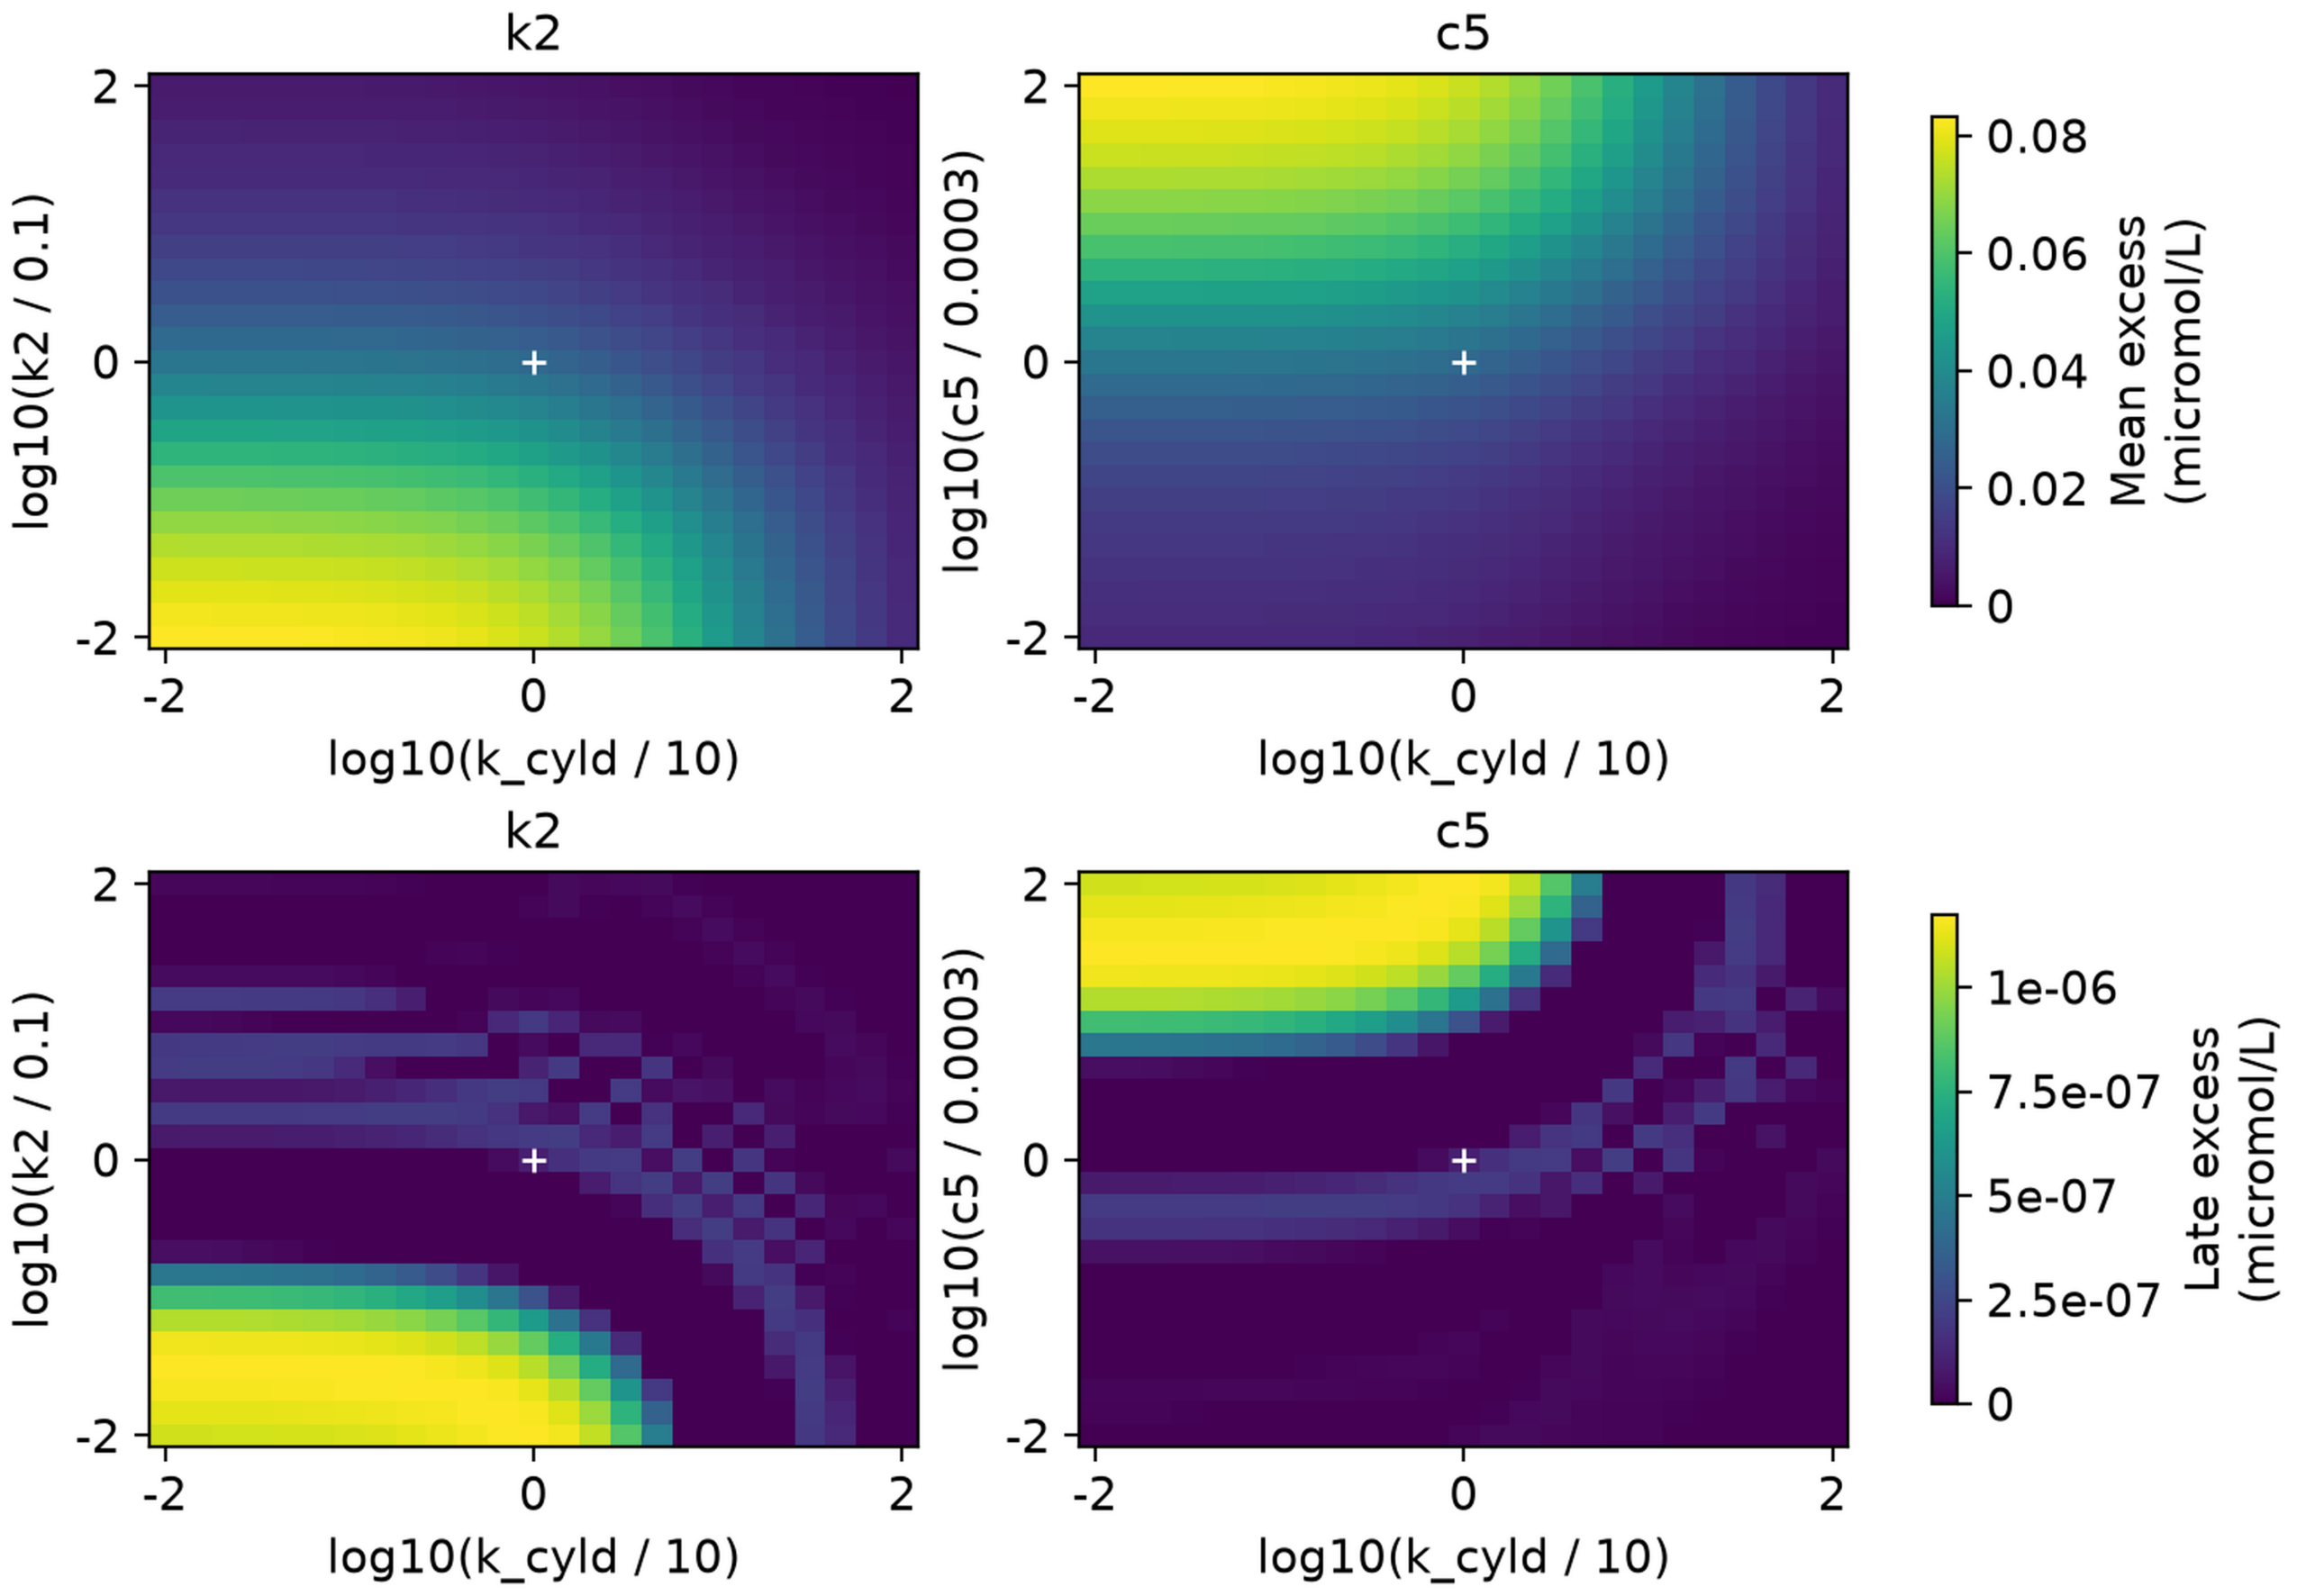
Late excess (LE) remained below 1.18 * 10^-6 micromol/L across all four positive grids, meaning Mean excess (ME) had a much greater effect on the Composite index. Figure 5 shows that ME ranged from 0.000387 to 0.082913 micromol/L for c5 and from 0.000310 to 0.083100 micromol/L for k2. The LE heatmaps show small remaining oscillations around baseline, with dark regions appearing where negative values were set to zero. Even at its highest value, LE was only 0.051% of baseline, which is too small to conclude that NF-kB activity remained biologically significant over time.
For 56 parameter sets, more rigid solver tolerances and shorter 5 s output intervals changed Post-withdrawal excess AUC by less than 0.008% and positive Late excess by less than 0.074%. These results show that the simulations didn’t vary considerably at the tested points, but they do not confirm the validity over the entire grid or any biological significance.
Across all 60 Composite index definitions, the differences between c1/c4 and k2 remained below 0.0000000012 micromol/L. When ME was given any positive weight, the highest index values consistently occurred at high c5 and low k_cyld in the c5 scan, and at low values of both parameters in the other scans. Using only LE changed these patterns because it focused on very small amounts of remaining activity. Changing the simulation endpoint also affected the index values, showing that the results depend on the chosen weights and observation period.
A20 mRNA and Protein Distinguish Equivalent Nuclear Responses
Figure 6 shows how matched changes in c1, c4, or k2 produce equivalent nuclear NF-kB responses while A20 mRNA and protein concentrations differ.
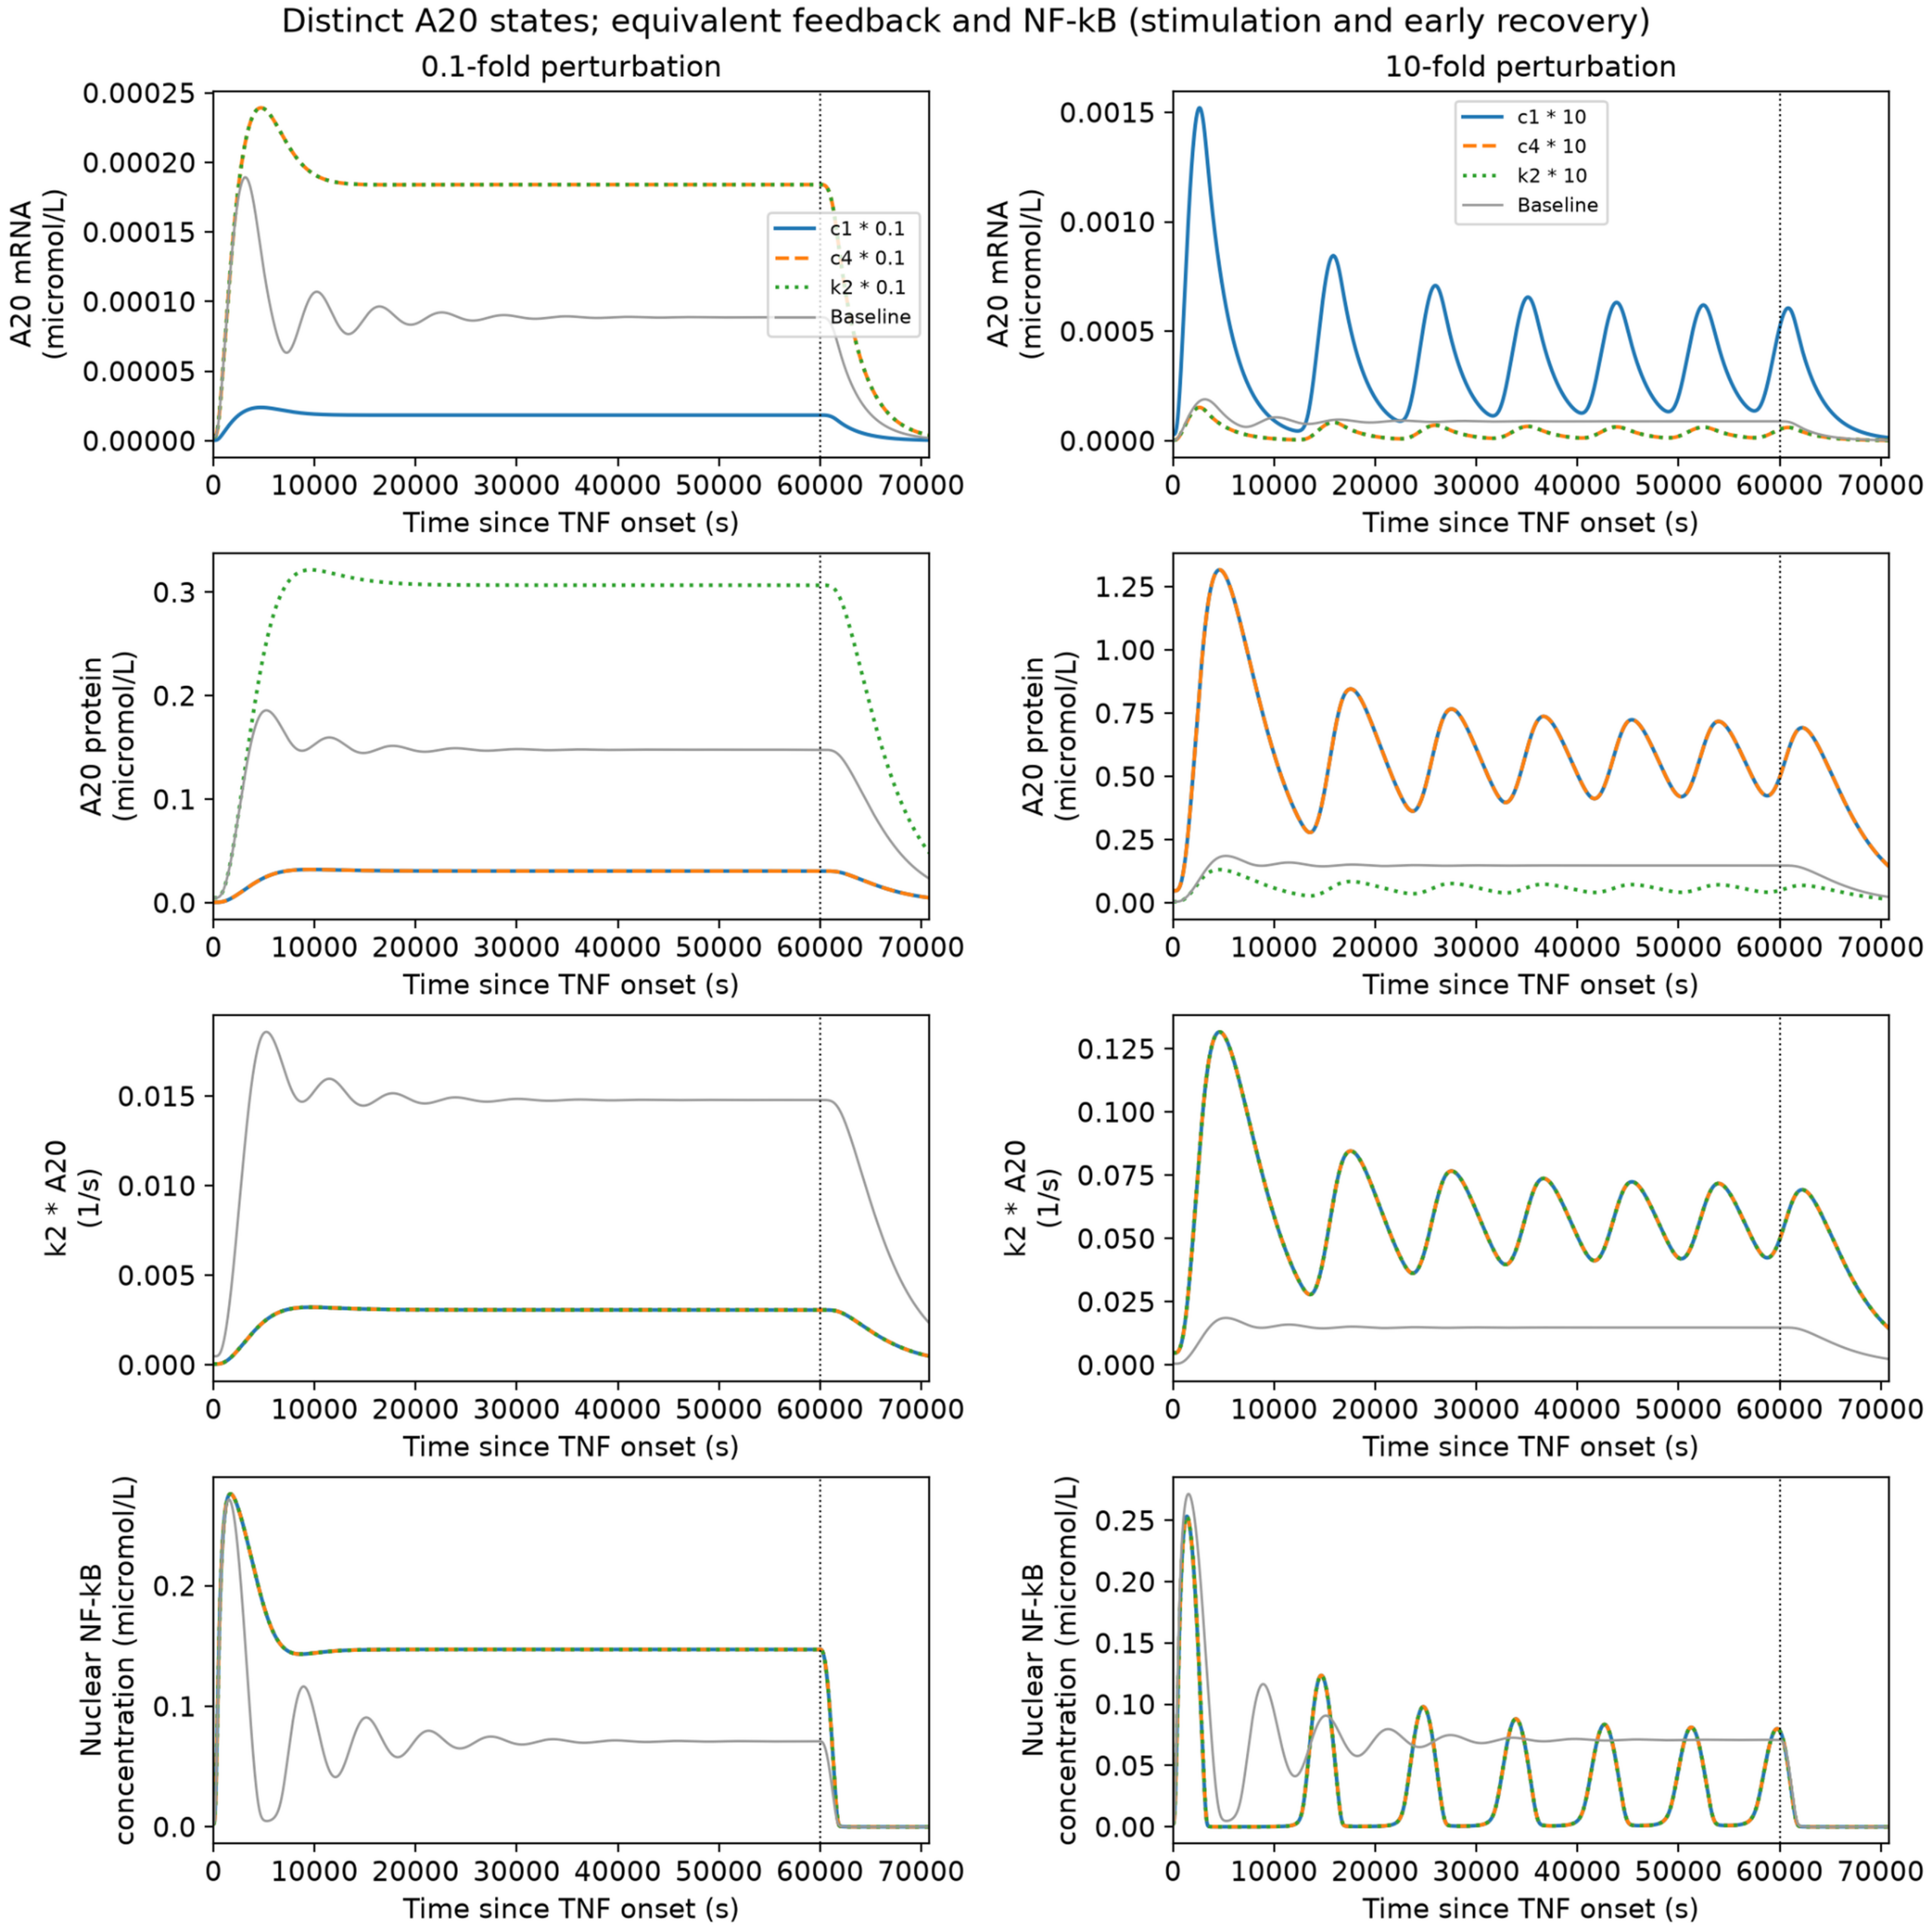
For separate tenfold changes, c1 and c4 produce ten times the A20 protein of the k2 case, which has a tenfold larger k2 value. Their products k2 * [A20] therefore coincide, giving equal A20-dependent inactivation when TNF and active IKK also coincide. A20 mRNA distinguishes c1 from the other cases. Joint transcript, protein, and nuclear measurements could thus separate these parameter changes within this model.
Discussion
The main finding is that changes in c1, c4, and k2 can produce the same nuclear NF-kB response, even when A20 mRNA and protein levels differ. This builds on questions about parameter identification raised in an earlier reduced-mode study26. Measuring nuclear NF-kB together with A20 mRNA and protein could help identify which parameter has changed. However, these results do not show that all model parameters can be uniquely identified or that transcription, translation, and feedback coupling work the same way in real cells.
Previous CYLD studies also show why the model’s findings should be interpreted carefully. CYLD has been shown to inhibit signaling in synovial fibroblasts15, provide no protection in the tested microglial models18, and promote NF-kB activation during bacterial ADP-heptose signaling17. These different effects cannot be fully represented by a single inhibition equation. The model therefore uses a simplified version of CYLD regulation to compare its effects with A20 feedback. Similarly, c5 represents the rate of A20 protein degradation yet does not account for the additional A20 interactions, autophagy, or cell-survival processes discussed earlier.
Previous studies of NF-kB signaling also suggest that response strength, timing, and later effects should be considered separately. In this study, with CYLD inhibition held at baseline, increasing k2 from 3.162 to 4.642 times baseline reduced Post-withdrawal excess AUC from 102.84 to 18.71 micromol*s/L. Most of this difference occurred within the first 10,800 s after TNF withdrawal. Although the oscillations had similar amplitudes, they were at different stages of their cycles when TNF was removed. The finer scans of the parameters further support the importance of oscillation timing during withdrawal. However, the simulations do not confirm whether these patterns would remain the same if TNF were withdrawn at a different time. The Composite index is also a model-defined measure that has not been experimentally validated, and the very small LE values are not enough to establish persistent biological activity.
Limitations
The model does not account for differences between individual cells, random changes in gene expression, chromatin remodeling, or detailed ubiquitin-related reactions. TNF is represented as either on or off, and the 60,000 s stimulation period was chosen for this analysis instead of being based on experimental data. CYLD concentration remains constant, and k_cyld was not adjusted using measured biological activity. The difference in reported k2 units also remains unresolved. Although the results show that c1, c4, and k2 can produce identical nuclear NF-kB responses, they do not establish whether all model parameters can be uniquely identified. The sensitivity tests and numerical checks were also limited and do not confirm that the findings would remain consistent among different cell types, model structures, TNF withdrawal times, or more detailed two-dimensional parameter analyses.
Future Directions
Future studies could measure nuclear NF-kB, A20 mRNA, and A20 protein levels under regulated TNF stimulation to test whether the predicted similarities and differences occur in real cells. The model could also be expanded to include changes in CYLD activity and detailed ubiquitin-related reactions, rather than keeping CYLD inhibition constant. Before using these results to recommend possible treatments, the model should be tested with data from specific cell types and further analyzed to determine which parameters can be reliably identified.
Conclusion
The results show that nuclear NF-kB responses can appear identical even when A20 mRNA and protein levels differ. The relationship between c1, c4, and k2 suggests that measuring all three could help distinguish these changes. The c5 parameter affects the timing of A20 feedback, with the highest Composite index occurring at high c5 and low k_cyld values in the tested range. Stronger CYLD inhibition can also reduce overall NF-kB activity while increasing activity after TNF withdrawal. These outcomes show the importance of examining both total activity and recovery, although experimental testing is still needed to confirm the model’s predictions.
References
- S. L. Werner, J. D. Kearns, V. Zadorozhnaya, C. Lynch, E. O’Dea, M. P. Boldin, A. Ma, D. Baltimore, A. Hoffmann. Encoding NF-κB temporal control in response to TNF: distinct roles for the negative regulators IκBα and A20. Genes & Development. Vol. 22, pg. 2093-2101, 2008, https://doi.org/10.1101/gad.1680708. [↩]
- A. Adelaja, B. Taylor, K. M. Sheu, Y. Liu, S. Luecke, A. Hoffmann. Six distinct NFκB signaling codons convey discrete information to distinguish stimuli and enable appropriate macrophage responses. Immunity. Vol. 54, pg. 916-930.e7, 2021, https://doi.org/10.1016/j.immuni.2021.04.011. [↩]
- M. Son, A. G. Wang, H. L. Tu, M. O. Metzig, P. Patel, K. Husain, J. Lin, A. Murugan, A. Hoffmann, S. Tay. NF-κB responds to absolute differences in cytokine concentrations. Science Signaling. Vol. 14, pg. eaaz4382, 2021, https://doi.org/10.1126/scisignal.aaz4382. [↩]
- A. G. Wang, M. Son, E. Kenna, N. Thom, S. Tay. NF-κB memory coordinates transcriptional responses to dynamic inflammatory stimuli. Cell Reports. Vol. 40, pg. 111159, 2022, https://doi.org/10.1016/j.celrep.2022.111159. [↩]
- Q. J. Cheng, S. Ohta, K. M. Sheu, R. Spreafico, A. Adelaja, B. Taylor, A. Hoffmann. NF-κB dynamics determine the stimulus specificity of epigenomic reprogramming in macrophages. Science. Vol. 372, pg. 1349-1353, 2021, https://doi.org/10.1126/science.abc0269. [↩]
- J. Kim, K. M. Sheu, Q. J. Cheng, A. Hoffmann, G. Enciso. Stochastic models of nucleosome dynamics reveal regulatory rules of stimulus-induced epigenome remodeling. Cell Reports. Vol. 40, pg. 111076, 2022, https://doi.org/10.1016/j.celrep.2022.111076. [↩]
- A. G. Wang, M. Son, A. Gorin, E. Kenna, A. Padhi, B. Keisham, A. Schauer, A. Hoffmann, S. Tay. Macrophage memory emerges from coordinated transcription factor and chromatin dynamics. Cell Systems. Vol. 16, pg. 101171, 2025, https://doi.org/10.1016/j.cels.2025.101171. [↩]
- S. W. Smeal, C. S. Mokashi, A. H. Kim, P. M. Chiknas, R. E. C. Lee. Time-varying stimuli that prolong IKK activation promote nuclear remodeling and mechanistic switching of NF-κB dynamics. Nature Communications. Vol. 16, pg. 7329, 2025, https://doi.org/10.1038/s41467-025-62837-0. [↩]
- C. Kizilirmak, E. Monteleone, J. M. García-Manteiga, F. Brambilla, A. Agresti, M. E. Bianchi, S. Zambrano. Small transcriptional differences among cell clones lead to distinct NF-κB dynamics. iScience. Vol. 26, pg. 108573, 2023, https://doi.org/10.1016/j.isci.2023.108573. [↩]
- M. Heltberg, M. von Borries, P. M. Bendix, L. B. Oddershede, M. H. Jensen. Temperature controls onset and period of NF-κB oscillations and can lead to chaotic dynamics. Frontiers in Cell and Developmental Biology. Vol. 10, pg. 910738, 2022, https://doi.org/10.3389/fcell.2022.910738. [↩]
- C. A. Campbell, R. Calderon, G. Pavani, X. Cheng, R. Barakat, E. Snella, F. Liu, X. Peng, J. J. Essner, K. S. Dorman, M. McGrail, P. Gadue, D. L. French, R. Espin-Palazon. p65 signaling dynamics drive the developmental progression of hematopoietic stem and progenitor cells through cell cycle regulation. Nature Communications. Vol. 15, pg. 7787, 2024, https://doi.org/10.1038/s41467-024-51922-5. [↩]
- Y. Tang, A. Adelaja, F. X. Ye, E. Deeds, R. Wollman, A. Hoffmann. Quantifying information accumulation encoded in the dynamics of biochemical signaling. Nature Communications. Vol. 12, pg. 1272, 2021, https://doi.org/10.1038/s41467-021-21562-0. [↩]
- E. Trompouki, E. Hatzivassiliou, T. Tsichritzis, H. Farmer, A. Ashworth, G. Mosialos. CYLD is a deubiquitinating enzyme that negatively regulates NF-κB activation by TNFR family members. Nature. Vol. 424, pg. 793-796, 2003, https://doi.org/10.1038/nature01803. [↩]
- P. R. Elliott, D. Leske, J. Wagstaff, L. Schlicher, G. Berridge, S. Maslen, F. Timmermann, B. Ma, R. Fischer, S. M. V. Freund, D. Komander, M. Gyrd-Hansen. Regulation of CYLD activity and specificity by phosphorylation and ubiquitin-binding CAP-Gly domains. Cell Reports. Vol. 37, pg. 109777, 2021, https://doi.org/10.1016/j.celrep.2021.109777. [↩]
- V. Rinotas, K. Iliaki, L. Pavlidi, T. Meletakos, G. Mosialos, M. Armaka. Cyld restrains the hyperactivation of synovial fibroblasts in inflammatory arthritis by regulating the TAK1/IKK2 signaling axis. Cell Death & Disease. Vol. 15, pg. 584, 2024, https://doi.org/10.1038/s41419-024-06966-2. [↩] [↩]
- Y. C. Wu, B. H. Su, W. H. Cheng, C. T. Zou, E. T. H. Yeh, F. M. Yang. CYLD links the TRAF6/sNASP axis to TLR4 signaling in sepsis-induced acute lung injury. Cellular and Molecular Life Sciences. Vol. 82, pg. 124, 2025, https://doi.org/10.1007/s00018-025-05654-4. [↩]
- M. C. C. Lim, G. Maubach, M. Naumann. CYLD-TRAF6 interaction promotes ADP-heptose-induced NF-κB signaling in H. pylori infection. EMBO Reports. Vol. 26, pg. 3241-3263, 2025, https://doi.org/10.1038/s44319-025-00480-y. [↩] [↩]
- E. Schramm, V. Becker, I. Palagi, M. Müller, T. Rösler, F. Durak, A. Ebering, K. Karram, E. von Stebut, M. J. Schmeisser, A. Waisman. Constitutive expression of the deubiquitinating enzyme CYLD does not affect microglia phenotype or function in homeostasis and neuroinflammation. Journal of Molecular Medicine. Vol. 102, pg. 1381-1393, 2024, https://doi.org/10.1007/s00109-024-02489-7. [↩] [↩]
- R. J. Antonia, E. Karelehto, K. Toriguchi, M. Matli, R. S. Warren, L. M. Pfeffer, D. B. Donner. STAT3 regulates inflammatory cytokine production downstream of TNFR1 by inducing expression of TNFAIP3/A20. Journal of Cellular and Molecular Medicine. Vol. 26, pg. 4591-4601, 2022, https://doi.org/10.1111/jcmm.17489. [↩]
- O. Sheveleva, E. Protasova, T. Nenasheva, N. Butorina, V. Melnikova, T. Gerasimova, O. Sakovnich, A. Kurinov, E. Grigor’eva, S. Medvedev, I. Lyadova. A model of iPSC-derived macrophages with TNFAIP3 overexpression reveals the peculiarities of TNFAIP3 protein expression and function in human macrophages. International Journal of Molecular Sciences. Vol. 24, pg. 12868, 2023, https://doi.org/10.3390/ijms241612868. [↩]
- L. Zou, L. Sun, R. Hua, Y. Wu, L. Sun, T. Chen. Degradation of ubiquitin-editing enzyme A20 following autophagy activation promotes RNF168 nuclear translocation and NF-κB activation in lupus nephritis. Journal of Innate Immunity. Vol. 15, pg. 428-441, 2023, https://doi.org/10.1159/000527624. [↩]
- Z. Meng, R. Xu, L. Xie, Y. Wu, Q. He, P. Gao, X. He, Q. Chen, Q. Xie, J. Zhang, Q. Yang. A20/Nrdp1 interaction alters the inflammatory signaling profile by mediating K48- and K63-linked polyubiquitination of effectors MyD88 and TBK1. Journal of Biological Chemistry. Vol. 297, pg. 100811, 2021, https://doi.org/10.1016/j.jbc.2021.100811. [↩]
- S. Layzell, A. Barbarulo, G. van Loo, R. Beyaert, B. Seddon. NF-κB regulated expression of A20 controls IKK dependent repression of RIPK1 induced cell death in activated T cells. Cell Death & Differentiation. Vol. 32, pg. 256-270, 2025, https://doi.org/10.1038/s41418-024-01383-6. [↩]
- C. Schultheiß, L. Paschold, A. N. Mohebiany, M. Escher, Y. M. Kattimani, M. Müller, P. Schmidt-Barbo, A. Mensa-Vilaró, J. I. Aróstegui, G. Boursier, C. de Moreuil, T. Hautala, E. Willscher, H. Jonas, N. Chinchuluun, B. Grosser, B. Märkl, W. Klapper, P. T. Oommen, K. Gössling, K. Hoffmann, G. Tiegs, F. Czernilofsky, S. Dietrich, A. Freeman, D. M. Schwartz, A. Waisman, I. Aksentijevich, M. Binder. A20 haploinsufficiency disturbs immune homeostasis and drives the transformation of lymphocytes with permissive antigen receptors. Science Advances. Vol. 10, pg. eadl3975, 2024, https://doi.org/10.1126/sciadv.adl3975. [↩]
- T. Lipniacki, P. Paszek, A. R. Brasier, B. Luxon, M. Kimmel. Mathematical model of NF-κB regulatory module. Journal of Theoretical Biology. Vol. 228, pg. 195-215, 2004, https://doi.org/10.1016/j.jtbi.2004.01.001. [↩] [↩]
- J. Jaruszewicz-Błońska, I. Kosiuk, W. Prus, T. Lipniacki. A plausible identifiable model of the canonical NF-κB signaling pathway. PLOS ONE. Vol. 18, pg. e0286416, 2023, https://doi.org/10.1371/journal.pone.0286416. [↩] [↩]
- X. Guo, A. Adelaja, A. Singh, R. Wollman, A. Hoffmann. Modeling heterogeneous signaling dynamics of macrophages reveals principles of information transmission in stimulus responses. Nature Communications. Vol. 16, pg. 5986, 2025, https://doi.org/10.1038/s41467-025-60901-3. [↩]
- E. R. Bozich, X. Guo, J. L. Wilson, A. Hoffmann. A computational workflow for assessing drug effects on temporal signaling dynamics reveals robustness in stimulus-specific NFκB signaling. PLOS Computational Biology. Vol. 21, pg. e1013344, 2025, https://doi.org/10.1371/journal.pcbi.1013344. [↩]