
Abstract
Glioblastoma (GBM), the most aggressive brain malignancy in adults, characterized by heterogeneity, which contributes to poor prognosis and therapy resistance. The heterogeneity of GBM tumors is evident in unique gene expression profiles. Among the biological factors contributing to heterogeneity, cellular stemness plays a pivotal role in tumor recurrence and therapy refractoriness. Consequently, stemness has emerged as a potential therapeutic target. This observational bioinformatics study aimed to identify genes transcriptionally aligned with telomerase reverse transcriptase (TERT), a key determinant of cellular immortality, and to assess its associations with stemness pathways in GBM. To evaluate transcriptomic associations and prognostic relevance, mRNA and protein interaction datasets from publicly available databases were analyzed using Pearson correlation, protein-protein networks, transcription factor identification, and survival analysis. Results showed TERT was significantly elevated in glioblastoma compared with normal tissue (log₂ fold change = 4.37; Wilcoxon rank-sum p-value=0.0018). Correlation analysis identified 149 genes associated with TERT ( ), including WNT1 and SHH. Possible network connectivity was furthered by protein-protein interaction mapping. Additionally, 41 shared transcription factors were identified among TERT, SHH, and WNT1 using a cutoff of p<0.001 (Tukey’s HSD), 19 of which were significantly up/down regulated TFs (FDR < 0.05 and |log2FC| ≥ 1). Survival analysis revealed that high expression of these three genes was associated with reduced overall survival in classical GBM. These findings suggest a possible correlative link between TERT and developmental signaling pathways in GBM, supporting further investigation of TERT as a candidate biomarker of tumor heterogeneity. Keywords: glioblastoma [GBM], bioinformatics, stem cell, telomerase reverse transcriptase [TERT], sonic hedgehog [SHH], wingless and int-1 [WNT1]
Keywords: glioblastoma [GBM], bioinformatics, stem cell, telomerase reverse transcriptase [TERT], sonic hedgehog [SHH], wingless and int-1 [WNT1]
Introduction
Glioblastoma (GBM) is the most aggressive adult brain malignancy, with a median overall survival (OS) of approximately 15 months¹. Currently, standard treatment comprises surgical resection and subsequent adjuvant chemotherapy, with TMZ (temozolomide) being preferred1. Despite initial tumor shrinkage with this application, DNA repair, stem cell renewal, and stemness have been implicated as major contributors to resistance. Such therapeutic resistance and near-universal tumor recurrence are primary barriers to long-term disease control1,2,3.
Inter- and intratumoral heterogeneity are defining features of GBM, contributing to inconsistent therapeutic responses and poor clinical outcomes4. At the molecular level, GBM can be classified into three subtypes based on gene expression profiles: proneural, mesenchymal, and classical5. Each subtype is characterized by unique genomic alterations, tumor microenvironment interactions (TME), and signaling dependencies5,6. These subtypes not only differ in their biological drivers but also in their sensitivity to targeted therapies, highlighting the inadequacy of uniform treatment plans7,6. Recent single-cell and whole-tumor profiling further demonstrated that GBM tumors undergo dynamic evolution across diverse transcriptional cell states, reaffirming the concept that tumor plasticity underlies resistance and relapse8,9.
Within this heterogeneous landscape, glioblastoma stem cells (GSCs) have emerged as key contributors to tumor maintenance and therapy resistance. These cells possess self-renewal capacity and multipotency, facilitating adaptation to therapeutic stress and recurrence10,11. Consequently, stemness-associated pathways have become a growing area of interest as potential therapeutic vulnerabilities.
Multiple regulatory pathways converge to maintain a stem-like state, notably telomere-associated mechanisms. Telomeres, the repetitive DNA sequences that cap chromosome ends, typically shorten with each cell division, thereby limiting proliferative potential12. Telomerase, a ribonucleoprotein, adds telomeric repeats and contributes to malignant transformation13,14. Telomerase reverse transcriptase (TERT), the catalytic subunit of telomerase, is frequently upregulated in GBM, often through promoter mutations15. Subsequently, TERT is best known for its role in telomere maintenance; however, increasing evidence suggests that TERT contributes to broader oncogenic processes through non-canonical functions, including proliferation, apoptosis, cell cycle control, and the formation of tumor-initiating cells16.
Additionally, developmental signaling pathways such as Wnt/β-catenin and Sonic Hedgehog (SHH) are closely linked to stem cell maintenance and cancer progression17,18. In the tumor microenvironment (TME), the WNT signaling network governs vital cancer-related processes, including dormancy, therapeutic resistance, immune evasion, proliferation, and stemness19. Expression of Wnt1 (a ligand in the canonical Wnt/β-catenin cascade) along with β-catenin and Cyclin D1was associated with malignancies, in which Wnt1 and Cyclin D1 were significantly correlated20. Mutations and deregulation of the SHH pathway are essential for proliferation and differentiation, promoting tumorigenesis or accelerating tumor growth18. Additionally, SHH signaling has been identified as a key player in the canonical pathway; crosstalk with other pathways can contribute to relapse, invasion, metastasis, and potentially to TMZ resistance21,22.
Despite growing recognition of stemness as a key driver of GBM heterogeneity, therapeutic resistance, and tumor recurrence, the specific genes and signaling pathways responsible for these processes remain not fully understood. In particular, the regulatory associations among TERT and developmental signaling pathways in GBM have not been fully characterized.
The objective of this study was to identify genes and signaling pathways transcriptionally associated with stemness in GBM and to explore potential convergence between these regulatory networks and known regulators of plasticity. In doing so, we utilized publicly available datasets and bioinformatics tools to investigate potential associations among TERT, SHH, and WNT1.
This study focuses on identifying transcriptomic correlations, network interactions, and survival implications, so several limitations should be considered when interpreting these results. Data from TCGA reflect mRNA expression levels, which cannot establish causation or protein-level activity. Additionally, tumor and normal samples are unevenly represented, and survival groupings rely on platform-specific expression cutoffs. As in many bioinformatics studies, a large, more balanced cohort will be needed to improve statistical power and generalizability of the findings. Even with these limitations, this analysis may provide insight into potential interactions between telomerase and stemness-associated signaling pathways in GBM.
Materials & Methods
Research Design
This study applied an observational bioinformatics research design, utilizing publicly available datasets. Gene expression data from The Cancer Genome Atlas (TCGA) were analyzed to evaluate associations among TERT and stemness-associated genes in GBM. Protein-protein mapping and transcription factor enrichment analyses were integrated to characterize network associations. Survival analyses were then performed to assess associations between gene expression levels and general survival across GBM subtypes. All findings are derived from computational analysis of existing datasets.
The study workflow consisted of the following steps: (1) retrieval of transcriptional and clinical data from public databases, (2) identification of genes positively correlated with TERT expression, (3) network and transcription factor enrichment analysis to identify regulatory relations, and (4) survival analysis to evaluate clinical significance.
Data Retrieval
The mRNA expression data for TERT were extracted from the FireBrowse23 Gene Expression tool (v1.140), which uses RSEM v1.3.3 to quantify gene and isoform expression derived from RNA-Seq data. The TCGA_GBM HG-U133A database from GlioVis24, comprising 528 GBM samples (199 classical, 166 mesenchymal, and 163 proneural) and 10 non-tumor samples, was also used for gene expression and survival analyses. The HG-U133A and Agilent-4502A platforms are often compared to validate gene expression trends, for example, in the GlioVis database. However, the HG-U133A platform was preferred over the smaller sample sizes of Agilent-4502A (489 GBM and 10 non-tumor samples) and RNA-seq (156 GBM and 4 non-tumor samples). Expression values were log2-transformed as provided by the TCGA datasets. Samples with incomplete expression or survival data were excluded from analysis.
| Dataset/Platform | Source | Analysis Performed | Corresponding Figure(s) |
| FireBrowse (RNA-Seq v2) | TCGA Portal | TERT mRNA Expression | Figure 1 |
| TCGA-GBM (HG-U133A) | Microarray | TERT-SHH-WNT1 Corr., additional WNT ligand-TERT Corr., and Survival Modeling | Figure 3A, Figure 3B, Figure 3C, and Figure 3E Figure 5 |
| TCGA-GBM (Agilent-4502A) | Microarray | TERT-SHH-WNT1 Correlations | Figure 3D |
In the TCGA_GBM HG-U133A database, of the 88 samples originally classified as neural under the four-subtype scheme25, reclassification under the three-subtype scheme (which is what the GlioVis database utilizes) assigned the majority to classical (n=48, 55%), while the remaining were distributed across proneural (n=27, 31%) and mesenchymal (n=13, 15%). The redistribution is consistent with prior reanalysis of the neural subtype, which is not representative of distinct tumor intrinsic expression5. Additionally, the 10 non-tumor samples in the HG-U133A platform were not assigned a subtype in either the four- or three-subtype classification systems (denoted as NA); therefore, these samples do not correspond to the neural category.
Statistical Analysis
All statistical analyses were performed using GraphPad Prism26 and/or R (version 4.6.1)27.
Using Prism, Pearson correlation coefficients and linear regression were performed to assess similarities between gene expression levels and provide visualization. Genes with an r ≥ 0.3 (a conventional medium effect size threshold) relative to TERT expression were selected for downstream analysis28.
Survival analyses were performed in R using the survival package version 3.8-929. Survival differences between high and low expression groups in Kaplan-Meier curves were assessed using survdiff() for the log-rank and Gehan-Breslow-Wilcoxon tests. Data manipulation and organization were performed using dplyr version 1.2.130 and tidyr version 1.3.230. For multiple comparisons corrections, p-values were corrected using p.adjust() to report the Benjamini-Hochberg false discovery rate (FDR) in base R. HRs were calculated using the Cox proportional hazards model, coxph().
For transcription factor expression comparisons between GBM and non-tumor samples leading to the 41 TFs identified, Tukey’s HSD test was used. Further statistical analysis of TFs was generated using base R (median FC, log2FC, Wilcoxon rank-sum p-values, Welch p-values, and FDR-corrected p-values).
Statistical significance was defined as p<0.05 unless otherwise specified.
| Package used | Functions used | What was generated |
| survival | Surv( ), survdiff( ), survfit( ), coxph() | Log-rank test, Gehan-Breslow-Wilcoxon p-values, numbers-at-risk tables |
| dplyr | filter(), mutate(), select(), arrange(), inner_join(), bind_rows(), group_by(), ungroup() | Data cleaning |
| tidyr | pivot_longer() | Reformatting data for multiple-testing correction |
| base R | p.adjust(method = “BH”), pchisq(), median(), sprintf() | FDR (Benjamini-Hochberg) correction; p-value calculations, and general formatting |
Clustering of Genes Positively Correlated with mRNA Expression of TERT
GlioVis was used to identify genes with a median r-value cutoff of 0.3 or higher. The results were then fed into STRING v12.031 to generate a protein-protein interaction map and assign confidence scores to interactions. STRING utilizes “genomic context predictions, high-throughput lab experiments, (conserved) co-expression, automated text mining, and previous knowledge in databases” to produce an output of gene interactions. The breakdown of confidence scores is between “neighborhood in the genome, gene fusions, co-occurrence across genomes, co-expression, experimental/biochemical data, associated in curated databases, and co-mentioned in PubMed abstracts”. The total score is calculated by probabilistically combining evidence based on the likelihood that a protein association exists according to the type of evidence; also, the prior probability that protein association is occurring by chance is removed from the final score. STRING has currently determined this value to be 0.041. Scores range from 0.150-0.999 and are quantified accordingly:
Highest confidence level: score ≥ 0.900
High confidence level: score ≥ 0.700
Medium confidence level: score ≥ 0.400
Expression Analysis
The FireBrowse expression profile tool was used to identify the cancer type with the highest TERT expression, quantified as RNA-Seq by Expectation Maximization (RSEM) values.
Then, pairwise gene expression relationships among TERT, SHH, and WNT1, as well as TERT correlation with additional WNT ligands (WNT3, WNT6, WNT5A, WNT7B), were analyzed using expression data obtained from the TCGA_GBM HG-U133A dataset; however, correlation analyses were restricted to tumor samples (n=528) to avoid confounding by the imbalanced representation of the non-tumor tissue (n=10). Expression values were then imported into GraphPad Prism for correlation analysis and graphical visualization. Pearson correlation coefficients (r) were calculated to assess the strength and direction of the association between gene pairs. Statistical significance was determined using a two-tailed Pearson correlation with a 95% CI and was reported in a GP style as follows: 0.1234 (ns), 0.0332 (*), 0.0021 (**), 0.0002 (***), 0.0001 (****).
Transcription Factor Identification
Common transcription factors (TFs) shared among TERT, SHH, and WNT1 in Homo sapiens were determined using TFLink32 databases: GTRD33 v20.06 and ReMap34 v1.2. Initially, individual transcription factor lists for each gene were compiled and compared to identify overlapping transcription factors. Shared transcription factors were then analyzed for differential expression between GBM and tumor samples using GlioVis and Tukey’s HSD test. Transcription factors were filtered twice. The first filtering used a significance cutoff of p<0.05, which resulted in 99 TFs, so a more stringent cutoff of p<0.001 was applied and resulted in 41 TFs.
Differential Expression Analysis
To verify TERT fold change and evaluate TFs, normalized RSEM gene expression values of the TCGA GBM cohort were obtained from FireBrowse (153 GBM tumor and 5 normal tissue samples). Samples were classified as tumor or normal tissue based on TCGA barcode sample type codes. FC was calculated as the ratio of the median normalized expression in tumor vs. normal samples (the median was used instead of the arithmetic mean to reduce sensitivity to outliers, given the small normal tissue cohort). Statistical significance was assessed using the Wilcoxon sum-rank test (appropriate given the small normal tissue cohort and therefore inability to meet the normality assumption); however, p-values from the Wilcoxon test were bounded given the small sample size, resulting in many genes reaching an identical minimum achievable FDR = 9.1×10⁻⁴. Conversely, Welch’s t-test on log2-transformed expression values isn’t bounded and is therefore used for visualization, while Wilcoxon rank-sum values are the ones reported and used for interpretation. Given the small sample size, a Benjamini-Hochberg FDR was applied to all p-values, which were then -log10 transformed for visualization.
Survival Analysis
The Kaplan-Meier curves between high and low gene expression in classical GBM, based on TCGA_GBM HG-U133A, were generated in Prism. R was used to generate the-numbers-at risk table and all p-values. High and low expression stratification was determined by median log2 expression cutoffs (TERT=4.13, SHH=3.79, WNT1=3.42). Using Kaplan-Meier analysis and the log-rank test, the differences between groups with different expression levels were assessed for statistical significance (the Gehan-Breslow-Wilcoxon test was used as a secondary method, as the log-rank test weighs all points evenly). Additionally, an FDR correction was applied to all p-values. Asymmetrical 95% confidence intervals were plotted as well. Hazard ratios (HR) were obtained from GlioVis, which utilized the Cox proportional hazards model in the R survival package. Tumor vs. non-tumor and GBM subtypes’ histologies were directly derived from GlioVis’ expression tool. Overall survival was used as the clinical endpoint.
Results
Pancancer mRNA Expression Analysis Shows TERT is Significantly Upregulated in GBM
TERT mRNA expression was analyzed across 37 individual cancer types (24 upregulated, 0 downregulated, 1 no change, and 12 with no data). GBM exhibited the highest upregulation; the median RSEM log2 value in tumor samples (n=147) is 3.14, compared to -1.23 in normal samples (n=3). This corresponds to a log2 fold change of 4.37, or a 20.7-fold increase (Fig. 1). This finding was independently confirmed by direct analysis of the underlying RSEM-normalized expression matrix (median FC=20.4; Wilcoxon rank-sum p-value=0.0018; Wilcoxon FDR-adjusted=0.0030).
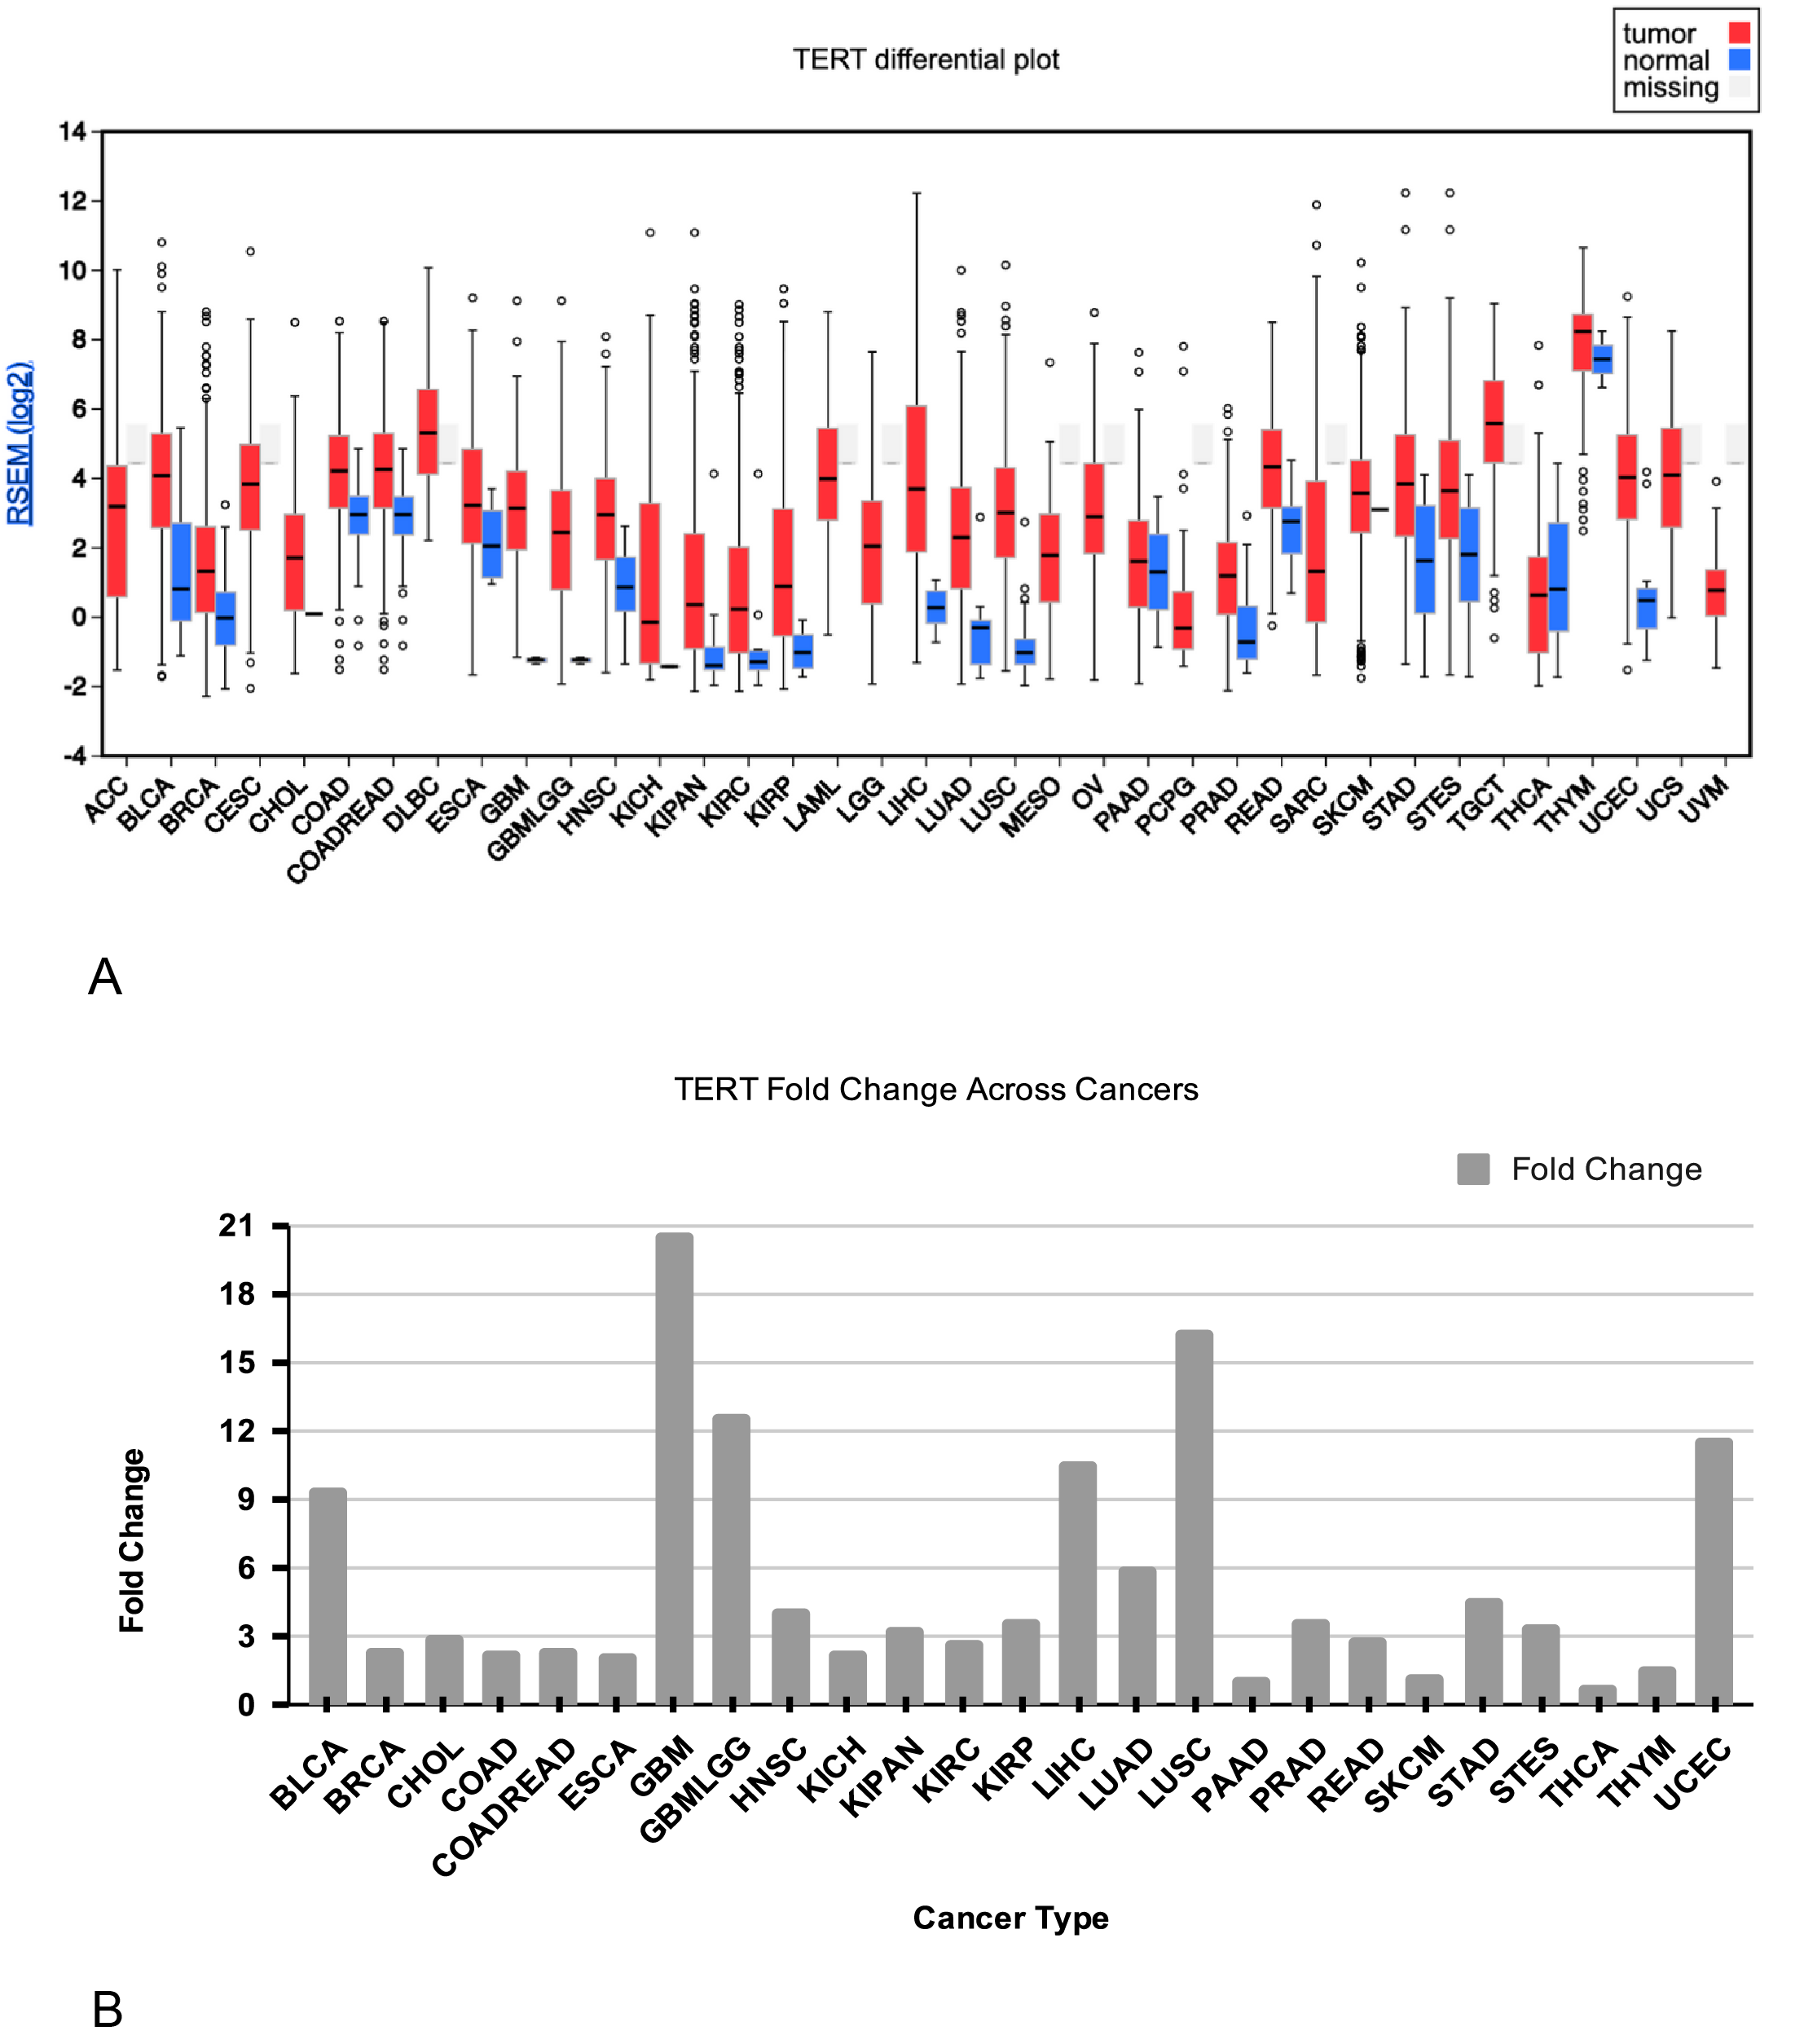
Abbreviations: ACC, Adrenocortical Carcinoma; BLCA, Bladder Urothelial Carcinoma; BRCA, Breast Invasive Carcinoma; CESC, Cervical Squamous Cell Carcinoma and Endocervical Adenocarcinoma; CHOL, Cholangiocarcinoma; COADREAD, Colorectal adenocarcinoma; DLBC, Lymphoid Neoplasm Diffuse Large B-Cell Lymphoma; ESCA, Esophageal Carcinoma; GBM, Glioblastoma Multiforme; GBMLGG, Glioblastoma Multiforme and Lower-Grade Glioma; HNSC, Head and Neck Squamous Cell Carcinoma; KICH, Kidney Chromophobe; KIPAN, Kidney Pan-Cancer Cohort; KIRC, Kidney Renal Clear Carcinoma; Kidney Renal Papillary Cell Carcinoma; LAML, Acute Myeloid Leukemia; LGG, Brain Lower Grade Glioma; LIHC, Liver Hepatocellular Carcinoma; LUAD, Lung Adenocarcinoma; LUSC, Lung Squamous Cell Carcinoma; MESO, Mesothelioma; OV, Ovarian Serous Cystadenocarcinoma; PAAD, Pancreatic Adenocarcinoma; PCPG, Pheochromocytoma and Paraganglioma; PRAD, Prostate Adenocarcinoma; READ, Rectum Adenocarcinoma; SARC, Sarcoma; SKCM, Skin Cutaneous Melanoma; STAD, Stomach Adenocarcinoma; STES, Esophagogastric Cancer; TERT, telomerase reverse transcriptase; TGCT, Testicular Germ Cell Tumors; THCA, Thyroid Carcinoma; THYM, Thymoma; UCEC, Uterine Corpus Endometrial Carcinoma; USC, Uterine Carcinosarcoma; UVM, Uveal Melanoma.
TERT mRNA Expression is Positively Correlated with Stem-Related Genes
A total of 149 genes that we moderately correlated with TERT (r ≥ 0.3) were then entered into STRING to construct a protein interaction map (Fig. 2). The protein-protein map contains a subnetwork of TERT, SHH, and three WNT family members (WNT1, WNT3, and WNT6). SHH and WNT1 had the highest confidence score, 0.805. WNT3 and WNT6 were identified as members of a subnetwork in the protein-protein map; however, the score decomposition reveals that the association between any protein isn’t supported by direct experimental evidence in humans. Several SHH-containing protein pairs yielded experimental scores, but these were derived from homologous interactions observed in other organisms (interolog-based evidence transfer). Also, all the evidence breakdowns in Fig. 2B show that around 80-99% of the combined score is attributed to text-mining; glioma-relevant literature is 28% for the TERT-SHH interaction, 3% in SHH-WNT1, 0% in SHH-WNT3, and 5% in SHH-WNT6. While WNT3-WNT6-WNT1 associations aren’t particularly relevant, if reviewed, a fixed-database score of 0.500 corresponds to shared canonical Wnt-signaling pathway resources (Fig. S2).
Correlation analysis yielded significant positive correlations (p<0.0001) among TERT, SHH, and WNT1 (Fig. 3). SHH and WNT1 showed the strongest correlation (r=0.4591), followed by TERT and WNT1 (r=0.3089), and TERT and SHH (r=.3083).
The same analysis was performed using the TCGA_GBM LGG dataset; however, SHH and WNT family members were not among the genes that met the cutoff in low-grade glioma. To evaluate whether WNT1 was representative of the WNT pathway and TERT correlations, we compared it with WNT3, WNT5A, and WNT7B, which have been more commonly reported as overexpressed in GBM literature35,36. WNT5A showed no positive correlation with TERT (r=-0.11), and WNT7B (r=0.18) didn’t meet the r ≥ 0.3 cutoff (Fig. 3E).
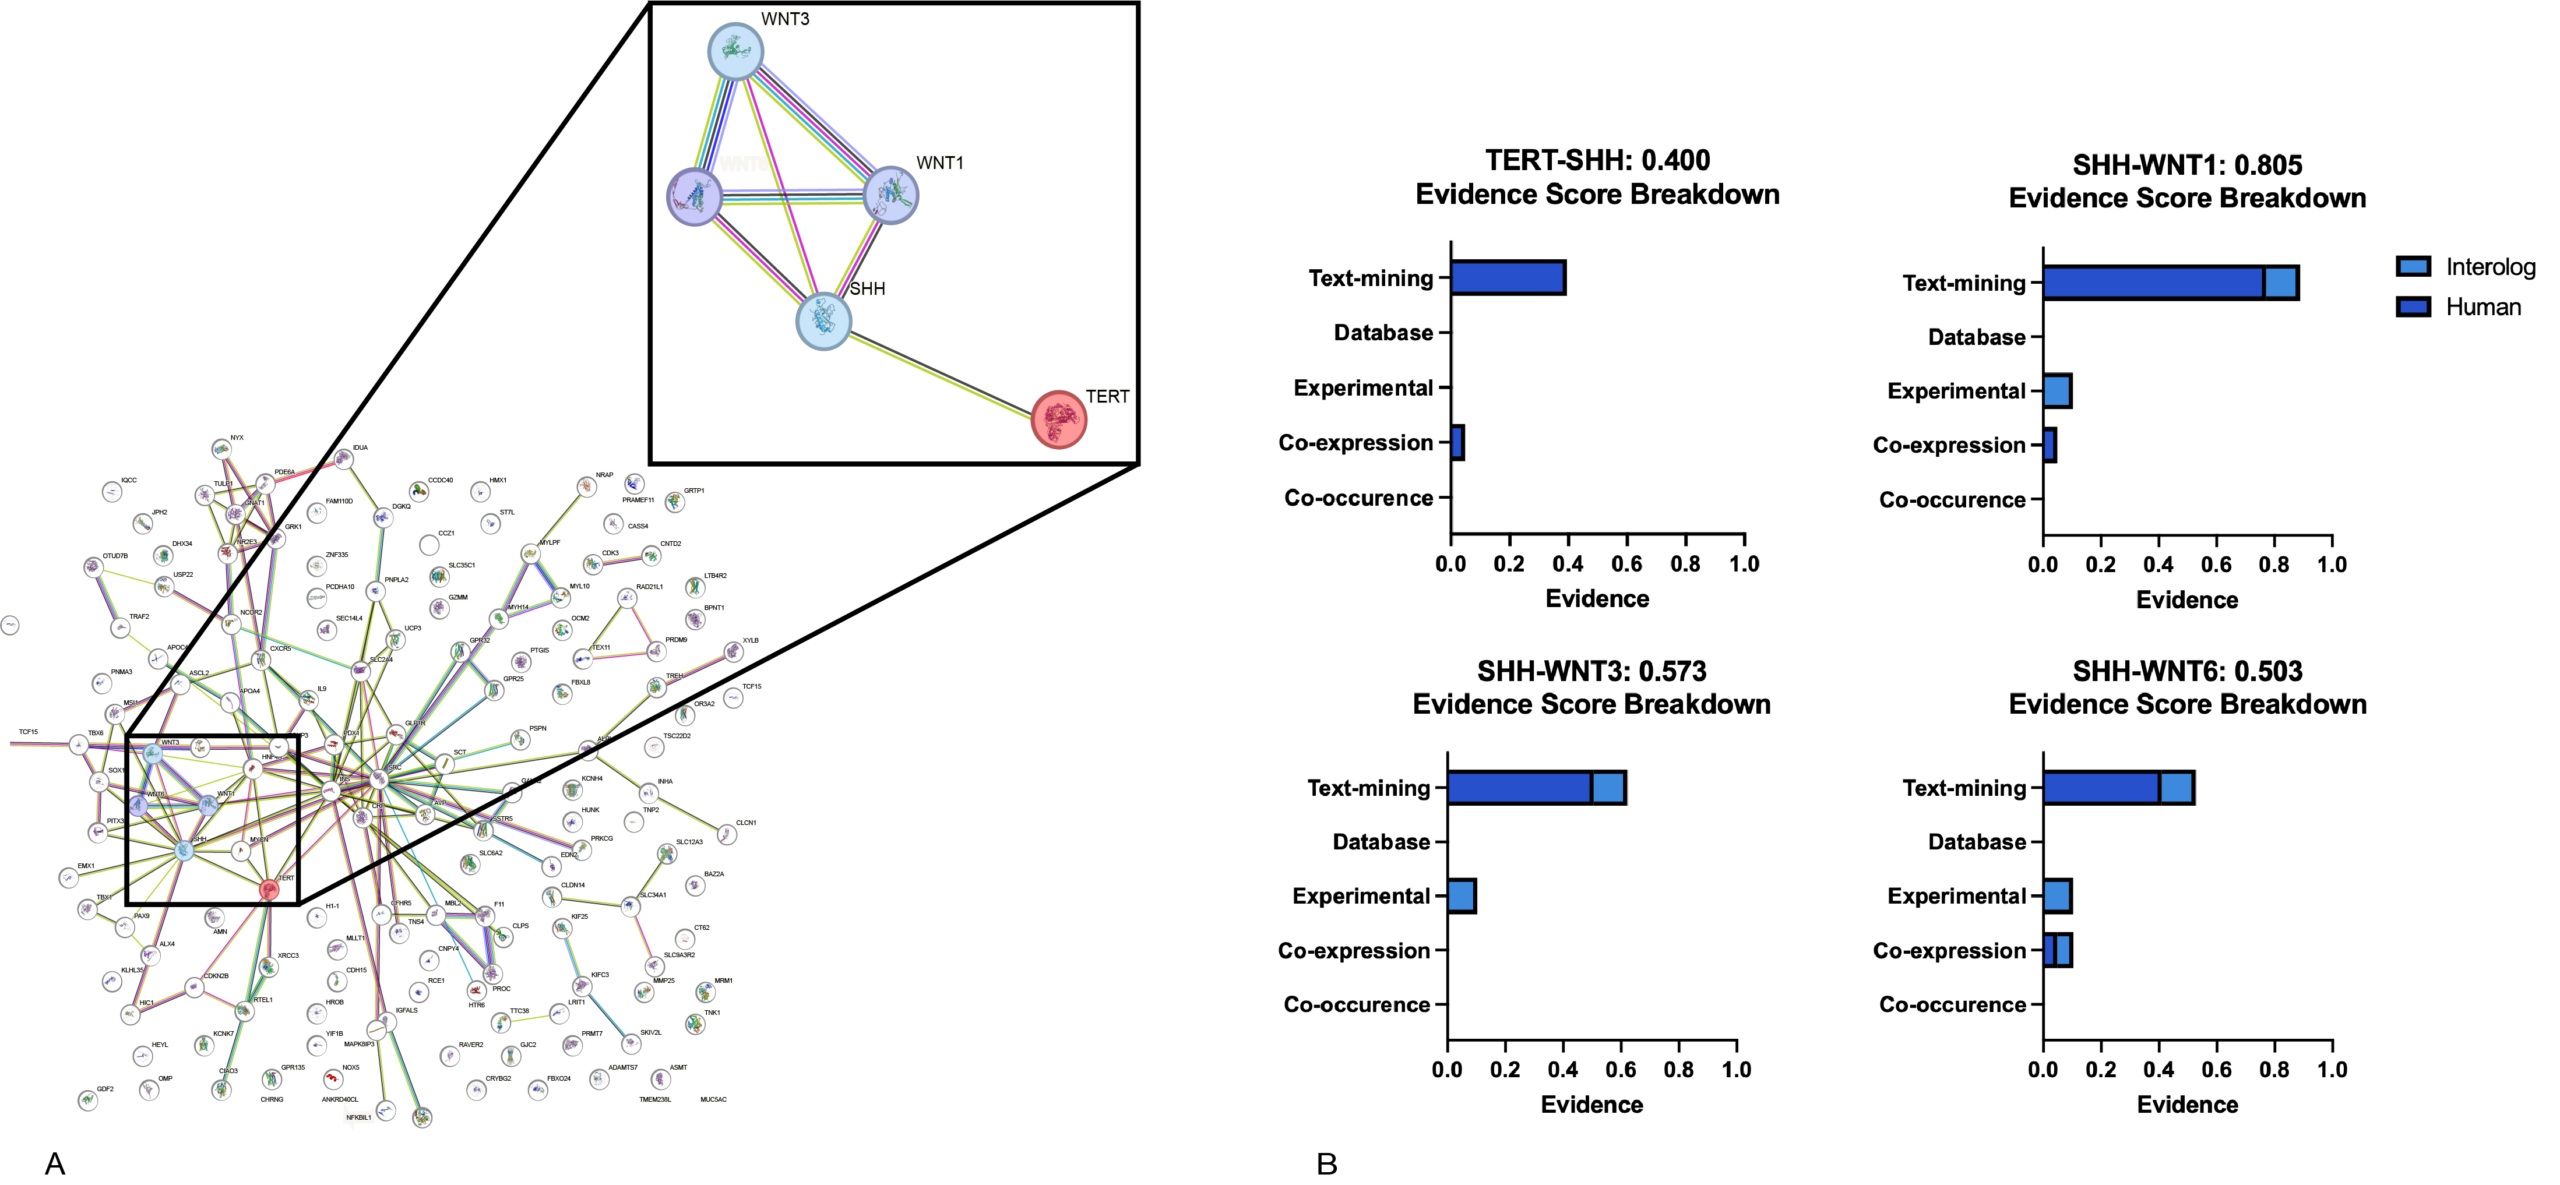
[A] Proteins positively correlated with TERT (r ≥ 0.3) were constructed into a network using STRING, with a minimum interaction confidence score of 0.4. Also, disconnected nodes were removed for clarity. The enlarged inset highlights the subnetwork interactions of TERT, SHH, WNT1, WNT3, and WNT6. The connecting cords categorize different sources of interaction evidence, as defined by STRING. [B] The confidence score in the titles is the combined evidence suggesting a correlative link, which is further decomposed by the bar graph into: text-mining, database, experimental, co-expression, and co-occurrence-based evidence.
Abbreviations: SHH, sonic hedgehog; WNT1, WNT family member 1; WNT3, WNT family member 3; WNT6, WNT family 6.
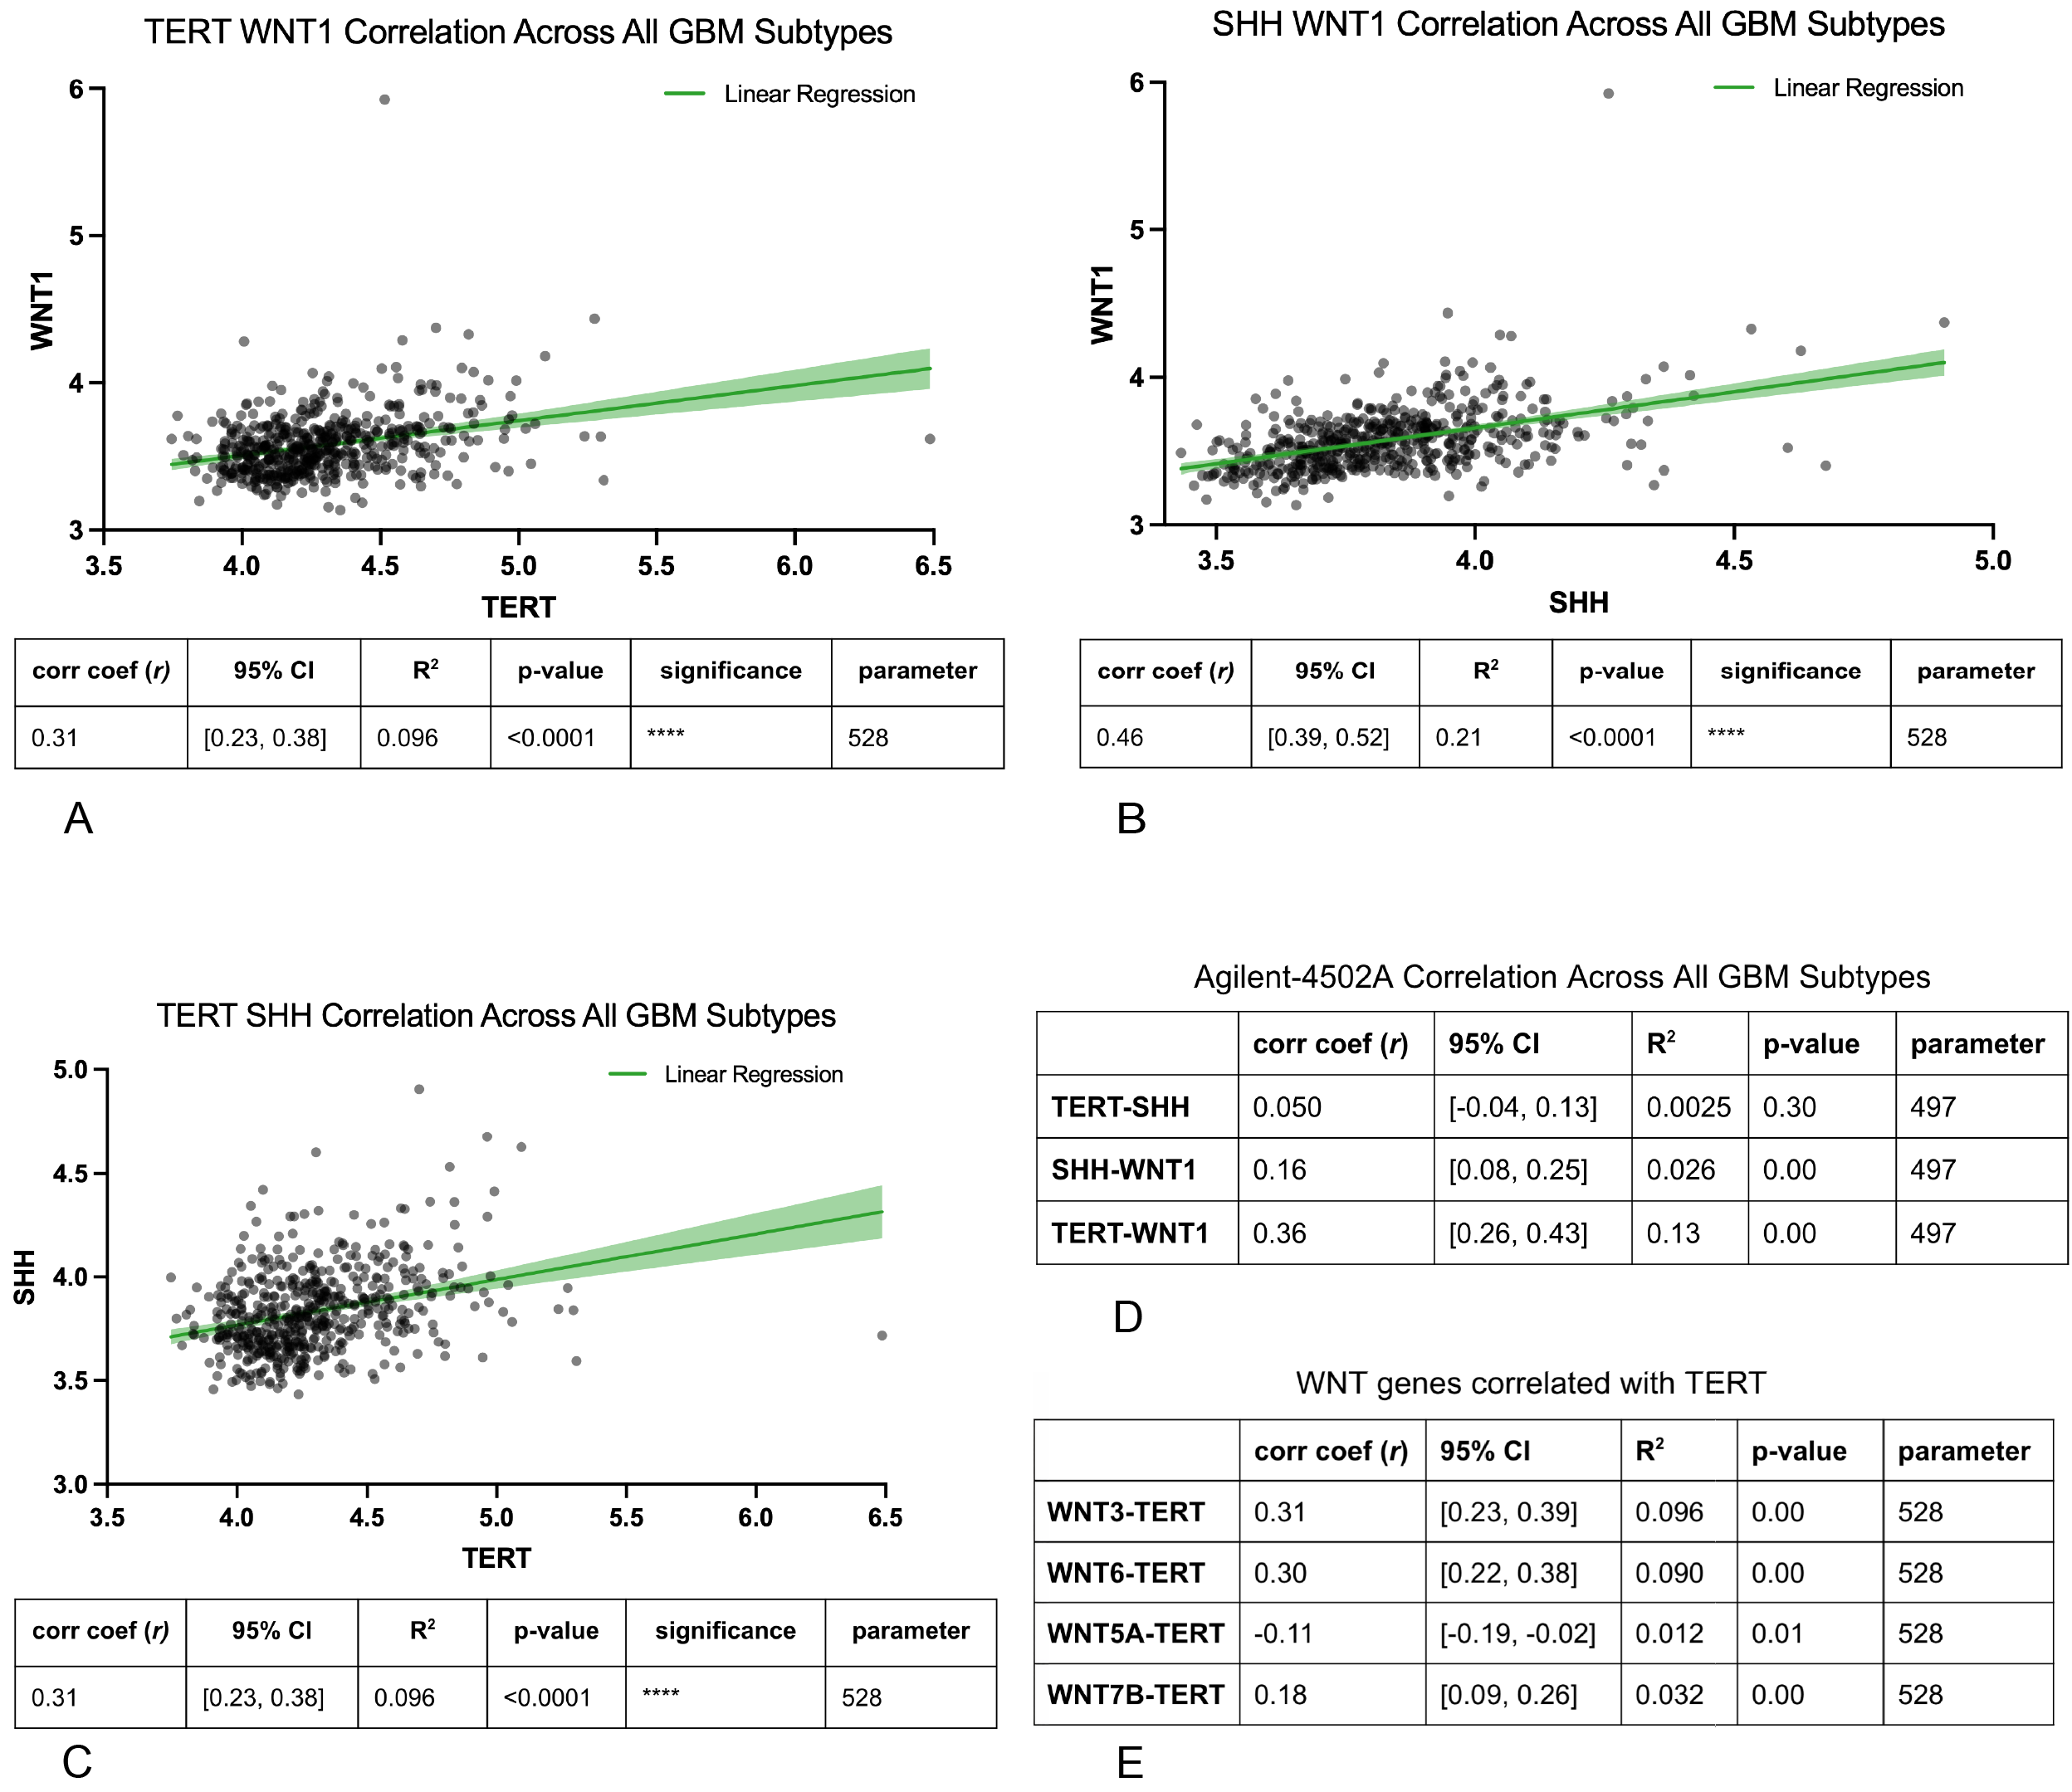
[A-C] Scatterplots showing pairwise expression correlations among TERT, SHH, and WNT1 from the TCGA_GBM HG-U133A dataset. Each point represents an individual sample. The solid lines represent linear regression, and the shaded regions around them indicate the 95% confidence interval. Below each graph are the corresponding statistics. [D] Correlation coefficients, confidence intervals, and p-values of pairwise expression correlations among TERT, SHH, and WNT1 from the Agilent-4502A dataset are shown in table format. [E] Correlation coefficients, confidence intervals, and p-values of WNT3, WNT6, WNT5A, and WNT7B correlated with TERT in table format. Graphs and tables use data derived from the TCGA_GBM HG-U133A dataset unless specified otherwise. Across both datasets, correlation coefficients (r) range from -1 to 1, and p<0.05 is considered statistically significant. Significance was reported as follows: 0.1234 (ns), 0.0332 (*), 0.0021 (**), 0.0002 (***), 0.0001 (****).
Convergent Transcriptional Regulators Suggest Potential Regulatory Associations Relevant to Tumor Plasticity
A total of 133 transcription factors were identified as shared among TERT, SHH, and WNT1. Of these, 55 were not significantly expressed, and 14 were unavailable in the dataset. The remaining 64 transcription factors showed significant differential expression (p<0.05), and 41 are highly significant (p<0.001) in the preliminary screen.
The differential expression of the 41 candidate transcription factors was assessed between GBM tumor and normal tissue using the Wilcoxon rank-sum test with Benjamini-Hochberg FDR correction (Fig. 4). Thirty-one transcription factors were significantly upregulated, and 3 were significantly downregulated in GBM (FDR < 0.05). Transcription factors ZBTB7A, SREBF2, MYC, TCF12, TP53, AR, EZH2, and E2F8 were significantly up/down regulated and yielded a |log2FC| ≥ 1. Full fold-change and significance values of the 41 TFs can be found in Table S1.
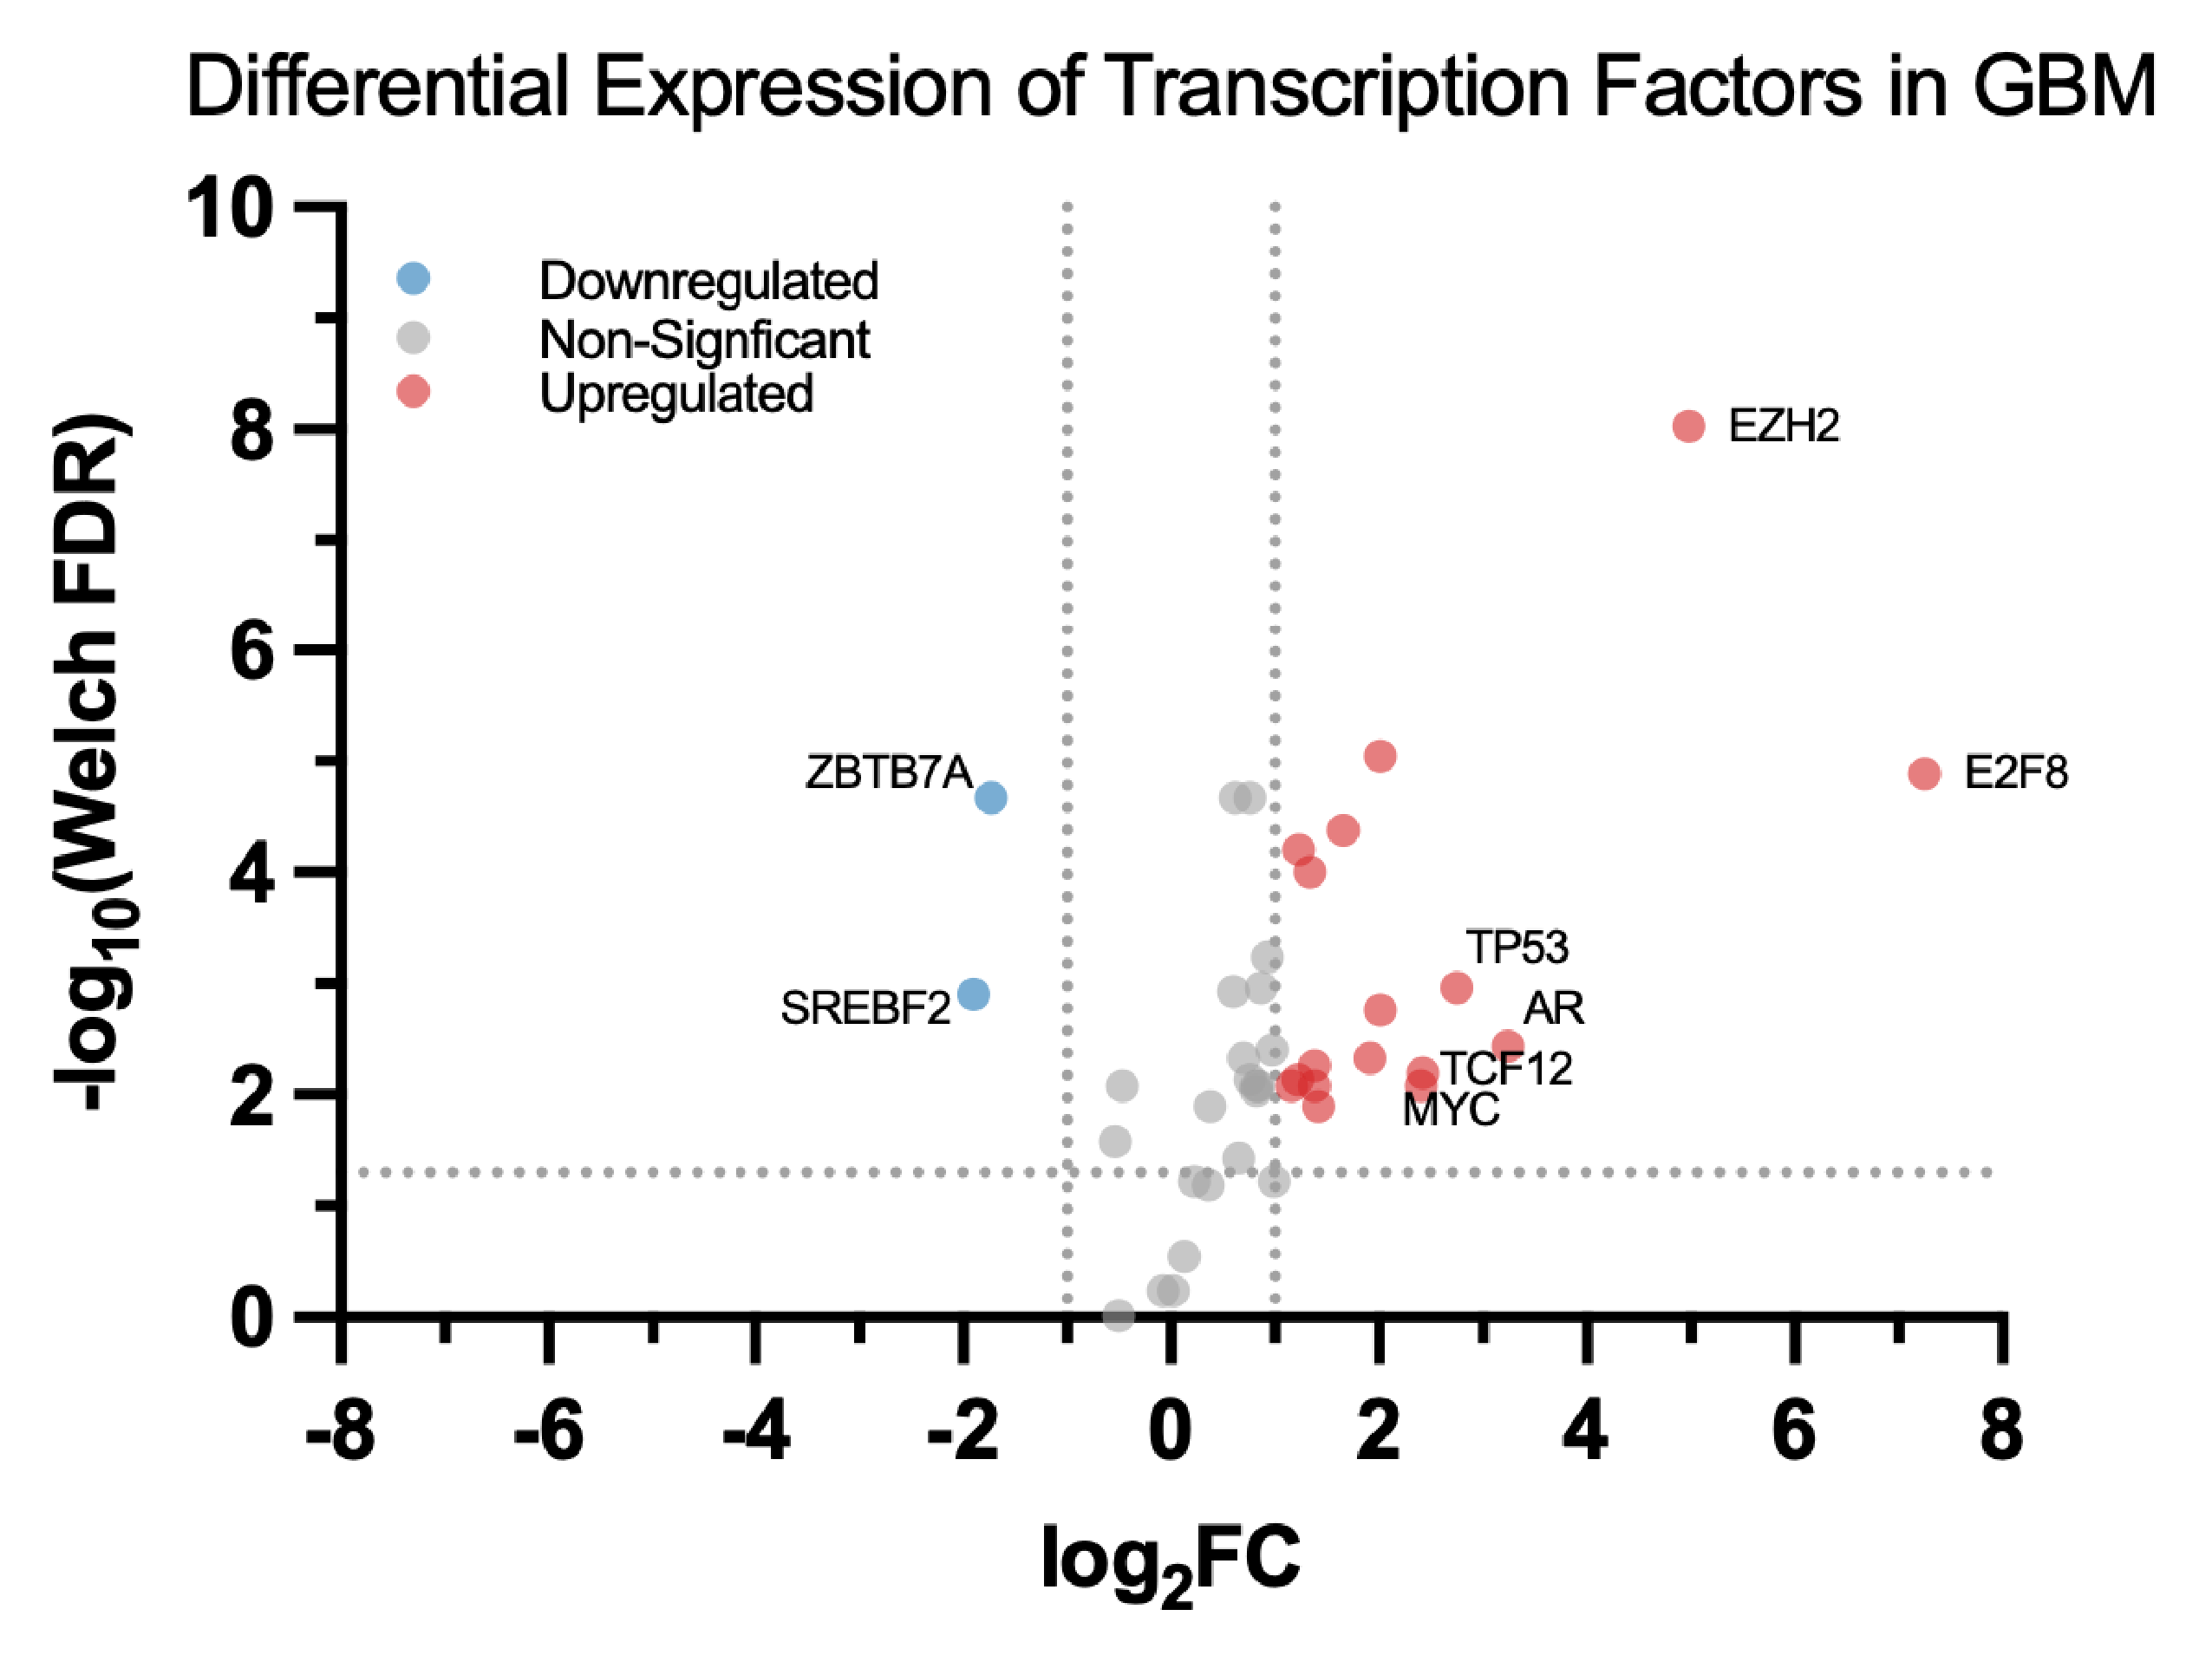
Volcano plot displaying median log2 fold change (x-axis) and -log10 transformed Welch’s t-test FDR (y-axis) for 41 transcription factors. Welch’s t-test is shown for improved visual resolution; the Wilcoxon rank-sum test was used as the primary significance test given the small cohort of normal tissue. Dotted lines at y=1.3, x=-1, and x=1 indicate the thresholds for statistical significance (FDR < 0.05 corresponding to -log10(0.05)=1.3) and removal of noisy expression changes (|log2FC| ≥ 1, corresponding to a ≥ 2-fold change). The six transcription factors with the greatest fold-change magnitude, along with the two downregulated TFs, were labelled.
Abbreviations: SREBF2, sterol regulatory element binding transcription Factor 2; ZBTB7A, zinc finger and BTB domain containing 7A; MYC, MYC proto-oncogene, bHLH transcription factor; TCF12, transcription factor 12; TP53, tumor protein p53; AR, Androgen receptor; E2F8, early region 2 transcription factor 8.
Expression and Survival Outcomes of TERT, SHH, and WNT1
The Kaplan-Meier survival analysis assessed the correlation between gene expression and survival rates across the classical subtype. When evaluating TERT across all subtypes, the log-rank and Gehan-Breslow-Wilcoxon tests showed no significant difference (p=0.104 and p=.396, respectively; Table S2). However, within the classical subtype, high expression of all three genes was associated with significantly reduced survival compared with the low-expression groups (Fig. 5; Table S2).
Across all three genes, high-expression groups showed longer median overall survival (OS) compared to low-expression groups; the confidence intervals for high and low groups’ median OS showed narrow overlap.
Only SHH was significantly associated with OS across the full cohort (log-rank p=0.004, FDR p=0.038; Wilcoxon p=0.011, FDR p=0.038; HR=1.32, 95% CI: 1.09-1.59; Table S2), while TERT and WNT1 were not (Table S2). Specifically within the classical subtype, TERT and SHH yielded significant associations (log-rank p=0.008 and 0.013; both FDR p=0.38; HR=1.52 and 1.48, respectively). WNT1 showed nominal significance as it failed to survive the FDR correction (FDR log-rank p=0.071.
Cox proportional hazards analysis indicated poorer survival among patients with high expression levels for all three genes: TERT (HR=1.52, 95% CI: [1.11-2.08]), SHH (HR=1.48, 95% CI: [1.08-2.01]), and WNT1 (HR=1.36, 95% CI: [1.00-1.85]).
The log-rank and Gehan-Breslow-Wilcoxon tests yielded non-significant p-values for genes WNT3 and WNT6 (WNT3 log-rank p=0.468, Wilcoxon p=.366; and WNT6 p=0.819, Wilcoxon p=0.594), for which there are only minor differences in the survival curve distributions between the highly and lowly expressed groups (Fig. S1). This suggests that these WNT family members may be inconsequential for survival among classical GBM patients.
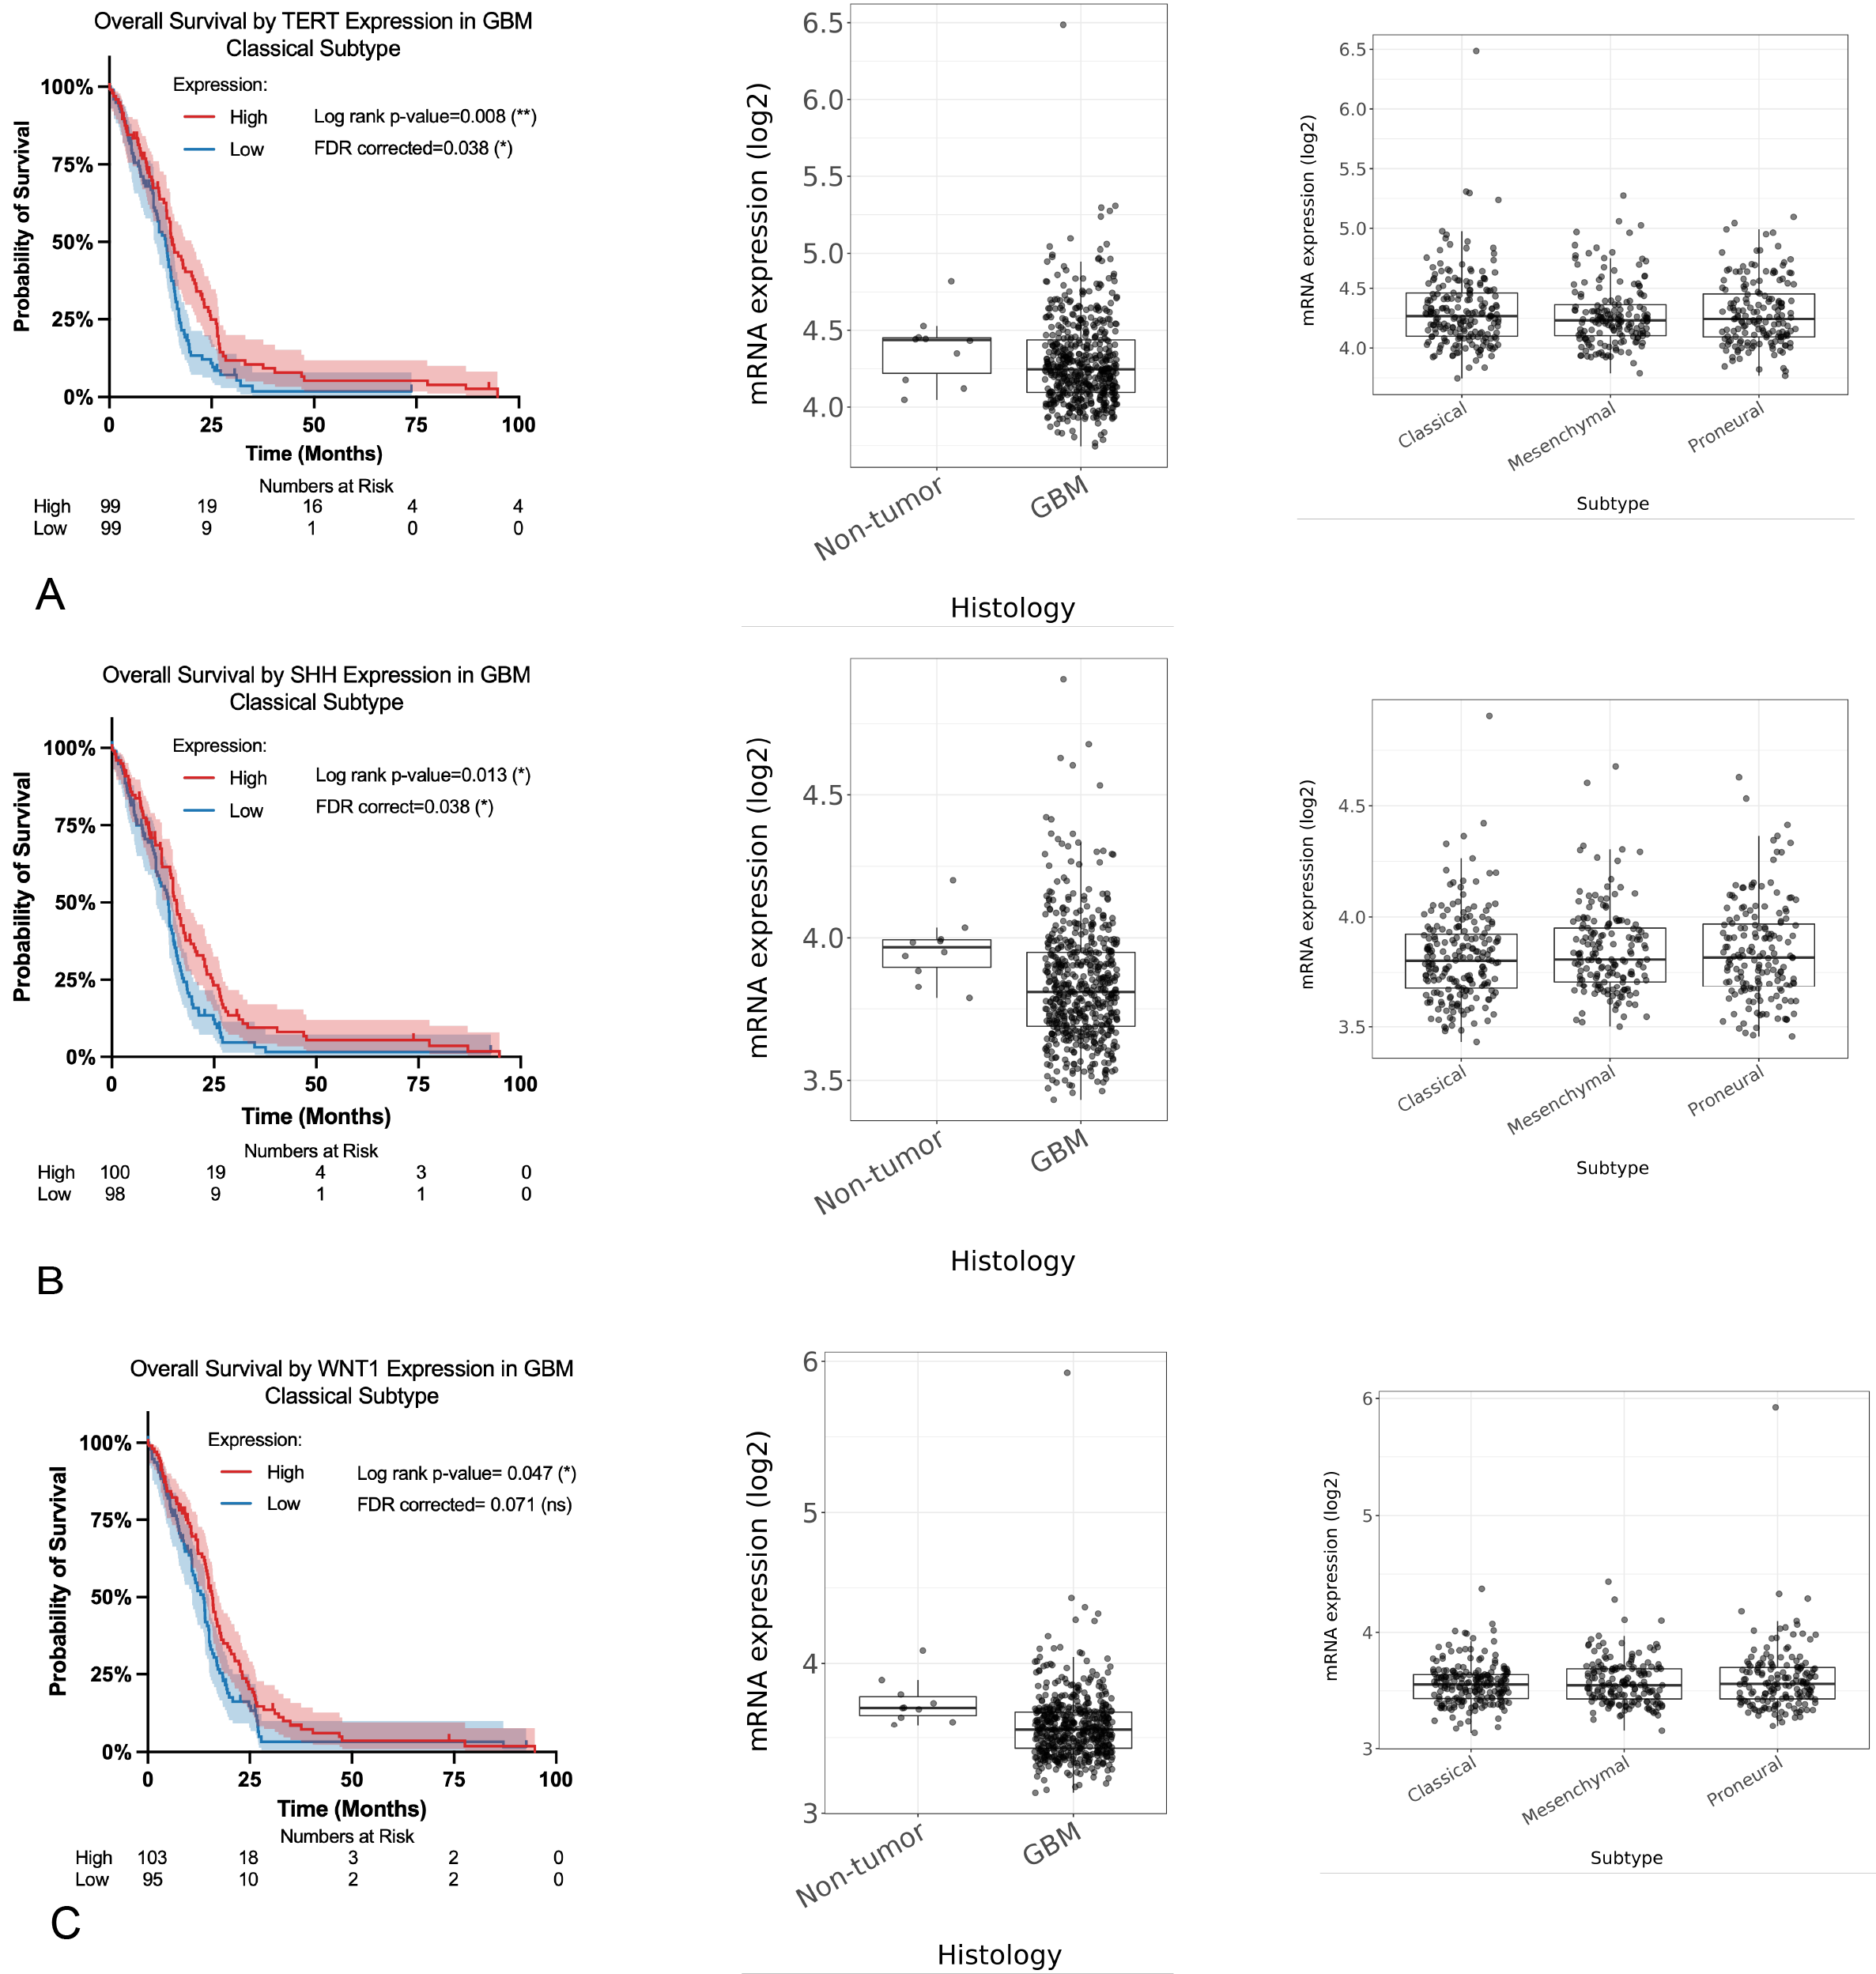
[A-C] Kaplan-Meier survival curves comparing patients with high (red) and low (blue) expression of TERT, SHH, and WNT1 using TCGA_GBM HG-U133A data. Statistical significance was evaluated using log-rank tests (p<0.05 was considered significant). Events, group sizes (n), HRs, 95% CI for HRs, median OS, 95% CI for median OS, and Gehan-Breslow-Wilcoxon p-values can be found in Table S2. Boxplots show mRNA expression levels across histology (non-tumor vs. GBM), further broken down by GBM subtype (classical, mesenchymal, and proneural).
Discussion
Bioinformatics studies aim to identify broader patterns by merging numerous biological datasets, yielding results that lay the foundation for experimental validation, improve reproducibility, and distinguish potential clinical applications. In this bioinformatics study, we aimed to analyze gene expression to identify potential transcriptomic correlations associated with stemness in cancer.
We showed that TERT, a known GBM regulator, was significantly upregulated in tumor tissue relative to normal controls (20.4-fold change in expression, Wilcoxon FDR-adjusted p=0.0030; Fig. 1). This is consistent with TERT having a role in GBM tumorigenesis and cellular immortality37. More specifically, reports of TERTp mutations in a large proportion of GBM cases reinforce the relevance of TERT expression in GBM38,39.
To explore potential connectivity with other cancer-relevant pathways, a protein-protein interaction network (Fig. 2) revealed a subnetwork involving TERT, SHH, and multiple WNT family members (WNT1, WNT3, WNT6); however, it should be interpreted as evidence of literature co-occurrence rather than validated functional interaction in glioma. Therefore, this network should be interpreted as a hypothesis-generating framework that highlights candidate genes for further investigation rather than confirmatory evidence.
Correlation analysis, used to quantify the degree of co-expression (Fig. 3), demonstrated a moderate positive relationship between TERT, SHH, and WNT1. The consistent correlation seen across datasets is compatible with, but doesn’t establish, shared regulatory influences. In particular, the observed correlation between SHH and TERT should not be treated as a proxy for Hedgehog pathway signaling; growing evidence indicates that in cancer, ligand-independent activation of HH-GLI signaling occurs through non-canonical mechanisms such as transcriptional activation of GLI40. Accordingly, the SHH-TERT correlation can be explained by convergent transcriptional regulation through shared upstream drivers. While WNT5A and WNT7B are more frequently reported as upregulated across GBM cohorts, neither showed a correlation with TERT comparable to that of WNT1 in the TCGA-GBM HG-U133A dataset (Fig. 3E). Therefore, the TERT-WNT1 association identified in this study is likely dataset-specific, and hypothesis generation from correlation should be validated independently before mechanistic interpretation.
As low-grade gliomas are precursors to GBM, an additional correlation analysis was performed on TERT, SHH, and WNT141. However, the low-grade gliomas didn’t show the same correlation patterns observed in GBM, which may indicate that the correlation among TERT, SHH, and WNT1 signaling becomes more prominent in higher-grade tumors or throughout tumor progression.
The volcano plot shows asymmetry in up- or down-regulation among the transcription factors, where a majority of significant TFs were upregulated with a log2FC>1 (17/19). This pattern suggests that if an overlapping transcriptional network between TERT, SHH, and WNT1 is validated, it may be characterized by TF activation.. The transcription factors with the largest fold change magnitudes include AR, TP53, TCF12, MYC, E2F8, and EZH2. The dysregulation of MYC and TP53 shown here is consistent with their well-documented roles in the proliferation and genomic stability of gliomas42,43. TCF12 also has a proliferative role in glioma by participating in cell cycle regulation and maintaining stemness in GSCs44. EZH2-mediated phosphorylation was shown to contribute to GSC self-renewal45,46. E2F8, which exhibited the largest fold change (log2FC=7.25), has also been identified as participating in the proliferation of GBM tumor cells and was previously linked to the WNT pathway47. While AR has been extensively researched in prostate cancer as a central driving force, its role in malignant gliomas remains a growing focus, with overexpression having been consistently identified48.
While survival analysis was primarily intended to assess clinical outcomes based on expression, it also provided additional insight into TERT, SHH, and WNT1 associations. Notably, the Kaplan-Meier survival analysis (Fig. 5) showed consistent differences between high- and low-expression groups across all genes analyzed, approximately 1.6-2.2 months. This consistency may suggest overlapping biology. Additionally, the analysis indicated that patients with high TERT expression were associated with increased risk of death, particularly in the classical subtype, suggesting that TERT may be prognostically relevant. The mRNA expression distributions further support these findings. Across the histology histogram, TERT expression was elevated in tumor samples compared to non-tumor controls. When further stratified by GBM subtype, expression patterns varied; however, the classical subtype showed consistently elevated levels. This subtype-specific expression pattern may help explain the stronger association of elevated TERT expression and reduced survival in classical GBM. The trends of SHH and WNT1 were similar yet less pronounced, suggesting that while these genes may contribute to tumor-associated pathways, their impact on survival may depend on interactions with TERT. However, SHH showed the most robust survival association after FDR correction across both test types in all cohorts tested (all and classical), whereas TERT, while surviving the log-rank correction, failed in the Wilcoxon correction. Since the Gehan-Breslow-Wilcoxon test weighs earlier event times more heavily, these effects may be driven by later separation. WNT1 failed to survive both corrections, suggesting it doesn’t directly impact patient prognosis; thus, overall these findings are hypothesis-generating.
While similar in Pearson correlation coefficients with TERT compared to WNT1, insignificant p-values of WNT3 and WNT6 in both the log-rank and Gehan-Breslow-Wilcoxon tests suggest that these WNT family members may be inconsequential regarding survival times. It may be worth noting that group sizes were relatively balanced in Kaplan-Meier curves across all three genes (TERT: 99/99; SHH: 109/98; WNT1: 103/95), reducing the likelihood that differences in confidence interval widths across genes are due to sample size imbalance.
These results suggest that, in GBM, TERT plays a role beyond its function as a telomerase catalytic subunit, through the intersection of developmental and oncogenic signaling pathways, correlating to transcriptional and prognostic implications.
However, we acknowledge several limitations in interpreting these results. This study relies on the TCGA database, which reports mRNA expression but does not reflect protein abundance or activity, potentially skewing observed trends. Moreover, the sample size distribution in Fig. 1 shows an uneven distribution of GBM tissue relative to normal tissue, which can reduce statistical power and bias the median expression. Causation cannot be drawn from correlation in Fig. 3, so an experimental approach would be necessary to establish functional connections. This study also relies on p-values across a large number of comparisons, especially the analysis identifying 149 TERT-associated genes and 41 shared transcription factors; consequently, simultaneous testing elevates the risk of false positive associations. Multiple testing correction (Benjamini-Hochberg FDR) was used to try to mitigate false positives. Fig. 4 is also based on TFLink, which integrates ChIP-seq data across diverse cell and tissue types; therefore, predicted TF overlap may not reflect brain- or GBM-specific relationships. In Fig. 5, survival analysis groups were categorized as high or low expression based on dataset-specific cutoffs that may vary across platforms. TERT exhibited a wider confidence interval for median OS in the high-expression group, which may reflect fewer patients remaining at risk in the upper survival tail rather than a sample size issue, as comparable group sizes were noted in the previous paragraph.
The main findings of this study identified TERT as upregulated in glioblastoma relative to normal tissue and found transcriptionally correlated genes with TERT, including WNT1 and SHH. Protein-protein interaction mapping also identified 19 significantly up/down regulated TFs (FDR < 0.05 and |log2FC| ≥ 1), and near-uniform median OS across TERT, SHH, and WNT1, pointing towards potential regulatory connectivity. With the previously discussed caveats in mind, these results tentatively support the idea that TERT may not be limited to its canonical role in telomere maintenance but also participates in broader regulatory networks, including pathways responsible for GBM stemness and heterogeneity. If supported by further experimental validation, this would provide a potential molecular link between telomerase activity and the phenotypes that drive GBM recurrence and therapy resistance. Also, given that telomerase dysregulation is observed in multiple malignancies, understanding how TERT converges on developmental and oncogenic signaling pathways may have relevance beyond GBM, though this extension is speculative until further evidence.
Several steps are needed to move towards a functional understanding of these associations. Because mRNA levels don’t necessarily predict protein levels, causality, or enzymatic activity, direct experimental validation, such as knockdown/overexpression of TERT with downstream monitoring of the WNT1 and SHH pathways or protein-protein interaction (PPI) assays, is necessary. Single-cell epigenomics may also help determine whether TERT associations reflect a specific tumor subpopulation such as stem cells. Expanding cohort sizes would help address statistical and sampling limitations, improving power and generalizability of these findings.
Supplementary Information
References
- M. Jezierzański, N. Nafalska, M. Stopyra, T. Furgoł, M. Miciak, J. Kabut, I. Gisterek-Grocholska. Temozolomide (TMZ) in the treatment of glioblastoma multiforme-a literature review and clinical outcomes. Current Oncology (Toronto, Ont.). Vol. 31, pg. 3994–4002, 2024 https://doi.org/10.3390/curroncol31070296 [↩] [↩]
- R. S. Angom, N. M. R. Nakka, S. Bhattacharya. Advances in glioblastoma therapy: an update on current approaches. Brain Sciences. Vol. 13, pg. 1536, 2023 https://doi.org/10.3390/brainsci13111536 [↩]
- S. Rogers, M. Gross, E. Ermis, G. Cosgun, B. G. Baumert, T. Mader, C. Schroeder, N. Lomax, S. Alonso, A. Ademaj, T. Lazeroms, S.-Y. Lee, M. Mayinger, C. Mamot, L. Schwyzer, G. A. Schubert, O. Riesterer. Re-irradiation for recurrent glioblastoma: a pattern of care analysis. BMC Neurology. Vol. 24, pg. 462, 2024 https://doi.org/10.1186/s12883-024-03954-z [↩]
- D. Eisenbarth, Y. A. Wang. Glioblastoma heterogeneity at single cell resolution. Oncogene. Vol. 42, pg. 2155–2165, 2023 https://doi.org/10.1038/s41388-023-02738-y [↩]
- Q. Wang, B. Hu, X. Hu, H. Kim, M. Squatrito, L. Scarpace, A. C. deCarvalho, S. Lyu, P. Li, Y. Li, F. Barthel, H. J. Cho, Y.-H. Lin, N. Satani, E. Martinez-Ledesma, S. Zheng, E. Chang, C.-E. G. Sauvé, A. Olar, Z. D. Lan, G. Finocchiaro, J. J. Phillips, M. S. Berger, K. R. Gabrusiewicz, G. Wang, E. Eskilsson, J. Hu, T. Mikkelsen, R. A. DePinho, F. Muller, A. B. Heimberger, E. P. Sulman, D.-H. Nam, R. G. W. Verhaak. Tumor evolution of glioma-intrinsic gene expression subtypes associates with immunological changes in the microenvironment. Cancer Cell. Vol. 32, pg. 42-56.e6, 2017 https://doi.org/10.1016/j.ccell.2017.06.003 [↩] [↩] [↩]
- C. Xu, P. Hou, X. Li, M. Xiao, Z. Zhang, Z. Li, J. Xu, G. Liu, Y. Tan, C. Fang. Comprehensive understanding of glioblastoma molecular phenotypes: classification, characteristics, and transition. Cancer Biology & Medicine. Vol. 21, pg. 363–381, 2024 https://doi.org/10.20892/j.issn.2095-3941.2023.0510 [↩] [↩]
- D. Eisenbarth, Y. A. Wang. Glioblastoma heterogeneity at single cell resolution. Oncogene. Vol. 42, pg. 2155–2165, 2023 https://doi.org/10.1038/s41388-023-02738-y [↩]
- V. G. LeBlanc, D. L. Trinh, S. Aslanpour, M. Hughes, D. Livingstone, D. Jin, B. Y. Ahn, M. D. Blough, J. G. Cairncross, J. A. Chan, J. J. P. Kelly, M. A. Marra. Single-cell landscapes of primary glioblastomas and matched explants and cell lines show variable retention of inter- and intratumor heterogeneity. Cancer Cell. Vol. 40, pg. 379-392.e9, 2022 https://doi.org/10.1016/j.ccell.2022.02.016 [↩]
- R. Mathur, Q. Wang, P. G. Schupp, A. Nikolic, S. Hilz, C. Hong, N. R. Grishanina, D. Kwok, N. O. Stevers, Q. Jin, M. W. Youngblood, L. A. Stasiak, Y. Hou, J. Wang, T. N. Yamaguchi, M. Lafontaine, A. Shai, I. V. Smirnov, D. A. Solomon, S. M. Chang, S. L. Hervey-Jumper, M. S. Berger, J. M. Lupo, H. Okada, J. J. Phillips, P. C. Boutros, M. Gallo, M. C. Oldham, F. Yue, J. F. Costello. Glioblastoma evolution and heterogeneity from a 3d whole-tumor perspective. Cell. Vol. 187, pg. 446-463.e16, 2024 https://doi.org/10.1016/j.cell.2023.12.013 [↩]
- B. C. Prager, S. Bhargava, V. Mahadev, C. G. Hubert, J. N. Rich. Glioblastoma stem cells: driving resilience through chaos. Trends in Cancer. Vol. 6, pg. 223–235, 2020 https://doi.org/10.1016/j.trecan.2020.01.009 [↩]
- Z. Wang, H. Zhang, S. Xu, Z. Liu, Q. Cheng. The adaptive transition of glioblastoma stem cells and its implications on treatments. Signal Transduction and Targeted Therapy. Vol. 6, pg. 124, 2021 https://doi.org/10.1038/s41392-021-00491-w [↩]
- A. Tsatsakis, T. Oikonomopoulou, T. K. Nikolouzakis, E. Vakonaki, M. Tzatzarakis, M. Flamourakis, E. Renieri, P. Fragkiadaki, E. Iliaki, M. Bachlitzanaki, V. Karzi, I. Katsikantami, F. Kakridonis, E. Hatzidaki, M. Tolia, A. A. Svistunov, D. A. Spandidos, D. Nikitovic, J. Tsiaoussis, A. Berdiaki. Role of telomere length in human carcinogenesis (review). International Journal of Oncology. Vol. 63, pg. 78, 2023 https://doi.org/10.3892/ijo.2023.5526 [↩]
- T. H. D. Nguyen. Structural biology of human telomerase: progress and prospects. Biochemical Society Transactions. Vol. 49, pg. 1927–1939, 2021 https://doi.org/10.1042/BST20200042 [↩]
- X. Yuan, C. Larsson, D. Xu. Mechanisms underlying the activation of TERT transcription and telomerase activity in human cancer: old actors and new players. Oncogene. Vol. 38, pg. 6172–6183, 2019 https://doi.org/10.1038/s41388-019-0872-9 [↩]
- A. J. Colebatch, A. Dobrovic, W. A. Cooper. TERT gene: its function and dysregulation in cancer. Journal of Clinical Pathology. Vol. 72, pg. 281–284, 2019 https://doi.org/10.1136/jclinpath-2018-205653 [↩]
- M. Liu, Y. Zhang, Y. Jian, L. Gu, D. Zhang, H. Zhou, Y. Wang, Z.-X. Xu. The regulations of telomerase reverse transcriptase (TERT) in cancer. Cell Death & Disease. Vol. 15, pg. 90, 2024 https://doi.org/10.1038/s41419-024-06454-7 [↩]
- M. J. Parsons, T. Tammela, L. E. Dow. WNT as a driver and dependency in cancer. Cancer Discovery. Vol. 11, pg. 2413–2429, 2021 https://doi.org/10.1158/2159-8290.CD-21-0190 [↩]
- S. Gupta, N. Takebe, P. Lorusso. Targeting the hedgehog pathway in cancer. Therapeutic Advances in Medical Oncology. Vol. 2, pg. 237–250, 2010 https://doi.org/10.1177/1758834010366430 [↩] [↩]
- M. Katoh, M. Katoh. WNT signaling and cancer stemness. Essays in Biochemistry. Vol. 66, pg. 319–331, 2022 https://doi.org/10.1042/EBC20220016 [↩]
- C. Liu, Y. Tu, X. Sun, J. Jiang, X. Jin, X. Bo, Z. Li, A. Bian, X. Wang, D. Liu, Z. Wang, L. Ding. Wnt/beta-catenin pathway in human glioma: expression pattern and clinical/prognostic correlations. Clinical and Experimental Medicine. Vol. 11, pg. 105–112, 2011 https://doi.org/10.1007/s10238-010-0110-9 [↩]
- J. L. Munoz, V. Rodriguez-Cruz, N. D. Walker, S. J. Greco, P. Rameshwar. Temozolomide resistance and tumor recurrence: halting the hedgehog. Cancer Cell & Microenvironment. Vol. 2, pg. e747, 2015 https://doi.org/10.14800/ccm.747 [↩]
- F. Yu, C. Yu, F. Li, Y. Zuo, Y. Wang, L. Yao, C. Wu, C. Wang, L. Ye. Wnt/β-catenin signaling in cancers and targeted therapies. Signal Transduction and Targeted Therapy. Vol. 6, pg. 307, 2021 https://doi.org/10.1038/s41392-021-00701-5 [↩]
- Firebrowse. http://firebrowse.org [↩]
- R. L. Bowman, Q. Wang, A. Carro, R. G. W. Verhaak, M. Squatrito. GlioVis data portal for visualization and analysis of brain tumor expression datasets. Neuro-Oncology. Vol. 19, pg. 139–141, 2017 https://doi.org/10.1093/neuonc/now247 [↩]
- R. G. W. Verhaak, K. A. Hoadley, E. Purdom, V. Wang, Y. Qi, M. D. Wilkerson, C. R. Miller, L. Ding, T. Golub, J. P. Mesirov, G. Alexe, M. Lawrence, M. O’Kelly, P. Tamayo, B. A. Weir, S. Gabriel, W. Winckler, S. Gupta, L. Jakkula, H. S. Feiler, J. G. Hodgson, C. D. James, J. N. Sarkaria, C. Brennan, A. Kahn, P. T. Spellman, R. K. Wilson, T. P. Speed, J. W. Gray, M. Meyerson, G. Getz, C. M. Perou, D. N. Hayes, Cancer Genome Atlas Research Network. Integrated genomic analysis identifies clinically relevant subtypes of glioblastoma characterized by abnormalities in pdgfra, idh1, egfr, and nf1. Cancer Cell. Vol. 17, pg. 98–110, 2010 https://doi.org/10.1016/j.ccr.2009.12.020 [↩]
- GraphPad prism. GraphPad Software, LLC [↩]
- R Core Team. R: a language and environment for statistical computing. R Foundation for Statistical Computing 2026 [↩]
- C. R. Brydges. Effect size guidelines, sample size calculations, and statistical power in gerontology. Innovation in Aging. Vol. 3, pg. igz036, 2019 https://doi.org/10.1093/geroni/igz036 [↩]
- T. M. Therneau. Survival: survival analysis. pg. 3.8-9, https://doi.org/10.32614/CRAN.package.survival 2001 https://doi.org/10.32614/CRAN.package.survival [↩]
- H. Wickham, R. François, L. Henry, K. Müller, D. Vaughan. Dplyr: a grammar of data manipulation. pg. 1.2.1, https://doi.org/10.32614/CRAN.package.dplyr 2014 https://doi.org/10.32614/CRAN.package.dplyr [↩] [↩]
- D. Szklarczyk, A. L. Gable, K. C. Nastou, D. Lyon, R. Kirsch, S. Pyysalo, N. T. Doncheva, M. Legeay, T. Fang, P. Bork, L. J. Jensen, C. von Mering. The string database in 2021: customizable protein–protein networks, and functional characterization of user-uploaded gene/measurement sets. Nucleic Acids Research. Vol. 49, pg. D605–D612, 2021 https://doi.org/10.1093/nar/gkaa1074 [↩]
- O. Liska, B. Bohár, A. Hidas, T. Korcsmáros, B. Papp, D. Fazekas, E. Ari. TFLink: an integrated gateway to access transcription factor–target gene interactions for multiple species. Database. Vol. 2022, pg. baac083, 2022 https://doi.org/10.1093/database/baac083 [↩]
- S. Kolmykov, I. Yevshin, M. Kulyashov, R. Sharipov, Y. Kondrakhin, V. J. Makeev, I. V. Kulakovskiy, A. Kel, F. Kolpakov. GTRD: an integrated view of transcription regulation. Nucleic Acids Research. Vol. 49, pg. D104–D111, 2021 https://doi.org/10.1093/nar/gkaa1057 [↩]
- J. Chèneby, M. Gheorghe, M. Artufel, A. Mathelier, B. Ballester. ReMap 2018: an updated atlas of regulatory regions from an integrative analysis of dna-binding chip-seq experiments. Nucleic Acids Research. Vol. 46, pg. D267–D275, 2018 https://doi.org/10.1093/nar/gkx1092 [↩]
- Y. Lee, J.-K. Lee, S. H. Ahn, J. Lee, D.-H. Nam. WNT signaling in glioblastoma and therapeutic opportunities. Laboratory Investigation. Vol. 96, pg. 137–150, 2016 https://doi.org/10.1038/labinvest.2015.140 [↩]
- M. Melssen, A. Dimberg. Keeping wnt in check for efficient checkpoint blockade in glioblastoma. Proceedings of the National Academy of Sciences. Vol. 122, pg. e2523639122, 2025 https://doi.org/10.1073/pnas.2523639122 [↩]
- A. M. Amen, C. Fellmann, K. M. Soczek, S. M. Ren, R. J. Lew, G. J. Knott, J. E. Park, A. M. McKinney, A. Mancini, J. A. Doudna, J. F. Costello. Cancer-specific loss of TERT activation sensitizes glioblastoma to dna damage. Proceedings of the National Academy of Sciences. Vol. 118, pg. e2008772118, 2021 https://doi.org/10.1073/pnas.2008772118 [↩]
- N. Olympios, V. Gilard, F. Marguet, F. Clatot, F. Di Fiore, M. Fontanilles. TERT promoter alterations in glioblastoma: a systematic review. Cancers. Vol. 13, pg. 1147, 2021 https://doi.org/10.3390/cancers13051147 [↩]
- P. J. Killela, Z. J. Reitman, Y. Jiao, C. Bettegowda, N. Agrawal, L. A. Diaz, A. H. Friedman, H. Friedman, G. L. Gallia, B. C. Giovanella, A. P. Grollman, T.-C. He, Y. He, R. H. Hruban, G. I. Jallo, N. Mandahl, A. K. Meeker, F. Mertens, G. J. Netto, B. A. Rasheed, G. J. Riggins, T. A. Rosenquist, M. Schiffman, I.-M. Shih, D. Theodorescu, M. S. Torbenson, V. E. Velculescu, T.-L. Wang, N. Wentzensen, L. D. Wood, M. Zhang, R. E. McLendon, D. D. Bigner, K. W. Kinzler, B. Vogelstein, N. Papadopoulos, H. Yan. TERT promoter mutations occur frequently in gliomas and a subset of tumors derived from cells with low rates of self-renewal. Proceedings of the National Academy of Sciences. Vol. 110, pg. 6021–6026, 2013 https://doi.org/10.1073/pnas.1303607110 [↩]
- S. Pietrobono, S. Gagliardi, B. Stecca. Non-canonical hedgehog signaling pathway in cancer: activation of gli transcription factors beyond smoothened. Frontiers in Genetics. Vol. 10, pg. 556, 2019 https://doi.org/10.3389/fgene.2019.00556 [↩]
- S. Singh, D. Dey, D. Barik, I. Mohapatra, S. Kim, M. Sharma, S. Prasad, P. Wang, A. Singh, G. Singh. Glioblastoma at the crossroads: current understanding and future therapeutic horizons. Signal Transduction and Targeted Therapy. Vol. 10, pg. 213, 2025 https://doi.org/10.1038/s41392-025-02299-4 [↩]
- Y. Zhang, C. Dube, M. Gibert, N. Cruickshanks, B. Wang, M. Coughlan, Y. Yang, I. Setiady, C. Deveau, K. Saoud, C. Grello, M. Oxford, F. Yuan, R. Abounader. The p53 pathway in glioblastoma. Cancers. Vol. 10, pg. 297, 2018 https://doi.org/10.3390/cancers10090297 [↩]
- D. Kozono, J. Li, M. Nitta, O. Sampetrean, D. Gonda, D. S. Kushwaha, D. Merzon, V. Ramakrishnan, S. Zhu, K. Zhu, H. Matsui, O. Harismendy, W. Hua, Y. Mao, C.-H. Kwon, H. Saya, I. Nakano, D. P. Pizzo, S. R. VandenBerg, C. C. Chen. Dynamic epigenetic regulation of glioblastoma tumorigenicity through lsd1 modulation of myc expression. Proceedings of the National Academy of Sciences. Vol. 112, 2015 https://doi.org/10.1073/pnas.1501967112 [↩]
- Y. Pang, S. Zhou, P. Zumbo, D. Betel, B. Cisse. TCF12 deficiency impairs the proliferation of glioblastoma tumor cells and improves survival. Cancers. Vol. 15, pg. 2033, 2023 https://doi.org/10.3390/cancers15072033 [↩]
- A. Del Moral-Morales, J. C. González-Orozco, A. M. Hernández-Vega, K. Hernández-Ortega, K. M. Peña-Gutiérrez, I. Camacho-Arroyo. EZH2 mediates proliferation, migration, and invasion promoted by estradiol in human glioblastoma cells. Frontiers in Endocrinology. Vol. 13, pg. 703733, 2022 https://doi.org/10.3389/fendo.2022.703733 [↩]
- H. Liu, Y. Sun, X. Qi, R. E. Gordon, J. A. O’Brien, H. Yuan, J. Zhang, Z. Wang, M. Zhang, Y. Song, C. Yu, C. Gu. EZH2 phosphorylation promotes self-renewal of glioma stem-like cells through nf-κb methylation. Frontiers in Oncology. Vol. 9, pg. 641, 2019 https://doi.org/10.3389/fonc.2019.00641 [↩]
- H. Yu, D. Zhang, Z. Li, M. Wang. E2F transcription factor 8 promotes proliferation and radioresistance in glioblastoma. Pathology – Research and Practice. Vol. 216, pg. 153030, 2020 https://doi.org/10.1016/j.prp.2020.153030 [↩]
- C. Zhang, N. Zhao, R. Khan, M. Hung, C. Zhang, S. Wang, T. J. C. Wang, C. Lin. The prognostic significance of androgen receptor expression in gliomas. Scientific Reports. Vol. 14, pg. 22122, 2024 https://doi.org/10.1038/s41598-024-72284-4 [↩]