
Abstract
The Kyrgyz Ala-Too Range, located in the northern Tien Shan of Kyrgyzstan, encompasses diverse mountain ecosystems from forested middle elevations to subalpine and alpine zones. Its forest ecosystems are strongly influenced by elevation-dependent temperature, precipitation patterns and by water supplied through seasonal snow and glaciers. This study uses satellite data to find early signs of plant stress and forest damage in the Ala-Archa National Park, its surrounding mountains, and peri-urban buffer zones in the Kyrgyz Ala-Too Range from 2015 to 2024. Vegetation dynamics were calculated using NDVI time series derived from Landsat 8/9 and Sentinel-2. Early stress is defined as a 5–10% monthly decline below a fixed same-month baseline (computed over 2015–2019), while visible decline as reductions ≥10% below that baseline for two or more consecutive months. In the Park Interior, yearly NDVI trends were non-significant (τ = 0.289, p = 0.283); however, pooled seasonal visible-decline trends reached significance (τ = 0.400, p = 0.001), indicating stable vegetation with a subtle early-season stress signal during the May–June transition. The Mountain Range demonstrated significant trends at both annual and pooled seasonal scales, with a positive annual trend (τ = 0.556, p = 0.032) and a stronger pooled seasonal trend (τ = 0.411, p < 0.001). City Skirts showed weak, inconsistent trends at all scales. The spatial stress was localized near forest–agriculture edges and access routes. These findings suggest that seasonal NDVI dynamics offer sensitive signals of early vegetation stress. Integrating these satellite-based metrics into regional monitoring pipelines can support proactive, spatially targeted forest conservation and early-warning management across Central Asian mountain ecosystems.
Introduction
Mountainous forests across Central Asia play a critical role in maintaining regional ecological stability because they support biodiversity, regulate water, store carbon, and reduce erosion1,2. Ala-Archa National Park and its surrounding areas are increasingly under pressure from selective logging, urban expansion, droughts, and wildfires. Current monitoring approaches may detect forest degradation only after visible damage has occurred, reducing the effectiveness of forest management and showing the need for early-warning tools.
Satellite remote sensing can detect subtle changes in forest conditions before visible degradation occurs3,4. Vegetation indices such as the Normalized Difference Vegetation Index (NDVI) detect canopy greenness and have been widely applied to track vegetation dynamics across diverse ecosystems1,5. NDVI shows changes in greenness and moisture stress6,7, and topographic variation and grazing pressure significantly affect vegetation dynamics in the Kyrgyz highlands. This demonstrates the need for detailed analysis across different elevation zones8.
Thresholds for defining early and visible decline were adapted from prior NDVI-based disturbance studies that use monthly time series to reduce noise and ensure phenological consistency9,10. Research shows that 5–10% drops in monthly NDVI relative to same-month climatology serve as early indicators of physiological stress, including reduced chlorophyll, water limitations, and slowed leaf development11,12. Larger declines of ≥10% mean more advanced stress stages, including partial canopy thinning, reduced leaf area index, or drought damage13,14. Therefore, early stress is defined as a 5–10% monthly NDVI anomaly below the fixed same-month mean computed over 2015–2019, and visible decline as a ≥10% anomaly for at least two consecutive months.
Methodology
To track early signs of plant stress and forest damage in the Kyrgyz Ala-Too Range, a multi-tiered approach and satellite images from different time periods were used. The methodology combines NDVI time-series analysis, threshold-based early-warning detection, and spatial correlation with environmental drivers.
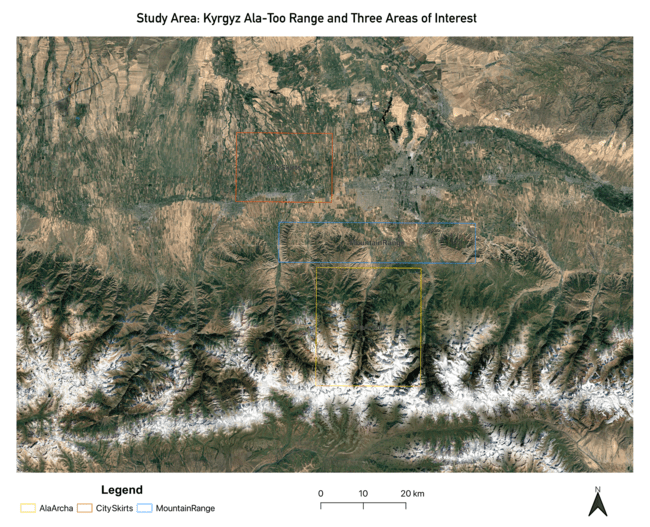
Study Area
Ala-Archa National Park, the selected study area, lies within the northern Tian Shan Mountains and represents one of the most important ecological zones in Kyrgyzstan. The study area consists of three subregions: the central Ala-Archa valley, a surrounding high-elevation mountain range, and the peri-urban foothill zone on the outskirts of Bishkek city.
Geographically it is located between 42.45°N–42.98°N and 74.11°E–74.80°E based on the boundaries of the three Areas of Interest (AOIs). AOI 1 (Park Interior) covers the main national park valley (74.35°E–74.65°E, 42.45°N–42.70°N), AOI 2 (Mountain Range) includes high-elevation alpine and glacial zones (74.24°E–74.81°E, 42.71°N–42.80°N) and AOI 3 (City Skirts) represents the lower-elevation foothills transitioning toward urban areas (74.12°E–74.39°E, 42.84°N–42.98°N).
The region is characterised by a continental mountain climate, exhibiting prolonged, severe winters and short, cool summers. Mean annual temperatures differ strongly with elevation: lower foothill zones experience average temperatures of 4–8°C, while higher alpine zones remain near or below 0°C for most of the year. Precipitation ranges from 400–600 mm yearly, particularly higher amounts occur at mid-elevations because of orographic lifting. Most precipitation falls between April and September, coinciding with the main growing season for mountain vegetation. Topographically, the area has steep elevational gradients, glacial valleys, rocky ridges, and extensive alpine meadows: elevation ranging from approximately 1,500 m near the city outskirts to over 4,800 m in the central Ala-Archa mountain range. Ecological zones transition from steppe and shrublands in the lower City Skirts area to subalpine forests, alpine grasslands, and glaciated peaks at higher elevations.
Data Sources
Data was obtained from openly accessible satellite platforms and official environmental records. Optical datasets included Landsat 8 and Landsat 9 Operational Land Imager (OLI) Surface Reflectance products at 30 m spatial resolution, as well as Sentinel-2 MSI Level-2A imagery with 10–20 m resolution. These products were used to derive NDVI and assess vegetation dynamics across the study period from 2015 to 2024. All optical images were provided as atmospherically corrected surface reflectance and were further screened for clouds and shadows using the corresponding quality assessment (QA) bands. National environmental information is from the Kyrgyz Forest Inventory and relevant government agencies. They include forest boundary maps, disturbance records, and management unit classifications. They were essential for contextualising remote sensing observations within the broader ecological and administrative framework of the region15.
Preprocessing
All analyses were conducted in Google Earth Engine (GEE) using monthly NDVI composites rather than individual scenes, ensuring temporal alignment with phenology and minimising noise from cloud contamination16. Landsat 8/9 imagery was processed using the CFMASK algorithm and Sentinel-2 Level-2A imagery was masked using the Scene Classification Layer (SCL). Both masking strategies have shown high reliability in removing atmospheric artefacts across mountainous terrain17,18. Monthly compositing further reduces residual noise from undetected clouds, variable solar angles, and scene-level inconsistencies, a method widely used in NDVI trend research12,19. After cloud and snow masking, we retained all optical images in surface reflectance format and reprojected to EPSG:32643 to maintain spatial consistency across sensors. Note that although both Landsat and Sentinel-2 products were used, we applied no explicit cross-sensor NDVI harmonisation beyond cloud masking and compositing; this represents a limitation to be addressed in future work, as known inter-sensor NDVI offsets could affect long-term trends if not corrected.
Monthly NDVI composites were generated from filtered scenes, computed as NDVI = (NIR − Red) / (NIR + Red)3,4. Given the pronounced topographic non-uniformness of the study area, we used the SRTM digital elevation model to apply a C-correction topographic normalisation to reduce illumination effects on surface reflectance, applied uniformly across all three AOIs. Slope, aspect, and solar geometry were accounted for in this correction; however, BRDF effects, persistent shadow in deeply incised valleys, and snow persistence at high elevations remain uncertain, particularly in the Mountain Range AOI. It also has the highest proportion of flagged (cloud- or snow-affected) observations. All processed imagery was subsequently clipped to the three predefined AOIs and exported from GEE for statistical analysis in RStudio.
Early Stress and Visible Decline Definitions
Early stress and visible decline were defined using formal anomaly thresholds applied to monthly NDVI time series. The baseline for each calendar month m was computed as the mean NDVI over the fixed period 2015–2019:
![\[\mathrm{B(m) = (1/5) \times \sum_{x=2015-2019} NDVI(m,y)}\]](https://nhsjs.com/wp-content/ql-cache/quicklatex.com-173653e6e6f0dabccf0fe0c89be3f77f_l3.png "Rendered by QuickLaTeX.com")
The monthly anomaly for year y and month m is then:
![\[\mathrm{Anom(m,y) = \frac{[B(m) - NDVI(m,y)]}{B(m) \times 100\%}}\]](https://nhsjs.com/wp-content/ql-cache/quicklatex.com-35a651f3c88b169093d86defdb0a8d6d_l3.png "Rendered by QuickLaTeX.com")
Early stress is flagged when 5% ≤ Anom(m, y) < 10%, indicating a moderate deficit relative to the fixed baseline. Visible decline is flagged when Anom(m, y) ≥ 10% AND Anom(m+1, y) ≥ 10%, requiring the anomaly to persist for at least two consecutive months to distinguish sustained stress from transient anomalies. Using a fixed 2015–2019 baseline means that the five earliest years (2015–2019) of the series serve both as reference and as part of the analysed period; future work should employ a pre-analysis baseline period to avoid any temporal circularity. The thresholds themselves (5% and 10%) follow prior NDVI-based disturbance studies11,12,9, but no sensitivity analysis was conducted on alternative threshold values for this study area; this remains an important limitation and a priority for future work.
Mann–Kendall Trend Analysis
To quantify long-term vegetation trends, this study applied the non-parametric Mann–Kendall (MK) test20,21,22 to NDVI and the decline-metric time series for each AOI. The MK test is widely used in ecological and climate studies because it does not assume normality, is robust to missing values, and is resistant to outliers, conditions typical of satellite data. The test evaluates whether a time series exhibits a monotonic increasing or decreasing trend over time by comparing every observation with all subsequent observations. Kendall’s τ ranges from −1 (perfect decreasing trend) to +1 (perfect increasing trend).
We applied two distinct types of MK tests, and these must be interpreted differently. First, MK tests on annual mean NDVI assess whether overall vegetation greenness is increasing or decreasing. Here, a positive τ indicates greening or improved canopy condition. Second, MK tests on the annual or seasonal proportion of pixels flagged as visible decline assess whether the spatial extent of stressed or declining pixels is changing over time. Here, a positive τ indicates increasing degradation extent. These two response variables have opposite ecological interpretations and are clearly distinguished throughout the Results section.
Seasonal pooled MK tests combine month-to-month transitions (May→June, June→July, July→August, August→September) within years to increase statistical power. However, this pooling does not produce independent observations, because transitions within the same year share climate, snowmelt timing, cloud masking, and AOI composition. The pooled p-values reported here should therefore be interpreted with caution. They indicate seasonal-scale patterns. We applied no multiple-testing correction (e.g., Bonferroni or false discovery rate) across the full set of AOIs, scales, metrics, and transitions.Therefore, readers are advised to treat borderline results accordingly. Future analyses should apply a proper seasonal Kendall test or a block-bootstrap procedure that preserves year-level dependence.
Threshold Calibration
Because we had project time constraints and complex multi-year dataset, initial threshold calibration and cadence testing were conducted on reduced temporal subsets. This approach allowed fast assessment of candidate indicator thresholds and temporal aggregation schemes. After determining the optimal configurations, we applied the finalised parameters to the complete dataset. Readers should note that this calibration step was not cross-validated against held-out years, so some risk of overfitting to the calibration subset cannot be excluded.
Limitations Overview
There are some environmental and methodological factors that could affect the accuracy of vegetation stress detection. The mountainous terrain of Ala-Archa shows some challenges because of its variable illumination, steep slopes, and seasonal snow cover. These all can introduce noise into optical vegetation indices. Also, persistent cloud cover limits the temporal availability of cloud-free optical imagery. The proportion of flagged (cloud- or snow-affected) monthly observations differed by AOI: approximately 12% for the Park Interior, 18% for the Mountain Range, and 9% for City Skirts. In the Mountain Range, the combination of the highest flagged-observation rate and the strongest reported NDVI trend warrants particular caution. Sampling bias from cloud-preferential masking of high-NDVI forested areas could inflate positive trends. Additionally, the methodology is designed as a diagnostic early-warning framework. This means that it identifies areas showing early signs of stress but does not directly attribute these changes to specific drivers.
Results
Overview of Detection Framework
This study used a two-tiered detection framework to assess plant stress in the Kyrgyz Ala-Too Range from 2015 to 2024. The first tier, early detection, identifies subtle stress signals where NDVI falls 5–10% below the fixed same-month baseline (2015–2019) for two consecutive months. The second tier, visible decline, identifies more severe anomalies where NDVI falls ≥10% below the fixed baseline for two or more consecutive months. There are results for three sub-zones: Ala-Archa National Park (Park Interior), Mountain Range (Upslope Box), and City Skirts (Bishkek Buffer). In all Mann-Kendall tests described below, the response variable is explicitly stated. Tests labelled ‘NDVI trend’ use annual or monthly mean NDVI as the time series. Tests labelled ‘visible decline trend’ use the proportion of pixels within each AOI meeting the visible-decline criterion.
Early Detection Results
Limitations and Considerations
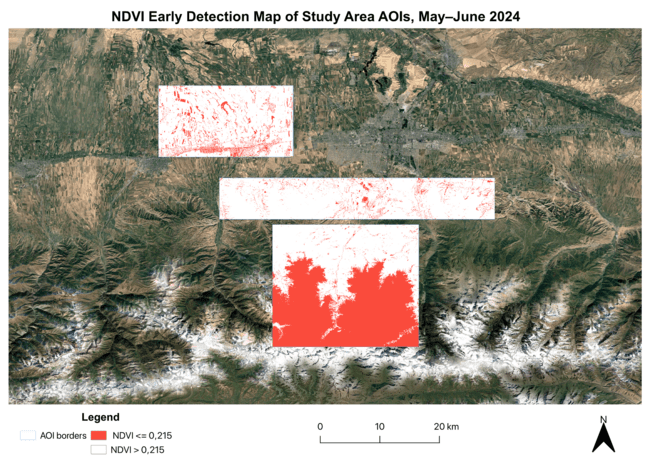
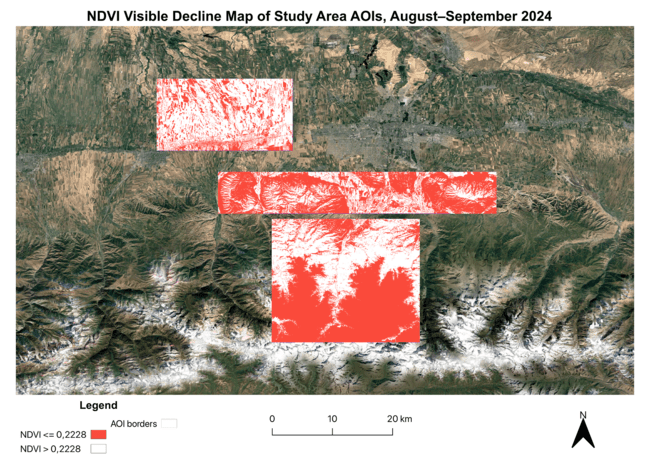
Visual examination of the early detection map for 2024 revealed clear geographic clustering across the three study zones. Early NDVI stress was concentrated along forest–agriculture boundaries, road corridors, and upslope transition zones, while the protected part of Ala-Archa National Park was largely unstressed in this year.
Park Interior (Ala-Archa National Park)
The Park Interior demonstrated generally stable vegetation conditions over the study period (2015–2024), consistent with its protected status and limited direct anthropogenic disturbance.
Annual NDVI Trend
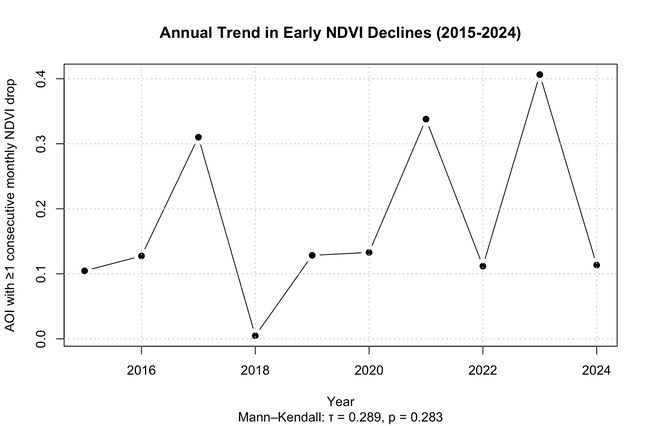
The Mann–Kendall test applied to the annual mean NDVI time series (response variable: mean growing-season NDVI per year) for the Park Interior provided Kendall’s τ = 0.289 (p = 0.283, n = 10 years). This result shows a weak positive but statistically non-significant long-term trend in vegetation greenness. While the positive τ value implies a tendency toward improvement in canopy condition, the lack of statistical significance shows that no significant annual trend can be confirmed over the decade. Because of the short record and absence of multiple-testing correction, this result should be treated as exploratory.
Seasonal NDVI Trends (Month-to-Month Transitions)
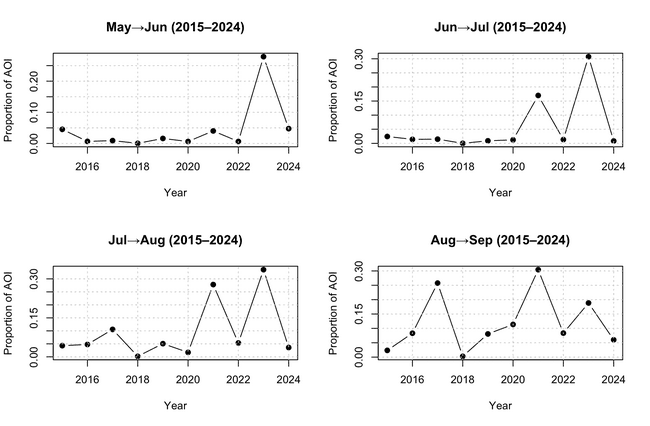
Seasonal Mann–Kendall tests applied to mean NDVI at individual month-to-month transitions showed no statistically significant trends throughout this season. The May→June transition provided τ = 0.244 (p = 0.371), June→July provided τ = −0.022 (p = 1.000), July→August provided τ = 0.244 (p = 0.371), and August→September provided τ = 0.200 (p = 0.474). The direction and magnitude of τ values are different among transitions, indicating year-to-year variability. The almost zero τ for the June→July transition shows particularly stable mid-season conditions, while the weak positive τ values in early and late season transitions do not show statistical significance.
Pooled Seasonal Analysis
When all month-to-month NDVI transitions (May→September) were pooled into a single seasonal dataset, the Mann–Kendall test yielded τ = 0.167 (p = 0.180). Although the pooled τ value is positive, the result remains statistically non-significant. As noted in the Methods, pooled transitions within the same year are not independent observations, so this p-value should be interpreted with caution regardless of outcome. The result is consistent with the finding from individual seasonal tests: no coherent monotonic trend in mean NDVI is detectable at the Park Interior over the study period.
Interpretation
Overall, the Park Interior demonstrates vegetation stability rather than directional change at both annual and seasonal scales for mean NDVI. The absence of statistically significant trends suggests that the protected core of Ala-Archa National Park has maintained relatively resilient vegetation conditions throughout the study period. Minor positive tendencies observed in some seasonal transitions likely reflect natural interannual climate variability (e.g., precipitation or snowmelt timing) rather than systematic ecological improvement or degradation.
Mountain Range (Upslope Box)
The Mountain Range zone represents the high-elevation area above Ala-Archa National Park, extending from approximately 3,000 to 4,800 m elevation. This zone contains sparse alpine vegetation, rocky terrain, and extensive seasonal snow cover. It also has the highest proportion of flagged observations (18%), which should be borne in mind when interpreting the strong trends reported below.
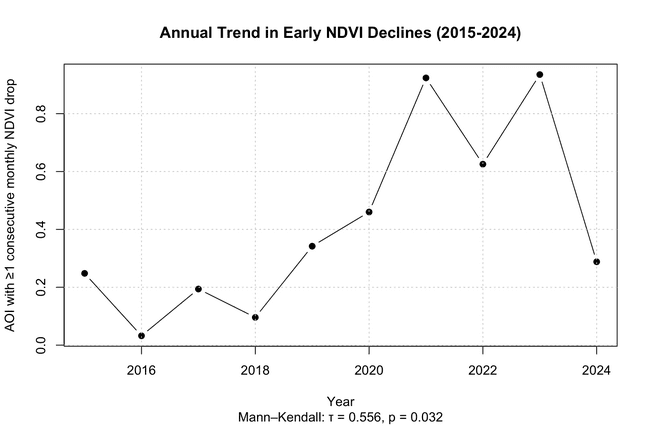
Annual NDVI Trend
The Mann–Kendall test applied to the annual mean NDVI time series for the Mountain Range yielded Kendall’s τ = 0.556 (p = 0.032, n = 10 years), a statistically significant positive trend. This indicates measurable improvement in vegetation greenness at high elevations over the decade. However, as discussed below, this trend is interpreted as reflecting alpine greening and phenological extension consistent with climate warming23 rather than forest degradation, since much of the Mountain Range lies above the treeline. The strength of this finding should also be tempered by the relatively high proportion of cloud- and snow-flagged observations in this AOI.
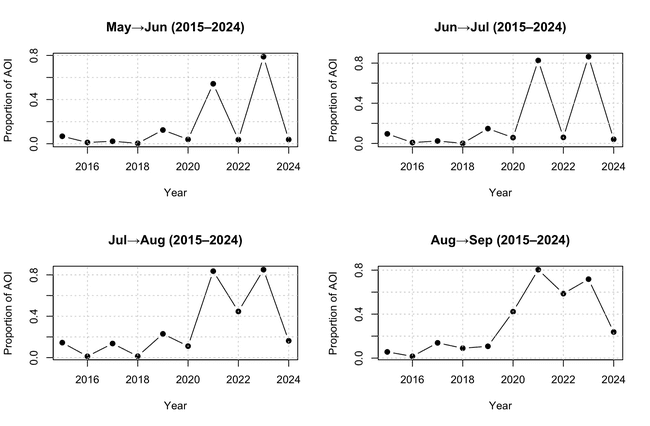
Seasonal NDVI Trends (Month-to-Month Transitions)
Seasonal Mann–Kendall tests on mean NDVI showed patterns different from the protected Park Interior. The May→June and June→July transitions both provided τ = 0.289 (p = 0.283), indicating weak positive but non-significant early growing-season trends. This was likely influenced by variable snowmelt timing. The July→August transition provided τ = 0.467 (p = 0.074). This shows a borderline result approaching significance and suggesting sustained vegetation vigour during peak summer. The August→September transition showed the strongest individual seasonal signal: τ = 0.600 (p = 0.020), indicating a statistically significant positive trend during senescence.
Pooled Seasonal Analysis
When all month-to-month NDVI transitions across the growing season were pooled, the Mann–Kendall test yielded τ = 0.411 (p < 0.001). While this result is highly significant, the pooling caveat applies: transitions from the same year are not independent, so this p-value overstates the effective sample size. The result nonetheless reinforces the finding from individual seasonal tests that vegetation greenness in the Mountain Range is increasing during the growing season, most strongly during the senescence transition.
Interpretation
The Mountain Range exhibits the most pronounced vegetation trends of all three zones, with both a significant annual NDVI trend and a highly significant pooled seasonal trend. Critically, both positive trends in mean NDVI and the strong August→September signal are most parsimoniously interpreted as extended growing season and delayed senescence at high elevations under climate warming, a pattern of alpine greening observed widely in high-mountain ecosystems globally23,5. This does not indicate forest degradation; rather, the dominant story in this zone is one of phenological change, likely driven by regional climate trends. Without a rigorous forest mask restricting the analysis to mapped forest pixels, alpine meadow greening above the treeline cannot be distinguished from forest recovery or change.
City Skirts (Bishkek Buffer)
The City Skirts zone represents the lower-elevation peri-urban buffer between the upslope mountain areas and Bishkek’s urban boundary, spanning approximately 1,500–2,200 m in elevation. This zone consists of fragmented forest patches interspersed with agricultural land, settlements, and transportation infrastructure, and is subject to substantial anthropogenic influence.
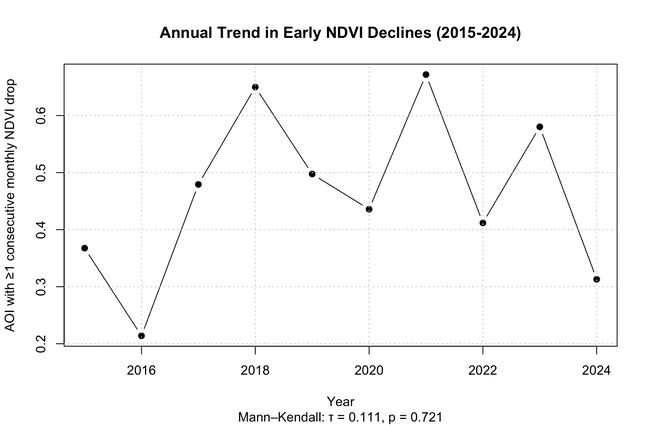
Annual NDVI Trend
The Mann–Kendall test applied to the annual mean NDVI time series for the City Skirts zone yielded Kendall’s τ = 0.111 (p = 0.721, n = 10 years), reflecting a weak positive but statistically non-significant annual trend. This indicates that vegetation conditions in the City Skirts are highly variable interannually, with no consistent long-term directional change in mean NDVI over the study period.
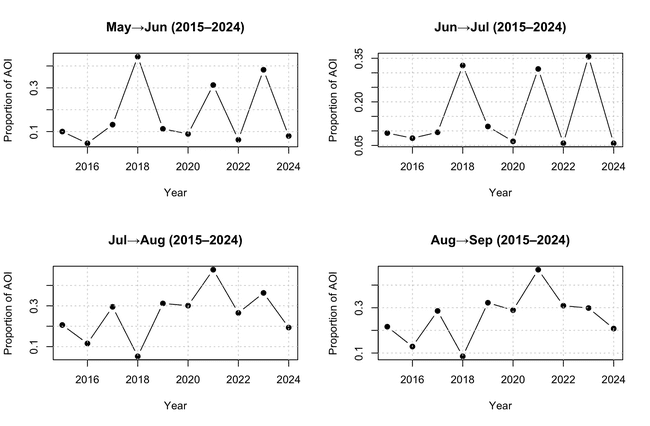
Seasonal NDVI Trends (Month-to-Month Transitions)
Seasonal Mann–Kendall analysis on mean NDVI shows weak and non-significant trends across all month-to-month transitions. The May→June transition provided τ = 0.022 (p = 1.000). This indicates fundamentally no consistent early growing-season trend. The June→July transition provided τ = −0.067 (p = 0.858). This shows a weak negative trend without statistical significance. July→August provided τ = 0.244 (p = 0.371) and August→September provided τ = 0.244 (p = 0.371), both weak positive trends not exceeding year-to-year noise. Instead of a clear phenological shift, the mixed directions and sizes of the τ values suggest that the seasonal behavior is mostly irregular.
Pooled Seasonal Analysis
When all month-to-month NDVI transitions were pooled, the Mann–Kendall test provided τ = 0.111 (p = 0.371), showing a statistically non-significant seasonal-scale trend in mean NDVI.
Interpretation
Overall, the City Skirts zone suggests weak and inconsistent vegetation trends at annual and seasonal scales in mean NDVI. This means the peri-urban landscape had non-uniform disturbance processes.
Visible Decline Detection Across Study Areas
This section presents MK trend results using the proportion of pixels flagged as visible decline within each AOI as the response variable. A positive τ here means the spatial extent of visible decline is increasing over time. Visible decline is defined as NDVI falling ≥10% below the fixed 2015–2019 same-month average for two consecutive months.
Park Interior – Visible Decline
Annual Visible Decline Trend
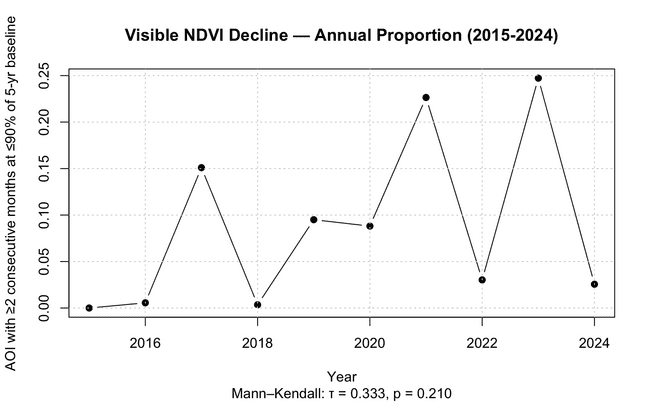
The Mann–Kendall test applied to the annual proportion of Park Interior pixels flagged as visible decline provided Kendall’s τ = 0.333 (p = 0.210, n = 10 years). This result indicates a moderate positive but statistically non-significant trend in visible decline extent. This finding suggests that there is a tendency toward increasing area affected. Change-point analysis found a potential shift around 2018. It had a higher median decline extent after this year; however, this shift was not statistically significant (p = 0.495), indicating gradual change.
Seasonal Visible Decline Trends
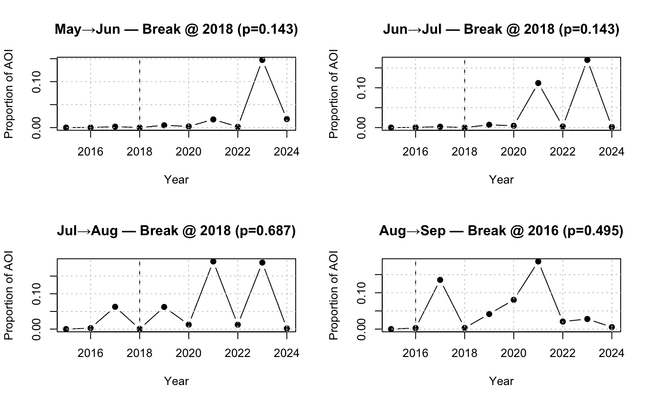
Seasonal Mann–Kendall tests on the proportion of pixels in visible decline revealed contrasting behaviour between individual transitions and the pooled seasonal structure. The May→June transition showed the strongest individual signal (τ = 0.644, p = 0.012), while June→July was borderline (τ = 0.467, p = 0.074). July→August and August→September were non-significant (τ = 0.244, p = 0.371 for both). When all seasonal transitions were pooled, the MK test yielded τ = 0.400 (p = 0.001), a highly significant result driven primarily by the early growing-season transitions. As emphasised in the Methods, pooled transitions are not independent across years; this p-value reflects a coherent early-season pattern but should not be interpreted as arising from a large independent sample. Change-point analysis applied to seasonal visible decline identified potential shift years around 2016–2018 depending on the transition, but none of these were statistically significant (all p > 0.1).
Interpretation
The Park Interior demonstrates a subtle increase in visible decline in the early growing season. It is mainly detectable when seasonal transitions are considered collectively. At the annual scale, evidence for increasing decline extent stays weak and below conventional significance thresholds. The pooled seasonal result, while significant under the MK test, must be considered an early and small-sample signal given the ten-year record and lack of multiple-testing correction. This pattern likely reflects gradual gathering of early-season stress rather than sudden degradation.
Mountain Range – Visible Decline
Annual Visible Decline Trend
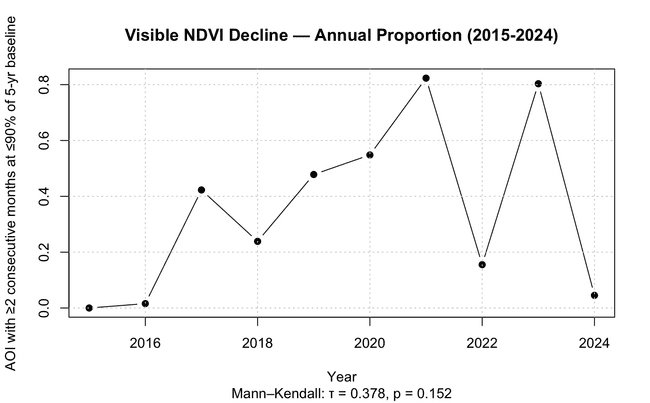
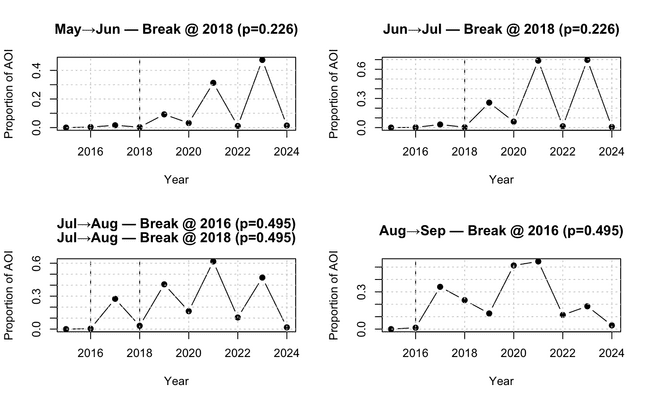
The Mann–Kendall test on the annual proportion of Mountain Range pixels in visible decline provided τ = 0.378 (p = 0.152, n = 10 years). This shows a moderate positive but non-significant trend. Change-point analysis identified potential shifts around 2016–2018, though these were not statistically significant (p = 0.495).
Seasonal Visible Decline Trends
The May→June and June→July transitions both provided τ = 0.467 (p = 0.074), borderline results suggesting early-season increases in visible decline extent. July→August provided τ = 0.333 (p = 0.210) and August→September provided τ = 0.156 (p = 0.592), both non-significant. The pooled seasonal MK test provided τ = 0.356 (p = 0.004), a statistically significant result indicating a coherent seasonal-scale increase in visible decline extent. None of the seasonal change points were statistically significant.
Interpretation
The Mountain Range shows a consistent seasonal-scale increase in visible decline extent when month-to-month transitions are considered collectively, even though annual trends and individual transitions do not consistently reach significance. This result, combined with the strong positive NDVI trends reported in the previous section, presents an apparently paradoxical picture: mean NDVI is increasing while the proportion of pixels flagged for visible decline is also increasing. A likely explanation is that high-altitude greening and declining snow cover are expanding the NDVI-responsive vegetation footprint while also increasing the area susceptible to inter-annual drought or stress anomalies. This finding underscores the importance of distinguishing between mean-NDVI trends and decline-extent trends, as they carry fundamentally different ecological interpretations.
City Skirts – Visible Decline
Annual Visible Decline Trend
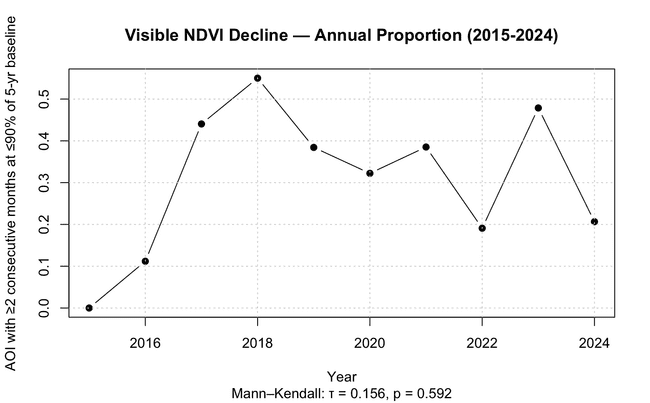
The Mann–Kendall test on the annual proportion of City Skirts pixels in visible decline provided τ = 0.156 (p = 0.592, n = 10 years), a weak non-significant trend. Change-point analysis identified a potential shift around 2016 with higher post-change median values, but this was not statistically significant (p = 0.495).
Seasonal Visible Decline Trends
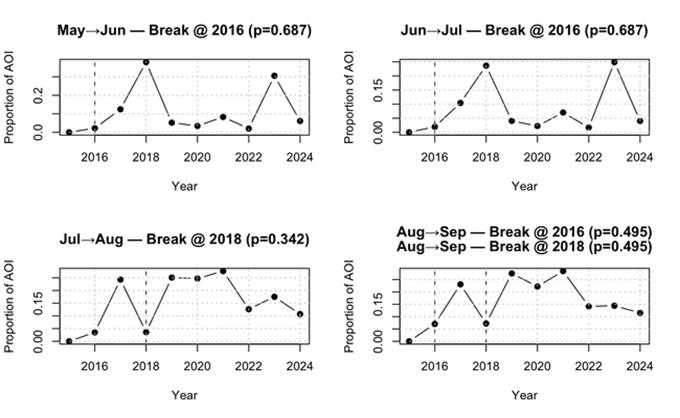
Seasonal Mann–Kendall tests on the proportion of pixels in visible decline provided weak and non-significant results. May→June and June→July both provided τ = 0.200 (p = 0.474), July→August provided τ = 0.289 (p = 0.283), and August→September provided τ = 0.244 (p = 0.371). The pooled seasonal MK test provided τ = 0.233 (p = 0.060), a borderline result that does not meet conventional significance thresholds. Seasonal change-point analysis identified candidate shift years around 2016 and 2018, but none of them were statistically significant (all p ≥0.342).
Interpretation
The City Skirts zone shows weak and inconsistent visible-decline trends at all scales over time. This reflects the dominance of heterogeneous and episodic processes in this peri-urban landscape. Importantly, the evidence for stress and decline in the City Skirts zone rests mainly on spatial patterns rather than temporal trends: spatial analysis reveals localised visible decline concentrated near forest–agriculture boundaries, roads, and settlement edges, whereas temporal trend tests across the AOI as a whole are not significant. This distinction is important and should not be confused: the strong wording sometimes applied to this zone in earlier drafts (‘extensive early stress and visible decline’) is better understood as describing the spatial distribution of stress hotspots rather than a confirmed monotonic temporal trend.
Discussion
Interpretation of Visible Decline Patterns
In the Park Interior, annual MK trends for visible decline extent were weak and non-significant (τ = 0.333, p = 0.210). This suggests no significant long-term directional change at the annual scale. However, pooled seasonal analysis on visible decline extent showed a significant increase driven mainly by the May→June transition (τ = 0.644, p = 0.012). This difference indicates that aggregating NDVI or decline-extent metrics to annual scales can hide phenology-specific changes, and seasonal tests are therefore more sensitive to early signs of stress. This is consistent with prior studies highlighting the value of month-to-month analysis for detecting emerging vegetation degradation24,9.It should be noted, however, that these pooled seasonal results are built on a ten-year record without multiple-testing correction and should be regarded as preliminary, hypothesis-generating findings rather than definitive evidence.
Ecological Drivers of Early-Season Trends
The positive early-season NDVI trends in Ala-Archa likely reflect several factors. Favourable spring conditions may cause initial green-up, while low anthropogenic pressure within the protected park allows vegetation to respond effectively. The absence of significant mid-to-late summer trends (June→September τ ≤0.244, p ≥0.283) suggests that these improvements are mainly early-season seasonal shift rather than being driven by overall annual climatic changes25,12.
Comparison Across Study Zones
The three study zones differ clearly in elevation, protection status, and anthropogenic pressure. At the annual scale, only the Mountain Range exhibits a statistically significant positive trend in mean NDVI. Both the Park Interior and City Skirts show weak, non-significant positive trends, suggesting overall stability rather than directional change. In the Park Interior, this stability is consistent with long-term protection; in the City Skirts it reflects high year-to-year variability driven by heterogeneous land use and disturbance.
Seasonal patterns further differentiate the zones. The Park Interior shows weak, non-significant trends in mean NDVI across all transitions, while the Mountain Range exhibits the strongest seasonal signal, with a significant positive trend in August→September mean NDVI and a highly significant pooled trend, consistent with delayed senescence and extended growing season at high elevations. The City Skirts display the weakest and least coherent seasonal behaviour, as no individual transition or pooled seasonal trend in mean NDVI is statistically significant.
Significant positives in the Mountain Range results mean NDVI trends at high elevations are now widely documented in Central Asian mountain regions and globally in alpine biomes23,5,8. Without a forest mask restricting the analysis to mapped forest cover, these trends likely capture a mix of forest, shrubland, alpine meadow, and recently exposed ground following glacial retreat. These all can contribute to positive NDVI trends. In the Mountain Range, the main ecological story is phenological change and alpine greening consistent with climate warming.
Early-Warning Lead Time
The threshold design implies that early stress (5–10% NDVI anomaly) may be detectable before the vegetation crosses the visible-decline threshold (≥10%). It potentially provides 30–60 days of advance notice. However, this lead-time estimate is deduced from the threshold separation itself. Future work should conduct pixel-level tracking analysis to validate whether early stress flags are reliably followed by visible decline within the stated window, and to quantify the rate of false positives (early stress flags that do not progress to visible decline).
Statistical Considerations
There are several statistical limitations that deserve clear acknowledgement. First, all MK tests in this study use only ten annual observations. This provides limited power to detect trends and makes results sensitive to individual anomalous years. Second, no correction was applied for multiple comparisons across three AOIs, two decline metrics, annual versus seasonal scales, and four individual month-to-month transitions. Overall, there could be at least one spurious significant result. Third, the pooled seasonal tests combine within-year transitions. They share common climate forcing and observing conditions, inflating the effective sample size relative to the true degrees of freedom. These limitations do not invalidate the results. They mean that borderline and even formally significant findings should be treated as early, small-sample signals requiring confirmation with longer time series and more rigorous statistical design.
Sensor Harmonisation
This study combined Landsat 8/9 and Sentinel-2 NDVI without applying an explicit cross-sensor harmonisation. Known systematic offsets in NDVI between Landsat and Sentinel-2 due to differences in band spectral response functions can reach several percent and may introduce artificial trends in long-term composites if sensor contributions shift over time12. Future analyses should apply established harmonisation procedures, such as regression-based correction using concurrent overlapping acquisitions, and verify that sensor-mixing does not account for a significant fraction of the reported trends.
Implications for Conservation Management
Despite the statistical limitations noted above, the spatial patterns of early stress and visible decline are consistent with prior knowledge about the pressures facing these zones. The early-season trend in Park Interior visible decline suggests that monitoring during the May–June transition may be the most sensitive period. Specifically, it is ideal for detecting emerging stress within the protected area. In the City Skirts, temporal trend tests are non-significant. However, spatially targeted monitoring near forest–agriculture edges and road buffers could support proactive management by forest rangers and land managers. This can happen even before consistent temporal trends are established.
Conclusion
This study developed and applied an early-warning framework for detecting vegetation stress in the Ala-Archa region of Kyrgyzstan by integrating multi-temporal optical satellite data, threshold-based anomaly detection, and Mann–Kendall trend analysis across three elevation zones from 2015 to 2024. Results were heterogeneous: the Park Interior showed broadly stable mean NDVI with a subtle but detectable increase in early-season visible decline concentrated in the May–June transition; the Mountain Range exhibited significant positive NDVI trends most appropriately interpreted as climate-driven alpine greening and delayed senescence rather than forest degradation; and the City Skirts showed spatially concentrated but temporally non-significant stress near forest–agriculture boundaries and infrastructure. The threshold-based approach successfully flags early NDVI anomalies that may precede persistent visible decline, although the lead-time claim requires direct pixel-level validation. The results should be interpreted with appropriate caution given the short ten-year record, absence of multiple-testing corrections, caveats associated with pooled seasonal statistics, and the lack of a formal forest mask and cross-sensor harmonisation.
Several extensions should be done to advance this framework toward operational early-warning capacity. These include applying a verified forest mask (e.g., Hansen Global Forest Change or the Kyrgyz national inventory), conducting explicit cross-sensor NDVI harmonisation, applying formal multiple-testing corrections and proper seasonal Kendall or block-bootstrap procedures, validating the early-warning lead time through pixel-level trajectory tracking, and extending the time series backward through the Landsat archive to improve trend robustness. Systematic deployment with automated monthly updates could support proactive, spatially targeted forest management across Kyrgyzstan’s mountain forest ecosystems.
References
- N. Pettorelli, J.O. Vik, A. Mysterud, J.-M. Gaillard, C.J. Tucker, N.C. Stenseth. Using the satellite-derived NDVI to assess ecological responses to environmental change. Trends in Ecology and Evolution. Vol. 20, No. 9, pg. 503–510, 2005, https://doi.org/10.1016/j.tree.2005.05.011. [↩] [↩]
- E. Lioubimtseva, G.M. Henebry. Climate and environmental change in arid Central Asia: Impacts, vulnerability, and adaptations. Journal of Arid Environments. Vol. 73, No. 11, pg. 963–977, 2009, https://doi.org/10.1016/j.jaridenv.2009.04.022. [↩]
- C.J. Tucker. Red and photographic infrared linear combinations for monitoring vegetation. Remote Sensing of Environment. Vol. 8, No. 2, pg. 127–150, 1979, https://doi.org/10.1016/0034-4257(79)90013-0. [↩] [↩]
- J.W. Rouse, R.H. Haas, J.A. Schell, D.W. Deering. Monitoring vegetation systems in the Great Plains with ERTS. NASA Special Publication 351, pg. 309–317, 1974. [↩] [↩]
- R. de Jong, S. de Bruin, A. de Wit, M.E. Schaepman, D.L. Dent. Analysis of monotonic greening and browning trends from global NDVI time-series. Remote Sensing of Environment. Vol. 115, No. 2, pg. 692–702, 2011, https://doi.org/10.1016/j.rse.2010.10.011. [↩] [↩] [↩]
- F. Saleh, M. El-Morsy, J. Chen. Detecting forest canopy degradation through multispectral vegetation indices. Forest Ecology and Management. Vol. 433, pg. 123–132, 2019, https://doi.org/10.1016/j.foreco.2018.10.058. [↩]
- L. Delgado-Moreno, X. Gao. Assessing drought impacts on vegetation moisture using NDMI and NDVI in semi-arid ecosystems. Remote Sensing of Environment. Vol. 276, pg. 113074, 2022, https://doi.org/10.1016/j.rse.2022.113074. [↩]
- M. Tomaszewska, G.M. Henebry. NDVI trends and topographic influences in the Central Asian highlands. Environmental Research Letters. Vol. 16, pg. 094012, 2021, https://doi.org/10.1088/1748-9326/ac1a6f. [↩] [↩]
- J. Verbesselt, R. Hyndman, G. Newnham, D. Culvenor. Detecting trend and seasonal changes in satellite image time series. Remote Sensing of Environment. Vol. 114, pg. 106–115, 2010, https://doi.org/10.1016/j.rse.2009.08.014. [↩] [↩] [↩]
- J. Verbesselt, A. Zeileis, M. Herold. Near real-time disturbance detection using satellite image time series. Remote Sensing of Environment. Vol. 123, pg. 98–108, 2012, https://doi.org/10.1016/j.rse.2012.02.022. [↩]
- W. De Keersmaecker, S. Lhermitte, L. Tits, O. Honnay, B. Somers, P. Coppin. A model-driven approach to quantify vegetation dynamics using hierarchical MODIS time series. Remote Sensing of Environment. Vol. 164, pg. 166–176, 2015, https://doi.org/10.1016/j.rse.2015.03.004. [↩] [↩]
- C. Gómez, J.C. White, M.A. Wulder. Optical remotely sensed time series data for ecosystem monitoring: A review. Ecological Indicators. Vol. 111, pg. 106002, 2020, https://doi.org/10.1016/j.ecolind.2019.106002. [↩] [↩] [↩] [↩] [↩]
- H. Nagendra, J. Southworth, C.M. Tucker. Satellite remote sensing of forest change in the Himalayas. Environmental Management. Vol. 51, pg. 567–578, 2013, https://doi.org/10.1007/s00267-012-0025-x. [↩]
- B. Jamali, S. Saatchi, M. Arif, D. Lu. Detecting forest disturbance using NDVI time series and trend analysis in mountainous regions. Remote Sensing. Vol. 14, pg. 2145, 2022, https://doi.org/10.3390/rs14092145. [↩]
- Kyrgyz National Forest Inventory. Forest boundary maps and disturbance records. Ministry of Agriculture, Food Industry and Melioration of the Kyrgyz Republic. 2020–2024. [↩]
- Google Earth Engine. Cloud computing platform for planetary-scale environmental data analysis. https://earthengine.google.com. 2024. [↩]
- S. Foga, P. Scaramuzza, S. Guo, Z. Zhu, R.D. Dilley, T. Beckmann, G.L. Schmidt, J.L. Dwyer, M.J. Hughes. Cloud detection algorithm comparison and validation for Landsat 8 OLI imagery. Remote Sensing of Environment. Vol. 194, pg. 379–390, 2017, https://doi.org/10.1016/j.rse.2017.03.032. [↩]
- Z. Zhu, S. Wang, C.E. Woodcock. Improvement and expansion of the Fmask algorithm: Cloud, cloud shadow, and snow detection for Landsats 4–8, Sentinel-2, and GF-1. Remote Sensing of Environment. Vol. 237, pg. 111599, 2020, https://doi.org/10.1016/j.rse.2019.111599. [↩]
- M. Forkel, N. Carvalhais, J. Verbesselt, M.D. Mahecha, C.S.R. Neigh, M. Reichstein. Trend change detection in NDVI time series: Effects of inter-annual variability and methodology. Remote Sensing. Vol. 5, No. 5, pg. 2113–2144, 2013, https://doi.org/10.3390/rs5052113. [↩]
- H.B. Mann. Nonparametric tests against trend. Econometrica. Vol. 13, No. 3, pg. 245–259, 1945, https://doi.org/10.2307/1907187. [↩]
- M.G. Kendall. Rank Correlation Methods. 4th edn. Charles Griffin, London. 1975. [↩]
- R.O. Gilbert. Statistical Methods for Environmental Pollution Monitoring. Van Nostrand Reinhold, New York. 1987. [↩]
- Z. Zhu, S. Piao, R.B. Myneni, M. Huang, Z. Zeng, J.G. Canadell, P. Ciais, S. Sitch, P. Friedlingstein, A. Arneth, C. Cao. Greening of the Earth and its drivers. Nature Climate Change. Vol. 6, No. 8, pg. 791–795, 2016, https://doi.org/10.1038/nclimate3004. [↩] [↩] [↩]
- R.M. Hirsch, J.R. Slack, R.A. Smith. Techniques of trend analysis for monthly water quality data. Water Resources Research. Vol. 18, pg. 107–121, 1982, https://doi.org/10.1029/WR018i001p00107. [↩]
- S. Estel, T. Kuemmerle, C. Levers, P. Hostert. Mapping cropland expansion in Central Asia using Landsat time series. Environmental Research Letters. Vol. 13, pg. 024020, 2018, https://doi.org/10.1088/1748-9326/aaa5f6. [↩]