Abstract
Coaches and bowlers frequently assert that a good length just outside off stump maximizes dismissal probability in T20 cricket. This study evaluates that belief using ball-by-ball Hawkeye tracking data from the Indian Premier League. This is a descriptive, observational study. We report wicket rates by length zone with 95% confidence intervals and a chi-square test. After applying quality filters to pitch impact coordinates and ball speed, the final dataset contains roughly 140,000 legal deliveries, with wickets identified from dismissal metadata. We use kernel density visualizations and zone-based wicket rates to compare wicket-taking deliveries against the overall targeting distribution, and we further examine how spatial patterns differ by bowling style. Across all deliveries, both general targeting and wicket locations concentrate in the traditional off-stump corridor, with wicket deliveries clustering more tightly and slightly fuller than non-wicket balls (roughly 4.5–7 m from the stumps). Wicket rates by zone range from 4.18% (Short) to 6.61% (Very Short/Bouncer) — a gap of 2.43 percentage points (95% CI [1.92, 2.94] pp; χ² = 150.6, df = 4, p < 0.001). Full lengths are also high (5.78%), while Good Length and Yorker zones sit in between. Bowling styles show clear structural differences: pace wickets occur in a broader off-stump corridor with a wider length spread, while spin wickets form tighter, more central clusters near the stumps at shorter lengths (about 4–6 m). Leg spin produces the highest share of bowled and leg-before-wicket dismissals among spin styles, consistent with a more stump-targeted wicket mechanism than pace. Ball-speed distributions (km/h) for seam bowling overlap heavily between wicket and non-wicket deliveries, suggesting speed alone does not strongly predict wicket outcomes. Overall, the observed wicket distributions are broadly consistent with the traditional “good length outside off” benchmark as a commonly targeted zone, and reveal meaningful style-based differences in where wickets concentrate spatially. Because bowlers choose where to pitch strategically, these patterns should be interpreted as observational associations rather than causal effects.
Keywords: cricket analytics, Hawkeye, wicket probability, line and length, T20 cricket, Powerplay, spin versus pace
Introduction
Background and Context
In high level cricket, the concepts of line and length are essential to bowling tactics and strategy. Coaches, commentators, and players emphasise that “a good length just outside the off stump” is the most important method for getting dismissals. This is often known as the “corridor of uncertainty”, as it is assumed the batter will be stuck in two minds and will play hesitantly. Despite its prominence in cricketing discourse, this is a claim that has not been validated by large-scale aggregate data analysis, due to historic limitations in data availability and accurate measurement1.
Ball-tracking technologies have transformed the analytical landscape of cricket2.
With great temporal and positional resolution, these systems record the spatial trajectory of every delivery, including the ball’s exact pitching location, lateral deviation with respect to the stumps, and speed. Ball-level spatial data allows for a more detailed description of how wickets are formed, whereas previous work in cricket analytics has mostly concentrated on match-level outcomes or player valuation3,4. Crucially, ball-level spatial variables offer an interpretable structure that directly relates to bowling intent, making it possible to assess hypotheses regarding line, length, and dismissal risk in a manner that is not possible with aggregate or match-level results.
Twenty20 cricket provides a particularly compelling context for such analysis. The compressed nature of the format amplifies the importance of each delivery, encourages aggressive batting, and forces bowlers to operate under heightened risk-reward constraints. As a result, small differences in spatial targeting may carry meaningful consequences for wicket-taking probability. Understanding whether commonly cited “danger areas” on the pitch genuinely confer an advantage, and how these areas shift across match situations, remains an open empirical question5,6,7.
Problem Statement and Rationale
Although coaching wisdom strongly asserts that specific regions of line and length are optimal for inducing dismissals, most supporting evidence is anecdotal or inferred from aggregate statistics. In this study, the “corridor of uncertainty” is defined as deliveries landing within pitch_x ∈ [−0.40, +0.10] m of middle stump and pitch_y ∈ [5.50, 7.50] m from the stumps — the spatial band most commonly referenced in coaching literature as the optimal targeting zone. Existing academic studies in cricket analytics often report modest predictive power when relying on contextual or match-level features, while comparatively fewer studies examine ball-level spatial patterns in a systematic and hypothesis-driven manner8,9,10. When spatial features are included, they are frequently discretized coarsely or treated descriptively, limiting their usefulness for tactical decision-making.
This gap is especially important in T20 cricket, where bowlers rarely deliver uniformly across the pitch. Instead, they select lines and lengths strategically, conditioned on phase of play, batter handedness, and bowling style. Any analysis that fails to account for this selection behavior risks conflating intent with effectiveness. A rigorous evaluation therefore requires both fine-grained spatial modeling and careful conditioning on match context. As a result, observed wicket locations reflect both bowler choice and batter response, making careful conditioning essential for separating spatial effectiveness from selective targeting.
The present study addresses this gap by estimating wicket probability as a smooth function of line and length, using high-resolution ball tracking data from the Indian Premier League. Rather than asking whether wickets occur in certain zones in absolute terms, we ask whether targeting specific regions yields measurable gains relative to where bowlers already choose to bowl, once low-support regions are masked and contextual factors are accounted for.
Significance and Purpose
This work contributes to cricket analytics in three key ways. First, it provides a quantitative test of long-standing coaching claims using ball-level spatial data, moving beyond intuition toward measurable effect sizes. Second, it demonstrates how wicket probability surfaces vary across bowling styles, phases of play, and batter handedness, highlighting that no single “optimal” line and length exists in isolation. Third, the analysis produces interpretable, situation-conditioned spatial summaries that can inform tactical planning without requiring complex predictive models11,12,13,14,15.
From a practical perspective, the findings are directly relevant to coaches and analysts seeking marginal gains in high-stakes environments such as the Powerplay (the first six overs of a T20 innings)16. Even small absolute increases in wicket probability per ball can meaningfully influence match outcomes over the course of a tournament. At the same time, the study also highlights the limits of spatial targeting alone, and the continued importance of execution, match context, and bowler skill in any dismissal outcome. The risk–reward framing is consistent with resource-based limited-overs models that treat remaining balls and wickets as joint scoring resources17,18.
Throughout the study, visual analyses are used not as endpoints but as motivation for formal hypothesis testing, allowing intuitive cricketing concepts to be evaluated quantitatively.
Objectives
The study is guided by five objectives, each formalized as a testable hypothesis grounded in cricketing intuition and evaluated using ball-level spatial data. The first objective quantifies how wicket probability varies across the continuous dimensions of line and length in T20 cricket. The second compares wicket-taking spatial patterns between pace and spin bowling styles. The third describes how wicket rates vary across match phases, focusing on the Powerplay. The fourth and fifth look at batter handedness and ball speed descriptively. Formal modelling of these factors is left for future work.
Scope and Limitations
The analysis is restricted to men’s IPL matches with valid ball tracking data and focuses exclusively on legal deliveries. The primary explanatory variables are the ball’s pitching coordinates relative to the stumps, with supplementary splits by bowling style, match phase, and batter handedness. The study does not attempt to model batter skill, bowler intent explicitly, or fielding configurations (extensions including multivariate logistic regression with line x length x speed x phase x handedness interactions are acknowledged as natural future work), and therefore cannot establish causal effects. Accordingly, estimated wicket probability surfaces should be interpreted as conditional associations rather than causal effects.
Importantly, all findings should be interpreted as observational. Bowlers choose where to pitch the ball strategically, and regions with higher wicket rates may reflect selective use rather than intrinsic superiority. To mitigate this, low-support regions are masked and comparisons are made relative to empirical targeting distributions. Nevertheless, residual selection bias remains an inherent limitation19. Other unmeasured factors — batter quality, fielding placement, and pitch conditions — are not modelled and may influence observed wicket rates. Hawkeye positional error at impact is typically a few centimetres, small relative to the zone boundaries used.
Theoretical Framework
The analysis is grounded in a spatial risk-reward framework of bowling decision-making. In this view, each delivery represents a choice over a two-dimensional action space defined by line and length, with associated probabilities of conceding runs or taking wickets. Bowlers implicitly navigate this space based on match context, skill constraints, and perceived batter vulnerability. By estimating wicket probability surfaces conditioned on context, the study seeks to approximate the payoff structure underlying these decisions in a form that is both interpretable and empirically grounded.
Methodology Overview
Using ball-by-ball tracking data from the IPL, the study constructs a cleaned and standardized dataset of pitching locations, dismissal outcomes, bowling styles, match phases, and batter handedness. Zone-based aggregation and smooth spatial density approaches are used to estimate wicket probability. The Methods section that follows provides a detailed description of statistical processes, preprocessing steps, and methodological decisions.
Methods
We use ball-by-ball tracking from the HawkeyeStats IPL men’s dataset. The table includes batter and bowler identifiers, bowling style, ball speed, pitch impact coordinates (pitch_x, pitch_y), ball position at the stumps (stumps_x, stumps_y), post-contact landing on the field (field_x, field_y), runs, extras, and a text field with dismissal details. Match-level tags for format and gender are present.
| Attribute | Description |
| match_id | Identifier for each match in the IPL dataset. |
| delivery | Number identifying each legal delivery within an over. |
| ball | Ball number (1-6) within an over. |
| batter | Name of the batter facing the delivery. |
| batter_id | Unique numeric identifier for the batter. |
| right_handed_bat | Boolean flag indicating whether the batter bats right-handed. |
| non_striker | Name of the non-striker at the opposite end. |
| non_striker_id | Unique numeric identifier for the non-striker. |
| bowler | Name of the bowler delivering the ball. |
| bowler_id | Unique numeric identifier for the bowler. |
| right_armed_bowl | Boolean flag indicating whether the bowler bowls with the right arm. |
| bowling_style | Type of bowling action (e.g., FAST_SEAM, MEDIUM_SEAM, OFF_SPIN, LEG_SPIN). |
| ball_speed | Recorded release speed; m/s in the raw data, converted to km/h for figures. |
| runs | Total runs scored from the delivery, including extras. |
| batter_runs | Runs credited to the batter from the shot. |
| bowler_runs | Runs conceded by the bowler from the delivery. |
| extras | Runs not credited to the batter (e.g., wides, no-balls, leg-byes). |
| pitch_x | Horizontal (lateral) coordinate of the ball’s pitching location, measured in meters from the middle stump (negative = leg side, positive = off side). |
| pitch_y | Longitudinal coordinate of the ball’s pitching location, measured in meters from the stumps along the pitch (0 = base of stumps). |
| stumps_x | Lateral position of the ball when it passes the stumps, in meters. |
| stumps_y | Vertical height of the ball at the stumps, in meters. |
| field_x | X-coordinate of where the ball lands or is fielded after contact, measured across the field in meters. |
| field_y | Y-coordinate of ball landing/fielding position, in meters from the pitch. |
| match_format | Match format indicator (T20, T10, etc.). |
The key variables used in this initial analysis are pitch_x, the lateral distance from middle stump in meters; pitch_y, the distance from the stumps along the pitch in meters; dismissal_details, used to derive the binary indicator is_wicket (true when dismissal_details is non-null); bowling_style, retained for later splits by bowler type; and ball_speed, used for the speed comparisons that follow.
Processing and quality steps were applied in sequence. Column names were standardized to lowercase snake_case. Pitch-impact outliers were removed by keeping pitch_x in [−2, 2] m and pitch_y in [0, 22] m, which eliminates obvious sensor or parsing errors visible in the raw scatter. These bounds were chosen to retain all plausible delivery locations while discarding clear recording artifacts. The wicket label was constructed as is_wicket = dismissal_details.notna(). Length zones were defined to match standard coaching language: Yorker (0.0–3.0 m), Full (3.0–5.5 m), Good length (5.5–7.5 m), Short (7.5–10.0 m), and Bouncer or very short (10.0–22.0 m). These cutoffs follow zone definitions used in prior cricket analytics work. Kernel density bandwidths were selected using Silverman’s rule20,21, and a sensitivity check confirmed the main patterns are stable across nearby bandwidth values. For the speed plots, missing speeds and values under 10 km/h were dropped to remove implausible readings. After all filters, the working set contains roughly 140,000 valid deliveries.
All plots in this section are seaborn KDEs or bar charts on the filtered frame. No oversampling or model fitting is used. Analysis was conducted in Python 3.11 using pandas22 2.x, numpy23 1.x, seaborn24 0.13.x, and matplotlib25 3.x. Data were retrieved from the HawkeyeStats IPL dataset (github.com/alittlefitness/HawkeyeStats) in January 2026.
Several caveats apply to the analyses that follow. Context mixing is unavoidable in the pooled plots, since powerplay, middle, and death overs are combined and pace and spin are pooled together; patterns can flip by phase and bowler type. Right- and left-handed batters are not separated in this initial analysis, and line hotspots are expected to shift between off-side and leg-side targeting. The length-zone cutoffs are approximate, and a sensitivity check around the 5.5 and 7.5 m boundaries would be informative. Finally, some recorded ball speeds were zero or otherwise implausible, so values under 10 km/h were filtered before the speed-density plot.
Results
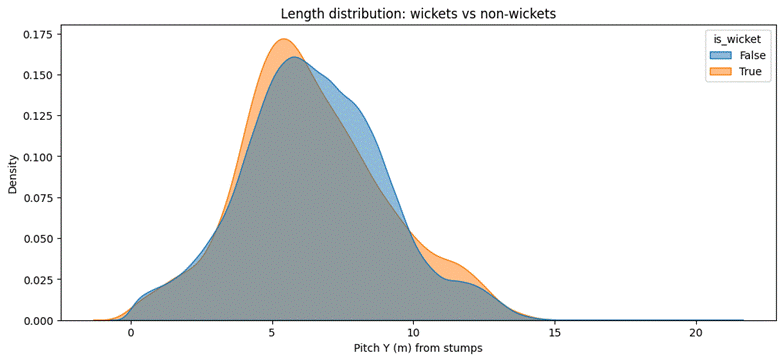
This density comparison tracks the vertical coordinate pitch_y, showing how far from the stumps the ball pitches.
Non-wicket balls span a wider range, while wickets cluster more tightly between roughly 4.5m-7m. The wicket curve leans slightly left (fuller lengths).
The data are consistent with fuller lengths being associated with higher concentration of wicket deliveries, though the analysis cannot establish whether this reflects intrinsic effectiveness or selective deployment. Extremely full or short lengths show lower wicket concentration except in specific contexts.
Describes the length range in which observed wickets concentrate, corresponding to the “corridor of dismissal” coaches discuss.
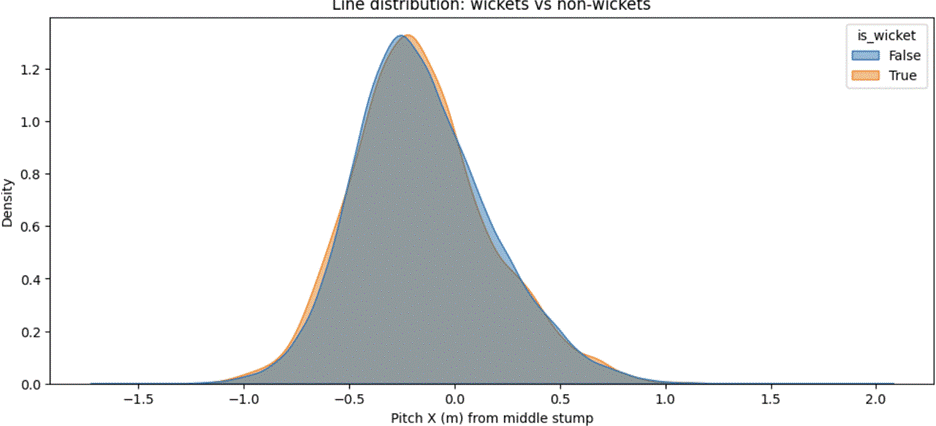
A density plot comparing pitch_x (horizontal line) distributions for wicket-taking and non-wicket deliveries.
Both curves peak near zero, showing that most deliveries land close to the stumps. The wicket curve is slightly narrower and more centered, implying fewer wide or leg-side balls result in dismissals.
Wicket deliveries are more concentrated near the stumps than non-wicket deliveries. Line consistency is associated with higher wicket concentration in this dataset; deliveries wide off or down leg show lower observed wicket rates.
These data are consistent with the view that lateral accuracy, alongside length, is associated with wicket outcomes.
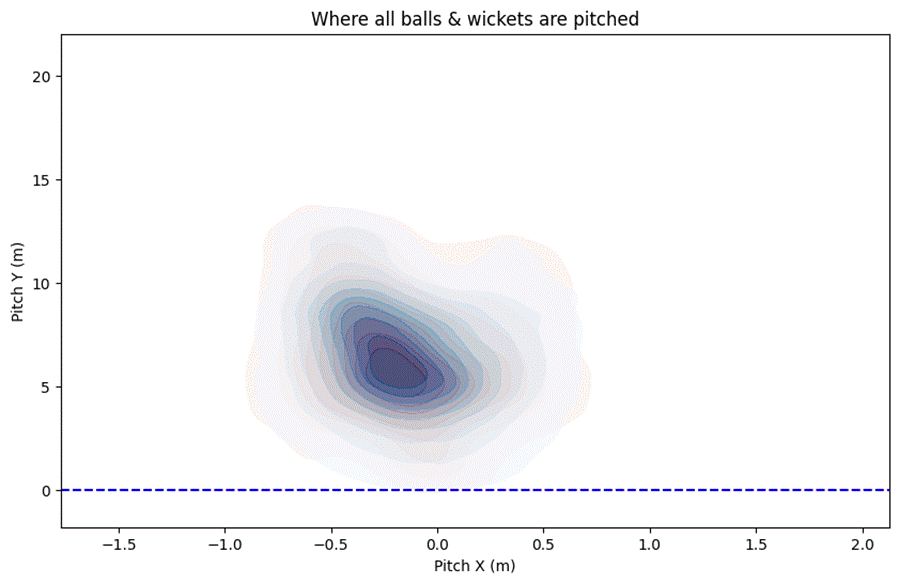
This KDE heatmap overlays all deliveries and wicket deliveries on the same coordinate system20,26. pitch_x represents the lateral distance from middle stump, and pitch_y measures how far down the pitch the ball lands. The darker zones indicate where more deliveries land — not higher wicket probability.
The overall impact zone is centered just outside the off-stump corridor around 5-8 m from the stumps, which is the traditional “good length” region. The wicket heatmap tightens around that same channel but shifts slightly fuller, suggesting wicket balls tend to pitch marginally closer to the batter.
This pattern is consistent with the conventional understanding that a good-length line targeting the off-stump is an area of high bowling activity and wicket concentration. It also indicates bowlers consistently aim there, suggesting reliable ball-tracking data quality.
This serves as the baseline for all subsequent analyses. Any deviation by bowler type or dismissal category can be compared against this reference distribution.
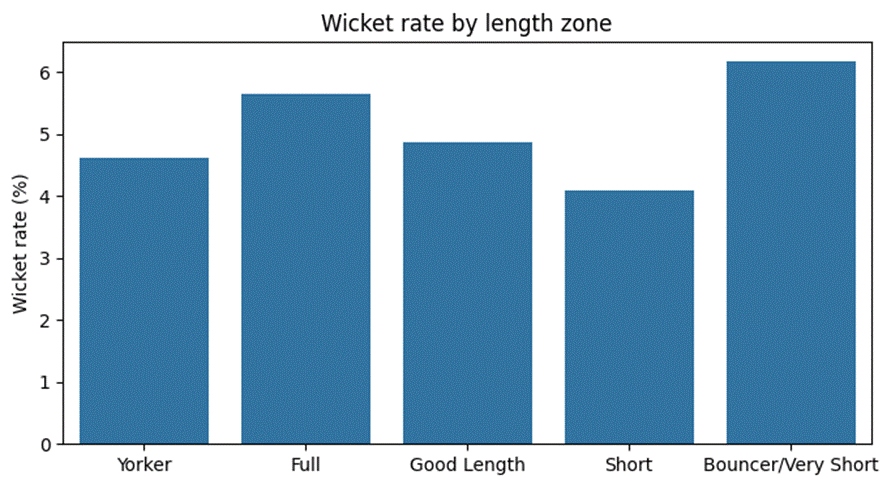
Bar chart comparing wicket percentages across five pre-defined length zones: Yorker, Full, Good Length, Short, and Bouncer/Very Short.
The Full and Bouncer/Very Short zones exhibit the highest wicket rates (5.78% and 6.61% respectively). Good Length and Yorker zones also perform respectably, while Short is least effective.
Fuller deliveries are associated with higher rates of bowled and LBW dismissals; short or bouncer deliveries are associated with caught dismissals, likely from top-edged hook or pull shots. The high bouncer figure may partly reflect fewer samples or death-over skew.
Reveals where wicket outcomes cluster tactically and provides a first numeric base for predictive modeling (e.g., logistic regression later).
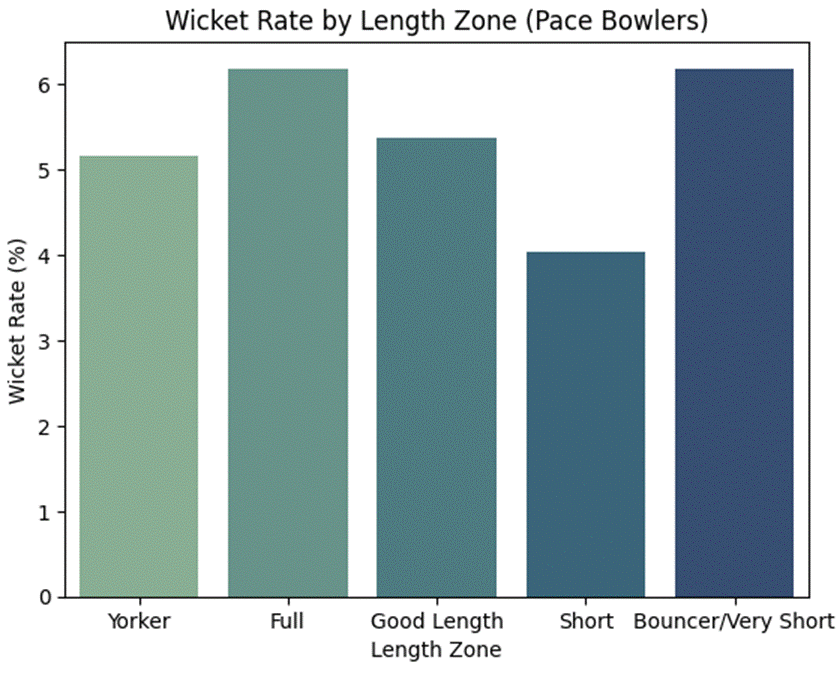
The chart above shows the percentage of wickets taken by pace bowlers across different length zones, categorized as Yorker, Full, Good Length, Short, and Bouncer/Very Short. The wicket rate measures the proportion of deliveries from each length that resulted in a wicket.
From the data, the Full and Bouncer/Very Short lengths record the highest wicket rates, both around 6%, followed closely by Good Length deliveries at about 5.4%. Yorkers contribute a slightly lower wicket rate at approximately 5%, while Short-pitched deliveries show the lowest effectiveness at around 4%.
These observed rates are consistent with pace bowlers generating a higher proportion of wickets from fuller deliveries or short-pitched balls, though the analysis cannot determine whether this reflects causal effectiveness or selective use in specific match contexts. The Full and Yorker lengths are often associated with bowled and leg-before-wicket dismissals, where the ball targets the base of the stumps. In contrast, the Bouncer/Very Short length may produce wickets through catches behind the wicket or at square-leg positions due to mistimed hook or pull shots.
The lower wicket rate from Short deliveries implies that while they may be useful for containment or building pressure, they are less likely to directly produce dismissals. This is consistent with the coaching view that full-length and short-pitched deliveries are associated with different dismissal mechanisms in fast bowling.
Overall, these observed patterns are consistent with the coaching view that full-length and well-directed short-pitched deliveries are associated with higher pace-bowling wicket rates. Whether this association reflects a causal effect of length selection cannot be determined from these observational data alone.
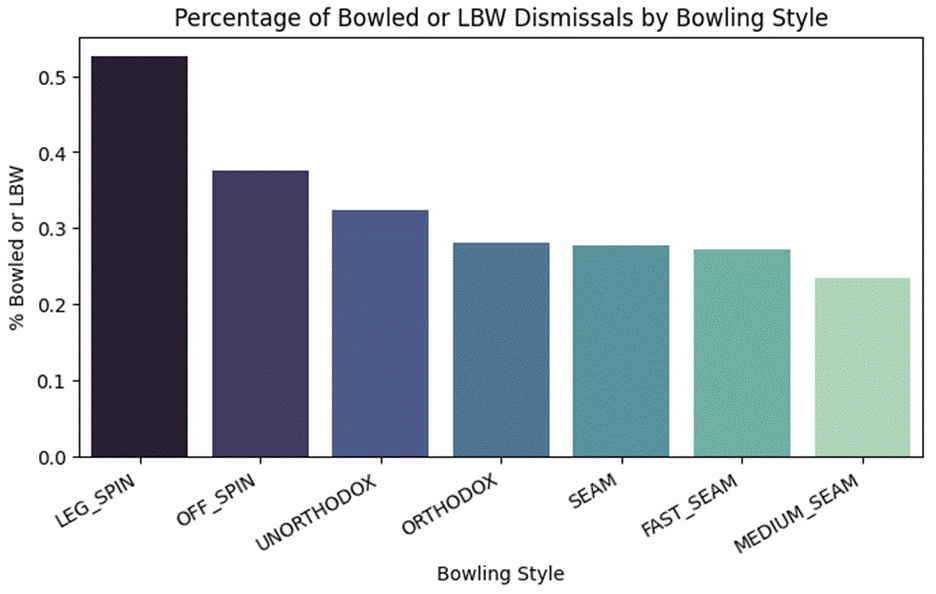
The chart illustrates the proportion of wickets that resulted from bowled or leg-before-wicket (LBW) dismissals across different bowling styles. These modes of dismissal generally occur when the bowler directly challenges the stumps, either by beating the batter’s defense or by trapping them in front.
The data show that leg spin bowlers have the highest share of bowled or LBW dismissals — around 10 percent of their total wickets (10.3%, 95% CI [8.5%, 12.4%]). This pattern is consistent with the attacking nature of leg spinners, who typically flight the ball and target the stumps. Off spinners follow at around 9 percent (8.8%, 95% CI [6.7%, 11.3%]), also showing a tendency to target the stumps, although their lines are often slightly wider.
Among seamers, the share is lower: fast seam 5.1%, medium seam 4.4%, and seam 5.9%. This lower percentage can be explained by the fact that seamers frequently induce edges rather than direct stump hits, leading to a higher number of caught dismissals in the slips or behind the wicket.
Interestingly, unorthodox and orthodox spin styles occupy a middle ground, suggesting that while they occasionally attack the stumps, their variations and wider angles of delivery produce a more balanced mix of wicket types.
Overall, the data indicate that leg spin bowling shows the highest observed share of stump-targeting dismissals among the styles in this dataset. This pattern is consistent with the traditional view that leg spinners, through turn and variation, are associated with a higher proportion of bowled and LBW dismissals than other styles.
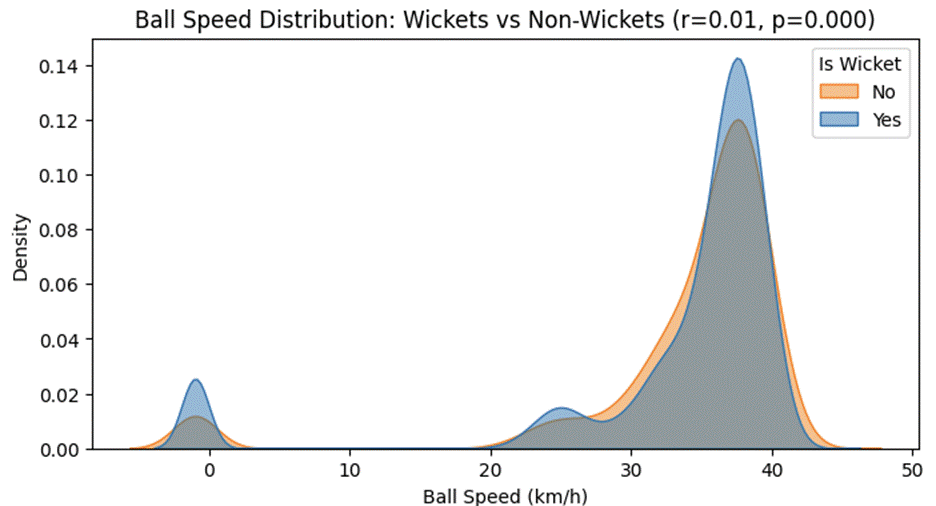
The figure above compares the distribution of ball speeds for deliveries that resulted in wickets versus those that did not, focusing on seam bowlers. The density curve represents how frequently certain ball speeds occur, with the height of the curve showing the relative concentration of deliveries within that range.
The y-axis represents density, a normalized measure of how concentrated deliveries are within a given range of ball speeds. Unlike raw frequency counts, density visualizations smooth out the distribution, showing where deliveries most commonly occur. The large peak between 35 and 42 m/s indicates that the majority of seam deliveries were bowled at typical professional speeds (approximately 125-145 km/h), while the near-zero cluster reflects sparse, likely erroneous readings.
Most deliveries cluster between 35 and 42 m/s (approximately 125–145 km/h), with a secondary, smaller cluster at lower speeds. Both wicket and non-wicket distributions overlap almost entirely, meaning the proportion of wickets is nearly the same across the full speed range.
In simpler terms, faster deliveries do not necessarily produce more wickets among seam bowlers. This finding aligns with cricketing intuition that accuracy, movement, and variation often play a more decisive role than sheer pace. For instance, bowlers who can consistently pitch the ball in challenging areas may be just as effective, or even more so, than those who rely purely on speed.
The minor cluster near zero speed most likely represents data irregularities or misclassified deliveries, possibly due to incomplete tracking on slower or mismeasured balls. These anomalies have no meaningful impact on the broader analysis but are a reminder of the importance of preprocessing in large tracking datasets.
Overall, the distributions show that ball speed, within the observed range for seam bowlers, is not strongly associated with wicket outcomes. These data are consistent with wicket likelihood in pace bowling arising from a combination of factors beyond speed alone, including spatial targeting, movement, and match context.
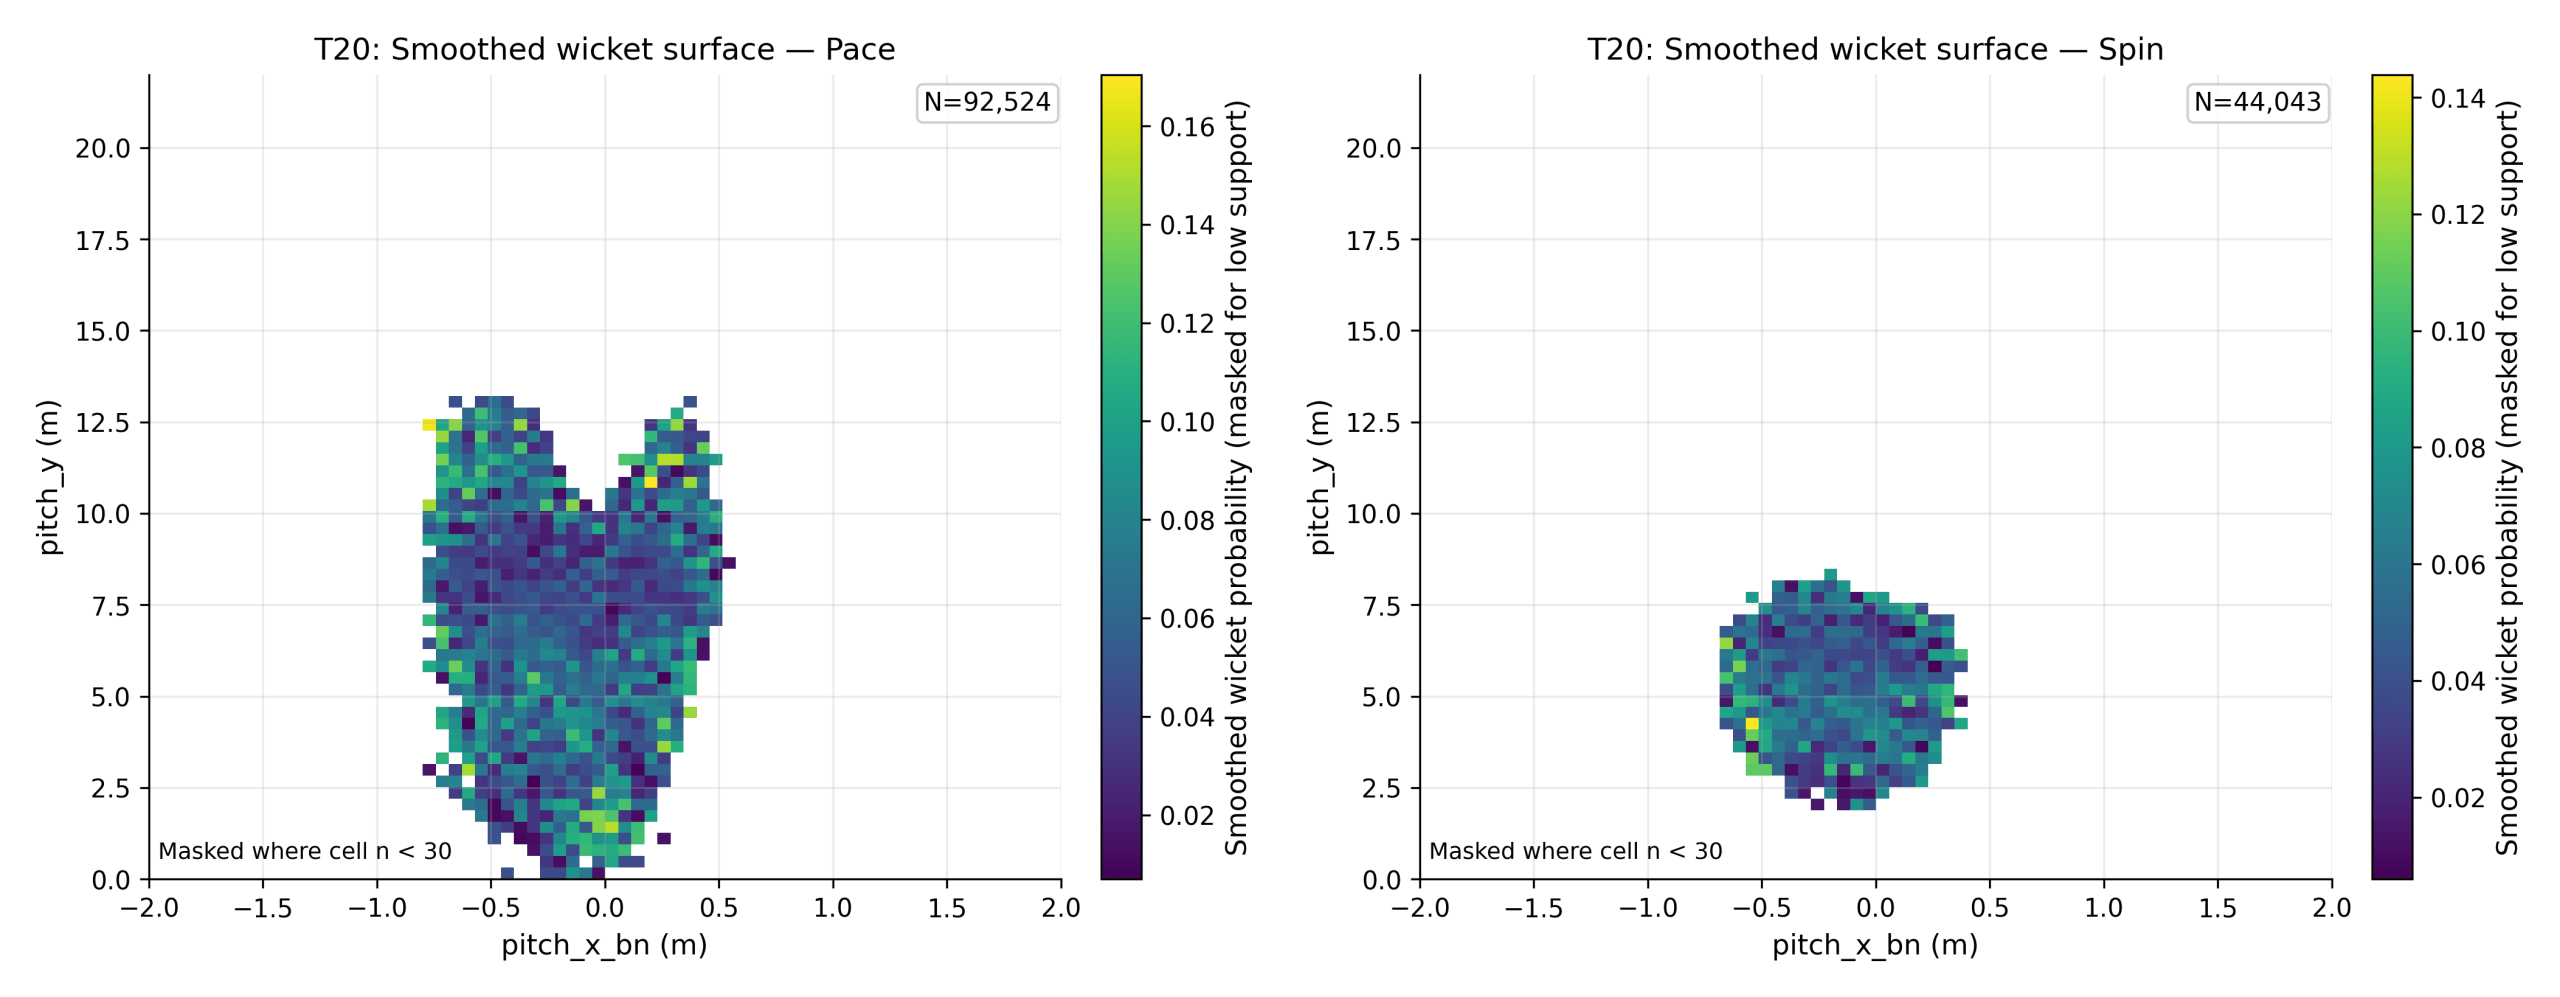
These patterns are consistent with the view that pace and spin bowlers operate with contrasting spatial strategies. Pace wickets concentrate across a broader line-and-length envelope, while spin wickets cluster more tightly near the stumps. This distinction is consistent with established cricketing principles distinguishing seam-and-swing mechanics from spin-and-flight mechanics.
For pace bowlers, the highest wicket rates appear just outside off stump (pitch_x ≈ −0.18 m) and in the good-to-full length range (pitch_y ≈ 6–8 m). This matches the “corridor of uncertainty” described in coaching literature. Pace wickets (n = 4,908) have a mean landing position of pitch_x = −0.178 m (95% CI [−0.187, −0.168]) and pitch_y = 6.945 m (95% CI [6.866, 7.025]). Pace wicket rates spread across a wider area than spin, reflecting the role of seam movement, swing, and length variation in creating dismissal opportunities.
Spin bowlers show a tighter high-rate zone, centered closer to the stumps (pitch_x ≈ −0.13 m) and slightly shorter (pitch_y ≈ 4–6 m). Spin wickets (n = 2,080) land closer to the stumps: mean pitch_x = −0.125 m (95% CI [−0.137, −0.113]) and pitch_y = 5.208 m (95% CI [5.151, 5.265]). Both differences are statistically significant (pitch_x: t = −6.69, p < 0.001; pitch_y: t = 34.81, p < 0.001), confirming that pace and spin wickets concentrate in meaningfully different regions of the pitch. The narrower surface is consistent with spin bowling relying more on accuracy, flight, and turn than on varying line and length.
The two surfaces illustrate a key structural difference: pace bowlers are associated with higher wicket rates across a broader spatial range, while spin bowlers show concentrated high-rate zones near the stumps.
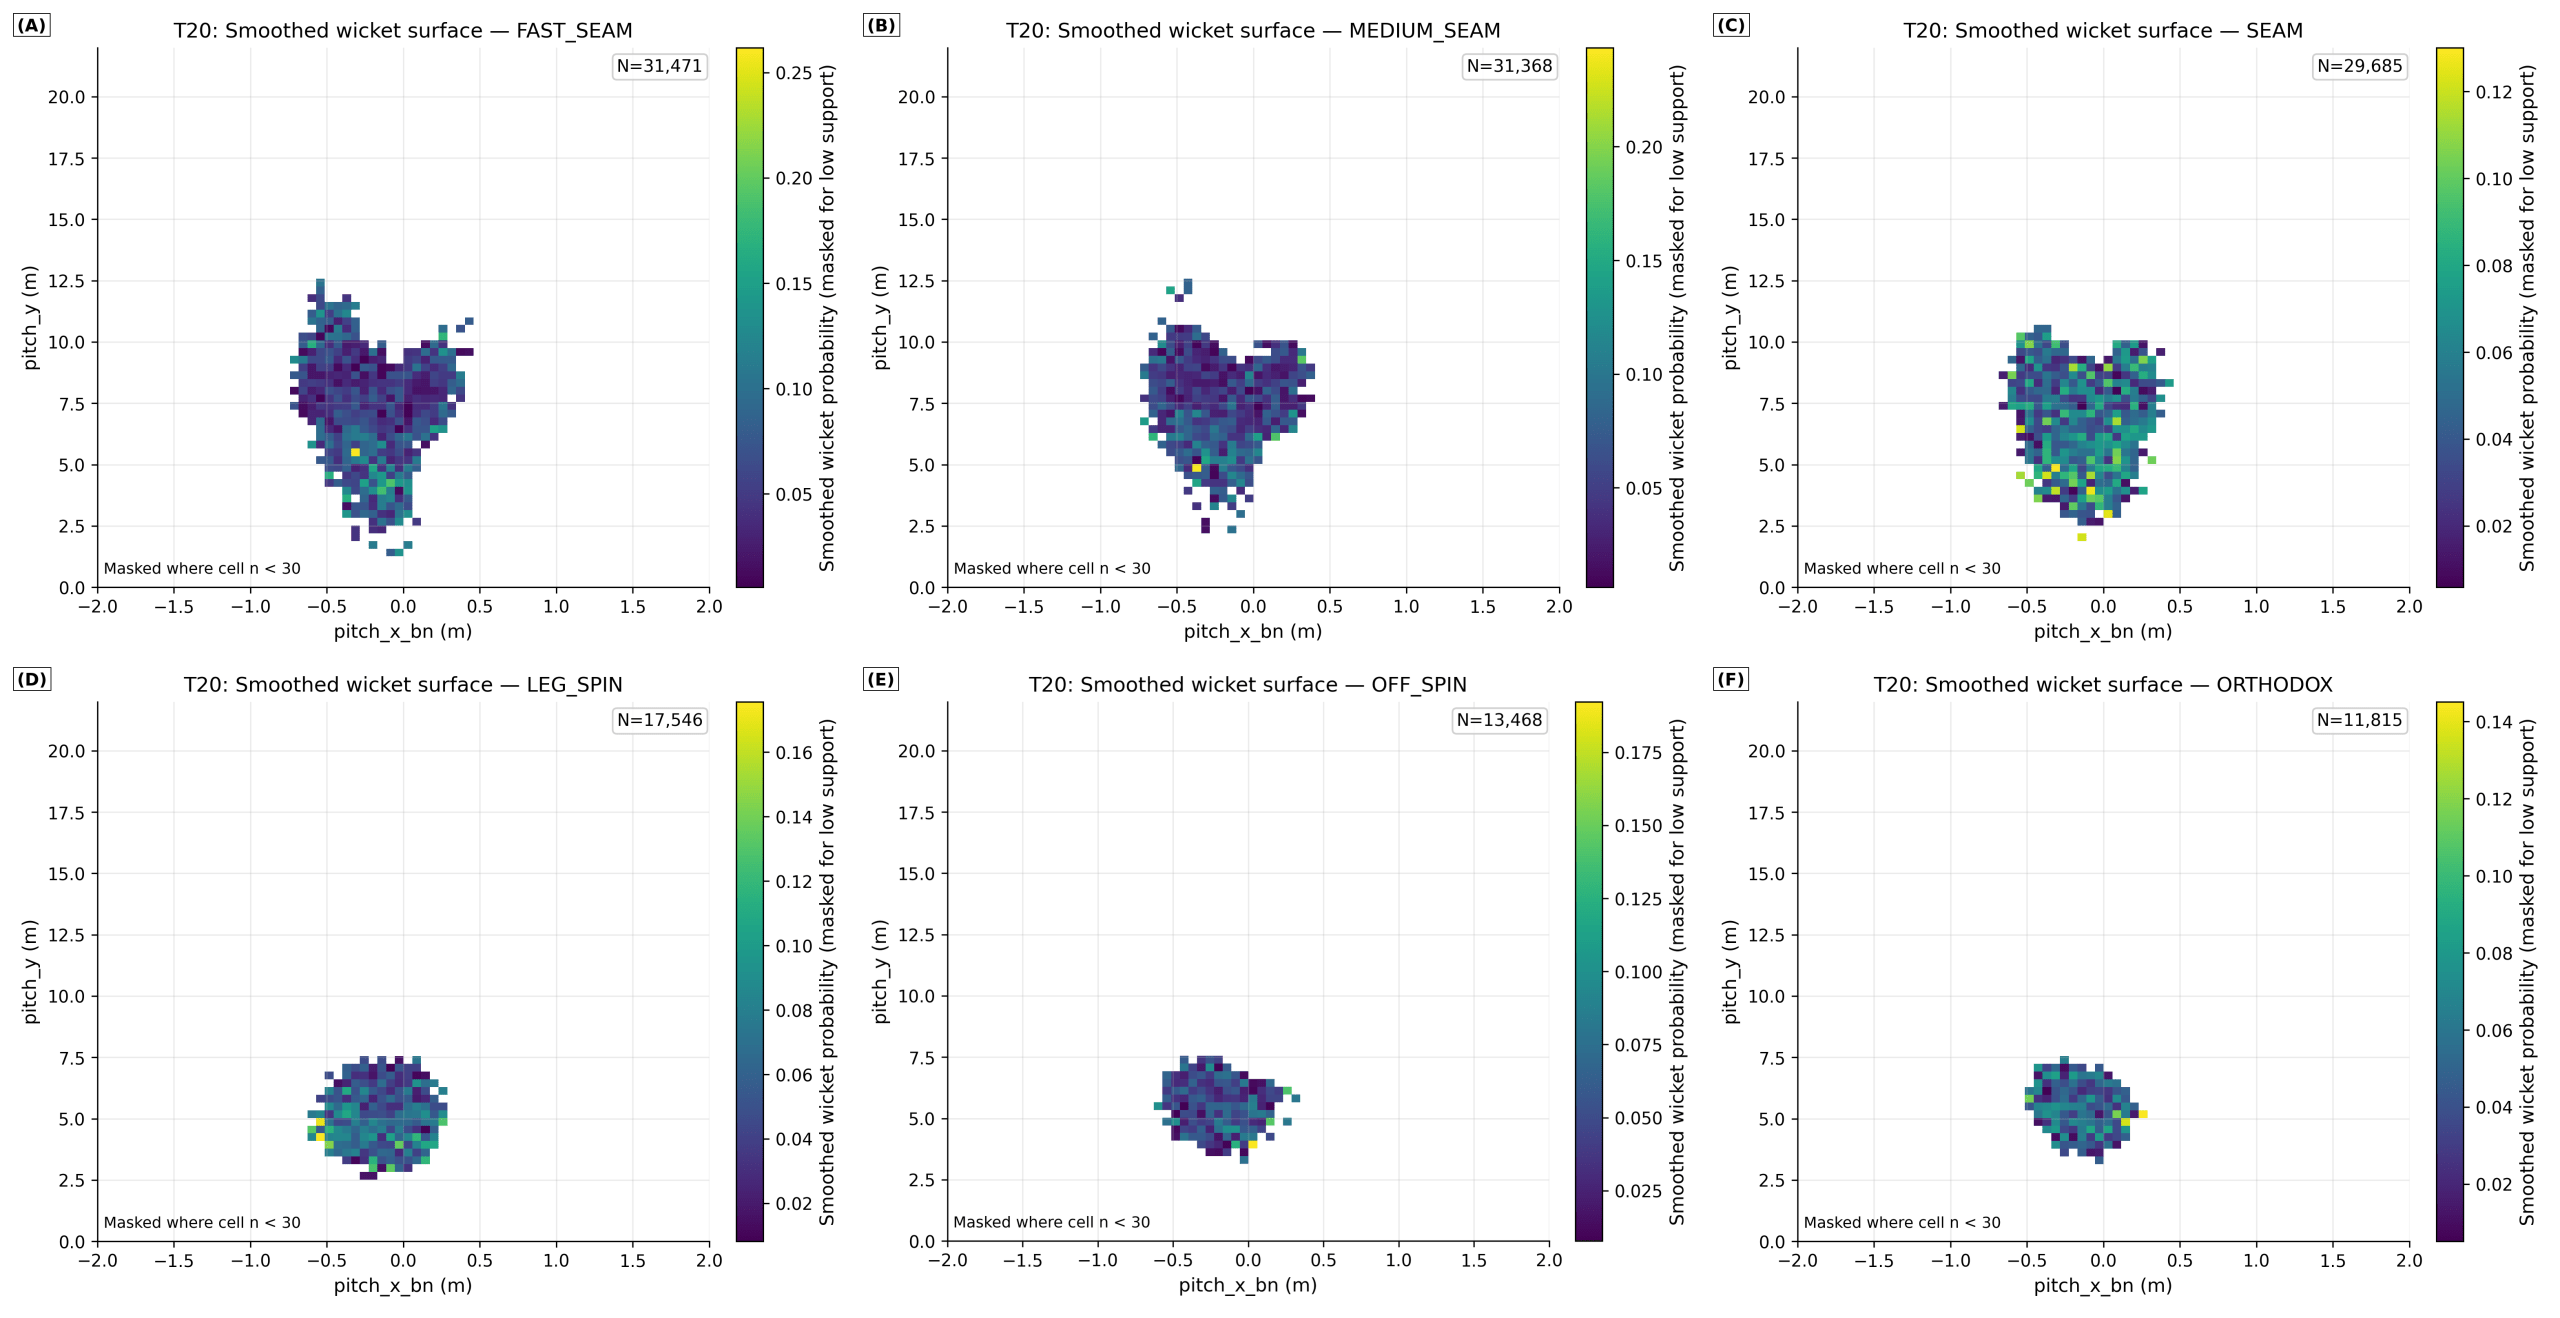
Figure 9 shows a smoothed wicket-rate surface for each bowling style — how often deliveries in each pitch zone result in a wicket, not just where wickets occurred. Panels with low delivery counts are masked. The sample size (n) is total deliveries, not wickets, so the surfaces are normalized for how much each zone is actually used.
Fast seamers (n = 1,845) show a distinct hotspot just outside the off stump (pitch_x ≈ -0.4 m) and on a full-to-good length (pitch_y ≈ 6-8 m). This zone aligns closely with the “corridor of uncertainty” typically targeted in pace bowling. The contours indicate a balanced spread both vertically and horizontally, suggesting that wickets come from a range of lengths including fuller balls that swing and shorter deliveries that extract bounce. Seam bowlers (n = 1,504) display a similar but slightly more centralized pattern, implying that seamers bowl marginally straighter and rely on movement off the pitch rather than in the air. Both groups show vertical extension up to around 10 meters, indicating a mix of attacking lengths such as yorkers and back-of-a-length deliveries.
Together, these surfaces show that pace styles are associated with higher wicket rates just outside off stump at good-to-full lengths, consistent with the role of swing and seam movement in those zones. The difference between fast seam and seam bowlers highlights how speed and pitch conditions influence the precision and length required to create wicket opportunities.
Medium seamers (n = 1,750) exhibit a concentration slightly closer to the stumps (pitch_x ≈ -0.2 m) and at a more conservative length (pitch_y ≈ 7-9 m). The density contour appears broader but less intense, reflecting a style that prioritizes consistency over sheer pace. These bowlers often depend on lateral deviation, cutter variation, or subtle changes in release rather than high velocity. The relatively larger vertical spread implies that medium seamers adjust their lengths frequently to suit match situations, using slower balls and wobble-seam deliveries to create deception. The result is a wider dispersion of wicket points but with a focus on areas that challenge defensive technique.
Orthodox spinners (n = 523) show a compact hotspot centered almost directly in line with the stumps (pitch_x ≈ 0 m) and at a length of 4-6 meters. The limited spread along both axes reflects high accuracy and control. This position is optimal for inducing LBW or bowled dismissals, as it forces the batter to play at deliveries that can turn in or straighten. The smaller dataset means some caution should be taken when generalizing, but this is consistent with the classical spin approach of attacking the stumps with a probing line.
Unorthodox spinners (n = 53), while represented by a smaller sample size, show a slightly fuller average length (pitch_y ≈ 5-7 m) and a wider horizontal dispersion. This spread likely reflects their more varied release points and flight trajectories, as unorthodox bowlers depend on unpredictability rather than repetition. However, the low sample count limits statistical confidence, suggesting that further data collection is needed to establish robust conclusions for this group.
Off spinners (n = 600) demonstrate a dense cluster just outside off stump on a moderate length (pitch_y ≈ 5-6 m). The proximity of this hotspot to the stumps indicates an attacking intent, with wickets commonly achieved through turn that beats the inside edge or through induced mis-hits when batters attempt to drive. The distribution’s slight skew toward the off side is consistent with traditional right-arm off-spin lines bowled to right-handed batters.
Leg spinners (n = 923), by contrast, show a hotspot similar in depth (pitch_y ≈ 5-6 m) but more centered on the middle stump. This difference reflects their natural variation: leg breaks and googlies that attack both edges of the bat. The density contour is slightly wider, suggesting a more diverse mix of release trajectories and spin magnitudes. Despite this variability, the central cluster supports the idea that leg spinners are the most direct stumps-targeting variety, capable of producing both bowled and LBW dismissals. The relatively larger sample size adds confidence to these observations.
Across bowling styles, several key trends emerge:
Pace-oriented bowlers (fast, seam, and medium seam) generate wickets from a broader range of lines and lengths, emphasizing the value of movement and variation.
Spin bowlers (off, leg, orthodox) concentrate their efforts nearer to the stumps, prioritizing accuracy, flight, and turn.
The tighter clusters in spin bowling plots contrast with the diffuse zones for pace bowlers, showing how wicket-taking methods differ: consistency and deception versus speed and variability.
Sample size differences are also instructive. The much larger datasets for fast seamers and seamers provide robust statistical reliability, while smaller samples for spin types, particularly unorthodox bowlers, highlight the need for cautious interpretation.
Discussion
In T20 cricket, the pooled line and length distributions offer a helpful starting point for figuring out where bowlers actually play. Pitching positions are concentrated between five and eight meters from the stumps and just outside the off stump on all deliveries. This area closely resembles the conventional phrase “good length just outside off,” which predominates in professional coaching terminology. Bowlers regularly target this area, as shown by the density of deliveries here, making it a suitable benchmark for assessing wicket-taking effectiveness.
Fuller and good-length deliveries have greater dismissal rates than short-pitched balls when wicket rates are calculated within discrete length zones. In line with their function as an attacking option in death overs, when bowled and LBW dismissals are more frequent, Yorkers also produce a significant number of wickets. The short-length category, on the other hand, displays lower total wicket rates, indicating that short balls are often used as setup deliveries or for containment than as the main way of getting wickets.
The comparatively high wicket rate seen in the bouncer or extremely short-length zone is one unexpected signal in the pooled study. There are two possible explanations. First, phase mixing is probably the cause of this unusual occurrence. In the last overs, short-pitched deliveries are used sometimes with leg-side fields set to turn missed hooks or pulls into catches. Second, the new classification combines more defensive short balls with controlled bouncers to create a single category for deliveries longer than ten meters. The zone’s apparent effectiveness may be exaggerated by this aggregation. These observations highlight the importance of phase and bowling-style stratification in any further analysis of short-pitched deliveries.
There is a definite contraction for wickets when comparing the vertical pitch distributions of deliveries that take wickets and those that do not. Wickets are grouped in a smaller, slightly fuller band, whereas non-wicket balls vary widely from about 4 to 10 meters. This observed tightening is consistent with the view that fuller deliveries requiring batters to commit forward, while retaining lateral movement threat, are associated with higher wicket concentration. While very short balls seem to produce wickets mostly in particular tactical situations rather than as a general approach, extremely full deliveries remain effective but harder to execute consistently.
This observation is echoed by the wicket density plots. Wicket locations compress toward a tighter corridor that is slightly fuller and near the off-stump channel in relation to the total delivery distribution. The tighter wicket cluster suggests that deliveries landing in this zone yield more wickets in absolute terms, though not at a higher per-delivery rate. These deliveries raise the possibility of a technical error by threatening both edges of the bat while staying near the stumps.
Furthermore, comparing bowling styles reveals notable differences. With dismissals occurring across a wider variety of lengths and lateral deviations, pace bowlers show broader wicket-taking regions. This spread illustrates how speed, bounce, and seam movement contribute to uncertainty. Fuller deliveries that test the stumps and back-of-a-length balls that produce edges through bounce combine to produce wickets. The range of these areas suggests that, rather than exact accuracy, pace bowling depends on variation and the situational application of various lengths.
In comparison, the wicket clusters of spin bowlers are much closer together and more concentrated. Their hotspots are localized at significantly shorter lengths and nearer the stumps. Dismissals are the result of persistent pressure rather than surprise, and this compactness shows a dependence on accuracy and repeatability. Because they can attack both sides of the bat with turn and variation, leg spinners in particular have a significant tendency to produce bowled and LBW dismissals.
When combined, these patterns show complementary processes for taking wickets. While spin bowlers derive value from precise aim and pressure, pace bowlers take advantage of variations in trajectory and bounce to produce errors throughout a larger spatial envelope. These patterns are broadly consistent with long-standing coaching intuition regarding the “good length just outside off” as a productive targeting zone, while also revealing important nuances. Bowling technique, match phase, and execution moderate which spatial patterns are observed in practice. In certain contexts, particularly the Powerplay, delivering in this zone is associated with modestly higher wicket concentration; this association does not imply that spatial targeting alone causes dismissals, and the observational design of this study cannot support that interpretation.
Acknowledgments
I would like to thank my parents and school for their continued support during this project.
References
- Wickramasinghe I. Applications of machine learning in cricket: a systematic review. Machine Learning with Applications. 2022;10:100435. doi:10.1016/j.mlwa.2022.100435. [↩]
- Hawk-Eye Innovations. Cricket ball-tracking technology overview. Hawk-Eye Innovations website. Accessed 12 January 2026. [↩]
- Mukherjee S. Quantifying individual performance in cricket – a network analysis of batsmen and bowlers. Physica A: Statistical Mechanics and its Applications. 2014;393:624-637. doi:10.1016/j.physa.2013.09.027. [↩]
- Sadekar O, Chowdhary S, Santhanam MS, Battiston F. Individual and team performance in cricket. Royal Society Open Science. 2024;11(7):240809. doi:10.1098/rsos.240809. [↩]
- Petersen C, Pyne D, Portus M, Dawson B. Analysis of Twenty/20 cricket performance during the 2008 Indian Premier League. International Journal of Performance Analysis in Sport. 2008;8(3):63-69. doi:10.1080/24748668.2008.11868448. [↩]
- Najdan MJ, Robins MT, Glazier PS. Determinants of success in English domestic Twenty20 cricket. International Journal of Performance Analysis in Sport. 2014;14(1):276-295. doi:10.1080/24748668.2014.11868721. [↩]
- Irvine S, Kennedy R. Analysis of performance indicators that most significantly affect international Twenty20 cricket. International Journal of Performance Analysis in Sport. 2017;17(3):350-359. doi:10.1080/24748668.2017.1343989. [↩]
- Jamil M, Kerruish S, Beato M, McErlain-Naylor SA. The effects of bowling lines and lengths on the spatial distribution of successful power-hitting strokes in international men’s one-day and T20 cricket. Journal of Sports Sciences. 2022;40(19):2208-2216. doi:10.1080/02640414.2022.2148074. [↩]
- Jamil M, Kerruish S, Mehta S, Phatak A, Memmert D, McRobert A. Identifying which factors impact bowling and batting performances during the death phase of an innings in international men’s 50-over cricket. International Journal of Performance Analysis in Sport. 2023;23(2):111-124. doi:10.1080/24748668.2023.2193030. [↩]
- Jamil M, Kerruish S, Bowmer J, McRobert A, Memmert D. Picking the length: investigating how bowling length influences batter decision-making in international men’s 50-over cricket. International Journal of Performance Analysis in Sport. 2024;24(3):232-247. doi:10.1080/24748668.2023.2288491. [↩]
- Cervone D, D’Amour A, Bornn L, Goldsberry K. A multiresolution stochastic process model for predicting basketball possession outcomes. Journal of the American Statistical Association. 2016;111(514):585-599. doi:10.1080/01621459.2016.1141685. [↩]
- Zuccolotto P, Sandri M, Manisera M. Spatial performance analysis in basketball with CART, random forest and extremely randomized trees. Annals of Operations Research. 2023;325(1):495-519. doi:10.1007/s10479-022-04784-3. [↩]
- Anzer G, Bauer P. A goal scoring probability model for shots based on synchronized positional and event data in football (soccer). Frontiers in Sports and Active Living. 2021;3:624475. doi:10.3389/fspor.2021.624475. [↩]
- Fairchild A, Pelechrinis K, Kokkodis M. Spatial analysis of shots in MLS: a model for expected goals and fractal dimensionality. Journal of Sports Analytics. 2018;4(3):165-174. doi:10.3233/JSA-170207. [↩]
- Sawczuk T, Palczewska A, Jones B. Development of an expected possession value model to analyse team attacking performances in rugby league. PLOS ONE. 2021;16(11):e0259536. doi:10.1371/journal.pone.0259536. [↩]
- International Cricket Council. ICC Men’s T20I Playing Conditions: Fielding Restrictions (Powerplay). International Cricket Council. Accessed 12 January 2026. [↩]
- Duckworth FC, Lewis AJ. A fair method of resetting the target in interrupted one-day cricket matches. Journal of the Operational Research Society. 1998;49(3):220–227. [↩]
- Stern SE. The Duckworth–Lewis–Stern method: extending the Duckworth–Lewis methodology to deal with modern scoring rates. Journal of the Operational Research Society. 2016;67(12):1469–1480. [↩]
- Hernán MA, Robins JM. Causal Inference: What If. Boca Raton (FL): Chapman & Hall/CRC; 2020. [↩]
- Silverman BW. Density Estimation for Statistics and Data Analysis. London: Chapman & Hall; 1986. [↩] [↩]
- Staunton CA, Karstrom A, Kock H, Laaksonen MS, Bjorklund G. Kernel density estimation: a novel tool for visualising training intensity distribution in biathlon. Frontiers in Sports and Active Living. 2025;7:1546909. doi:10.3389/fspor.2025.1546909. [↩]
- McKinney W. Data structures for statistical computing in Python. In: van der Walt S, Millman J, editors. Proceedings of the 9th Python in Science Conference (SciPy 2010). 2010. p. 56–61. [↩]
- Harris CR, Millman KJ, van der Walt SJ, et al. Array programming with NumPy. Nature. 2020;585(7825):357–362. doi:10.1038/s41586-020-2649-2. [↩]
- Waskom ML. seaborn: statistical data visualization. Journal of Open Source Software. 2021;6(60):3021. doi:10.21105/joss.03021. [↩]
- Hunter JD. Matplotlib: A 2D graphics environment. Computing in Science & Engineering. 2007;9(3):90–95. doi:10.1109/MCSE.2007.55. [↩]
- Scott DW. Multivariate Density Estimation: Theory, Practice, and Visualization. 2nd ed. Hoboken (NJ): Wiley; 2015. [↩]