
Reya Satam1, Amy Stark1
1 Phillips Exeter Academy, Massachusetts, USA
Abstract
Multiple sclerosis (MS) is an autoimmune disease that produces a complex range of symptoms including movement trouble, cognitive impairment, and bowel dysfunction. The disease progresses through the central nervous system (CNS), particularly the cerebrospinal fluid (CSF). Previous research suggests that CSF lymphocytes contribute significantly to disease progression, resulting in the misregulation of many genes. This in-silico analysis utilizes public databases to examine the bulk tissue expression and single-nucleotide polymorphisms (SNPs) of 16 misregulated CSF genes. The bulk tissue plots indicate a correlation between gene expression changes in the CSF and damage in the gut-associated lymphoid tissue (GALT). The SNP data further demonstrated this relationship with the tibial nerve—often associated with bowel damage in MS—having the most variants. Analyzing the population genetics of the collected SNPs showed that ethnic groups in Latin America and Africa were most likely to have the highest frequency in the least common alleles. Lastly, the study identified a total of 12 drugs that regulate the dysregulated CSF genes with the vast majority being anti-cancer agents or histone deacetylase (HDAC) inhibitors. In short, this computational study builds hypothesis-generating statements regarding the connection between MS and the peripheral nervous system (PNS) enteric nervous system (ENS), non-European susceptibility to symptoms, and drugs similar to cancer treatment.
Introduction
Multiple sclerosis (MS) is the world’s most frequent disabling neurological disease in young adults. The disease affects over 1.9 million people in the world and is often misdiagnosed because of its variety of complex symptoms1. It occurs in the central nervous system (CNS) where the myelin sheath surrounding nerve fibers breaks down and leaves the fibers exposed2. Common symptoms include, but are not limited to, lack of coordination, numbness, tingling, difficulty walking, loss of vision, and vertigo3.
There is no current treatment for the underlying pathology; all treatments are focused on specific symptoms4.
Due to the disease’s range of presentation, treatments tailored for MS will not be effective for all patients5.
In fact, some symptoms, including tremors, cognition, and balance currently have no treatments; this issue indicates that an emphasis on finding tailored treatments for specific MS symptoms is imperative6.
MS is commonly associated with the degeneration of the spinal cord and some brain tissue; however, another part of the CNS that contributes to MS is the cerebrospinal fluid (CSF), specifically its lymphocytes. A previous study authored by MS researcher Boel Brynedal evaluated lymphocyte gene expression and compared CSF in MS patients and controls7.
She identified over 50 genes that are either upregulated or downregulated from the lymphocytes of MS patients relative to normal patients. Only 16 of these genes are able to be queried in this study as the other 34 are not reported in the public databases.
MS affects CSF by inducing protein activity that contributes to axonal damage and demyelination, key contributors to disease progression. Research on the CSF helps with diagnosing MS by identifying oligoclonal bands (OCB), or signs of major inflammation in the CNS8. Despite this knowledge, there are no known techniques to treat the disease’s effects on the CSF of patients9. Exploring these genes to a greater extent may unveil new information for MS genetic information and treatment.
This research performs a multifaceted investigation on Brynedal’s misregulated CSF genes to provide insight on MS’s potential genetic regulatory architecture, population frequencies, and treatment. It first examines single-nucleotide polymorphisms (SNPs) which provide new insights on associated brain areas, nerves, and worldwide allele frequency patterns. Then, it queries drugs to regulate the genes and potentially reduce disease progression. This study aims to use public data to gain therapeutic insight for MS based on CSF gene expression data.
Methodology
The data for this study was collected from the EMBL-EBI Single Cell Expression Atlas, the Adult GTEx Project, the Ensembl genome browser, and the Drug Gene Budger from the Ma’ayan Lab of Computational Systems Biology at the Icahn School of Medicine at Mount Sinai. The Expression Atlas was used to observe the “Differential Expression” of genes, or the level of change a gene’s expression withstands between two unique experimental conditions10. In the context of this study, the two experimental conditions were the following: a control group of gene expression levels for patients without MS and a measure of gene expression levels for a group of MS patients. Data of the most recently updated version of the atlas was utilized. A biological trait or property was inserted into the “biological conditions” search bar with Homo sapiens as the target species. The Expression Atlas provided a list of the various genes and studies associated with the condition. Each gene entry was given with a magnitude of log2-fold changes that convey the difference in their expression levels. None of the p-values were adjusted in any way.
Querying the Expression Atlas involved selecting one of the studies associated with the searched biological condition, “multiple sclerosis.” The CSF study with the accession number E-MTAB-69 was selected, the log2-fold setting was adjusted to 2.0 for the first 16 genes associated with the research.
The GTEx Portal (release V10) was used to examine genes in the “bulk tissue gene expression” and “significant single-tissue expression quantitative trait locus (eQTL)” sections from RNA-seq data11.
The “bulk tissue gene expression” created violin plots measuring gene expression for cells in many different human tissues. Gene expression levels were measured in TPMs, otherwise known as transcripts per million. Median TPM values and the sample sizes for each tissue were also incorporated in the violin plots. Violin plots were filtered to picture all of the cell types and tissues present with the higher relative TPM values. Tissues that were excluded had TPM values of less than or equal to 0.5, which corresponds to around one transcript per cell and has little effect on DNA. This study utilizes similar justification to the EMBL-EBI Expression Atlas, which filters out TPM values very small and ensures that tissues only with meaningful transcript presence are included in the final analysis. Analysis of expression levels were performed using GTEx median TPM values. Because publicly available summary statistics rather than sample-level or disease-specific expression data were used, analyses were descriptive rather than inferential.
The “significant single-tissue eQTLs” notated the rs numbers of SNPs which greatly alter the gene’s expression. Each rs number was paired with the tissue the SNPs alter; other information was provided consisting of the p-values and normalized effect size (NES) values. NES values represented the magnitude of differential expression compared to the gene’s baseline expression. Another factor incorporated in the single-tissue eQTLs was the “eQTL violin plots” that graphed the possible genotypes in a linear regression model to show the change in expression. NES values represented the slope of the regression and the expression levels on the y-axis had a range of 2 to -2.
The Ensembl genome browser (release 110) was a tool to determine the frequencies of each selected SNP’s alleles for ethnic groups and regions12.
The browser utilized data from the 100 Genomes Project Phase 3 “Population Genetics” tab within the Human Genome section that not only included country and continent populations but also data of ethnoreligious populations.
The Drug Gene Budger was queried to identify small molecules and drugs that can either upregulate or downregulate particular genes13.
The gene was inserted into the “gene symbol” search bar which created two major tables; one table had drug entries that upregulated the gene while the other had ones that downregulated it. The tables also contained relevant information on the dosage measurements, p-values, log2-fold change, and effect duration for each drug. The Drug Gene Budger utilized three projects to collect and organize data; this current study only used drug data from the L1000 (Library of Integrated Network-based Cellular Signatures) project.
The drug regulation data was transferred to separate files, with each file dedicated to one gene containing both upregulated and downregulated drugs. The files allowed for the drug information to smoothly be transferred to Venny 2.1.0, an online bioinformatics tool to create Venn diagrams for up to four lists of drug entries. Each list was entitled the name of the gene and held the regulatory drugs identified for that gene; the lists for every gene were compared with one another. All of the drugs found in the overlap were picked and examined further.
Results
In the Expression Atlas, both the upregulated and downregulated genes were examined in CSF lymphocytes of MS patients in their 30s and 40s. Genes with a minimum absolute fold change of 1.9 were identified with 8 upregulated and 8 downregulated. All of the identified genes had varying p-values under 0.005 as seen in Table 1. Aside from the genes listed in this table, the other genes with a p-value outside of this threshold in the Expression Atlas consist of the following: OLR1, RIN2, DOCK4, CXCL8, MSR1, LYVE1, MZB1, FAM30A, A2M, IGKV4-1, RAPH1, F13A1, CD163, CD14, IER3, DTNB-AS1, CD38, SNCA, C3, FN1, LPCAT2, PAX5, NR4A3, PLXDC2, DAB2, FCGBP, ADRB1, EPB41L3, P2RY12, C1QB, PALD1, OSBPL10, CXCL16, and CFD.
| Gene symbol | Log2-fold change | Raw p-value |
| IGKC | 4.7 | 0.0000000079 |
| IGHM | 3.9 | 0.0000029 |
| TNFRSF17 | 3.3 | 0.0000032 |
| ANKRD36BP2 | 3.2 | 0.0000032 |
| POU2AF1 | 3 | 0.000032 |
| JCHAIN | 2.3 | 0.000032 |
| IGKV1OR2-108 | 2.3 | 0.000042 |
| RRM2 | 2.2 | 0.001 |
| CH25H | -2.4 | 0.00027 |
| SELENOP | -2.4 | 0.0049 |
| CLEC5A | -2.3 | 0.00087 |
| SPP1 | -2.3 | 0.0019 |
| SCIN | -2.2 | 0.0016 |
| C5AR1 | -2.1 | 0.00044 |
| VEGFA | -2.0 | 0.00003 |
| COLEC12 | -2.0 | 0.00032 |
Table 1 | Selected genes’ differential expression data. This portrayed the differential expression provided in the Expression Atlas.
All 16 genes were examined on the GTEx Portal’s “bulk tissue gene expression” model. Querying the upregulated genes showed that the transverse colon, minor salivary gland, and spleen were consistently the highest median TPM values for 7 of the 8 genes. TNFRSF17 had only one significant tissue—the Epstein-Barr virus (EBV) transformed lymphocytes—with high expression while the rest were extremely low. The small intestine and EBV-transformed lymphocytes often had the fourth and fifth highest median TPM; in half of the upregulated genes the lymphocytes had the greatest outliers too. Detailed results for the upregulated genes were summarized in Figures 1 to 7.




The downregulated genes demonstrated similarities to the upregulated ones with the spleen and small intestine having a top three median TPM value in four of the eight genes. The cervical spinal cord and kidney regions also had high expression in the downregulated genes; they had a top three TPM value for 4 genes. The spleen, small intestine, cervical spinal cord, and kidney regions almost always occupied the top five spots; no tissue had a consistent ranking within the top five. When none of these tissues had the highest median TPM value in a gene, the whole blood had the highest. Detailed results for the downregulated genes are summarized in Figures 8 to 15.
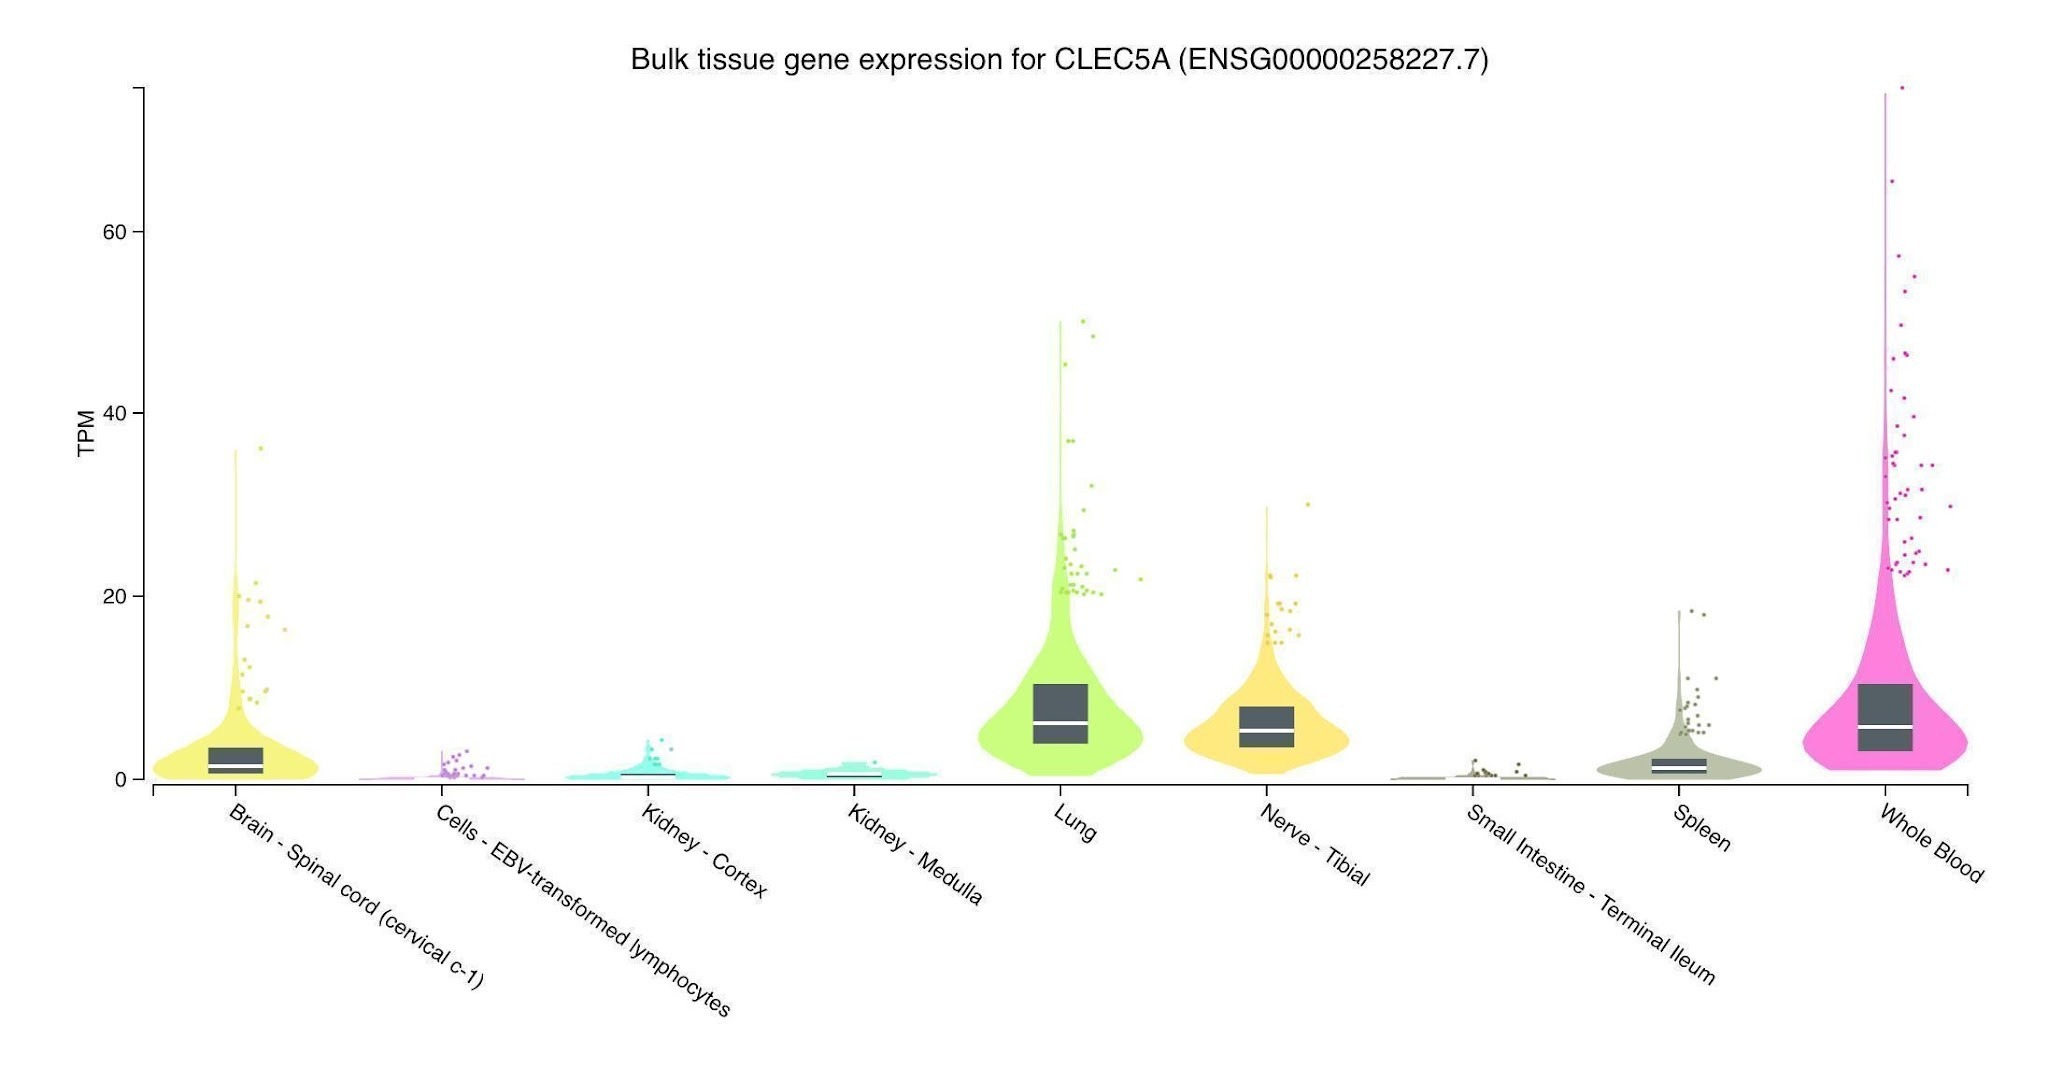
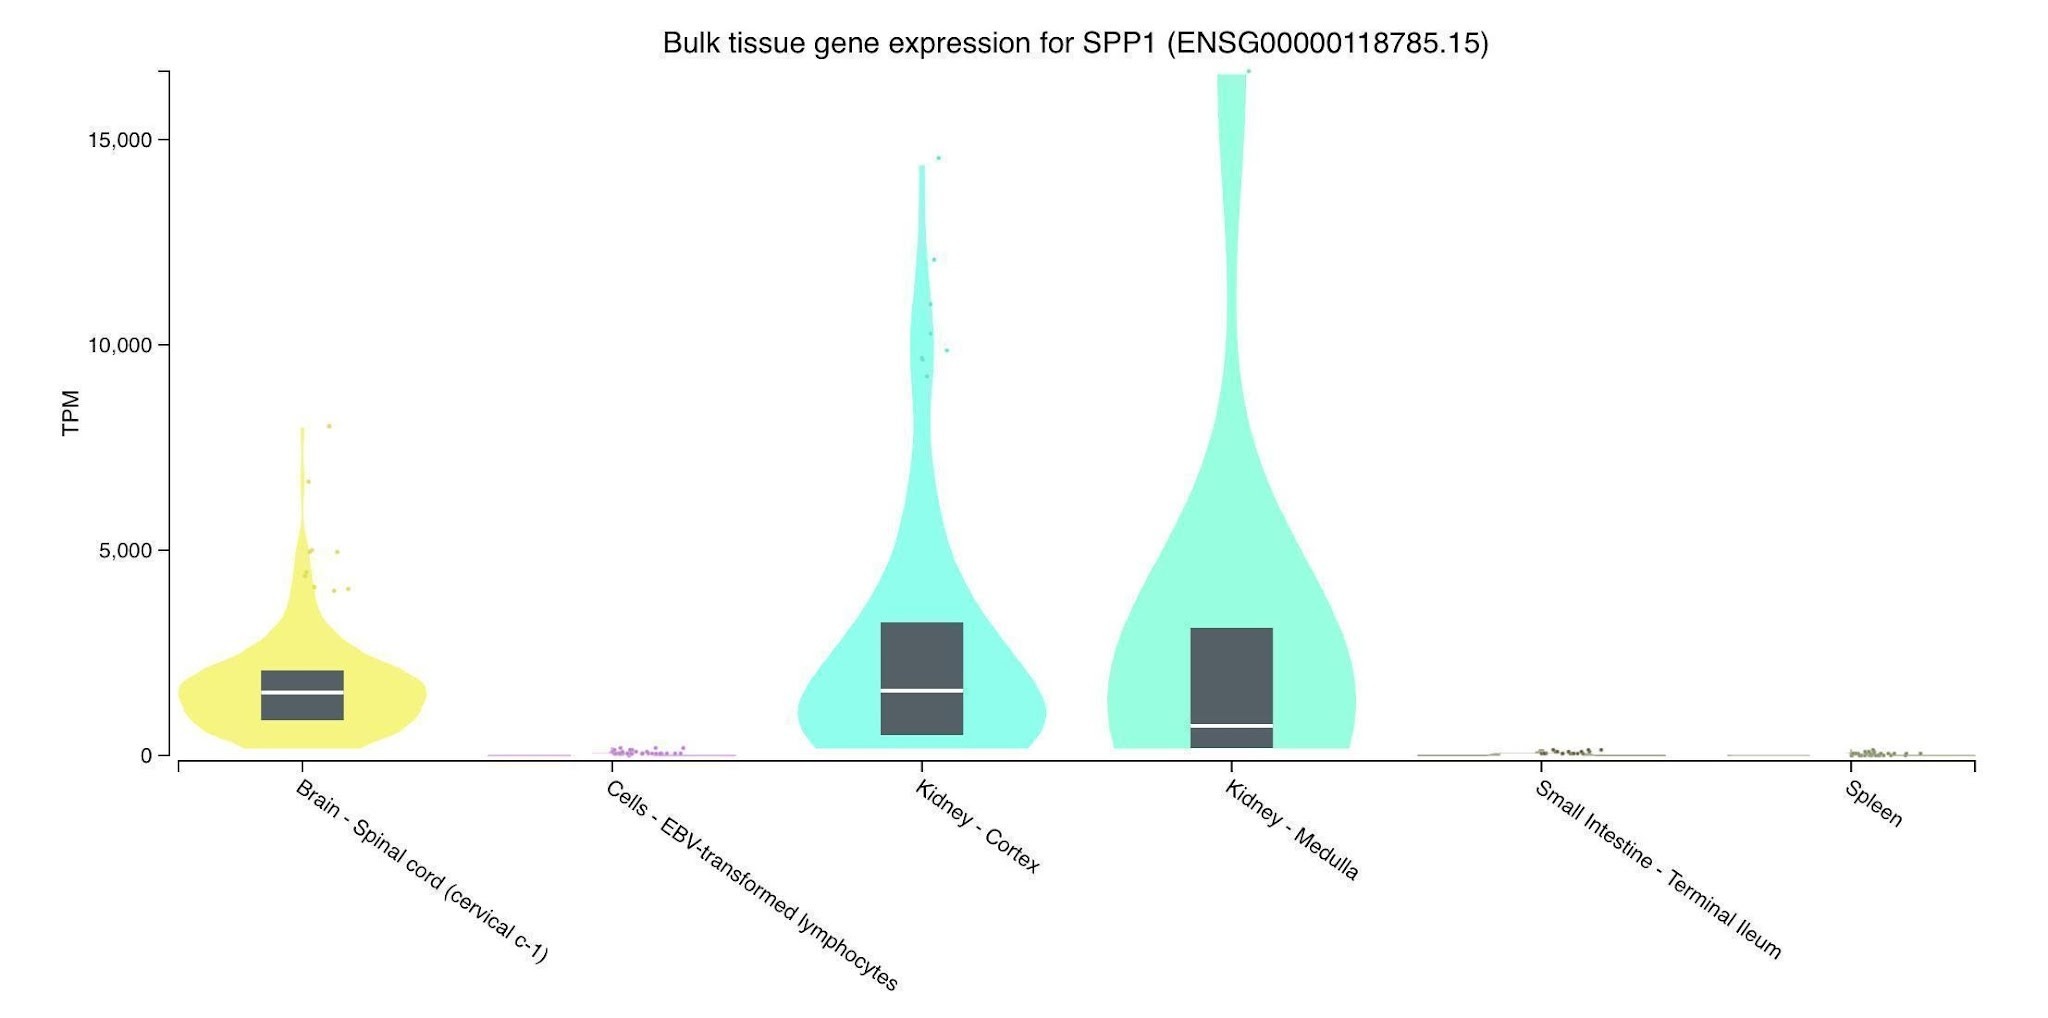
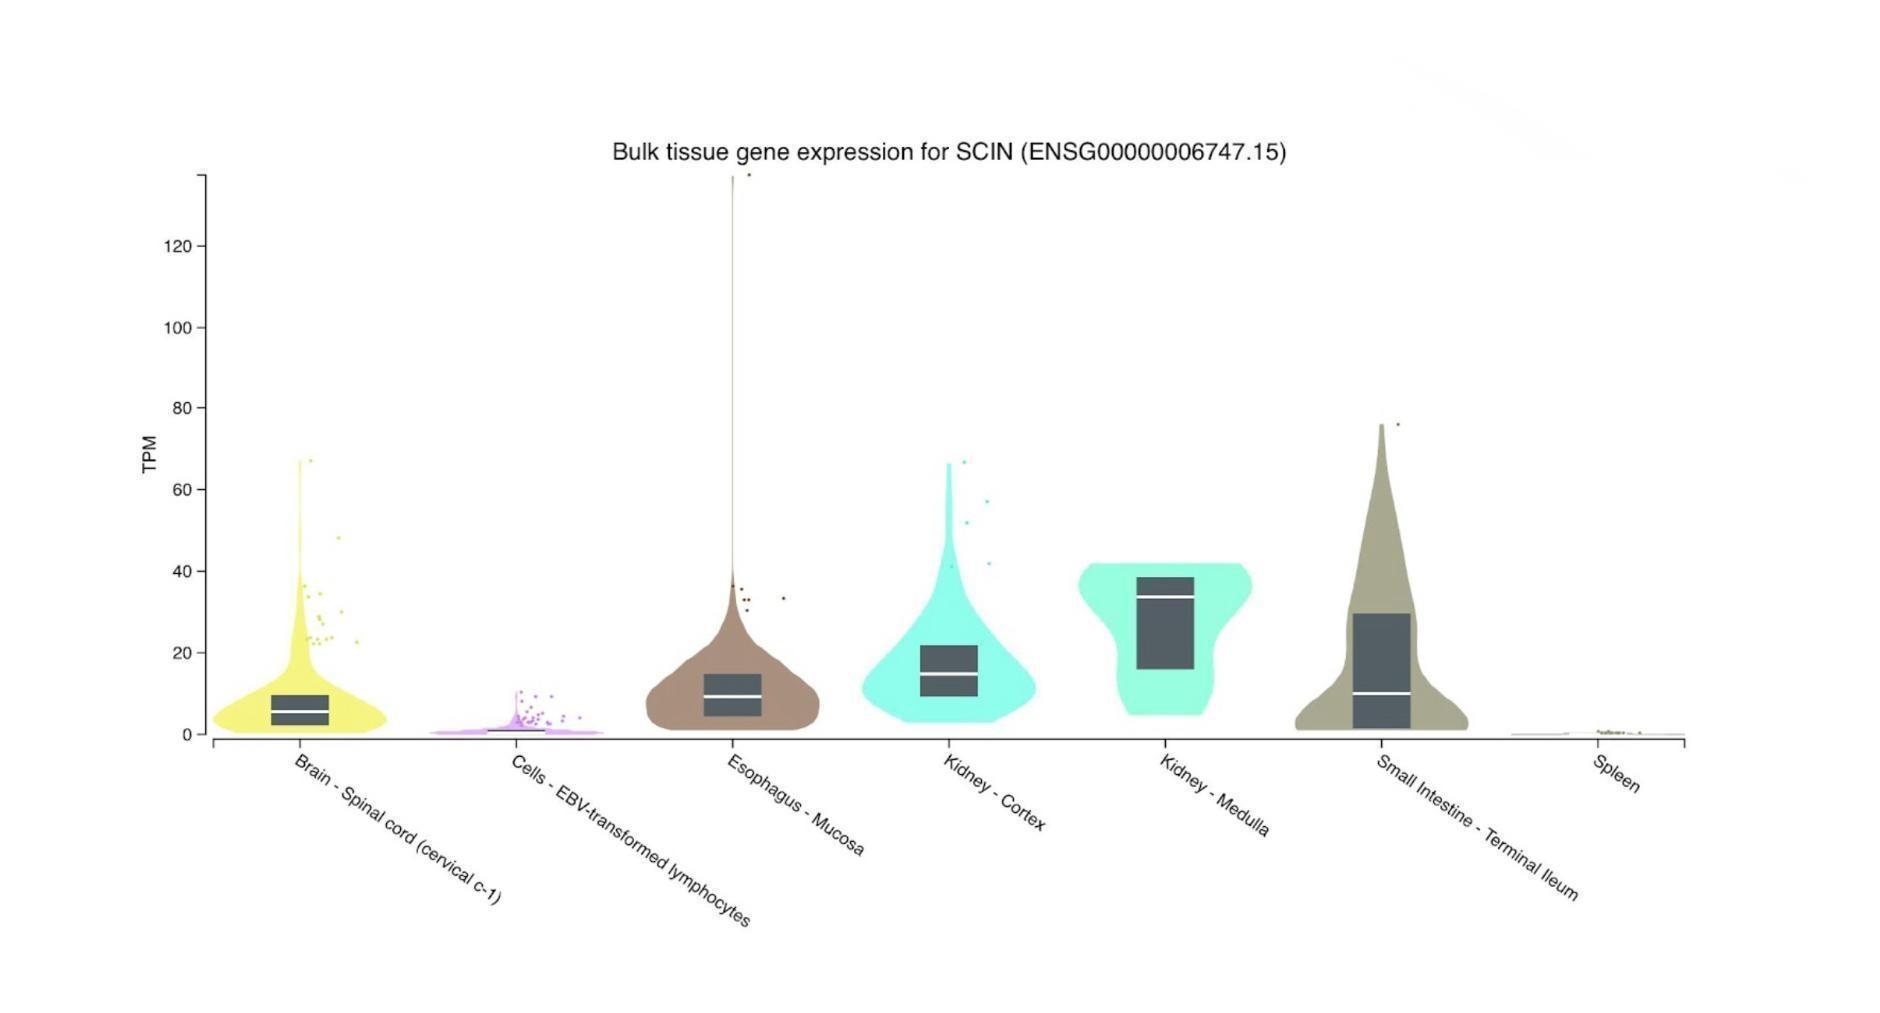
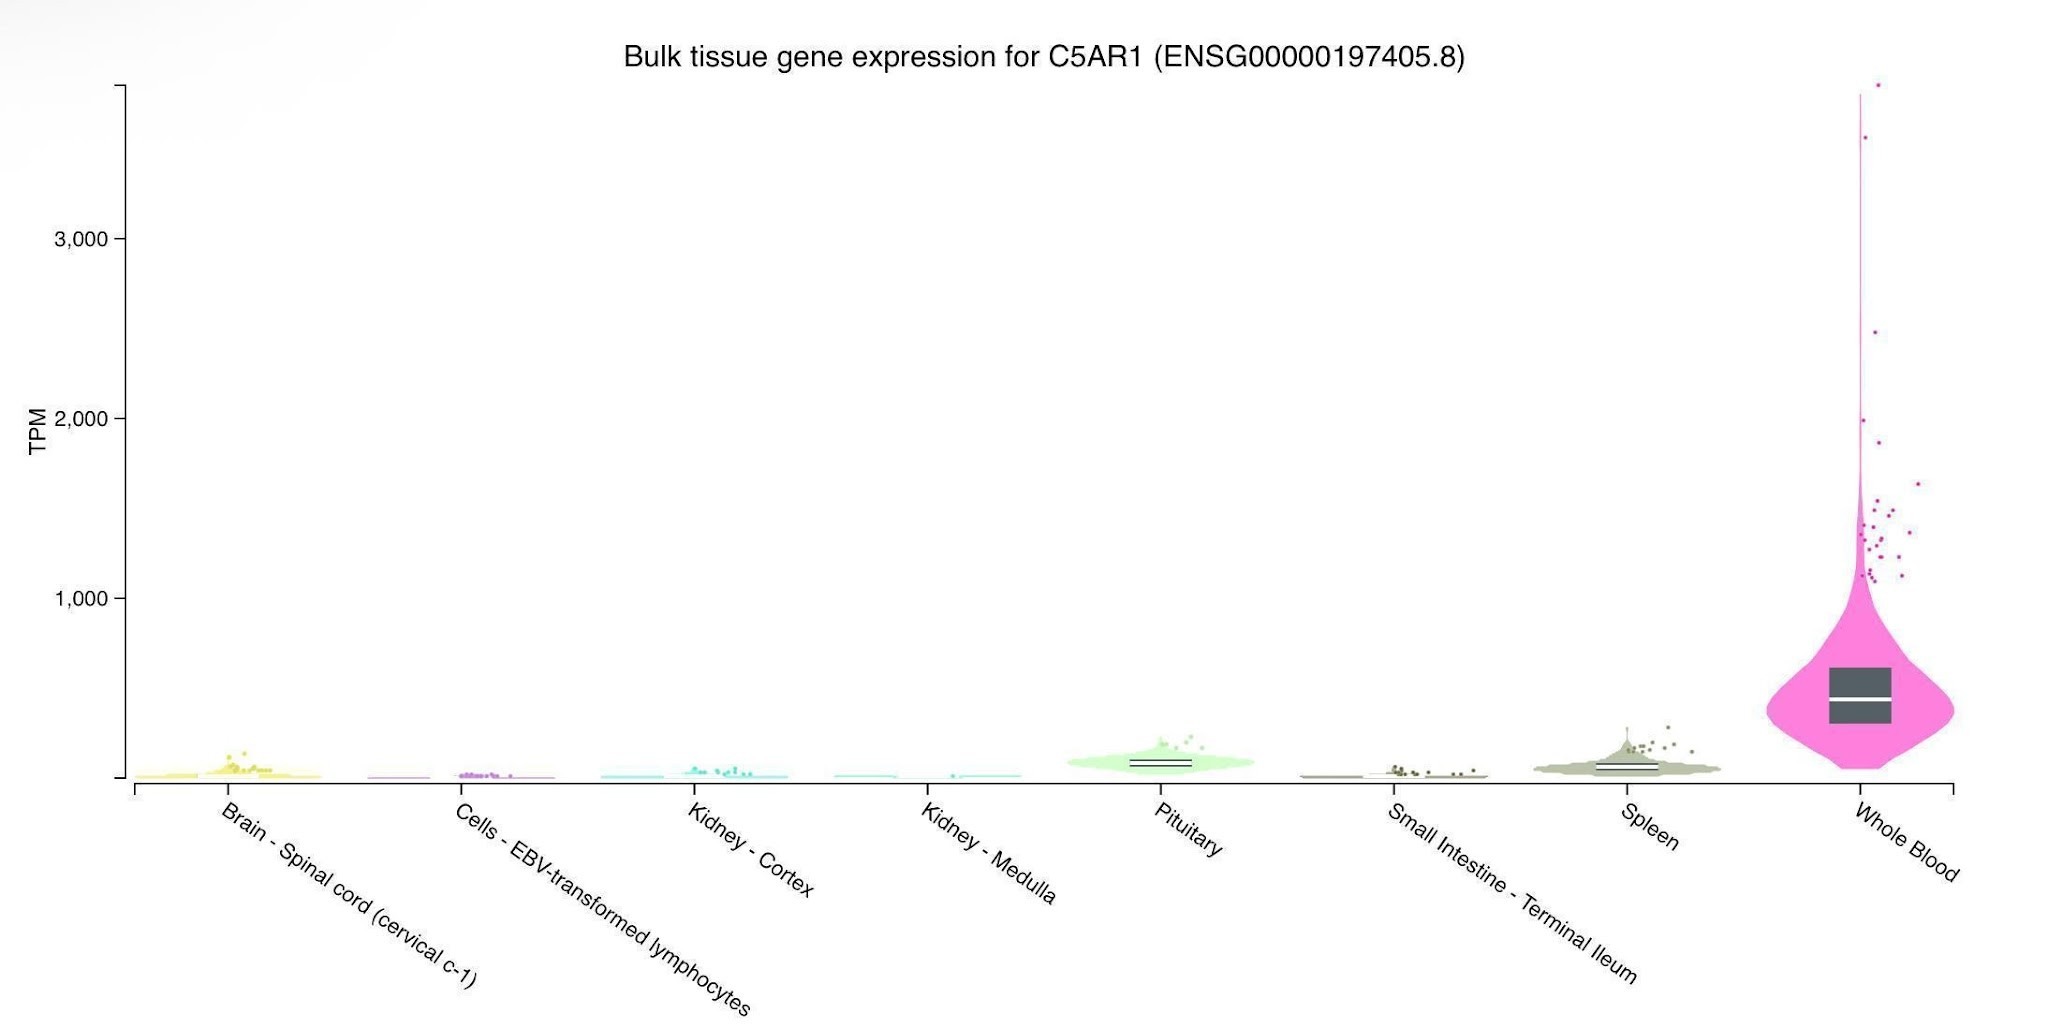
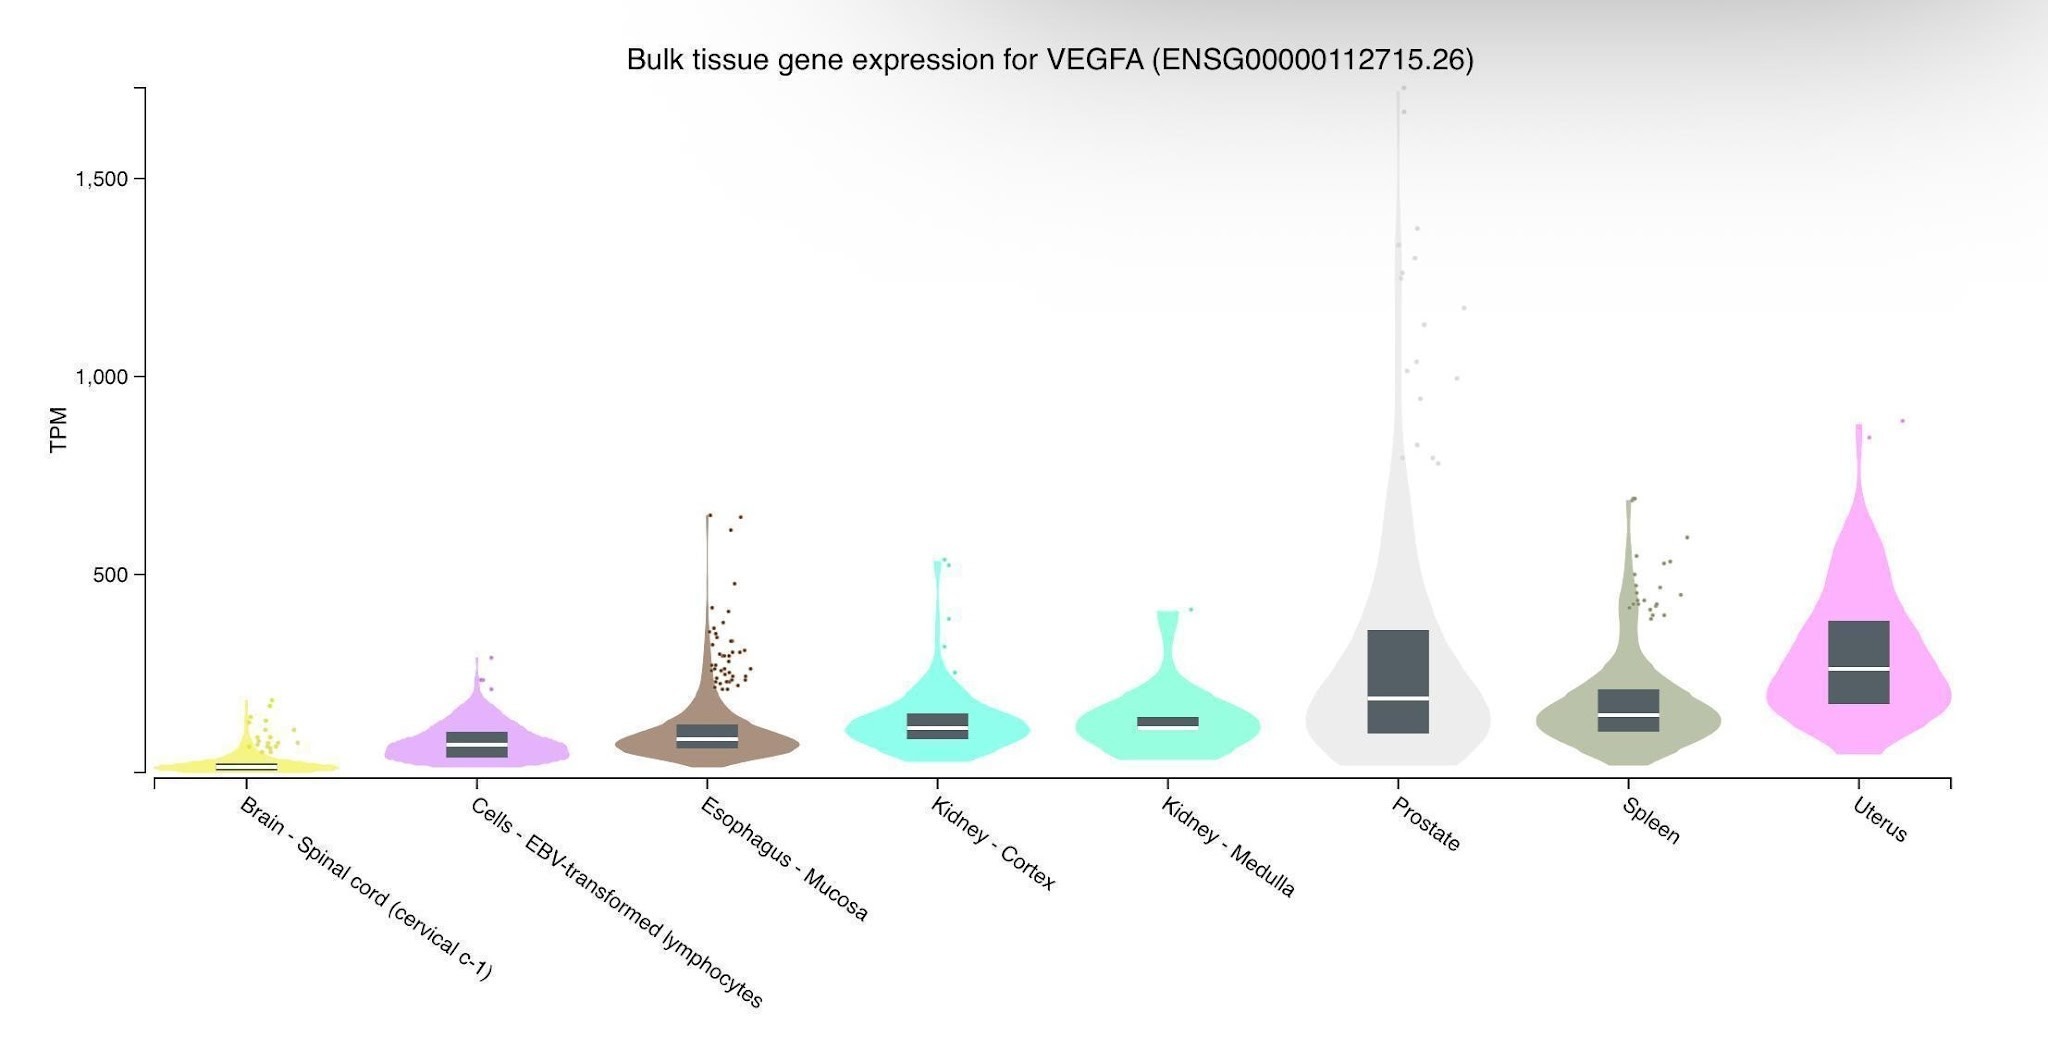
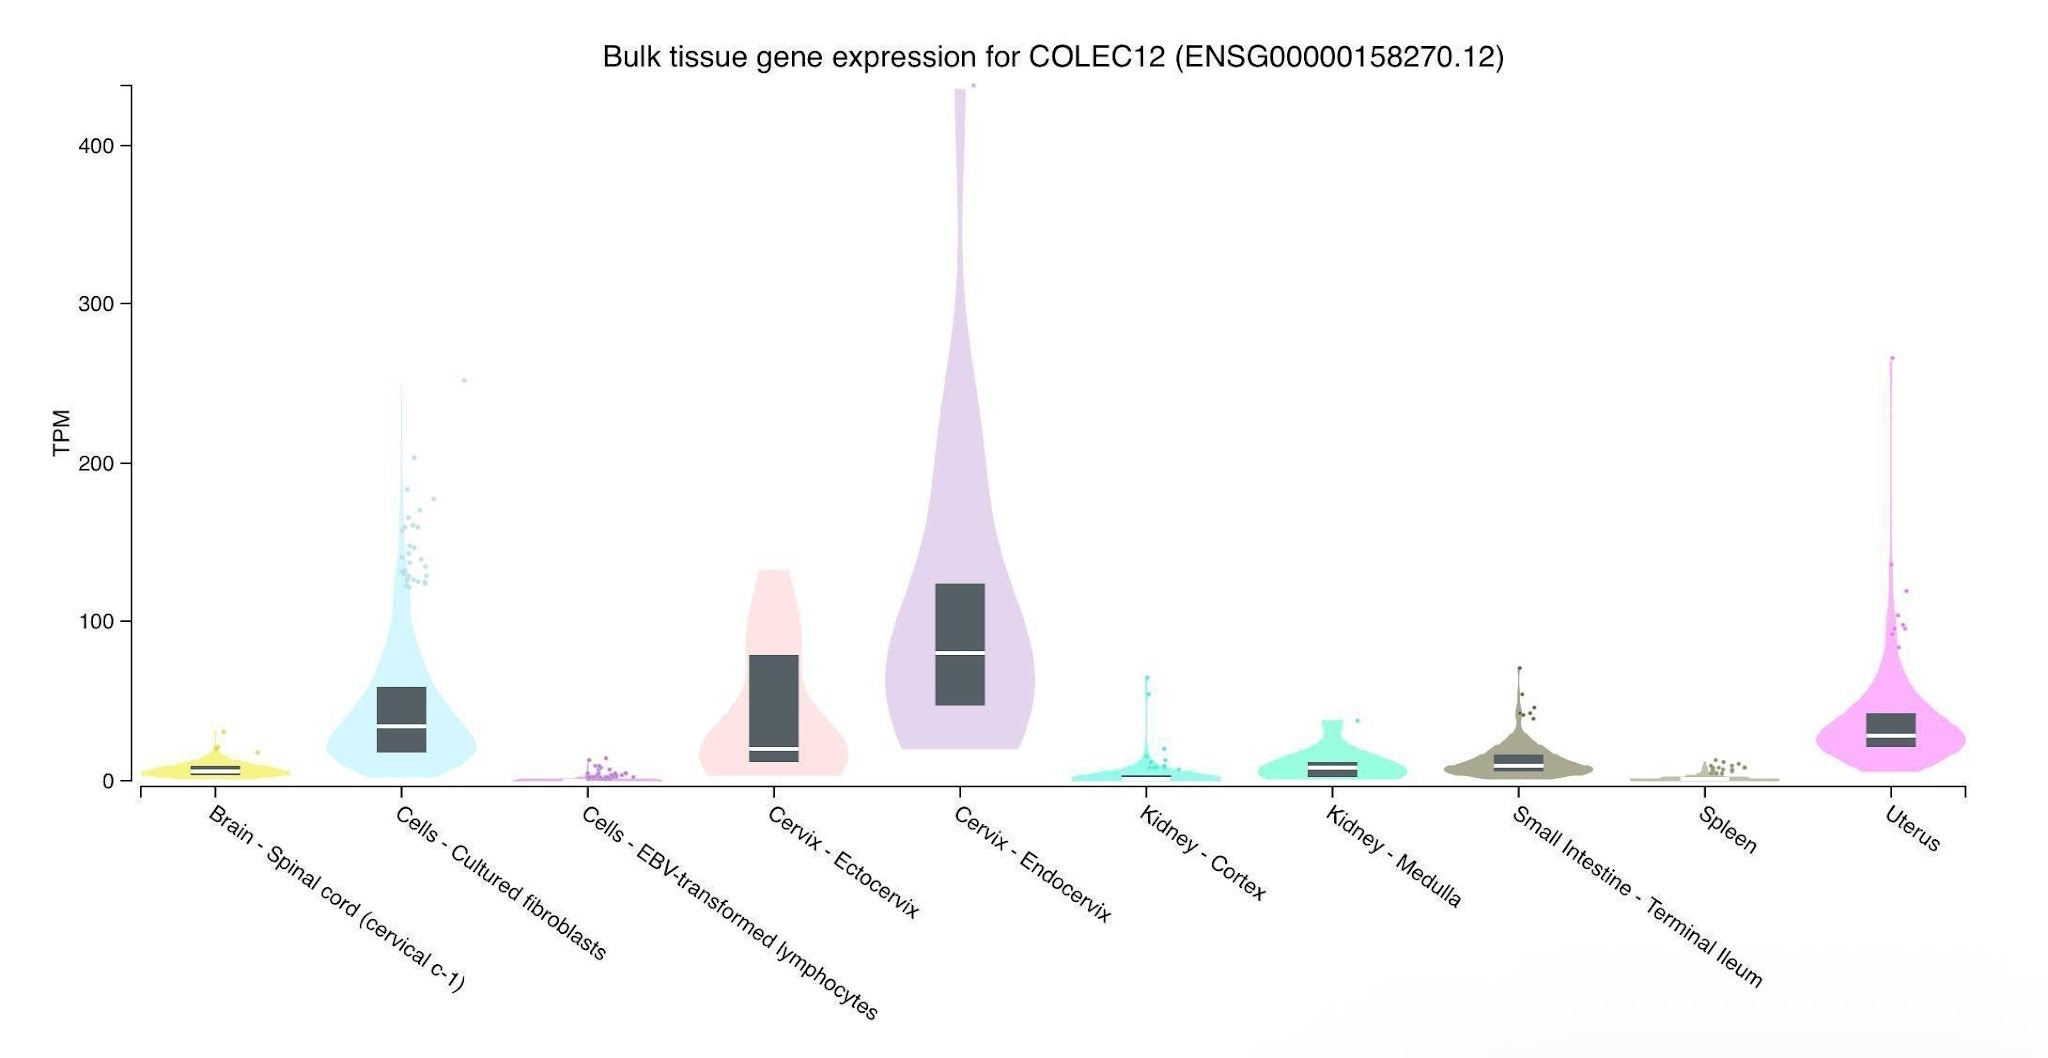
Investigating these 16 genes in the GTEx Portal continued to the “significant single-tissue eQTLs” page, where the polymorphisms for each gene were collected Table 2 portrayed the tissues and showed the total number of SNPs for the downregulated and upregulated genes. For most genes, the SNP values with the highest p-values were collected. The SNPs revealed which tissues had evidence of genetic regulation from the upregulated and downregulated lists, implying they were more critical to disease progression in MS. The genes that had SNPs from these tissues were selected for further analysis due to their low p-values as seen in Table 3.
| Tissue | Downregulated # | Upregulated # |
| Cerebellar hemisphere | 5 | 3 |
| Nucleus accumbens (basal ganglia, BG) | 5 | 2 |
| Skeletal muscle | 0 | 4 |
| Caudate nucleus (BG) | 5 | 5 |
| Tibial nerve | 19 | 8 |
| Spinal cord (cervical) | 0 | 5 |
| EBV-transformed lymphocytes | 0 | 5 |
| Cultured fibroblasts | 0 | 5 |
| Substantia nigra (BG) | 5 | 0 |
| Cerebellum | 3 | 0 |
| Gene symbol | Cerebellar hemisphere | Nucleus accumbens | Caudate nucleus | Tibial nerve |
| IGKC | rs142154462 rs14908699 rs11679495 | rs1037738895 rs146133332 | 0 | 0 |
| TNFRSF17 | 0 | 0 | rs11570139 rs11570135 rs11862958 rs8063976 rs387871 | 0 |
| ANKRD36BP2 | 0 | 0 | 0 | rs17838437 rs900964 rs1484864 rs4972063 rs2365109 rs9309655 |
| POU2AF1 | 0 | 0 | 0 | rs10891257 rs6589221 rs4297502 rs4938496 rs4600249 rs1806574 |
| CH25H | 0 | 0 | 0 | rs72810969 rs72233110 rs72810981 rs72810994 rs17463822 rs11202971 |
| SELENOP | 0 | 0 | rs76251230 rs76780843 rs79553040 rs6875431 rs79974860 | 0 |
| CLEC5A | 0 | rs13226891 rs56127613 rs35116446 rs12537498 rs62486741 | 0 | 0 |
| SPP1 | 0 | 0 | 0 | rs9998898 rs9998975 rs9990702 rs33983260 rs10023907 |
| SCIN | 0 | 0 | 0 | rs10226877 rs7788802 rs11281275 rs7806301 rs7806067 |
| C5AR1 | rs7254371 rs2287689 rs918434 rs1549176 rs1035389 | 0 | 0 | 0 |
| COLEC12 | 0 | 0 | 0 | rs2305027 rs9964715 |
With the SNPs in Table 3, the Ensembl genome browser detailed which ethnic groups had the least common allele at the highest frequency. The alleles of the gene IGKC had the highest frequencies from European or American descent. The subgroups had the highest frequency for the Iberian population in Spain for rs142154462, British in England and Scotland for rs11679495, and Amish for rs1037738895. They all had frequencies of 3%.
Once again, the European and American groups had the highest least common allele frequencies for gene TNFRSF17. Specifically, the British in England or Scotland and Puerto Ricans had the highest rare allele frequencies at around 40% in the caudate nucleus. The British had the highest for rs11570139, rs11862958, and rs8063976 while Puerto Ricans had the highest for the rest of the rs numbers.
The Western Gambian population was the only group whose highest rare allele frequency is ANKRD36BP2. The percentages ranged from 50 to 80%. The American and African groups had the largest percentages out of the continents. For all the SNPs in the POU2AF1 gene, Mexican subgroups in California had the largest rare allele frequencies with 88%. The African and American groups again had the highest frequencies out of the continents.
The CH25H gene had the highest rare allele frequency within the Toscani subgroup in Italy along with the European and American continents. For the SELENOP gene, the Esan group in Nigeria and the African continent had the highest rare allele frequency for all SNPs. The Esan group had a frequency of 12% and the African continent had 10%. African descent in Barbados and the Yoruba in Nigeria also had high rare allele percentages of 11% and 10%, respectively.
For the CLEC5A gene, the Chinese Han in Beijing had the highest rare allele frequency of 68% for rs13226891 and rs12537498. The Chinese Dai had the highest frequency of 65% for rs35116446, while the Esan in Nigeria had the highest frequency of 61% for rs56127613. The Japanese in Tokyo had the highest frequency of 77% for rs62486741.
The Peruvian subgroup in Lima had the highest rare allele frequency of 89% for all of gene SPP1’s SNPs. The SCIN gene also had the Peruvian subgroup as the highest frequency at 68%. The British in England and Scotland had the second highest with 67%. The same applies for C5AR1, where the Peruvian subgroup had the highest frequency of 72%. The Chinese Dai have the second highest frequency at 70%.
The last database that was used to analyze the upregulated and downregulated genes was the Drug Gene Budger which compiled two major drug lists that regulate the genes as needed. Out of the 16 genes, one downregulated and two upregulated genes could not be searched in this database; those genes were SELENOP, IGKV1OR2-108, and JCHAIN. Despite this, the downregulated gene list alone had 65 total drugs that can upregulate it. The upregulated gene list had 39 drugs to do the opposite. The full lists of the drugs can be found in the Appendices. The lists combined provided 12 total drugs that can alter both the upregulated and downregulated genes in the intended direction. These drugs were 7b-cis, isoxazole 9, apicidin, panobinostat, parthenolide, radicicol, torin-1, torin-2, trichostatin-a, tubastatin-a, vorinostat, and wortmannin. Table 4 demonstrated the level each drug has been researched and implemented as a treatment for MS.
| Drug name | Status with MS |
| 7b-cis | Never considered in the past |
| isoxazole 9 | Never considered in the past |
| apicidin | Considered but not explored |
| radicicol | Shows promise but has very little research, no extensive research |
| torin-1 | Shows promise but has very little research, no extensive research |
| torin-2 | Shows promise but has very little research, no extensive research |
| wortmannin | Shows promise but has very little research, no extensive research |
| parthenolide | Has been researched with autoimmune encephalomyelitis (EAE), but very little with MS14. |
| tubastatin-a | Has been researched with EAE, shows promise in animal studies but not at all in MS15. |
| vorinostat | Has been researched with EAE, shows promise in animal studies, but not at all in MS16. |
| panobinostat | Has been researched with EAE, shows promise in animal studies and multiple myeloma (MM), but not at all in MS17. |
| trichostatin-a | Has been researched with EAE, shows promise in animal studies and in cultured cell studies for MS18. |
The drugs, especially ones not associated with MS, were queried to a greater degree to elicit their specific functions in a cell. 7b-cis, otherwise notated as “cis-7-Oxabicyclo[4.3.0]nonan-8-one,” had appeared in many studies as a catalyst for reactions in oxidative enzymes, contributing to intercellular efficiency19.
There is no known information regarding the CNS exposure, immune-cell specificity, blood-brain barrier (BBB) penetration or other metrics in 7b-cis literature; additionally, the same applies for isoxazole 9. Isoxazole 9 showed promise with cell proliferation by assisting neural stem cell differentiation, neurogenesis, and epithelial function20.
Apicidin, a fungal metabolite, contributed to cell cycle arrest and inhibited HDAC21.
HDAC inhibitors block deacetylation to promote transcription. Apicidin exhibits molecular properties that permit high penetration to the BBB, but is highly toxic and results in non-specific mammalian cell death22.
Radicicol, also a fungal metabolite, disrupted tumor cell line proliferation and impaired angiogenesis in cancer. It had neuroprotective agents for inflammation, induced cell cycle arrest, and most importantly inhibited heat shock protein 90 (Hsp90)23.
It likely is penetrable to the BBB, but there is not a significant amount of research that supports this24.
Torin-1 acted as a synthetic mTOR inhibitor that blocked mTOR kinase, essential for cell growth, proliferation, and autophagosome production25.
For efficient transport through the BBB, specialized delivery or structural analogs are required for efficient CNS exposure. Prolonged or high-dosage exposure can result in risks of toxicity26.
Torin-2 was also a similar inhibitor which was used as a treatment for cancer and agent for boosting cytoskeleton health in neurons. It also contributed to cell cycle arrest, apoptosis, autophagy, and angiogenesis inhibition. Torin-2 requires targeted delivery methods to pass the BBB, but has been shown to be cytotoxic in a wide variety of cells27.
Torin-1 and Torin-2 both inhibit PI3K pathways, like the fungal metabolite wortmannin25. Wortmannin also produces autophagy, immune pathways in the nervous system, and destruction of cancer cells28.
Wortmannin can effectively cross the BBB however the CNS effectively clears out the drug before targeting occurs. The therapeutic window is also extremely narrow29.
Drugs that had been researched more in association to MS were also analyzed. For instance, parthenolide, a compound found in the feverfew plant, induced apoptosis in leukemia cells and depleted the HDAC1 protein like many other drugs from the list30.
Parthenolide is extremely penetrable to the BBB, exhibits significant CNS exposure, displays specificity towards activated immune cells, and is only cytotoxic at extremely high concentrations31.
Tubastatin-a, an HDAC6 inhibitor, mainly contributed to cell-cycle arrest and intercellular transport. Another HDAC inhibitor that had been researched for T cell lymphoma treatment was vorinostat, which also assisted with apoptosis and angiogenesis inhibition. Tubastatin-a is very permeable to the BBB, has strong exposure to the CNS, is crucial for immune function, has robust therapeutic efficacy, and is extremely safe32.
Similarly, panobinostat was an HDAC inhibitor that induced programmed cell death in leukemia33. Panobinostat has limited access to passing the BBB and has a narrow therapeutic window34.
The last identified drug, trichostatin-a, shared qualities with all of the other listed drugs, being an Hsp90 and HDAC inhibitor that is important for the PI3K pathway28.
Trichostatin-a is penetrable to the BBB, works on a variety of immune cells, but creates extreme toxicity at any dosage35.
Discussion
This study found that the genes in the CSF of MS patients showed increased risk for unexpected tissues within the PNS and novel non-European demographics. Analyzing the SNPs for every gene indicated which tissues were the most significant to disease progression and which ethnic groups most commonly had the highest frequencies of the least common alleles. These findings can shine light on the underlying effects of gene regulation and misconceptions from MS by producing hypothesis-generating statements. The study also found a correlation between the drugs that regulate these genes, particularly in terms of their functions, effects on the cell cycle, and previous treatment usage. This pattern can be used as a hallmark for developing and finding MS treatments in future research.
The first 15 Figures were selected from the GTEx Portal to show which tissues had the greatest expression for each gene. A common pattern emerged in Figures 1 to 15, showing that the vast majority of the genes had the highest TPM values for the transverse colon, minor salivary gland, spleen, and small intestine. All of these tissues were linked to the enteric nervous system (ENS), where networks of neurons control the digestive tract, surrounding blood flow, and other gastrointestinal functions36.
These shared patterns in expression levels may suggest a possible connection of gut pathology to gene coding, producing a potential hypothesis suggested from the expression patterns that can be explored further in the future. These genes demonstrate baseline enrichment in lymphoid-rich tissues, suggesting there are common regulatory mechanisms between immune function and multiple sclerosis (MS) genetic susceptibility.
The SNPs for each gene were queried to highlight patterns amongst their associated tissues. There were four tissues containing SNPs from both the upregulated and downregulated genes: the tibial nerve, the caudate nucleus, the nucleus accumbens, and the cerebellar hemisphere. Genetic variants linked to MS susceptibility show regulatory effects in the tibial nerve; however, baseline eQTL data cannot determine MS-specific pathology in this tissue. While research on the tibial nerve affected by MS is limited, recent MS studies have shown that damage can result in bowel dysfunction, a primary condition seen in gastrointestinal problems37.
This finding could demonstrate a potential hypothesis regarding the impact these genes have on progressing MS in the digestive tract. Research also showed that the tibial nerve contributed to common symptoms of weakness and numbness in the foot and ankle. Table 3 highlighted 11 of the 12 genes that contained SNPs from the tissues, with ANKRD36BP2, POU2AF1, CH25H, SPP1, and SCIN entirely containing SNPs from the tibial nerve. This interesting yet not fully deciphered pattern can be used to formulate more hypothesis-generating statements on the tibial’s nerve potential to progressing disease.
The SNPs associated with the genes were queried in the Ensembl genome browser. Numerous studies from 2020 showed that on average, patients of European descent in Europe and America were most likely to receive MS diagnosis38. Contrary to the belief that the vast majority of MS patients were European, the collected data suggested other subgroups from Latin America and Africa had a similar amount of risk.
Studies acknowledged that not enough MS data from Latin America and Africa had been generated to fully evaluate the risk and disease frequency39. In America, smaller studies had shown that Black men living in California had the same MS disease rates as European women40. Previous research on the identified non-European ethnic groups showed that rates of MS range from very low to medium41. Most of the regions, particularly Peru, West Gambia, Nigeria, and Puerto Rico, had underdeveloped methods to track disease rates despite the disease rates for all countries increasing annually42. The wide variety of symptoms that can emerge from the disease also contributed to confusion about MS populations43. Despite these findings, this study identified 7 of the 10 genes that had non-European ethnic groups with the highest frequencies for the least common alleles. Although this result does not directly connect to MS risk, it is a means of cataloguing genetic variations across populations and is a descriptive finding.
A potential limitation to these descriptive findings is the risk of linkage disequilibrium that could modulate observational, population-level data. The observed allele frequencies could represent historic demographic changes or genetic drift within the populations in comparison to MS-driven selection.
The Drug Gene Budger was utilized to identify drugs that can regulate all of the applicable genes on the database. Querying these drugs showed several patterns amongst the majority. All of the drugs contributed to cellular and enzymatic pathways essential for cell growth and proliferation. Research on their contribution to cell health had a focus on the brain and some immune cells. Ten of the 12 drugs contributed to cell cycle arrest, apoptosis, autophagy, and angiogenesis inhibition. Ten drugs were also classified as anti-cancer agents that utilize PCD to treat lymphomas, leukemias, breast cancers, and gastric cancers. Half of the drugs were classified as HDAC inhibitors that slow down particular HDAC enzymes and proteins. Other less common patterns amongst the drugs were that they contribute to the PI3K pathway and Hsp90 inhibition. Because many of the drugs had very narrow therapeutic windows or were extremely toxic to mammalian cells, the list of exploratory candidates for future MS studies was cut down to radicicol, pathernolide, and tubastatin-a. Tubastatin-a, in particular, had a particularly wide therapeutic window relatively.
This study provided a greater depth of investigation on the misregulated genes in the CSF impacted by MS. Previous research on MS utilized the CSF as a biomarker for diagnosis. Very little information revealed how exactly the fluid contributed to disease progression. Findings from this current study create pathways to uncovering the connection of the CSF with other parts of the body like the gastrointestinal system and the tibial nerve. These results suggest a greater association about the extent to which misregulated CSF genes advance bowel and digestive issues, along with movement and cognitive impairments. Common MS treatments only prevented symptoms from getting worse instead of alleviating persistent symptoms like movement, digestion, and cognition. Identifying the drugs that regulate these genes list new treatments that can potentially reduce everyday symptoms. Lastly, this study also provided new insight on which demographics are possibly more susceptible to the symptoms associated with the CSF.
This study collected data from the GTEx Portal, Expression Atlas, Ensembl genome browser, and the Drug Gene Budger. Analyzing the data through multiple sources provided extensive evidence and therefore boosted the validity of the results. This method showed promise in analyzing how gene expression affects disease progression, allele frequencies, and treatments. The results from this study created many pathways to develop future MS research by formulating a variety of hypothesis-generating statements. Specifically, a research topic that requires more exploration is the gastrointestinal system in MS, including which identified genes in the CSF affect it the most; the same principle applies for the tibial nerve. Another aspect of this study that requires further investigation is the population genetics section. Researching common environmental conditions from the identified ethnic groups may provide useful information on what factors specifically induce MS in the CSF. The 12 identified drug treatments could be tested in vitro to provide more insight on their level of safety and alleviate MS symptoms. Analyzing patient cells through pharmacogenetic testing can help determine how much the treatments are effective on tissues identified in this study. To further expand on this research, it is imperative that the research subjects are queried in a wet-lab environment to evaluate the accuracy of the explored tissues and efficiency of the treatments.
References
- Khan, G., and Hashim, J, 2025, Epidemiology of Multiple Sclerosis: Global, Regional, National and Sub-National-Level Estimates and Future Projections, PubMed Central. https://pubmed.ncbi.nlm.nih.gov/39928193/. [↩]
- Tafti, D., Ehsan, M., and Xixis, K, 2024, Multiple sclerosis, PubMed Central. https://www.ncbi.nlm.nih.gov/books/NBK499849/. [↩]
- Khan, G., and Hashim, J, 2025, Epidemiology of Multiple Sclerosis: Global, Regional, National and Sub-National-Level Estimates and Future Projections. PubMed Central. https://pubmed.ncbi.nlm.nih.gov/39928193/. [↩]
- Millard, E, 2025, Biggest challenges and successes: M.D.s weigh in on treating MS today. HealthCentral. https://www.healthcentral.com/condition/multiple-sclerosis/biggest-challenges-and-successes-treating-ms-today. [↩]
- Hauser, S., Cree, B, 2021, Treatment of Multiple Sclerosis: A Review. PubMed Central. https://pmc.ncbi.nlm.nih.gov/articles/PMC7704606/. [↩]
- Leavitt, V., and Rocca, M, 2020, Siponimod for cognition in secondary progressive multiple sclerosis. Neurology Journals. https://www.neurology.org/doi/abs/10.1212/WNL.0000000000011279. [↩]
- Brynedal, B., Khademi, M., Wallström, E., Hillert, J., Olsson, T., and Duvefelt, K, 2010, Gene expression profiling in multiple sclerosis: a disease of the central nervous system, but with relapses triggered in the periphery. PubMed Central. https://pubmed.ncbi.nlm.nih.gov/19944761/. [↩]
- Magliozzi, R., and Cross A, 2020, Can CSF biomarkers predict future MS disease activity and severity. PubMed Central. https://pubmed.ncbi.nlm.nih.gov/31965889/#:~:text=Here%20we%20review%20cerebrospinal%20fluid,cerebrospinal%20fluid;%20neurofilaments;%20prognosis. [↩]
- Deisenhammer, F., Zetterberg, H., Fitzner, B., and Zettl, U, 2019, The cerebrospinal fluid in multiple sclerosis. Frontiers. https://www.frontiersin.org/journals/immunology/articles/10.3389/fimmu.2019.00726/full. [↩]
- Gene Expression Team, 2020,Gene expression across species and biological conditions. EMBL-European Bioinformatics Institute. https://www.ebi.ac.uk/gxa/home. [↩]
- GTEx Consortium, 2020, The Genotype-Tissue Expression Project. GTEx Portal. https://www.gtexportal.org/home/. [↩]
- Ensembl, 2025, 1000 Genomes Project. Ensembl genome browser. https://useast.ensembl.org/Homo_sapiens/Info/Index. [↩]
- Wang, Z., He, E., Sani, K., Jagodonik K. M., Silverstein M., Ma’ayan A, 2025, Drug Gene Budger: an application for ranking drugs to modulate a specific gene based on transcriptomic signatures. Ma’ayan Laboratory. https://maayanlab.cloud/DGB/. [↩]
- Zhang, Z., Zhang, K., Zhang, M., Zhang, X., Zhang, R, 2022, Parthenolide suppresses T helper 17 and alleviates experimental autoimmune encephalomyelitis. PubMed Central. https://pmc.ncbi.nlm.nih.gov/articles/PMC9066638/. [↩]
- LoPresti, P, 2019, The selective HDAC6 inhibitor ACY-738 impacts memory and disease regulation in an animal model of multiple sclerosis. Frontiers. https://www.frontiersin.org/journals/neurology/articles/10.3389/fneur.2019.00519/full. [↩]
- Quinn, D., et al, 2021, Phase II study of the histone deacetylase inhibitor vorinostat (suberoylanilide hydroxamic acid; SAHA) in recurrent or metastatic transitional cell carcinoma of the urothelium – an NCI-CTEP sponsored: California Cancer Consortium, NCI. PubMed Central. https://pmc.ncbi.nlm.nih.gov/articles/PMC11981684/. [↩]
- Rajkumar, Vincent., and Dispenzieri, A, 2020, Multiple myeloma and related disorders. Abeloff’s Clinical Oncology. https://www.sciencedirect.com/science/article/abs/pii/B9780323476744001018. [↩]
- Jayaraman, A., Avgush, K., Kulam, R., Soni, A., Khan, A., Kerdjoudj, M., and Jayaraman, S, 2020, Treatment of autoimmune encephalomyelitis with a stone deacetylase inhibitor. PubMed Central. https://pmc.ncbi.nlm.nih.gov/articles/PMC10240938/. [↩]
- National Center for Biotechnology Information, 2025, Cis-7-Oxabicyclo[4.3.0]nonan-8-one. PubChem. https://pubchem.ncbi.nlm.nih.gov/compound/cis-7-Oxabicyclo_4.3.0_nonan-8-one. [↩]
- Sayed, S., et al, 2023, Isoxazole 9 (ISX9), a small molecular targeting axin, activates wnt signaling and promotes hair regrowth. British Pharmacological Society. https://bpspubs.onlinelibrary.wiley.com/doi/full/10.1111/bph.16046. [↩]
- Chauhan, M., et al, 2021, An insight in anti-malarial potential of indole scaffold: a review. European Journal of Medicinal Chemistry. https://www.sciencedirect.com/science/article/abs/pii/S022352342100249X. [↩]
- Pedder, J., et al, 2026, Crossing the blood-brain barrier: emerging therapeutic strategies for neurological disease. PubMed Central. https://pmc.ncbi.nlm.nih.gov/articles/PMC12242972/. [↩]
- Costa, T., Raghavendra, N., and Penido, C, 2020, Natural heat shock protein 90 inhibitors in cancer and inflammation. European Journal of Medicinal Chemistry. https://www.sciencedirect.com/science/article/abs/pii/S0223523420300301. [↩]
- Kato, R., et al, 2025, Investigating blood-brain barrier penetration and neurotoxicity of natural products for central nervous system drug development. PubMed Central. https://pmc.ncbi.nlm.nih.gov/articles/PMC11876671/. [↩]
- National Center for Biotechnology Information, 2025, 1-(4-(4-propionylpiperazin-1-yl)-3-(trifluoromethyl)phenyl)-9-(quinolin-3-yl)benzo(h)(1,6)naphthyridin-2(1H)-one. PubChem. https://pubchem.ncbi.nlm.nih.gov/compound/Torin-1. [↩] [↩]
- Shokr, M, 2025, Beyond the blood-brain barrier: unraveling T cell subsets in CNS immunity and disease. PubMed Central. https://pmc.ncbi.nlm.nih.gov/articles/PMC12552303/. [↩]
- Vershinina, Y., et al, 2023, Transcriptomic analysis of the effect of torin-2 on the central nervous system of Drosophila melanogaster. PubMed Central. https://pmc.ncbi.nlm.nih.gov/articles/PMC10219255/#:~:text=Among%20the%20cellular%20pathways%20mostly,field%20of%20NMDA%2Dmediated%20neurodegeneration. [↩]
- Fruman, D., Chiu, H., Hopkins, B., Bagrodia, S., Cantley, L., and Abraham, R, 2017, The PI3K pathways in human disease. Science Direct Cell Journal. https://www.sciencedirect.com/science/article/pii/S0092867417308656#:~:text=The%20knowledge%20accumulated%20during%20the,tissue%20overgrowth%2C%20and%20cardiovascular%20disease. [↩] [↩]
- Ihara, M., Shichijo, K., Takeshita, S., and Kudo, T, 2020, Wortmannin, a specific inhibitor of phosphatidylinositol-3-kinase, induces accumulation of DNA double-strand breaks. PubMed Central. https://pmc.ncbi.nlm.nih.gov/articles/PMC7246056/. [↩]
- Carlisi, D., et al, 2022, Parthenolide and its soluble analogues: multitasking compounds with antitumor properties. PubMed Central. https://pmc.ncbi.nlm.nih.gov/articles/PMC8962426/. [↩]
- Gaojian, T., et al, 2020, Parthenolide promotes the repair of spinal cord injury by modulating M1/M2 polarization via the NF-kB and STAT ⅓ signaling pathway. PubMed Central. https://pmc.ncbi.nlm.nih.gov/articles/PMC7538575/. [↩]
- Shen S., et al, 2020, Structural and in vivo characterization of tubastatin A, a widely used histone deacetylase 6 inhibitor. PubMed Central. https://pmc.ncbi.nlm.nih.gov/articles/PMC7236036/. [↩]
- Zhang W., et al, 2015, Pharmacokinetics of Panobinostat: Interspecies Difference in Metabolic Stability. PubMed Central. https://pubmed.ncbi.nlm.nih.gov/26051506/. [↩]
- Homan, M., et al, 2022, Panobinostat penetrates the blood-brain barrier and achieves effective brain concentrations in a murine model. PubMed Central. https://pmc.ncbi.nlm.nih.gov/articles/PMC8896403/. [↩]
- Ou, C., Chen, B., and Deng, J., and Long, H, 2026, Deciphering the molecular network of Trichostatin A in regulating Alzheimer’s disease screening of core genes and mechanistic investigation based on multidimensional bioinformatics and molecular simulation. https://pmc.ncbi.nlm.nih.gov/articles/PMC13094961/. [↩]
- Fine, R, 2019, Receptors and the development of the enteric nervous system. Academic Press. https://www.sciencedirect.com/science/article/abs/pii/B9780128110126000145. [↩]
- Gulick, E, 2022, Neurogenic Bowel Dysfunction Over the Course of Multiple Sclerosis: A Review. PubMed Central. https://pmc.ncbi.nlm.nih.gov/articles/PMC9461721/. [↩]
- Graf, J. 2024, Updated Multiple Sclerosis Incidence, 2015-2022, PubMed Central. https://pmc.ncbi.nlm.nih.gov/articles/PMC11385316/. [↩]
- Bonomi, S., Jin, S., Culpepper, W., and Wallin, M, 2021, MS and Disability Progression in Latin America, Africa, Asia, and the Middle East: A Systematic Review. PubMed Central, https://pubmed.ncbi.nlm.nih.gov/33773273/. [↩]
- Brayo, P., and Kimbrough, D, 2021, Multiple sclerosis in the black population of the United States, Practical Neurology. https://practicalneurology.com/diseases-diagnoses/ms-immune-disorders/multiple-sclerosis-in-the-black-population-of-the-united-states/31756/#:~:text=Over%20the%20last%202%20decades,2%20years%20in%20White%20individuals. [↩]
- Walton, C., et al, 2020, Rising prevalence of multiple sclerosis worldwide: Insights from the Atlas of MS, third edition, PubMed Central, https://pmc.ncbi.nlm.nih.gov/articles/PMC7720355/. [↩]
- Szcsepaniak, M., Dowden, K., Jackson, M., Verne, J., Foster, S., and Sandhu, S, 2020, Multiple sclerosis: prevalence, incidence and smoking status – data briefing, Public Health England. https://www.gov.uk/government/publications/multiple-sclerosis-prevalence-incidence-and-smoking-status/multiple-sclerosis-prevalence-incidence-and-smoking-status-data-briefing. [↩]
- Gaitán, M., and Correale, J, 2019, Multiple Sclerosis Misdiagnosis: A Persistent Problem to Solve, PubMed Central. https://pmc.ncbi.nlm.nih.gov/articles/PMC6514150/. [↩]