
Abstract
This study provides an exploratory examination of the relationship between adolescents’ subscription awareness and the perceived value of subscription-based consumption. Using cross-sectional survey data from 341 middle and high school students in the Seoul metropolitan area, statistical analyses including correlations and regression were conducted. The results show a positive association between subscription awareness and perceived value, suggesting that conscious monitoring of subscription spending is closely associated with adolescents’ value-for-money evaluation of subscription-based consumption.
Keywords: Subscription economy, Adolescents, Subscription Awareness, Perceived Value, Consumer Behavior, Digital Consumption
Introduction
Subscription-based services, such as Netflix, Spotify, and ChatGPT, have become a major part of everyday digital consumption. These services include entertainment, productivity, mobile gaming and even education platforms. Recent research suggests that digital content consumption is increasingly organized around access-based and subscription-supported models rather than one-time ownership-based purchases, particularly in streaming media, digital news, music, and audiobook services1,2,3. Among consumers, adolescents are especially exposed to various subscription services. In Korea, about 97.8 percent of all teenagers and people in their 20s are using subscription-based services, the highest out of all age groups. Consumption experience during adolescence shapes consumption behavior and corresponding values in their lifetime4,5. Research on consumer socialization suggests that adolescents develop consumer behavior and perceive the value of consumption by interacting with the marketplace and through personal experiences including buying and using goods6,7. The perceived value of consumption refers to a subjective evaluation resulting from a rational trade-off between perceived benefits and perceived sacrifices in consumption decisions. Understanding how adolescents develop this perception is important because it may influence their long-term financial decision-making. By recognizing the balance between costs and benefits, adolescents may be less likely to engage in unconscious spending and more likely to develop sound consumption tendencies over time.
Overall, adolescents’ early consumption experiences may be related to their long-term attitudes toward spending and value perception. As subscription-based services increasingly dominate digital consumption, examining how adolescents experience and evaluate these services can provide insight into the development of future consumer behavior.
Previous generations learned the value of consumption by experiencing ownership transfer through physical payment. However, in today’s subscription-based economy, the absence of physical payment and ownership transfer may be associated with different ways in which adolescents understand the value of consumption compared to previous generations. Since payments are often automated and intangible, consumers may not directly experience the psychological discomfort associated with spending money — a moment that would otherwise prompt comparison between cost and value. This is consistent with the “pain of paying” literature, which holds that psychological discomfort weakens when payment is less salient8, and with research showing that decoupling payment from consumption reduces consumers’ perceived connection between what they pay and what they receive9. Subscription pricing further resembles flat-rate structures, under which repeated payment decisions feel less burdensome and consumers may prefer fixed-fee plans even when they are not economically optimal10. In this context, subscription awareness becomes important because it reflects whether adolescents notice recurring costs, service use, and subscription conditions when evaluating the value of subscription-based consumption.
Although consumption behaviors formed during adolescence exert a long-term influence on consumption patterns throughout the life span, research examining adolescents’ value formation in the context of subscription-based consumption remains scarce. Thus, this study aims to examine the relationship between adolescents’ subscription-based consumption behaviors and their perceived value, which may be related to their rational consumption habits in adulthood.
Theoretical Background
Pros and Cons of Subscription Payments
Unlike traditional media consumption, which requires one-time purchases of physical ownership, such as buying CDs, DVDs, game cartridges, or movie tickets, subscription models allow unlimited access for a typically small fixed monthly fee. Moreover, subscription services can be used anywhere without location constraints, and are convenient because updates, delivery, and maintenance are handled automatically. Most importantly, they eliminate the transactional friction of pay-per-use models, and for frequently used services, the total cost can be lower than making individual purchases.
However, automatic, recurring billing cycles of subscription services can significantly reduce a consumer’s conscious awareness of spending, making financial outflows psychologically invisible unless actively monitored. Unlike pay-per-use purchases, subscription services often require users to pay a recurring fee for continued access rather than making a separate payment each time they use the service. This structure can make the cost of each individual use less salient by weakening the immediate “pain of paying,” or the psychological discomfort associated with making a payment8,11. Research on automatic bill payment similarly finds that recurring payment schemes can reduce price salience and weaken conscious cost consideration12. Research on payment depreciation further explains that the psychological impact of a payment can decline when payment and consumption are separated over time9.
Subscription services may also encourage passive continuation. Consumers may continue paying for monthly services without actively reassessing their value, partly because of default bias, or the tendency to accept a pre-set option13, and status quo bias, or the tendency to maintain the current state14. Research on transaction decoupling and flat-rate pricing also suggests that bundled, prepaid, or fixed-fee payment structures can reduce the salience of individual consumption costs and make repeated payment decisions feel less burdensome10.
Furthermore, by taking advantage of this tendency, many platforms strategically offer free trials or student discounts, encouraging adolescents to subscribe early and maintain long-term payment habits. Such subscription services often create “Roach Motel” patterns, where subscribing is simple but canceling is difficult or confusing15,16. These manipulative designs can lead users, especially adolescents, to continue paying for services they no longer use because of hidden barriers to cancellation or inadequate disclosure of recurring charges.
Subscription Awareness of Adolescents
Adolescence is a transitional stage to form self-identity and to become an independent consumer. Adolescents undergo consumer socialization by acquiring purchasing skills, engaging in decision-making that involves weighing price and product comparisons, and internalizing consumption motives and values5,6. Nevertheless, adolescents are not yet sufficiently mature to easily identify advertising and marketing as persuasive efforts aimed at altering one’s attitude or behavior17. Thus, adolescents can be easily exposed to the less visible costs and cancellation barriers of subscription payment systems. Adolescents, who are not yet accustomed to mature consumer behavior, often find it challenging to accurately monitor their subscription statuses and achieve optimal consumption by considering factors such as price, billing cycle, and available alternatives. This lack of active engagement with recurring payments may weaken awareness of ongoing spending and lead to challenges in budget management.12,18.
Perceived Value
In consumer research, perceived value is widely defined as a consumer’s overall evaluation of the utility of a product or service based on perceptions of what is received and what is given up19. This foundational definition emphasizes that the concept of value goes beyond simple satisfaction or liking, it is the comparison between benefits and costs that determines how consumers evaluate an experience. Thus, consumers with higher levels of perceived value have a tendency to explore whether the product or service meets one’s expectations, whether it is cost-effective and whether there are better alternatives. In this context, although automatic payment of subscription services may reduce ‘pain of paying’, a lower pain of paying does not always lead to better consumer outcomes. Because the lack of or lower level of pain would cause overspending11, when consumers later recognize the total expenditure, their perceived value may decrease. Thus, consumers who perceive high value do not simply enjoy the absence of ‘pain of paying’, but rather consider the balance between costs and benefits, minimizing the leakage of unconscious spending and increasing intention to repurchase in the long run20,21.
Prior research provides important insights into subscription-based consumption and perceived value, but these two areas are often discussed separately. Studies on subscription programs, flat-rate pricing, payment depreciation, and transaction decoupling explain how recurring or fixed-fee payment structures may affect consumers’ perception of cost, usage, and value. Research on perceived value defines value as an evaluation of the benefits received relative to the costs paid. Because adolescents are still developing financial habits and consumption judgment, these issues are especially relevant in adolescent subscription use. Building on these streams of literature, this study examines whether adolescents’ subscription awareness is associated with their perceived value of subscription-based consumption.
Hypothesis Development
By bridging the literature on subscription-based consumption and adolescent consumer behavior, this study examines the relationship between adolescents’ subscription awareness and perceived value. Prior research has examined how subscription and flat-rate payment structures influence cost perception and consumption behavior, but less attention has been paid to how adolescents’ awareness of recurring subscription costs is associated with their perceived value of subscription-based consumption. Subscription services can reduce payment salience by separating payment from use. Therefore, adolescents with low subscription awareness may continue using or paying for services without clearly evaluating costs relative to benefits. In contrast, adolescents with higher subscription awareness are more likely to notice recurring costs, billing conditions, price changes, unused subscriptions, and available alternatives. Because perceived value is a cost-benefit judgment, this awareness provides the information needed to evaluate whether a subscription is worthwhile. Unlike many traditional purchasing contexts, where costs are immediately tangible and visible at the point of purchase, subscription services separate payment from consumption and can obscure the ongoing expenditure. As a result, variation in awareness may play a particularly important role in how consumers evaluate the value of subscription-based consumption. This issue may be especially relevant for adolescents, who are still developing financial habits and consumer judgment and may be less likely to actively monitor recurring subscription payments than fully independent adult consumers. Thus, higher subscription awareness is expected to be positively associated with perceived value.
Based on this reasoning, this study proposes the following hypothesis:
H1: Adolescents’ subscription awareness is positively associated with their perceived value of subscription-based consumption.
Methodology
Research Design
This study employed statistical analyses—including descriptive statistics, correlation analysis, and ordinary least squares regression—based on cross-sectional data to examine the relationship between adolescents’ subscription awareness and the perceived value of their experiences with subscription-based consumption.
Data Collection
This study conducted a survey using Google Forms among middle and high school students in the Seoul metropolitan area. The questionnaire included 34 survey items: 32 closed-ended items, including multiple-choice and Likert-scale items, and two numeric free-response items. These items measured subscription awareness, perceived value, subscription use, usage intensity, parental involvement, peer influence, financial literacy, allowance, and demographic information.
A total of 430 survey links were distributed to students in 18 classes across nine schools. The school sample included three boys’ schools, three girls’ schools, and three coeducational schools, with two classes surveyed at each school. To reduce topic-based self-selection, all students in the selected classes were invited to participate, rather than only students with a prior interest in subscription services.
Before completing the survey, participants were informed that the study concerned adolescents’ use and perception of subscription-based services. However, the specific variables and expected patterns of association were not explained in order to reduce potential response bias. Responses were anonymous, all participants answered the same set of questions, and no compensation was provided.
Of the 430 distributed survey links, 376 completed responses were returned, yielding a response rate of 87.4%. Students who reported being under 14 at the beginning of the survey were screened out and did not proceed to the main questionnaire, because their participation would have required additional legal guardian consent procedures. At the end of the questionnaire, students were asked to indicate how sincerely they had completed the survey, students who indicated insincere completion were removed from the analytic sample. After these exclusions, the final sample consisted of 341 valid responses. The sample included 161 male students (47.2%) and 180 female students (52.8%). The full survey questionnaire, including the original Korean wording, English translation, and translation procedure, is provided in Supplementary Appendix A.
Variables and Measures
Perceived Value. This variable refers to the extent to which adolescents perceive their subscription-based consumption as worthwhile in relation to the benefits received and the cost paid. Perceived value was measured with five Likert-scale items focused on value-for-money evaluation. The items asked students to evaluate, in relation to cost, the quality, emotional satisfaction, price reasonableness, relative attractiveness compared with alternatives, and practical benefits of their current subscription services19,22,23. Each item was assessed on a 1–5 Likert scale, and the perceived value score was calculated as the arithmetic average of the five items. The five-item scale showed strong internal consistency (Cronbach’s α = .93).
Subscription Awareness. This variable refers to the extent to which adolescents consciously monitor and manage the prices and payment conditions of their subscription services. Subscription awareness was measured with six Likert-scale items focused on adolescents’ knowledge and monitoring of their current subscription services. The items asked students whether they knew the monthly payment amounts and payment dates of their subscriptions, whether they were likely to notice price increases, whether they regularly checked for subscriptions they did not use often, whether they monitored when free trials converted to paid subscriptions, and whether they knew their total monthly spending on subscription services12,24. Each item was assessed on a 1–5 Likert scale, and the subscription awareness score was calculated as the arithmetic average of the six items. The six-item scale showed strong internal consistency (Cronbach’s α = .91).
A principal components analysis with varimax rotation showed that the subscription awareness items and perceived value items loaded on separate components, providing no clear evidence of problematic construct overlap.
Number of Subscriptions. This variable represents the total number of subscription services that each participant reported currently subscribing to. Participants were asked to report how many subscription services they were currently subscribed to in total. This variable was used as a control variable to account for differences in the breadth of participants’ subscription use.
Usage Intensity. Usage intensity was measured by asking respondents to report their average daily time spent using subscription services on a five-category response scale, with higher values indicating longer daily use. This variable was included as a control variable to account for differences in subscription-use engagement, as prior research suggests that the amount of online service use may be related to consumers’ willingness to pay for online content.
Monthly Allowance. Monthly allowance was included as a control variable reflecting adolescents’ available discretionary financial resources. Participants were asked to report the amount of personal allowance they could freely spend in an average month using an eight-category ordered response item ranging from “none” to “600,000 KRW or more.” Because allowance is a common way through which adolescents gain access to money for discretionary spending and may be related to the development of financial capability, this variable was included to account for differences in financial resources that could be associated with subscription use and perceived value25. For analysis, higher values indicated greater monthly allowance.
Parental Involvement. This variable captures the extent to which parents or guardians are aware of and involved in adolescents’ subscription-service use. Prior studies suggest that parental involvement and family communication are associated with adolescents’ consumer and financial behaviors, making this variable relevant to adolescent subscription-based consumption26. It was measured with four Likert-scale items asking whether parents or guardians knew which subscription services the respondent used, knew the costs of those services, were consulted when the respondent started or canceled a subscription service, and checked the respondent’s level of subscription-service use. The parental subscription involvement score was calculated as the arithmetic average of the four items, and the scale showed strong internal consistency (Cronbach’s α = .85).
Peer Influence. Peer influence was included as a control variable because prior research suggests that peers are associated with adolescents’ consumer knowledge, attitudes, purchase behavior, and online purchasing decisions27,28. In this study, peer influence was measured with a single Likert-scale item asking whether the subscription services used by the respondent’s friends influenced the respondent’s own choice of subscription services. The item was assessed on a 1–5 Likert scale, with higher values indicating stronger perceived peer influence.
Financial Literacy. Financial literacy was included as a control variable because prior research suggests that financial education, financial socialization, and students’ experiences with money matters are related to adolescents’ financial knowledge and financial behavior29,30. In this study, financial literacy was measured with five Likert-scale items assessing respondents’ understanding of basic financial concepts and their money-management practices. The items asked whether respondents understood the concepts of interest, recurring or automatic payments, and credit card fees, and whether they had experience saving allowance to purchase goods or services and recording their allowance budget and spending. Each item was assessed on a 1–5 Likert scale, and the financial literacy score was calculated as the arithmetic average of the five items. The five-item scale showed strong internal consistency (Cronbach’s α = .85).
Gender. Participants were asked to indicate their gender as male, female, non-binary, or prefer not to answer. Because all valid responses in the final analytic sample were either male or female, gender was coded as a binary control variable, with female coded as 1 and male coded as 0.
Age. Participants were asked to report their age in years. In the final analytic sample, participants ranged from 14 to 19 years old. Age was included as a demographic control variable in the regression analysis.
Data Analysis
Descriptive statistics are presented from the data collected, including information on demographics, subscription awareness and the perceived value of experiences of the services. Relationships among subscription awareness, perceived value, and other variables concerning subscription-based services were assessed using Pearson correlation analysis.
For the main hypothesis tests, regression analysis was conducted to examine the association between subscription awareness and perceived value while controlling for other relevant factors. Specifically, perceived value was treated as the dependent variable, and subscription awareness was the key independent variable. Additional control variables included number of subscription services, usage intensity, monthly allowance, parental involvement, peer influence, financial literacy, gender, and age.
All statistical analyses were conducted using Python statistical packages, and statistical significance was evaluated at the p < 0.05 level.
Ethical Considerations
Before data collection, the survey procedure was discussed with the participating schools. The survey was administered anonymously, and no personally identifying information was collected. Before beginning the questionnaire, students were informed of the study’s purpose, the voluntary nature of participation, and how their responses would be used. Students who indicated that they were under 14 were directed not to continue, as participation by children under 14 would have required additional consent from a parent or legal guardian under Korea’s Personal Information Protection Act. Students proceeded to the questionnaire only after reading this information and choosing to continue.
Result
Descriptive statistics are displayed in Table 1 for all study variables (N=341). The mean of perceived value is 3.19 (SD = 0.94) and the mean of subscription awareness is 3.05 (SD = 0.83).
The average number of subscriptions was 3.52 (SD=1.07), with participants reporting between 1 and 8 services. Usage intensity had a mean of 3.20 (SD = 1.30) on a five-category scale, while monthly allowance had a mean of 3.18 (SD = 1.74) on an eight-category ordered scale. The mean scores for parental involvement, peer influence, and financial literacy were 3.05 (SD = 0.77), 3.04 (SD = 1.13), and 3.12 (SD = 0.80), respectively. Regarding demographic characteristics, the mean age of participants was 16.61 years (SD = 1.52), with ages ranging from 14 to 19 years. The sample included 161 male students (47.2%) and 180 female students (52.8%).
| Variable | Mean | Standard Deviation | Min | Max |
| Perceived Value | 3.19 | 0.94 | 1 | 5 |
| Subscription Awareness | 3.05 | 0.83 | 1 | 5 |
| Number of Subscriptions | 3.52 | 1.07 | 1 | 8 |
| Usage Intensity | 3.20 | 1.30 | 1 | 5 |
| Monthly Allowance | 3.18 | 1.74 | 1 | 8 |
| Parental Involvement | 3.05 | 0.77 | 1 | 5 |
| Peer Influence | 3.04 | 1.13 | 1 | 5 |
| Financial Literacy | 3.12 | 0.80 | 1 | 5 |
| Gender | 0.53 | 0.50 | 0 | 1 |
| Age | 16.61 | 1.52 | 14 | 19 |
Table 2 presents the pairwise correlations among the variables. The range of variance inflation factors (VIFs) for these variables was 1.02-1.34 (Mean VIF = 1.13), indicating that multicollinearity is not a concern in this analysis.
| 1 | 2 | 3 | 4 | 5 | 6 | 7 | 8 | 9 | 10 | |
| 1. Perceived Value | 1 | |||||||||
| 2. Subscription Awareness | 0.53 | 1 | ||||||||
| 3. Number of Subscriptions | -0.09 | -0.08 | 1 | |||||||
| 4. Usage Intensity | 0.13 | -0.02 | 0.03 | 1 | ||||||
| 5. Monthly Allowance | 0.10 | 0.03 | 0.14 | 0.03 | 1 | |||||
| 6. Parental Involvement | 0.29 | 0.25 | -0.11 | 0.08 | -0.07 | 1 | ||||
| 7. Peer Influence | 0.03 | 0.06 | -0.03 | 0.16 | 0.02 | 0.09 | 1 | |||
| 8. Financial Literacy | 0.50 | 0.35 | 0.06 | -0.03 | 0.13 | 0.20 | 0.07 | 1 | ||
| 9. Gender | 0.00 | -0.01 | 0.00 | 0.04 | 0.01 | -0.01 | -0.08 | 0.03 | 1 | |
| 10. Age | 0.24 | 0.30 | -0.02 | 0.04 | 0.26 | 0.03 | -0.06 | 0.00 | 0.07 | 1 |
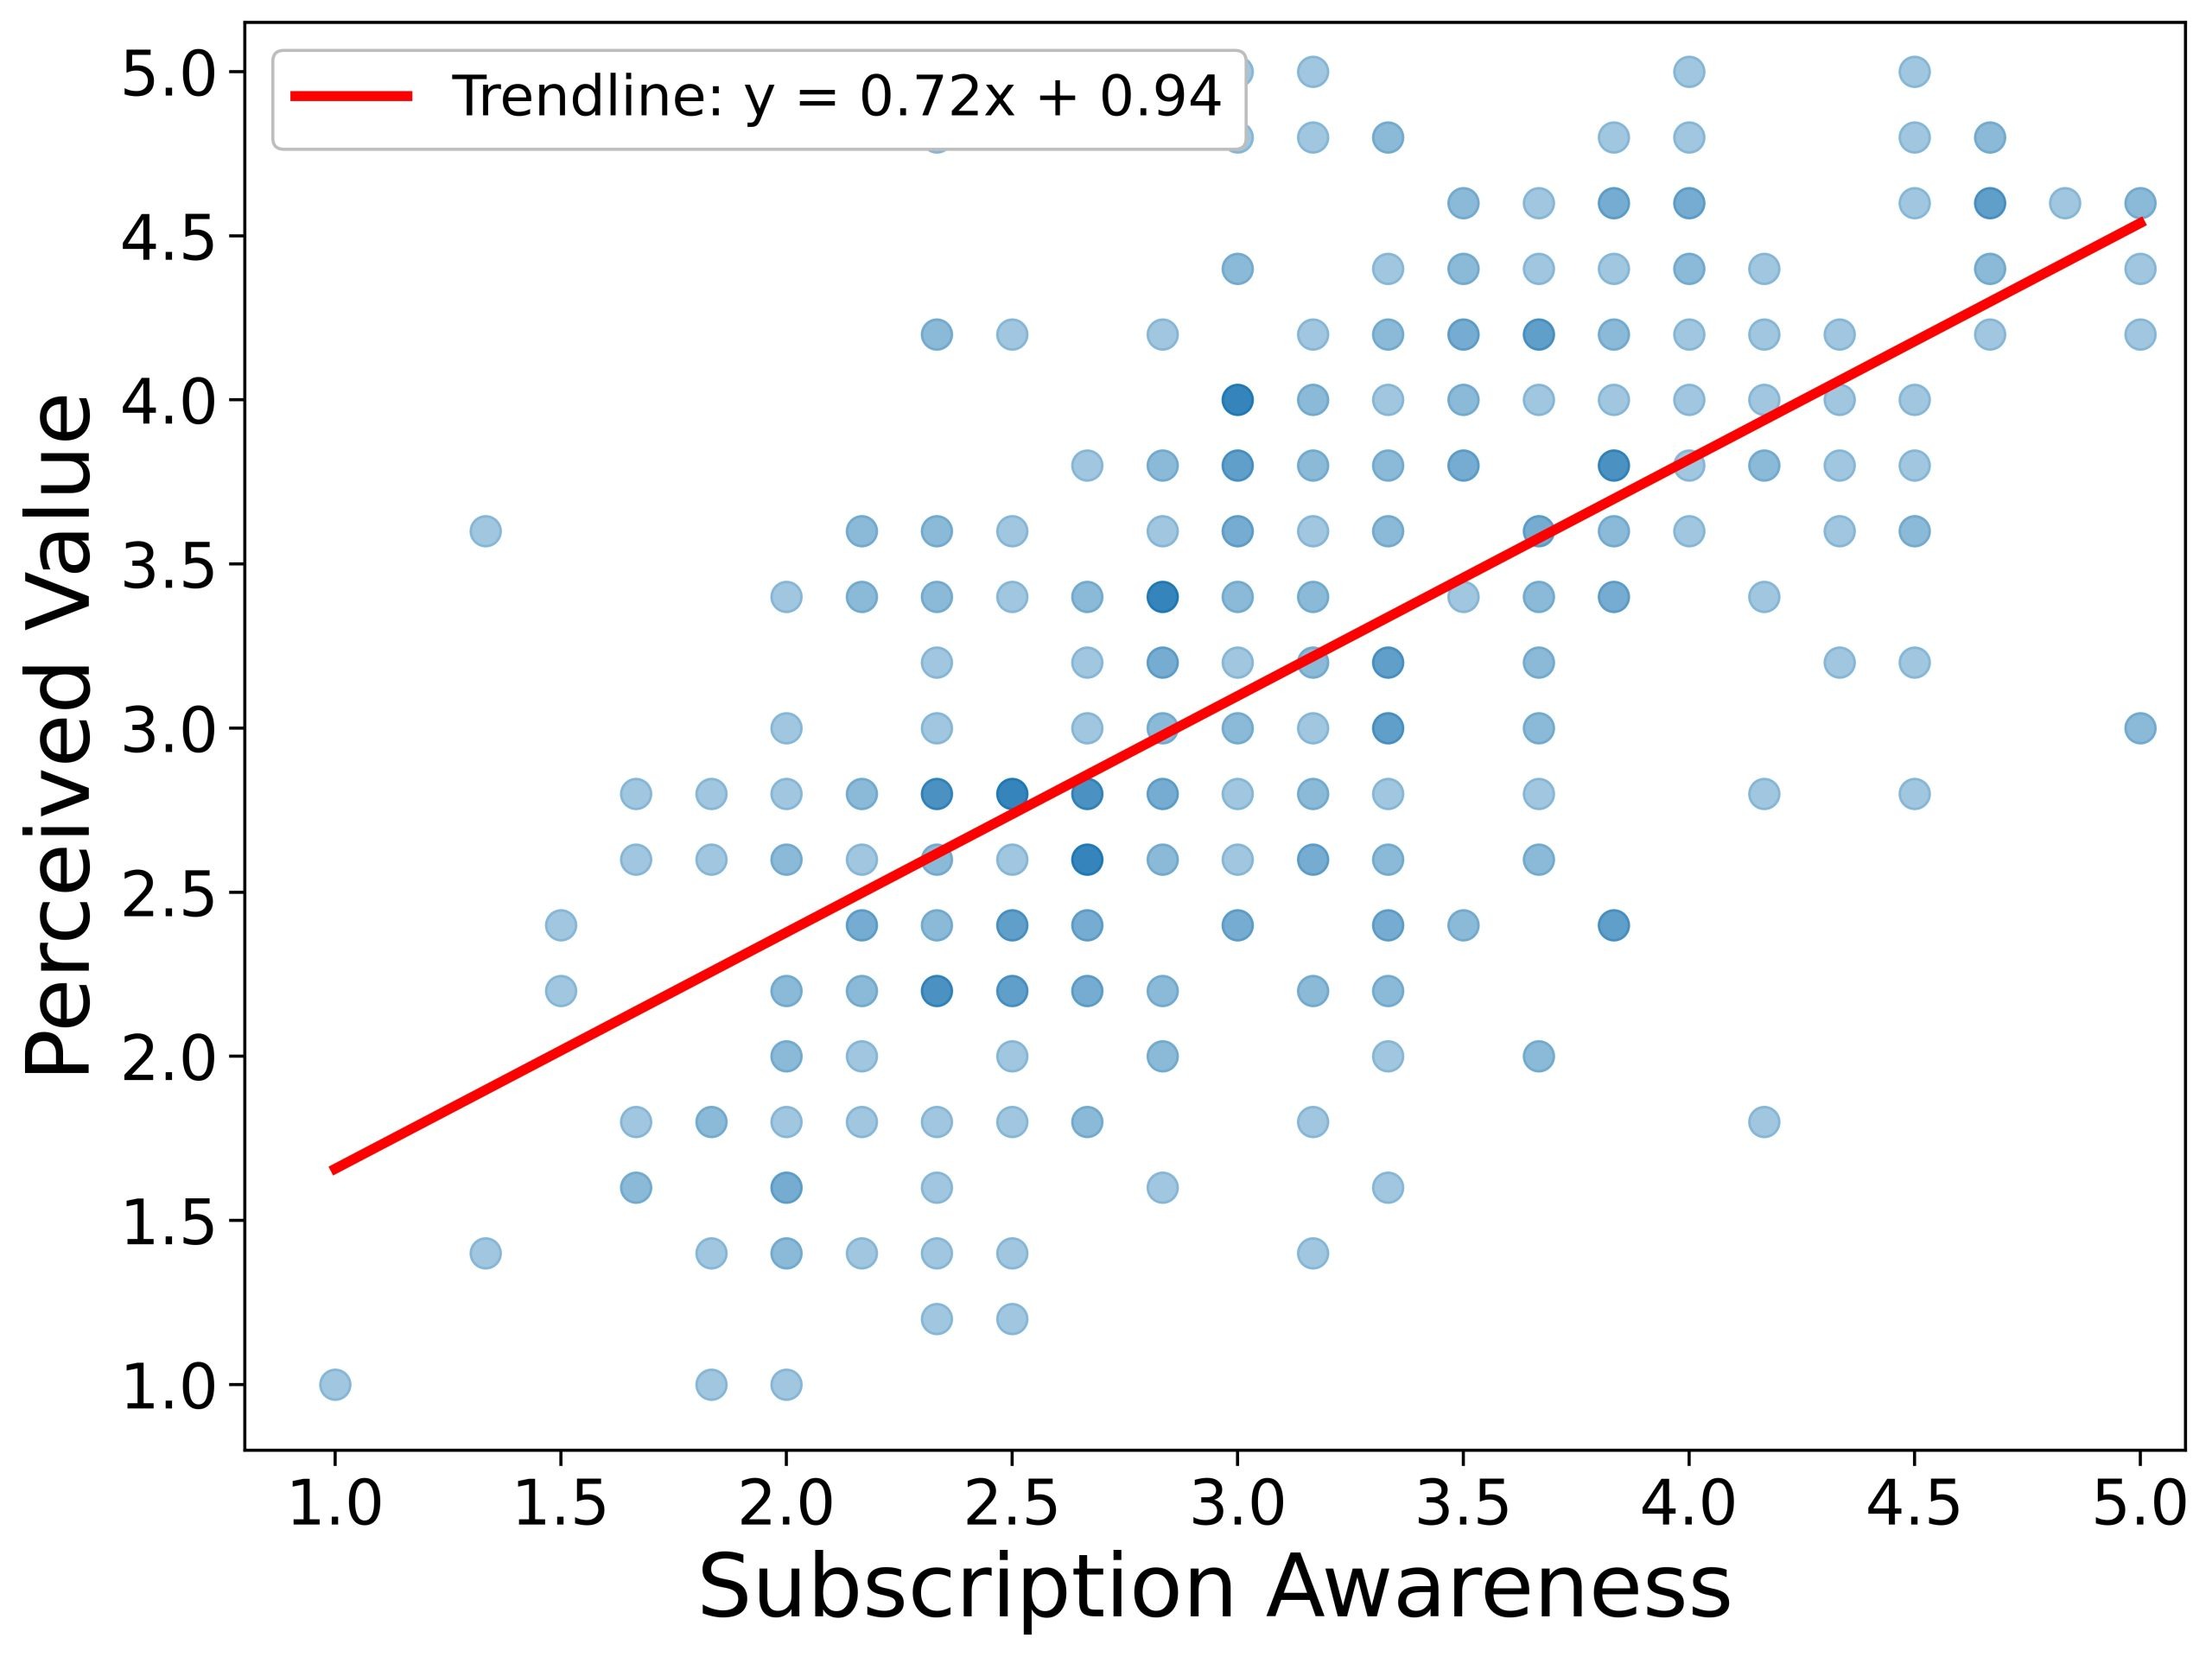
Figure 1 illustrates the relationship between subscription awareness and perceived value of subscription services. The upward fitted regression line slope suggests a positive bivariate relationship between the two variables. Although individual responses vary around the line, the overall pattern indicates that higher subscription awareness tends to be associated with higher perceived value.
A multiple linear regression analysis was conducted to examine the factors associated with adolescents’ perceived value of subscription services. The independent variables included subscription awareness, number of subscriptions, usage intensity, monthly allowance, parental involvement, peer influence, financial literacy, gender, and age (N = 341). As shown in Table 3, the overall model was statistically significant, F(9, 331) = 29.99, p < .01, and explained approximately 45% of the variance in perceived value (R² = .45; adjusted R² = .43).
Subscription awareness was positively and significantly associated with perceived value (b = 0.39, SE = 0.05, p < .01), indicating that adolescents with higher subscription awareness tended to report higher perceived value of subscription-based consumption, controlling for subscription use, financial, social, and demographic variables. Financial literacy (b = 0.43, SE = 0.05, p < .01) and parental involvement (b = 0.14, SE = 0.05, p < .01) were positively associated with perceived value. In addition, usage intensity (b = 0.10, SE = 0.03, p < .01) and age (b = 0.07, SE = 0.03, p < .01) showed significant positive associations with perceived value.
In contrast, the number of subscriptions (b = -0.03, SE = 0.04, p = .37), monthly allowance (b = 0.01, SE = 0.02, p = .71), peer influence (b = -0.04, SE = 0.03, p = .31), and gender (b = -0.04, SE = 0.08, p = .62) were not statistically significant. Overall, the regression results support H1 by showing that subscription awareness remained positively associated with perceived value after controlling for other relevant variables.
| Coefficient | Std. Error | t-stat | p-value | [95% CI] | ||
| Subscription Awareness | 0.39 | 0.05 | 7.19 | 0.00 | 0.28 | 0.49 |
| Number of Subscriptions | -0.03 | 0.04 | -0.90 | 0.37 | -0.10 | 0.04 |
| Usage Intensity | 0.10 | 0.03 | 3.33 | 0.00 | 0.04 | 0.16 |
| Monthly Allowance | 0.01 | 0.02 | 0.37 | 0.71 | -0.04 | 0.06 |
| Parental Involvement | 0.14 | 0.05 | 2.71 | 0.00 | 0.04 | 0.25 |
| Peer Influence | -0.04 | 0.03 | -1.01 | 0.31 | -0.10 | 0.03 |
| Financial Literacy | 0.43 | 0.05 | 8.14 | 0.00 | 0.33 | 0.54 |
| Gender | -0.04 | 0.08 | -0.49 | 0.62 | -0.19 | 0.11 |
| Age | 0.07 | 0.03 | 2.64 | 0.01 | 0.02 | 0.13 |
| Constant | -1.11 | 0.51 | -2.17 | 0.03 | -2.11 | -0.10 |
Discussion
Restatement of Key Findings
This study examined the relationship between adolescents’ subscription awareness and the perceived value of subscription-based consumption. The results consistently indicate that subscription awareness is positively associated with adolescents’ evaluation of the worth of their subscription spending. Subscription awareness showed a strong positive association with perceived value in correlation analyses, visual inspection of the scatter plot, and multiple regression analysis.
Implications and Significance
These findings contribute to the growing literature on the subscription economy by highlighting the association between cognitive monitoring and adolescents’ perceived value of subscription-based consumption. While prior research has emphasized the reduced “pain of paying” associated with automated billing and its potential to encourage overspending, the present study suggests that adolescents who actively monitor their subscriptions tend to report higher perceived value evaluations about their consumption. In other words, the findings suggest an association between subscription awareness and more deliberate evaluation of recurring subscription payments.
From a theoretical perspective, the findings are consistent with consumer socialization theory by suggesting that adolescents’ attention to subscription-related costs and conditions, such as prices, billing dates, and service terms, is related to their evaluation of consumption value. Practically, the findings suggest that helping adolescents track subscription expenses may support more deliberate evaluation of recurring digital consumption. Given the rapid expansion of subscription-based business models, understanding how young consumers interpret value in this context is increasingly important for educators, parents, and policymakers.
Recommendations
Future research should examine additional dimensions of subscription behavior that may influence value perception, such as actual usage data, types of services subscribed to, or duration of subscription. Longitudinal studies would be particularly valuable for examining whether and how early subscription habits predict later financial behavior in adulthood. Furthermore, experimental or intervention-based studies could investigate whether educational programs that promote expense tracking or financial literacy improve adolescents’ ability to evaluate subscription value.
In practical terms, schools and families may consider incorporating budgeting tools or subscription management education into financial literacy programs. Platforms themselves could also design transparency features — such as usage summaries or spending alerts — to help young users make more informed consumption decisions. For example, students could use a monthly subscription checklist that records each service’s price, billing date, free-trial conversion date, cancellation procedure, and actual usage frequency. This would help adolescents avoid treating recurring costs as fixed expenses31, compare those costs with the benefits they receive, and review whether each subscription remains worthwhile.
Limitations
This study has several limitations. First, because the study used cross-sectional survey data, the findings should be interpreted as associations rather than causal relationships. Second, the sample was limited to middle and high school students in the Seoul metropolitan area and was not randomly selected at the national level. Therefore, the findings should not be generalized to all Korean adolescents or to adolescents in other cultural contexts. The study also did not directly measure household income or family socioeconomic status, which may be related to adolescents’ subscription use and perceived value. Future research should use longitudinal, nationally representative, or cross-cultural samples to examine whether the observed associations vary across regions, socioeconomic backgrounds, and cultural contexts. Third, the study relied on self-reported survey responses. Although self-report data are appropriate for measuring subjective perceptions such as awareness and perceived value, responses may still be affected by recall error, misunderstanding of survey items, or social desirability bias. Future research could combine survey responses with behavioral data, such as actual subscription use or payment records, to validate the observed patterns. Fourth, the operationalization of awareness and perceived value through Likert-scale items may not fully establish the construct validity of the measures. Fifth, the study did not differentiate among types of subscription services, which may vary substantially in cost, utility, and usage patterns. Finally, the study did not include detailed measures of online behavior, such as digital media use, platform-specific subscription behavior, or time spent using subscription services. Future research could examine these factors to further identify other determinants of adolescent subscription consumption.
Conclusion
The present study suggests that adolescents who are more attentive to subscription spending tend to report higher perceived value of subscription-based consumption. As subscription models continue to replace traditional ownership-based purchasing, future research and educational efforts should further examine how subscription awareness is related to adolescents’ evaluation of digital consumption.
Supplementary Appendix A
Survey Questionnaire: Original Korean Wording and English Translation
Translation methodology. The questionnaire was originally written in Korean. A bilingual researcher translated the Korean survey into English. A bilingual supervising teacher then back-translated the English version into Korean. The original Korean wording and the back-translated Korean wording were compared for semantic consistency, and no substantive discrepancies were found.
Note. The response options are shown in the order presented to participants. Response-scale labels were translated literally while preserving their ordinal meaning.
| Item | Original Korean wording | English translation |
| Title | Survey Questionnaire | Survey Questionnaire |
| Section A | 기본 정보 | Basic Information |
| A1 | 독립적 정보공개 공개 동의 능력 확인: 만 14세 이상입니까? | Eligibility confirmation for independent consent: Are you 14 years of age or older? |
| A1 option | 예 | Yes |
| A1 option | 아니오 | No |
| A1 option | 잘 모르겠음 | Not sure |
| A1 note | * 아니오, 또는 잘 모르겠음을 선택한 경우, 더 이상 설문을 진행하지 마십시오. | * If you selected No or Not sure, please do not continue with the survey. |
| A2 | 나이 | Age |
| A2 option | 14세 | 14 years old |
| A2 option | 15세 | 15 years old |
| A2 option | 16세 | 16 years old |
| A2 option | 17세 | 17 years old |
| A2 option | 18세 | 18 years old |
| A2 option | 19세 이상 | 19 years old or older |
| A3 | 성별 | Gender |
| A3 option | 남성 | Male |
| A3 option | 여성 | Female |
| A3 option | Non-binary | Non-binary |
| A3 option | 응답하고 싶지 않음 | Prefer not to answer |
| A4 | 거주 지역 | Residential area |
| A4 option | 서울 | Seoul |
| A4 option | 경기 | Gyeonggi Province |
| A4 option | 기타 | Other |
| Section B | 구독 서비스 이용 현황 | Subscription Service Usage Status |
| B1 | 구독 서비스 이용 여부 | Whether you use subscription services |
| B1 option | 예 | Yes |
| B1 option | 아니오 | No |
| B1 option | 잘 모르겠음 | Not sure |
| B2 | 이용 중인 구독 서비스 유형 | Types of subscription services currently used |
| B2 option | 영상/OTT: 넷플릭스, 디즈니플러스, 티빙, 웨이브 등 | Video/OTT: Netflix, Disney+, TVING, Wavve, etc. |
| B2 option | 음악: 멜론, 스포티파이, 애플뮤직 등 | Music: Melon, Spotify, Apple Music, etc. |
| B2 option | 유튜브 프리미엄 | YouTube Premium |
| B2 option | 게임: xbox 게임패스, 플레이스테이션 플러스 등 | Gaming: Xbox Game Pass, PlayStation Plus, etc. |
| B2 option | 교육: 인터넷 강의, 학습 앱 등 | Education: online lectures, learning apps, etc. |
| B2 option | AI: ChatGPT, Gemini, Claude 등 | AI: ChatGPT, Gemini, Claude, etc. |
| B2 option | 생산성: Notion, 클라우드 서비스 등 | Productivity: Notion, cloud services, etc. |
| B2 option | 쇼핑: 쿠팡와우, 네이버플러스 등 | Shopping: Coupang Wow, Naver Plus, etc. |
| B2 option | 기타 | Other |
| B3 | 현재 구독 중인 서비스는 총 몇 개인가? | How many services are you currently subscribed to in total? |
| B4 | 구독하는 서비스 중 자신이 직접 요금을 납부하는 서비스는 몇 개인가? | Among the services you subscribe to, how many do you personally pay for? |
| Section C | Subscription Awareness | Subscription Awareness |
| C instruction | 아래 항목은 ‘구독 서비스의 가격 및 결제 체계에 대하여 얼마나 잘 알고 관리하는가’에 대한 질문입니다. | The following items ask how well you know and manage the prices and payment systems of subscription services. |
| Response scale | 응답 기준: 전혀 그렇지 않다 / 2. 그렇지 않은 편이다 / 3. 보통이다 / 4. 그런 편이다 / 5. 매우 그렇다 | Response scale: 1. Strongly disagree / 2. Somewhat disagree / 3. Neutral / 4. Somewhat agree / 5. Strongly agree |
| C1 | 나는 현재 이용 중인 구독 서비스의 월 결제 금액을 알고 있다. | I know the monthly payment amount for the subscription services I currently use. |
| C2 | 나는 현재 이용 중인 구독 서비스의 결제일을 알고 있다. | I know the payment dates for the subscription services I currently use. |
| C3 | 나는 구독 서비스 가격이 오르면 알아차릴 가능성이 높다 | I am likely to notice if the price of a subscription service increases. |
| C4 | 나는 내가 잘 사용하지 않는 구독 서비스가 있는지 주기적으로 확인한다 | I regularly check whether there are subscription services that I do not use often. |
| C5 | 나는 무료체험이 유료로 전환되는 시점을 잘 확인한다 | I carefully check when free trials convert to paid subscriptions. |
| C6 | 나는 내가 한 달에 구독 서비스에 총 얼마를 쓰는지 대략 알고 있다 | I roughly know how much I spend in total on subscription services each month. |
| Section D | Perceived Value | Perceived Value |
| Response scale | 응답 기준: 전혀 그렇지 않다 / 2. 그렇지 않은 편이다 / 3. 보통이다 / 4. 그런 편이다 / 5. 매우 그렇다 | Response scale: 1. Strongly disagree / 2. Somewhat disagree / 3. Neutral / 4. Somewhat agree / 5. Strongly agree |
| D1 | 비용을 고려했을 때, 내가 이용하는 구독 서비스의 품질에 만족한다 | Considering the cost, I am satisfied with the quality of the subscription services I use. |
| D2 | 비용을 고려했을 때, 내가 이용하는 구독 서비스는 심리적으로 만족감을 준다 | Considering the cost, the subscription services I use give me a sense of satisfaction. |
| D3 | 현재 이용 중인 구독 서비스의 가격은 합리적이라고 생각한다 | I think the prices of the subscription services I currently use are reasonable. |
| D4 | 비용을 고려했을 때, 현재 이용 중인 구독 서비스가 다른 구독 서비스에 비해 더 좋다 | Considering the cost, the subscription services I currently use are better than other subscription services. |
| D5 | 현재 구독 중인 서비스는 비용에 비해 생활에 필요한 혜택을 주고 있다 | The services I currently subscribe to provide useful benefits in daily life relative to their cost. |
| Section E | Usage Intensity | Usage Intensity |
| E1 | 하루 평균 구독 서비스 이용 시간은 어느 정도입니까? | On average, how much time do you spend using subscription services per day? |
| E1 option | 30분 미만 | Less than 30 minutes |
| E1 option | 1시간 미만 | Less than 1 hour |
| E1 option | 1~2시간 | 1-2 hours |
| E1 option | 2~3시간 | 2-3 hours |
| E1 option | 3시간 이상 | 3 hours or more |
| Section F | Parental Involvement | Parental Involvement |
| Response scale | 응답 기준: 전혀 그렇지 않다 / 2. 그렇지 않은 편이다 / 3. 보통이다 / 4. 그런 편이다 / 5. 매우 그렇다 | Response scale: 1. Strongly disagree / 2. Somewhat disagree / 3. Neutral / 4. Somewhat agree / 5. Strongly agree |
| F1 | 부모님/보호자는 내가 어떤 구독 서비스를 이용하는지 알고 있다 | My parent(s)/guardian(s) know which subscription services I use. |
| F2 | 부모님/보호자는 내가 이용하는 구독 서비스의 비용을 알고 있다 | My parent(s)/guardian(s) know the cost of the subscription services I use. |
| F3 | 구독 서비스를 시작하거나 해지할 때는 부모님/보호자와 상의하는 편이다 | I tend to consult with my parent(s)/guardian(s) when starting or canceling a subscription service. |
| F4 | 부모님/보호자는 내 구독 서비스 사용량을 확인하는 편이다 | My parent(s)/guardian(s) tend to check how much I use subscription services. |
| Section G | Peer Influence | Peer Influence |
| Response scale | 응답 기준: 전혀 그렇지 않다 / 2. 그렇지 않은 편이다 / 3. 보통이다 / 4. 그런 편이다 / 5. 매우 그렇다 | Response scale: 1. Strongly disagree / 2. Somewhat disagree / 3. Neutral / 4. Somewhat agree / 5. Strongly agree |
| G1 | 친구들이 사용하는 구독 서비스는 내가 구독 서비스를 선택하는데 영향을 준다 | The subscription services my friends use influence my choice of subscription services. |
| Section H | Financial Literacy | Financial Literacy |
| Response scale | 응답 기준: 전혀 그렇지 않다 / 2. 그렇지 않은 편이다 / 3. 보통이다 / 4. 그런 편이다 / 5. 매우 그렇다 | Response scale: 1. Strongly disagree / 2. Somewhat disagree / 3. Neutral / 4. Somewhat agree / 5. Strongly agree |
| H1 | 나는 이자의 개념을 알고 있다 | I understand the concept of interest. |
| H2 | 나는 정기 결제나 자동 결제의 개념을 알고 있다 | I understand the concept of recurring payments or automatic payments. |
| H3 | 나는 신용카드를 사용할 때 발생하는 수수료의 개념을 알고 있다 | I understand the concept of fees that may occur when using a credit card. |
| H4 | 나는 용돈을 저축하여 필요한 물건이나 서비스를 구매한 경험이 있다 | I have saved my allowance to purchase goods or services I needed. |
| H5 | 나는 용돈 예산과 지출을 기록하는 습관이 있다 | I have a habit of recording my allowance budget and spending. |
| Section I | allowance | Allowance |
| I1 | 나는 정기적으로 용돈을 받고 있다 | I receive allowance regularly. |
| I1 option | 예 | Yes |
| I1 option | 아니오 | No |
| I1 option | 일정하지 않음 | Not regularly |
| I1 option | 대답하고 싶지 않음 | Prefer not to answer |
| I2 | 한 달 평균 내가 자유롭게 사용할 수 있는 개인 용돈을 어느 정도인가? | On average, how much personal allowance can you freely spend per month? |
| I2 option | 없음 | None |
| I2 option | 10만원 이하 | 100,000 KRW or less |
| I2 option | 10~20만원 | 100,000-200,000 KRW |
| I2 option | 20~30만원 | 200,000-300,000 KRW |
| I2 option | 30~40만원 | 300,000-400,000 KRW |
| I2 option | 40~50만원 | 400,000-500,000 KRW |
| I2 option | 50~60만원 | 500,000-600,000 KRW |
| I2 option | 60만원 이상 | 600,000 KRW or more |
| Section J | 응답 품질 확인 | Response Quality Check |
| J1 | 이 설문에 얼마나 성실하게 응답했나요? | How sincerely did you respond to this survey? |
| J1 option | 매우 성실하지 않게 응답했다 | I responded very insincerely |
| J1 option | 성실하지 않은 편이다 | I responded somewhat insincerely |
| J1 option | 보통이다 | Neutral |
| J1 option | 성실한 편이다 | I responded somewhat sincerely |
| J1 option | 매우 성실하게 응답했다 | I responded very sincerely |
| J2 | 본인의 구독 서비스 이용 현황에 대해 얼마나 정확히 알고 있다고 생각하나요? | How accurately do you think you know your own subscription service usage status? |
| J2 option | 거의 모른다 | I know almost nothing |
| J2 option | 잘 모르는 편이다 | I do not know very well |
| J2 option | 보통이다 | Neutral |
| J2 option | 어느 정도 알고 있다 | I know somewhat well |
| J2 option | 매우 잘 알고 있다 | I know very well |
References
- E. Tattersall Wallin, and J. Nolin. Time to read: Exploring the timespaces of subscription-based audiobooks. New Media & Society. Vol. 22.3, pg. 470-488, 2020. [↩]
- A. Pattabhiramaiah, S. Sriram, P. Manchanda. Paywalls: Monetizing online content. Journal of Marketing. Vol. 83.2, pg. 19-36, 2019. [↩]
- H. S. Spilker, T. Colbjørnsen. The dimensions of streaming: toward a typology of an evolving concept. Media, Culture & Society. Vol. 42.7-8, pg. 1210-1225, 2020. [↩]
- S. Shim, J. Serido, B. L. Barber. A consumer way of thinking: Linking consumer socialization and consumption motivation perspectives to adolescent development. Journal of Research on Adolescence. Vol. 21.1, pg. 290-299, 2011. [↩]
- G. P. Moschis, G. A. Churchill Jr. “Consumer socialization: A theoretical and empirical analysis.” Journal of Marketing Research. Vol. 15.4, pg. 599-609, 1978. [↩] [↩]
- S. Ward. Consumer socialization. Journal of Consumer Research. Vol. 1.2, pg. 1-14, 1974. [↩] [↩]
- D. R. John. Consumer socialization of children: A retrospective look at twenty-five years of research. Journal of Consumer Research. Vol. 26(3), pg. 183-213, 1999. [↩]
- D. Prelec, G. Loewenstein. The red and the black: Mental accounting of savings and debt. Marketing Science. Vol. 17(1), pg. 4-28, 1998. [↩] [↩]
- J. T. Gourville, D. Soman. Payment Depreciation: The Behavioral Effects of Temporally Separating Payments from Consumption. Journal of Consumer Research, Vol. 25, no. 2, pg. 160–174, 1998. [↩] [↩]
- A. Lambrecht, B. Skiera. Paying too much and being happy about it: Existence, causes, and consequences of tariff-choice biases. Journal of Marketing Research. Vol. 43.2, pg. 212-223, 2006. [↩] [↩]
- S. I. Rick, C. E. Cryder, G. Loewenstein. Tightwads and spendthrifts. Journal of Consumer Research. Vol. 34(6), pg. 767-782, 2008. [↩] [↩]
- S. Sexton. Automatic bill payment and salience effects: Evidence from electricity consumption. Review of Economics and Statistics. Vol. 97(2), pg. 229-241, 2015. [↩] [↩] [↩]
- R. H. Thaler, C. R. Sunstein. Nudge: Improving Decisions about Health, Wealth, and Happiness. Yale University Press, 2008. [↩]
- W. Samuelson, R. Zeckhauser. Status quo bias in decision making. Journal of Risk and Uncertainty. Vol. 1(1), pg. 7–59, 1988. [↩]
- C. M. Gray, Y. Kou, B. Battles, J. Hoggatt, A. L. Toombs. The dark (patterns) side of UX design. In Proceedings of the 2018 CHI Conference on Human Factors in Computing Systems, pg. 1-14, 2018. [↩]
- A. Sheil. Staying at the roach motel: Cross-country analysis of manipulative subscription and cancellation flows. Proceedings of the 2024 CHI Conference on Human Factors in Computing Systems, 2024. [↩]
- O. B. Carter, L. J. Patterson, R. J. Donovan, M. T. Ewing, C. M. Roberts. Children’s understanding of the selling versus persuasive intent of junk food advertising: Implications for regulation. Social Science & Medicine. Vol. 72(6), pg. 962-968, 2011. [↩]
- R. Iyengar, Y. H. Park, Q. Yu. The impact of subscription programs on customer purchases. Journal of Marketing Research. Vol. 59(6), pg. 1101-1119, 2022. [↩]
- V. A. Zeithaml. Consumer perceptions of price, quality, and value: a means-end model and synthesis of evidence. Journal of Marketing. Vol. 52(3), pg. 2-22, 1988. [↩] [↩]
- Z. Yang and Robin T. Peterson. Customer perceived value, satisfaction, and loyalty: The role of switching costs. Psychology & Marketing. Vol. 21.10, pg. 799-822, 2004. [↩]
- P. G. Patterson, R. A. Spreng. Modelling the relationship between perceived value, satisfaction and repurchase intentions in a business‐to‐business, services context: an empirical examination. International Journal of Service Industry Management. Vol. 8.5, pg. 414-434, 1997. [↩]
- J. C. Sweeney, G. N. Soutar. Consumer perceived value: The development of a multiple item scale. Journal of Retailing. Vol. 77.2, pg. 203-220, 2001. [↩]
- B. Reme, H. L. Røhr, M. Sæthre. Inattention in contract markets: Evidence from a consolidation of options in telecom. Management Science. Vol. 68.2, pg. 1019-1038, 2022. [↩]
- L. Einav, B. Klopack, N. Mahoney. Selling subscriptions. American Economic Review. Vol. 115.5, pg. 1650-1671, 2025. [↩]
- J. M. Collins, E. Odders-White. Allowances: Incidence in the US and relationship to financial capability in young adulthood. Journal of Family and Economic Issues. Vol. 42.3, pg. 533-544, 2021. [↩]
- H. J. Niu. Cyber purchasing behavior of adolescents: family communication relationships and parental influence. Electronic Commerce Research. Vol. 17.3, pg. 495-519, 2017. [↩]
- A. Mishra, M. Maity. Influence of parents, peers, and media on adolescents’ consumer knowledge, attitudes, and purchase behavior: A meta‐analysis. Journal of Consumer Behaviour. Vol. 20.6, pg. 1675-1689, 2021. [↩]
- H. J. Niu. Cyber peers’ influence for adolescent consumer in decision‐making styles and online purchasing behavior. Journal of Applied Social Psychology. Vol. 43.6, pg. 1228-1237, 2013. [↩]
- W. B. Walstad, K. Rebeck, R. A. MacDonald. The effects of financial education on the financial knowledge of high school students. Journal of Consumer Affairs. Vol. 44.2, pg. 336-357, 2010. [↩]
- D. Moreno-Herrero, M. Salas-Velasco, J. Sánchez-Campillo. Factors that influence the level of financial literacy among young people: The role of parental engagement and students’ experiences with money matters. Children and Youth Services Review. Vol. 95, pg. 334-351, 2018. [↩]
- J. F. Petrick, Development of a multi-dimensional scale for measuring the perceived value of a service. Journal of Leisure Research. Vol. 34.2, pg. 119-134, 2002. [↩]