
Abstract
Protein stability depends on storage temperature, solution composition, and concentration. This study tested how a 25 mg/mL solution prepared with commercial β-galactosidase (lactase) powder preserved its activity after a short room-temperature exposure and whether glycerol, a common protein stabilizer, helped retain activity under the same temperature treatment. Each of the three independently prepared blocks included three groups of lactase solutions prepared in pH 7 phosphate buffer and stored respectively at 2 °C, at 23.5 °C for 48 hours followed by 2 °C, and at 23.5 °C for 48 hours with 20% glycerol followed by 2 °C. Over 9 days, lactase activity was measured using a colorimetric assay with o-nitrophenyl-β-D-galactopyranoside (ONPG) as the substrate. Absorbance at 430 nm was recorded every 3 seconds, and activity was calculated from the change in absorbance between 18 and 36 seconds. Across three blocks, apparent activity decreased significantly from Day 0 in all groups by Days 2 and 9. By Day 9, the estimated decreases were 1.440 U/mL in the refrigerated group, 1.737 U/mL in the temperature-excursion group, and 1.236 U/mL in the temperature-excursion group containing glycerol. However, the activity changes did not differ significantly among the three storage conditions. These results provide no statistically significant evidence that the temperature excursion caused additional activity loss or that glycerol improved activity retention. Moreover, this study also demonstrates the viability of using colorimetric assays to measure enzyme activity over time. This assay method is highly accessible and may be adapted to similar stability studies.
Keywords: lactase, protein stability, ONPG, colorimetry, enzyme activity, temperature excursion, glycerol
Introduction
Proteins play a central role in biotechnology products, including therapeutic drugs and enzymes, but they are unstable molecules whose structure and function can change over time1. Stability becomes a crucial topic because it determines the ability for a protein to perform its intended purposes. A protein solution may look unchanged even if the protein has partly unfolded, aggregated, or chemically degraded. In some enzymes, thermal inactivation can precede detectable unfolding, possibly because the active site unfolds locally before the rest of the protein2. The presence of an enzyme, in other words, does not necessarily mean that it can still catalyze its reaction. Activity-based assays are therefore relevant because they measure enzymatic function directly rather than relying on physical appearance alone2.
Temperature has a substantial influence on protein stability. As temperature rises, the molecular motion becomes more chaotic. This can disrupt the noncovalent interactions that help maintain a protein’s folded structure2. Proteins are often placed outside their recommended storage conditions due to transportation, preparation, or handling, but the effects on stability may vary with the specific protein, formulation, exposure duration, and temperature3. Recent β-galactosidase studies illustrate this variability. Mulualem et al. found that refrigerated storage preserved the activity of purified Bifidobacterium adolescentis β-galactosidase more effectively than room temperature storage4, whereas Liu et al. reported substantial differences in the half-life of a β-galactosidase from Kluyvera intermedia stored at different temperatures5. Király et al. further showed that thermal stress can affect lactase activity and physicochemical properties even when structural changes are not detected6. As these studies examined different enzymes and preparations, none can predict the behavior of other proteins, or the commercial Aspergillus oryzae lactase tested here.
The current study focuses on lactase in solutions because enzyme solutions are commonly prepared and handled in laboratory and biotechnology spaces. Liquid preparations are useful because they can be mixed, aliquoted, pipetted, and added directly to reactions. A dissolved enzyme is also continuously exposed to its buffer environment. For this reason, testing activity behavior in solutions is more relevant to many realistic situations than testing dry enzyme powder.
Different protein concentrations in solutions can greatly affect experimental results. A dilute enzyme solution may behave differently than a more concentrated one, since concentration can affect protein-protein interactions and the measured apparent activity. Besides this, buffer composition, pH level, additives, and enzyme source can also shape how activity changes in storage3. In one study, Bifidobacterium bifidum lactase in buffer was completely inactivated within two hours at 50 °C, while the same enzyme in a 40% trehalose solution retained 91% activity after 25 hours7. Different formulations can also create distinct effects among β-galactosidases. Ambrogi et al. reported that glycerol affected the stability of seven bifidobacterial β-galactosidases to different extents8, and Nolan et al. showed that molecular effects from polyethylene glycol altered both the activity and stability of Kluyveromyces lactis β-galactosidase over time9.
Lactase is a suitable enzyme for this study because its activity can be measured in a colorimetric assay using ONPG hydrolysis10,11. Leksmono et al. used this same approach to measure lactase from commercial supplement tablets. Specifically, they measured the increase in absorbance of the colorimetric assay at 420 nm12. Lactase produces o-nitrophenol when hydrolyzing ONPG, and the increasing fraction of it forms the yellow o-nitrophenolate anion, which absorbs visible light11. The absorbance of light increases as the reaction proceeds, and the rate of absorbance increase over time can then be used as a relative measure of lactase activity. The commercial lactase used in this study was derived from Aspergillus oryzae, but published A. oryzae β-galactosidase preparations have shown different pH behavior: one A. oryzae study reported an ONPG activity optimum near pH 4.5 and stability across pH 4–910, whereas another reported an optimum near pH 7.5 and activity approaching zero at pH 4.011. Since published studies have shown different pH behavior, pH 7 was used as a fixed assay condition and was not assumed to be this reaction’s optimum.
Additionally, this study tested to what extent glycerol could stabilize this defined preparation, if it could at all. Glycerol is often included in protein formulations because it can help favor the folded structure and reduce aggregation. This ability comes from the concept of preferential hydration of the protein surface13,14. However, this influence is not universal. Glycerol may stabilize protein structure without preserving activity, and in some cases it may inhibit or enhance the measured reaction rate15. Therefore, the effects of glycerol as a stabilizer must be tested directly here.
The objective of this study was to determine how the functionality of 25 mg/mL commercial lactase solutions in pH 7 phosphate buffer changed over 9 days, comparing effects of constant 2 °C storage to 48-hour exposure to 23.5 °C, with and without glycerol, followed by 2 °C storage. The question is not purely academic: lactase can be administered as an enzyme supplement to aid lactose digestion in individuals with lactose intolerance16, while commercial β-galactosidases are also used in dairy processing to hydrolyze lactose in milk17. ONPG colorimetry was used to track functional activity over time across independently prepared batches, and raw activity was analyzed rather than a normalized percentage within each group.
Methods
Research design
This study was designed as a comparative enzyme-stability experiment testing how storage and solution condition affect the activity of a commercial lactase (β-galactosidase) preparation over time. The independent variable was the storage and solution conditions (Table 1), and the dependent variable was lactase activity. It was quantified first as the ordinary-least-squares (OLS) slopes of absorbance at 430 nm over the fixed 18–36 s initial-rate window and then converted to U/mL using the o-nitrophenol calibration described below.
To separate the effect of storage condition from ordinary batch-to-batch variation, the experiment was run as three independent blocks. Each block was a complete, independently prepared repeat of all three treatment groups. Within a block, a single master commercial lactase solution was prepared and divided among the three treatments so that preparation was not confounded with storage condition. Day 0 measurements were performed after the master solution had been divided among the three treatments and after buffer or glycerol was added, but before the temperature excursion began. A separate vial was used for each measurement day so that no vial was opened more than once. The independently prepared block was treated as the unit of replication for analysis.
The experiment included five measurement days: Day 0, Day 1, Day 2, Day 5, and Day 9, corresponding to July 31, August 1, August 2, August 5, and August 9, 2026. The temperature excursion groups (Groups 2 and 3) were kept at 23.5 °C for 48 hours after Day 0 and were then transferred to 2 °C storage after the Day 2 measurement.
Materials
Commercial lactase powder (BulkSupplements Lactase Enzyme [3000 ALU Powder], lot 2507409; manufacture date September 11, 2025; expiration date September 30, 2027) was used. BulkSupplements confirmed by email that the lactase was derived from Aspergillus oryzae. The lot-specific certificate of analysis reported lactase activity of 4,344.43 ALU/g by UV-Vis and loss on drying of 6.44%. The certificate did not report total protein concentration, β-galactosidase purity, or carrier composition; therefore, all mass concentrations refer to the commercial lactase powder preparation rather than purified enzyme. ONPG was purchased from Thermo Scientific as o-nitrophenyl-β-D-galactopyranoside, catalog no. 34055. Phosphate buffer (pH 7) was obtained from Thermo Scientific, catalog no. AC258595000. 2-Nitrophenol (o-nitrophenol; Thermo Scientific Chemicals, catalog no. AC128741000; labeled purity 99%) was used to prepare the calibration standards. Laboratory-grade glycerin was obtained from Flinn Scientific (product no. AP7103D). Flinn did not provide a numerical assay purity, so glycerin concentrations are reported as nominal volume fractions of the supplied product. Other materials included a MiniOne Systems 1000 µL micropipette, 1000 µL pipette tips, an Ohaus Scout SPX223 balance, CyroKING 2 mL cryovials with caps, a two-point-calibrated pH meter, plastic cuvettes, a 100 mL beaker, a stirring rod, Kimwipes, deionized water, a thermometer, a Vernier colorimeter, a Vernier LabQuest Mini, a Microsoft laptop, and Logger Pro software. The same MiniOne Systems micropipette was used throughout the experiment and its calibration was verified gravimetrically on every preparation and measurement day.
| Group | Additive | Storage condition | Measurement days |
| 1 | None | Constant 2 °C | Days 0, 1, 2, 5, 9 |
| 2 | None | 23.5 °C for 48 hours after Day 0, then 2 °C | Days 0, 1, 2, 5, 9 |
| 3 | 20% glycerol | 23.5 °C for 48 hours after Day 0, then 2 °C | Days 0, 1, 2, 5, 9 |
Note: All three groups contained approximately 25 mg/mL commercial lactase powder preparation in pH 7 phosphate buffer.
Preparation of lactase solutions
Within each block, one master lactase solution was prepared and then divided among the three treatment groups. For each block, 0.62 g of commercial lactase powder was dissolved in 20 mL phosphate buffer to prepare an approximately 31 mg/mL commercial lactase solution. Then, for treatment Groups 1 and 2, 4 mL of the master solution was transferred to a beaker, where another 1 mL phosphate buffer was added and mixed; for treatment Group 3, 4 mL of the master solution was transferred to a beaker, where 1 mL (1.26 g) of glycerol was added and mixed with the solution for 20% (v/v) glycerol concentration. Because 4 mL of the 31 mg/mL master contains approximately 124 mg of commercial lactase, each 5 mL treatment solution reached approximately 24.8 mg/mL (≈ 25 mg/mL). Adding 1 mL of buffer to groups 1 and 2 matched the glycerol added to Group 3, so that lactase concentration was held constant across all groups and glycerol addition was the only intended difference in solution composition. All solutions were prepared at 24 °C and mixed by stirring until fully dissolved. Finally, 0.80 mL was pipetted into each of the five vials per group per block.
Storage conditions
Group 1 was the control group, which was continuously refrigerated at 2 °C for the full experiment. Groups 2 and 3 were stored at 23.5 °C on a laboratory bench for 48 hours after Day 0. After the Day 2 measurement, Groups 2 and 3 were moved to the 2 °C refrigerator for the rest of the experiment. Excursion temperature was monitored by thermometer each day.
Preparation of ONPG solution
To reduce condensation inside the ONPG container, frozen ONPG was allowed to reach room temperature before the container was opened. A fresh ONPG solution was prepared on each measurement day by dissolving 0.15 g solid ONPG in 30 mL deionized water, resulting in a concentration of 5 mg/mL (16.6 mM). The substrate stock was made in deionized water rather than buffer because only a small aliquot (0.6 mL) was added to the 1.7 mL of phosphate buffer in each reaction. The phosphate component maintained the buffer environment. Buffer pH was 7.01 at approximately 23.5 °C at both the beginning and end of the nine-day experiment; the reaction mixture was also measured at pH 7.01 at approximately 23.8 °C. Delivered this way, the assay contained approximately 4.0 mM ONPG in the 2.5 mL reaction volume. For comparison, Tanaka et al. reported an ONPG Km of 0.72 mM for purified Aspergillus oryzae β-galactosidase10. The concentration used here was therefore several times that published value, supporting its selection as a relatively high substrate concentration. However, because Km depends on the enzyme preparation and assay conditions, substrate saturation was not assumed for the commercial lactase tested here. The ONPG solution was protected from harsh lighting during preparation and use and was stirred until it dissolved completely. All solutions remained fully dissolved and stable across reads with no settling. The same daily ONPG solution was used for all groups measured that day, while the procedure was repeated for every measurement day. Substrate blank readings of ONPG and phosphate buffer were recorded during each measurement day to observe the background absorbance. Blanking did not constitute a daily reference enzyme control measurement.
The manufacturer did not provide an optimum pH or activity pH profile for this commercial lactase preparation. Therefore, pH 7 was not treated as the enzyme’s activity optimum. It was selected as a fixed condition because phosphate buffer maintained a consistent neutral matrix and because o-nitrophenol absorbance near 430 nm depends on its pH level. Tanaka et al. reported an acidic activity optimum for purified Aspergillus oryzae β-galactosidase10, while Shi et al. found that modified forms of the enzyme could remain more active closer to neutral pH18. Therefore, all activity values stated here are specific to the defined pH 7 assay.
Colorimetric assay procedure
A Vernier colorimeter, set to 430 nm, was connected to Logger Pro through a Vernier LabQuest Mini. Increasing absorbance at 430 nm reflected the accumulation of the yellow o-nitrophenol product.
The colorimeter is a fixed wavelength instrument offering only 430, 470, 565, and 635 nm, and 430 nm was used because it is the closest available wavelength at which o-nitrophenol is conventionally measured. The yellow product o-nitrophenol absorbs maximally near 420 nm, and standard β-galactosidase assays read near 405–420 nm: the ONPG supplier’s 405 nm protocol19 and the classic Miller assay near 420 nm20. 430 nm still yields a signal proportional to product concentration. Response at 430 nm was calibrated directly with o-nitrophenol standards in pH 7 phosphate buffer. An additional series in 1.6% (v/v) glycerol buffer reproduced the final glycerol concentration present in Group 3 assay cuvettes.
Product formation was followed continuously rather than by a fixed-endpoint stopped assay since no sodium carbonate stop solution was added, and activity was taken from the initial-rate slope of the absorbance trace.
A plastic cuvette was used for all trials and rinsed with phosphate buffer between runs. 1.7 mL of phosphate buffer and 0.6 mL of the ONPG solution were sequentially pipetted into each blanking cuvette. The 2.3 mL blank volume was sufficient to cover the colorimeter light path. The colorimeter was blanked with this mixture before each trial. The reaction was then initiated by adding 0.2 mL of commercial lactase solution from each vial and mixed after pipetting down once. The reaction began when the enzyme aliquot was added. Recording time zero was defined as the moment the cuvette lid closed and data collection began. The short transfer interval between enzyme addition and recording was not independently timed. To exclude early mixing and transfer effects, readings through 15 s were omitted and all rates were calculated from the common 18–36 s window. Absorbance was then recorded approximately every three seconds for about 63 seconds. The outside of the cuvette was always wiped before insertion. All assays were performed at room temperature (~23.5 °C).
To avoid confounding group identity with elapsed time or instrument drift, the measurement order of the three groups and blocks was randomized on each measurement day. The vials for each day were labeled, then randomly selected.
A substrate blank (phosphate buffer plus ONPG) was prepared and read for each trial on each measurement day, and the colorimeter was blanked against it so that background absorbance was removed before each reaction. No daily reference or pooled quality-control enzyme was run. Because the measurement order of the groups and blocks was randomized within each day, this could reduce within-day drift, but it could not completely eliminate between-day variation caused by handling.
At least two technical trials were run per group per measurement day. A trial was excluded only when a pipetting or distribution error occurred, and additional trials were run when necessary. Two valid technical trials were retained for 44 of the 45 block-condition-day combinations. For Day 9, Block 2, Group 2 four trials were attempted, but three were excluded because of assay errors, leaving one valid trial. Valid technical-trial slopes from 18–36 s were averaged to give one activity value for each combination.
According to the manufacturer’s specifications, the colorimeter’s useful (linear) absorbance range is 0.05–1.0 absorbance at 430 nm, with Beer’s-law linearity degrading above 1.0 absorbance21. Only kinetic points within this range were used for analysis.
Assay validation
To convert absorbance at 430 nm into o-nitrophenol concentration, calibration curves were prepared using standards with known o-nitrophenol concentrations. A concentrated stock was made by dissolving 0.140 g of 99% pure o-nitrophenol in pH 7 phosphate buffer to a final volume of 100 mL. After correction for purity and molecular masses, the stock concentration was 9.963 mM. A working standard was then prepared by mixing 1.0 mL of the concentrated stock with 9.0 mL of buffer. The five calibration concentrations were 1.000, 0.500, 0.250, 0.150, and 0.075 mM; their purity-corrected concentrations were 0.9963, 0.4982, 0.2491, 0.1495, and 0.0747 mM, respectively. Unless otherwise stated, the ONPG solutions, calibration standards, enzyme-dilution solutions, and storage samples were prepared and measured at room temperature, approximately 23.5–23.8 °C.
Two calibration series were measured: the first used plain phosphate buffer and the second used 1.6% (v/v) glycerol phosphate buffer to approximate the final glycerol concentration in Group 3 cuvettes. Since the concentrated o-nitrophenol stock contained no glycerol, the standards in this series had approximately 1.44–1.59% glycerol rather than exactly 1.60%.
Before each calibration series, the colorimeter was blanked with the corresponding buffer matrix. It was not reblanked between concentrations within the same series. Eight absorbance readings were collected from each standard and averaged. These readings represented repeated measurements of one prepared standard at each concentration, not independently prepared replicates.
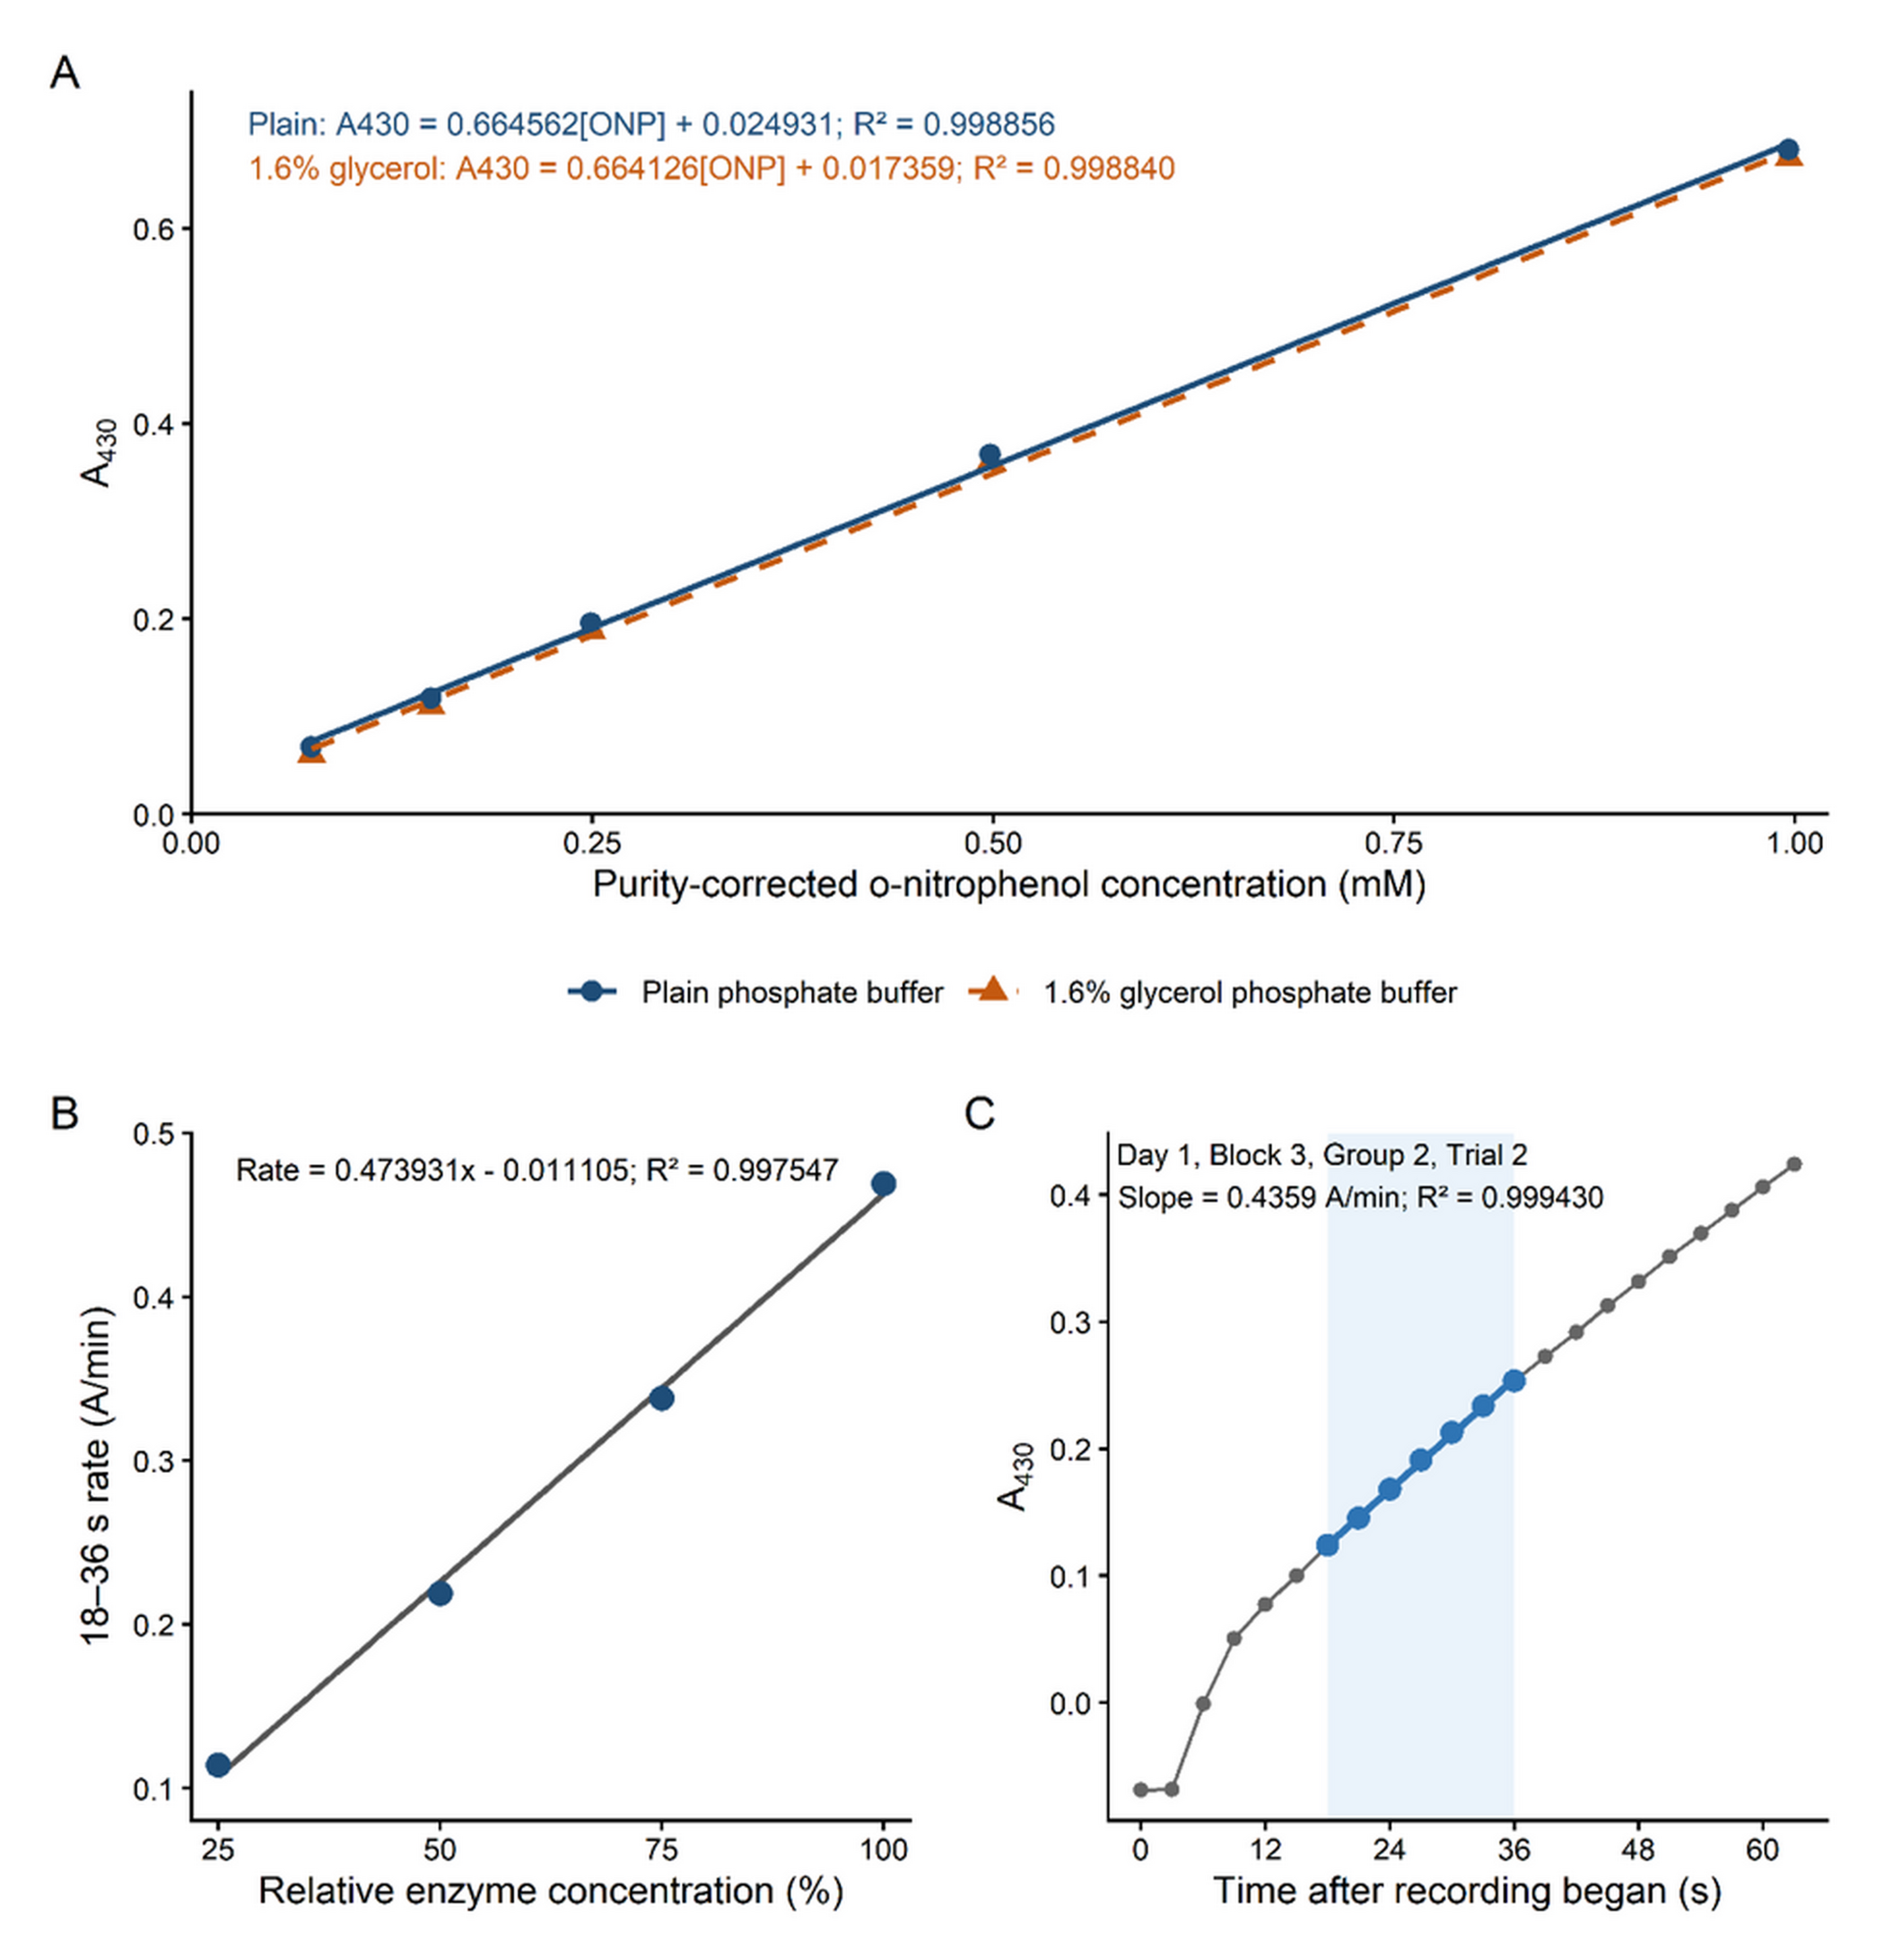
Linear regression was used to analyze the corrected o-nitrophenol concentrations. The calibration relationship obtained in plain phosphate buffer was:
The coefficient of determination for this calibration was R2 = 0.998856. The glycerol calibration that closely represented the Group 3 assay matrix was:
The coefficient of determination for the glycerol calibration was R² = 0.998840. In these equations, A₄₃₀ represents absorbance at 430 nm and [ONP] represents the o-nitrophenol concentration in mM. These two slopes differed from each other by only 0.066%, indicating that the low glycerol concentration had a negligible effect on the absorbance response per millimolar o-nitrophenol. The plain buffer slope was used to convert the absorbance rates of Groups 1 and 2 to U/mL, whereas the low glycerol slope was used for Group 3. Only the calibration slopes were used in this calculation because the constant intercept does not affect the absorbance rate.
Enzyme dilution series
The relationship between enzyme amount and measured reaction rate was tested using a separately prepared 25 mg/mL commercial lactase solution. The solution was assayed at 100%, 75%, 50%, and 25% of its original concentration after dilution with pH 7 phosphate buffer. Every dilution was tested using the same assay composition as the storage experiment: 1.7 mL phosphate buffer, 0.6 mL ONPG solution, and 0.2 mL commercial lactase solution. One kinetic trace was recorded at each dilution.
Using the fixed 18–36 s analysis window, the measured rates were 0.4693, 0.3382, 0.2189, and 0.1141 A/min for the 100%, 75%, 50%, and 25% solutions, respectively. The four enzyme concentrations were then treated as four points in a separate regression, with relative enzyme concentration as the independent variable and the corresponding 18–36 s reaction rate as the dependent variable. The fitted relationship was:
The individual 18–36 s kinetic fits had R2 values from 0.998327 to 0.999922. The high R² values and small intercept supported approximate proportionality between measured rate and enzyme amount. Since only one kinetic trace was recorded at each dilution, this series was used as a descriptive validation of assay proportionality rather than a statistical experiment.
Data analysis
Readings through 15 s were designated as a common reaction starting interval and were not used for rate analysis. The seven-point windows beginning after this interval were screened without using storage condition labels or activity outcomes. To prevent selecting a favorable interval for any particular condition, the same earliest eligible window, 18–36 s, was applied to every valid trace. An OLS line was fitted to the seven absorbance readings at 18, 21, 24, 27, 30, 33, and 36 s. Olp et al. similarly estimated initial reaction rates by fitting a linear section of a continuous kinetic trace22, although their ICEKAT software was not used in the present study. Acceptance required every fitted point to fall within the colorimeter’s stated 0.05–1.0 absorbance range21 and every trace fit to have R² ≥ 0.995. Across the 89 valid traces, the absorbance values used in the fits ranged from 0.0878 to 0.3871, the median R2 was 0.9994, and the largest absolute residual was 0.00431 absorbance unit. These results supported the use of 18–36 s as a common linear approximation, although the traces are not perfectly linear. Fit coefficients, R2 values, and residuals were calculated for every valid trace, and runs with documented assay errors were excluded from analysis.
The activity slope was calculated in A/min. One unit (U) was defined as formation of 1 micromole of o-nitrophenol per minute under the assay conditions.
For Groups 1 and 2, apparent activity per milliliter of stored lactase preparation was calculated as:
For Group 3, the calibration slope that matched the glycerol matrix was used:
Dividing the absorbance slope by the corresponding calibration slope converted A/min to mM/min. Because mM multiplied by mL equals micromoles, these equations convert the absorbance rate to micromoles per minute and divide by the 0.200 mL enzyme solution aliquot.
All statistical analyses used the raw apparent lactase activity values in U/mL rather than relative percentages to Day 0. There were 45 observations from three independently prepared blocks, three storage conditions, and five measurement days.
The block-level activity values were analyzed by ordinary least squares using a fixed-effects linear model containing preparation block, storage condition, measurement day, and the interaction between storage condition and day: activity = block + condition + day + condition × day. Day was treated as a categorical variable because measurements were collected on Days 0, 1, 2, 5, and 9, and a constant daily rate of change was not assumed. The condition-by-day interaction was the primary test of whether activity changed differently over time among the storage conditions.
After the omnibus F tests, two-sided t-tests of linear contrasts from the fitted model were used to examine specific differences. Paired differences among the three storage conditions were calculated separately at each measurement day, producing 15 condition contrasts. A second family of 24 contrasts evaluated changes from Day 0 within each condition and differences in those changes between conditions. Standard errors, t statistics, and the 95% confidence intervals were calculated using the pooled residual variance and 28 residual degrees of freedom from the fixed-effects model. Holm adjustment was applied separately to the 15 condition contrasts and the 24 change contrasts to control the error rate within each part. Statistical significance for these comparisons was determined using the Holm-adjusted p values, with adjusted p < 0.05 considered significant.
Day 2 and Day 9 contrasts were emphasized in the main manuscript because the Day 2 measurement signifies the end of the 48-hour temperature excursion, immediately before Groups 2 and 3 were transferred to refrigerated storage, whereas Day 9 represented the end of the experiment. Contrasts for Days 1 and 5 were retained in the supplementary analysis.
Activity values are reported as the mean and standard deviation among the three independent blocks (n = 3). Model-based differences are reported with 95% confidence intervals where relevant. Variation among technical trials was summarized separately using the within-cell standard deviation and coefficient of variation and was not treated as independent replication. Statistical analyses were performed in Python 3.12.13 using NumPy 2.3.5 and SciPy 1.17.0.
Ethical considerations
Assay validation
Both calibration series were highly linear (Figure 1A). The plain buffer and 1.6% glycerol curves had slopes of 0.664562 and 0.664126 A/mM, respectively, with corresponding R² values of 0.998856 and 0.998840. Their slopes differed by only 0.066%. Reaction rate increased from 0.1141 A/min at 25% relative enzyme concentration to 0.4693 A/min at 100% and remained approximately proportional to enzyme concentration (Figure 1B; R² = 0.997547). Across the 89 retained storage traces, every fit in the fixed 18–36 s window met the prespecified R² threshold of 0.995, with a median R² of 0.9994. Figure 1C illustrates this fitting window in a representative trace. Across all fitted regions, absorbance ranged from 0.0878 to 0.3871, and the largest absolute residual was 0.00431 absorbance unit.
Effects of storage condition and time on lactase activity
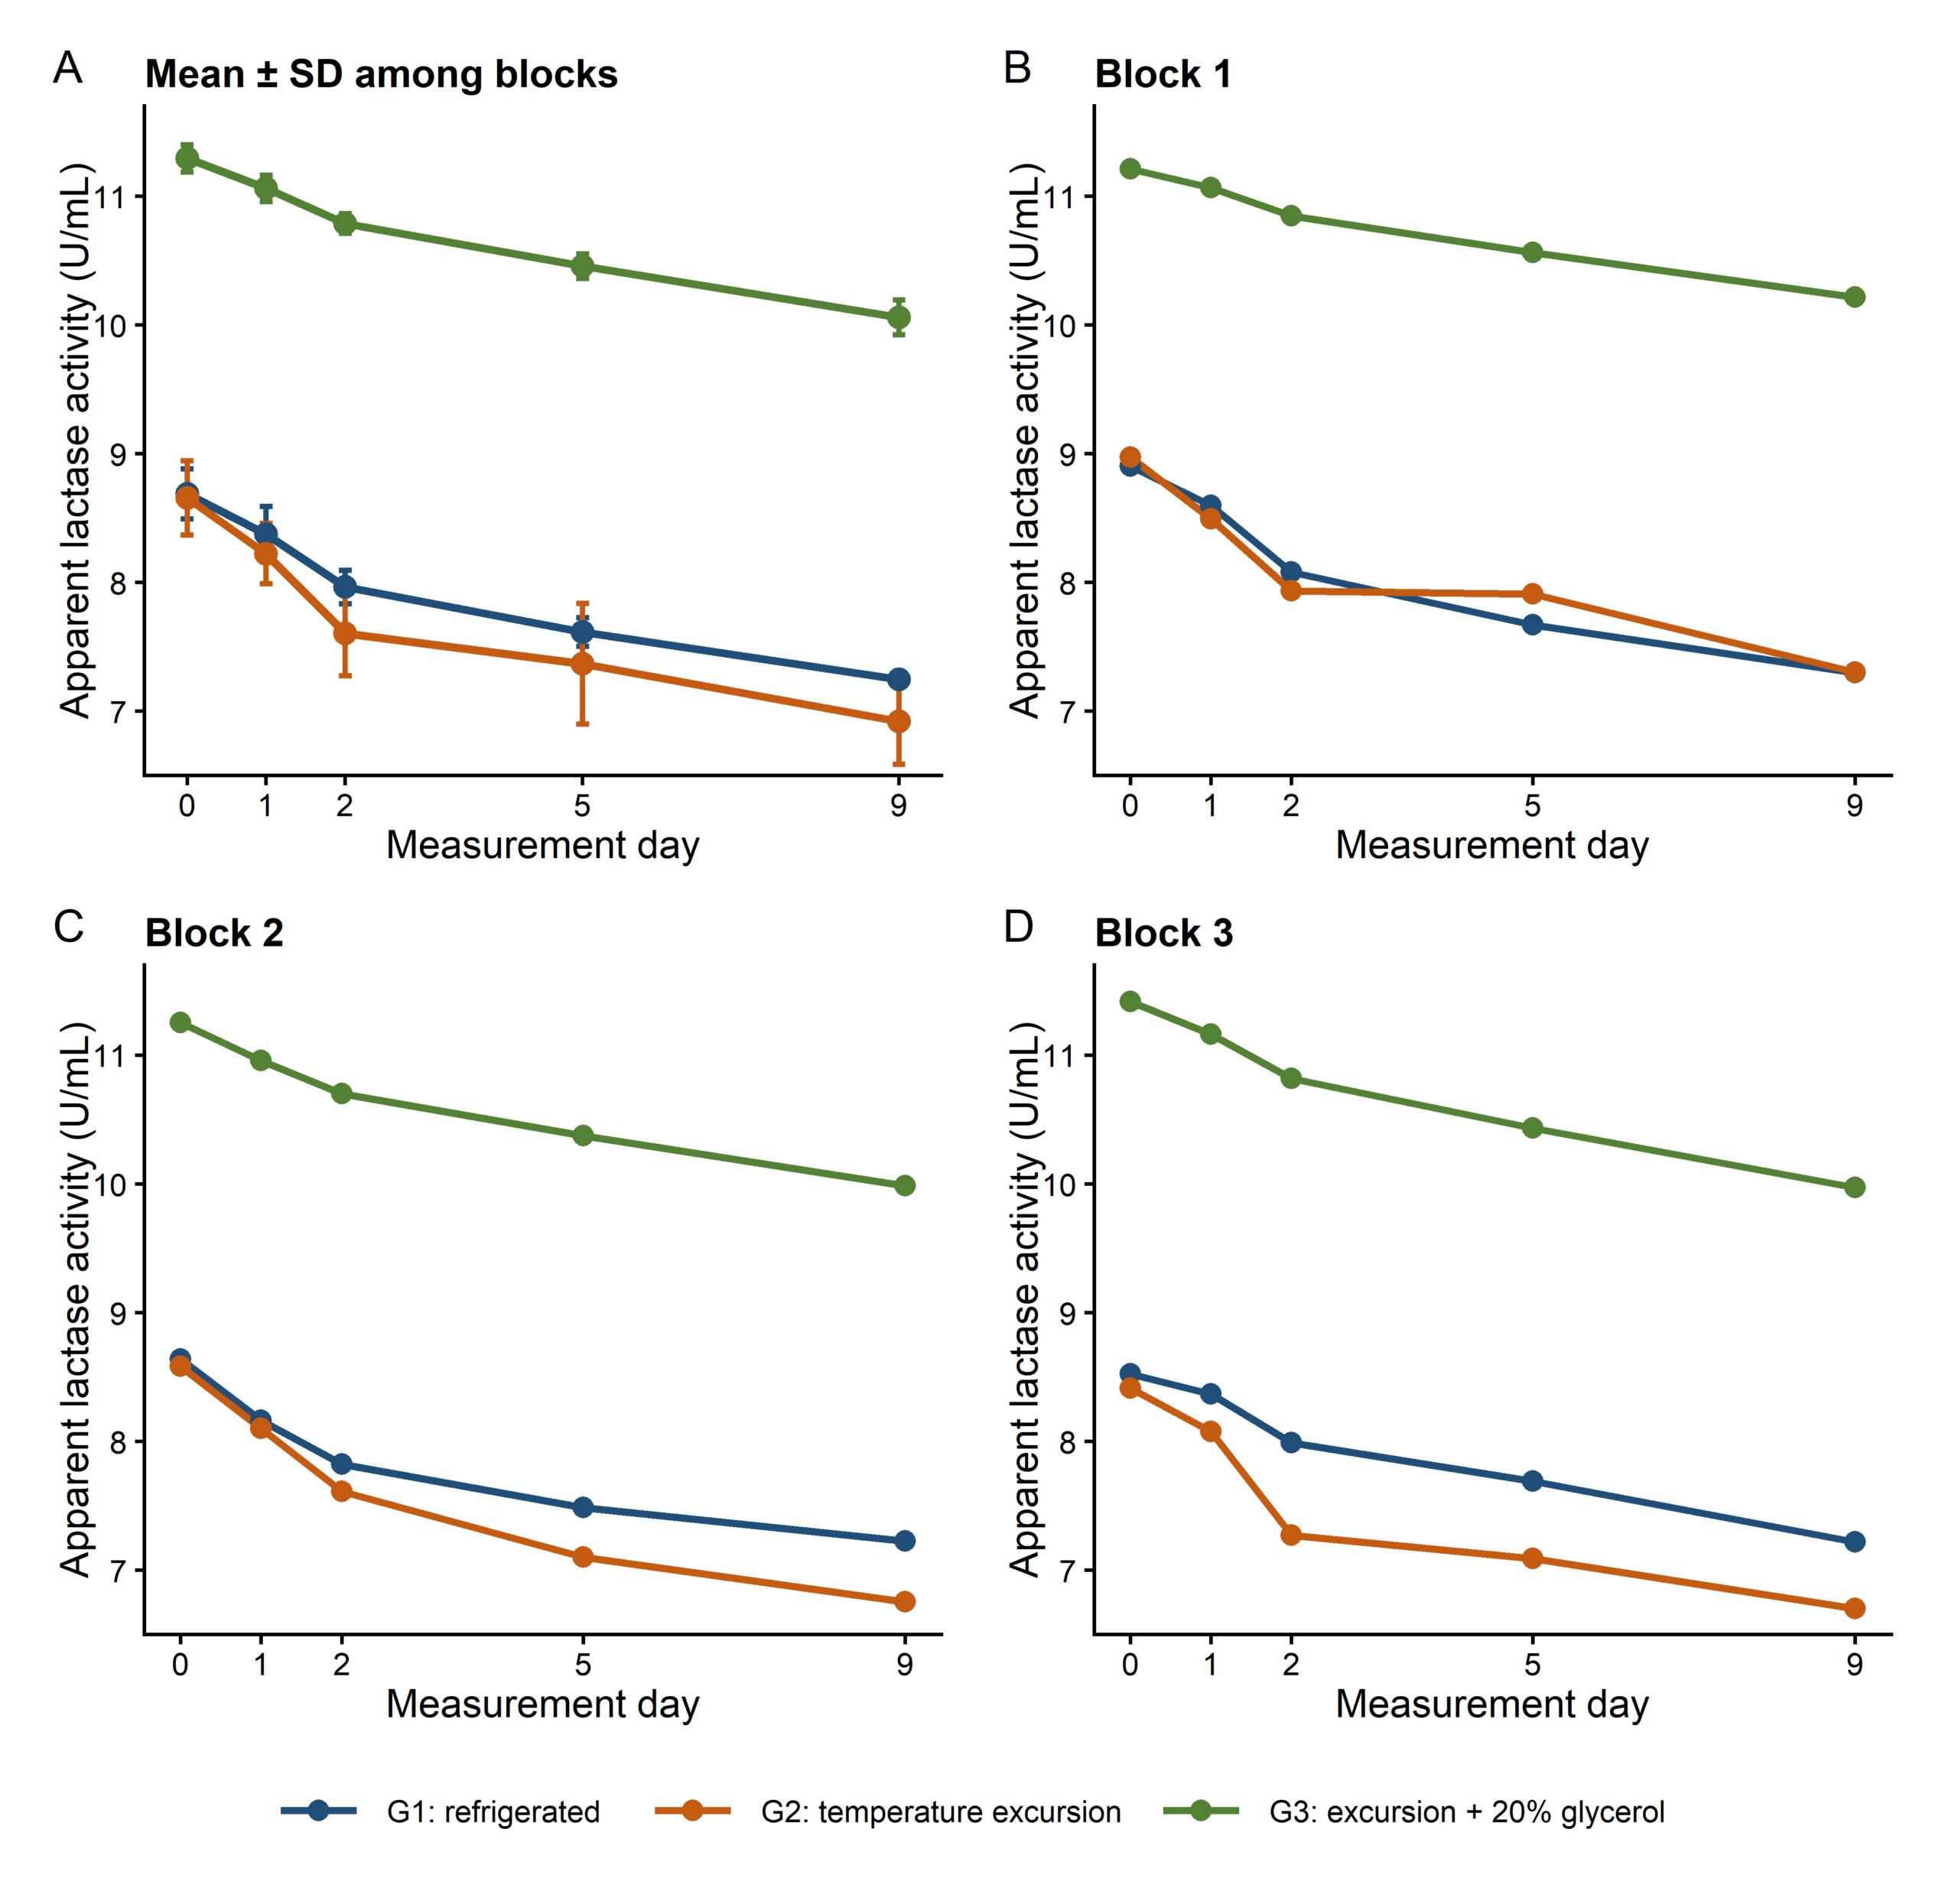
Across the three blocks, mean apparent activity decreased between Day 0 and Day 9 from 8.69 ± 0.19 to 7.25 ± 0.04 U/mL in Group 1, from 8.66 ± 0.29 to 6.92 ± 0.33 U/mL in Group 2, and from 11.29 ± 0.11 to 10.06 ± 0.14 U/mL in Group 3 (Figure 2A). Values are means ± standard deviations among blocks. These changes are equivalent to decreases of 16.6%, 20.1%, and 10.9%, respectively. Group 3 began at a higher activity and remained above the other groups for all measurements. The block-specific trajectories (Figure 2B–D) showed the same overall downward direction, although the separation between Groups 1 and 2 was greater in Blocks 2 and 3 than in Block 1.
The fixed-effects model detected differences related to preparation block (F(2, 28) = 14.22, p = 5.46 × 10⁻⁵), storage condition (F(2, 28) = 1553.22, p = 2.06 × 10⁻²⁹), and measurement day (F(4, 28) = 115.19, p = 5.82 × 10⁻¹⁷). The condition-by-day interaction was not significant (F(8, 28) = 1.55, p = 0.185), providing no evidence that the trend in activity loss differed among conditions. The large condition effect reflects persistent differences in overall activity.
| Model effect | Effect df | Error df | F | p |
|---|---|---|---|---|
| Preparation block | 2 | 28 | 14.22 | 5.46 × 10⁻⁵ |
| Storage condition | 2 | 28 | 1553.22 | 2.06 × 10⁻²⁹ |
| Measurement day | 4 | 28 | 115.19 | 5.82 × 10⁻¹⁷ |
| Storage condition × measurement day | 8 | 28 | 1.55 | 0.185 |
Note: The analysis included 45 block-level observations. Technical trials were averaged within each block–condition–day combination and were not treated as independent replicates.
Across the three independently prepared blocks, model-based contrasts showed that apparent activity declined significantly from Day 0 in all three groups by Days 2 and 9 (Table 3). The estimated Day 9 − Day 0 changes were −1.440 U/mL in Group 1 (95% CI, −1.713 to −1.167 U/mL; Holm-adjusted p = 3.75 × 10⁻¹⁰), −1.737 U/mL in Group 2 (95% CI, −2.009 to −1.464 U/mL; adjusted p = 4.77 × 10⁻¹²), and −1.236 U/mL in Group 3 (95% CI, −1.509 to −0.964 U/mL; adjusted p = 9.93 × 10⁻⁹). Despite these significant decreases, none of the differences in change between groups remained significant after Holm adjustment. Group 3 declined by 0.545 U/mL less than Group 2 by Day 2 and by 0.501 U/mL less by Day 9, but the corresponding adjusted p values were 0.101 and 0.166. These results agree with the nonsignificant condition-by-day interaction and provide no statistically significant evidence that activity declined differently among the three storage conditions.
The groups also differed at the beginning of the experiment. At Day 0, Groups 1 and 2 did not differ significantly (estimated G2 − G1 difference, −0.032 U/mL; 95% CI, −0.305 to 0.240 U/mL; Holm-adjusted p = 0.810). In contrast, Group 3 exceeded Group 1 by 2.606 U/mL (95% CI, 2.333–2.878 U/mL; adjusted p < 0.001) and Group 2 by 2.638 U/mL (95% CI, 2.366–2.911 U/mL; adjusted p < 0.001). Therefore, Group 3’s higher absolute activity was already present before storage and should not be directly interpreted as evidence of better activity retention.
| Comparison | Estimate (U/mL) | 95% CI (U/mL) | t | Raw p | Holm-adjusted p |
| G1: Day 2 − Day 0 | −0.724 | −0.997 to −0.452 | −5.445 | 8.23 × 10⁻⁶ | 1.40 × 10⁻⁴ |
| G1: Day 9 − Day 0 | −1.440 | −1.713 to −1.167 | −10.824 | 1.63 × 10⁻¹¹ | 3.75 × 10⁻¹⁰ |
| G2: Day 2 − Day 0 | −1.051 | −1.323 to −0.778 | −7.897 | 1.33 × 10⁻⁸ | 2.53 × 10⁻⁷ |
| G2: Day 9 − Day 0 | −1.737 | −2.009 to −1.464 | −13.056 | 1.99 × 10⁻¹³ | 4.77 × 10⁻¹² |
| G3: Day 2 − Day 0 | −0.506 | −0.778 to −0.233 | −3.800 | 7.16 × 10⁻⁴ | 0.011 |
| G3: Day 9 − Day 0 | −1.236 | −1.509 to −0.964 | −9.293 | 4.73 × 10⁻¹⁰ | 9.93 × 10⁻⁹ |
| G2 change − G1 change, Day 2 | −0.326 | −0.712 to 0.059 | −1.734 | 0.094 | 0.918 |
| G2 change − G1 change, Day 9 | −0.297 | −0.682 to 0.088 | −1.578 | 0.126 | 1.000 |
| G3 change − G1 change, Day 2 | 0.219 | −0.167 to 0.604 | 1.163 | 0.255 | 1.000 |
| G3 change − G1 change, Day 9 | 0.204 | −0.182 to 0.589 | 1.082 | 0.288 | 1.000 |
| G3 change − G2 change, Day 2 | 0.545 | 0.160 to 0.930 | 2.897 | 0.007 | 0.101 |
| G3 change − G2 change, Day 9 | 0.501 | 0.115 to 0.886 | 2.661 | 0.013 | 0.166 |
Assay precision and retained trials
The storage analysis included 89 valid kinetic traces across 45 block–condition–day combinations. Forty-four combinations had two valid technical trials; Day 9, Block 2, Group 2 had one. Among combinations with two trials, the median coefficient of variation was 1.42%. The middle half of the values ranged from 0.88% to 1.97%, and the highest was 9.40%. These values describe agreement between repeated trials of the same sample on the same measurement day. Because no unchanged reference enzyme or daily o-nitrophenol standard was measured, variation in the assay from one day to another could not be separated from changes in the stored samples.
Discussion
In all three independent blocks, apparent lactase activity declined in every storage condition throughout nine days. By Day 9, the refrigerated group decreased by 1.440 U/mL, the temperature-excursion group decreased by 1.737 U/mL, and the temperature-excursion group containing glycerol decreased by 1.236 U/mL. These within-group decreases were significant by Days 2 and 9 compared with Day 0, but the condition-by-day interaction was not significant, and no differences in change between groups were deemed significant after Holm adjustment. The quantitative observations of greater activity loss in Group 2 and less loss in Group 3 do not prove either additional harm from the 48-hour excursion or stabilization from glycerol. Since Group 3 already began the experiment with substantially higher activity, its higher overall activity cannot be attributed to storage conditions. Within-run technical repeat variability was modest, with a median coefficient of variation of 1.42%. However, no reference lactase or daily o-nitrophenol standard was measured, so variations between days cannot be separated from true changes in the stored samples. The results show a decline in measured activity over time but do not provide statistically significant evidence that the different conditions induced different preservation effects.
The 48-hour excursion to 23.5 °C did not cause a statistically detectable additional loss of activity compared with continuous refrigeration. Similar activity retention during short periods of warmer storage has been observed in other β-galactosidases. Warmerdam et al. reported that Bacillus circulans β-galactosidase had a half-life of approximately 220 hours in buffer at 25 °C, compared with 13 hours at 40 °C and complete inactivation within two hours at 60 °C23. Gutierrez et al. also found that a fungal β-galactosidase retained 67% relative activity after 24 hours at 35 °C and pH 6.024. These findings show that some β-galactosidases can remain active during relatively short exposure to warm temperatures, although the differences in enzyme source and formulation prevent a direct comparison with the commercial lactase tested here.
Evidence from other protein preparations further shows why temperature-excursion results must be interpreted within their specific conditions. Le Guyader et al. detected no physicochemical destabilization of a 21 mg/mL trastuzumab biosimilar after a 72-hour excursion to 25 °C, although that study assessed an antibody rather than enzyme activity25. More directly, Bosso et al. found that commercial β-galactosidases from Kluyveromyces lactis and Aspergillus oryzae responded differently to temperature, pH, and solution composition17. The activity retention observed in the present experiment is therefore reasonable in the context of previous findings, but it applies only to this commercial A. oryzae lactase preparation and the specific 48-hour excursion tested.
Since Group 3’s higher absolute activity was already established on Day 0 before the temperature excursion, this cannot be assumed to be the result of glycerol’s stabilizing effects. It also cannot merely be explained by an optical matrix effect in the colorimeter, since the o-nitrophenol calibration slopes in plain buffer and the 1.6% glycerol-containing buffer only differed by 0.066%. This would be far too little of a difference to account for the roughly 30% increase in baseline activity. However, an immediate effect of glycerol on the reaction rate is plausible. Li et al. found that adding 2% glycerol to an ONPG assay, using a recombinant β-galactosidase from Marinomonas sp., elevated the activity to 134.85% of the control26. The similar concentration of glycerol, magnitude of activity increase, and the use of ONPG make the finding relevant to the current study, although the different enzyme source prevents it from establishing the cause of the present result. The context of the reaction is also important according to other studies. Hoppe et al. saw increased Kluyveromyces lactis β-galactosidase activity in a choline acetate-glycerol deep eutectic solvent27, whereas Koššuthová et al. found that glycerol stabilized Aspergillus oryzae β-galactosidase structurally but inhibited its overall activity in a transglycosylation system28. Glycerol can alter the measured activity independently of long-term preservation. The enzyme, substrate, concentration, and solution matrix can all affect the magnitude and direction of the measured enzymatic response. Ultimately, Group 3’s elevated baseline value is best treated as a possible glycerol effect on the reaction rather than stabilization.
Although Group 3 showed the smallest decrease in measured activity of the three groups, the statistical analysis did not prove that glycerol meaningfully preserved activity. Earlier β-galactosidase studies have shown this possibility. One proposed mechanism of protein stabilization by glycerol is preferential hydration. In a water-glycerol solution, glycerol is preferentially excluded from much of the protein surface, which leaves the surrounding region enriched in water. Because an unfolded protein exposes more surface area to the solution than a folded one, this exclusion makes the unfolded state less thermodynamically favorable. The balance then shifts toward favoring the folded structure. By limiting unfolding and exposure of hydrophobic regions, glycerol may also reduce the formation of intermediates prone to aggregation13,14. However, these effects depend on the protein and surrounding formulation, and this experiment did not directly measure lactase folding, unfolding, or aggregation.
Previous experiments exemplify glycerol’s varying effects among proteins and formulations. Pinho and Passos reported that a Kluyveromyces lactis solution containing 20% glycerol retained 89% of its activity after two months at 4 °C29. Ambrogi et al. similarly reported that 20% glycerol prolonged the stability of several bifidobacterial β-galactosidases at −20 °C, while the benefit varied among the seven tested enzymes8. The same kind of variability was also found in the study by Ait Braham et al., where glycerol’s effect across 13 immobilized enzymes changed with the preparation methods and defined testing variables. In some cases, glycerol even reduced stability rather than improving it30. More recent works support the idea of effects from the surrounding formulation. Sanchez-Fernandez et al. preserved lysozyme for 40 days at room temperature in a choline chloride-glycerol mixture, with original activity recovered after rehydration31, while Guo et al. found that the storage stability of cellulase and pectinase varied with enzyme origin and solution composition32. Therefore, studies have shown that glycerol can stabilize some enzymes, but those studies do not establish that glycerol stabilized the lactase in this experiment, since the preparations and storage conditions differed. However, the difference between Group 3’s decrease and the decreases in Groups 1 and 2 was not statistically significant.
In both o-nitrophenol calibration series, the absorbance increased linearly with known o-nitrophenol concentration, which supports the consistency of the measurement approach. Additionally, the measured reaction rate in the commercial lactase dilution series also increased approximately in proportion to relative lactase concentration. These tests support the assay’s linear response within the tested ranges. The regressions fitted over the fixed window were also strong. Abels et al. similarly showed that a handheld colorimeter can provide valid quantitative results when its readings are interpreted through an appropriate calibration model33. Repeated trials of the same samples were generally consistent, with a median coefficient of variation of 1.42%, although the maximum of 9.40% indicates that some measurements were less precise. In a collaborative study of colorimetric assay validation for commercial enzyme preparations, Engelen and Randsdorp reported variation of 3.20–8.62% between repeated measurements within laboratories and 8.77–16.35% across laboratories34. Fabris et al. examined the repeatability of same-day measurements and precision between days as separate variables when validating a spectrophotometric α-galactosidase assay35. These findings illustrate why the technical-trial variation measured here accounts for agreement within a measurement day, not the precision between different measurement days. In all three blocks, the Day 0–Day 9 decreases were larger than the typical variation between repeated trials, supporting the overall downward trend. Nevertheless, without a daily control measurement, the entire decrease cannot be attributed confidently to changes in the samples. Smaller differences between days or storage groups should be interpreted through confidence intervals along with statistical tests.
The experimental design limits how strongly the nonsignificant differences among groups can be interpreted. Only three independent blocks were analyzed, which may not have provided enough statistical power to detect small differences among the activity trends. Therefore, the nonsignificant condition-by-day interaction does not establish that the three storage conditions had equivalent effects. The lack of an unchanged daily reference enzyme or daily o-nitrophenol standard also prevented variation in the assay between days from being separated from actual changes in the stored samples. In addition, the experiment tested only one lactase concentration, one glycerol concentration, one 48-hour excursion to 23.5 °C, and one nine-day measurement period under the fixed pH 7 assay condition. The conclusions are therefore limited to the specific conditions tested.
The findings may also not apply to other enzyme preparations, substrates, or sample types. This study used one commercial Aspergillus oryzae lactase powder preparation whose certificate of analysis did not report total protein concentration, β-galactosidase purity, or the composition of inactive material in the powder. Bechtel et al. measured ONPG-specific activities ranging from 2,524 to 8,031 µkat/g protein among five commercial β-galactosidase preparations under the same assay conditions, illustrating the variation that can exist among commercial products36. Enzyme behavior can also depend on its physical form. Ansari and Damanhory found that A. oryzae β-galactosidase immobilized on modified zinc oxide nanoparticles retained more activity under extreme pH and temperature conditions than the soluble enzyme37. Results from the preparation tested here consequently cannot be assumed to represent other commercial or immobilized preparations. The use of ONPG creates another limitation because activity toward this artificial substrate may not equal activity toward lactose. Eberhardt et al. found that the measured activities of five β-galactosidases depended on whether ONPG or lactose was used38. The colorimetric method may also require modification for opaque samples such as milk; Jarrard et al. used isothermal titration calorimetry because conventional ONPG spectrophotometry could not be applied directly to opaque and colored dairy fluids39.
Future studies should include more independent blocks, daily quality-control samples, and multiple glycerol and lactase concentrations. Testing additional excursion temperatures and durations would show whether the present result extends beyond the single 48-hour condition. A separate treatment in which glycerol is added immediately before measurement would also help distinguish an immediate effect on the ONPG reaction from protection produced during storage. These changes would provide a stronger test of glycerol’s effect on lactase stability and allow smaller differences among storage conditions to be evaluated with greater confidence.
Acknowledgments
The author thanks Alfred Navarrete for providing access to and supervision in the school laboratory and Emilia Guy for assistance in ordering the chemicals used in this study.
Supplementary Material
References
- W. Wang. Instability, stabilization, and formulation of liquid protein pharmaceuticals. International Journal of Pharmaceutics. Vol. 185, pg. 129–188, 1999, https://doi.org/10.1016/S0378-5173(99)00152-0. [↩]
- G. Feller. Protein stability and enzyme activity at extreme biological temperatures. Journal of Physics: Condensed Matter. Vol. 22, pg. 323101, 2010, https://doi.org/10.1088/0953-8984/22/32/323101. [↩] [↩] [↩]
- M. Akbarian, S. H. Chen. Instability challenges and stabilization strategies of pharmaceutical proteins. Pharmaceutics. Vol. 14, pg. 2533, 2022, https://doi.org/10.3390/pharmaceutics14112533. [↩] [↩]
- D. M. Mulualem, C. Agbavwe, L. A. Ogilvie, B. V. Jones, M. Kilcoyne, C. O’Byrne, A. Boyd. Metagenomic identification, purification and characterisation of the Bifidobacterium adolescentis BgaC β-galactosidase. Applied Microbiology and Biotechnology. Vol. 105, pg. 1063–1078, 2021, https://doi.org/10.1007/s00253-020-11084-y. [↩]
- Y. Liu, S. Lutz-Wahl, L. Kettner, L. Fischer. A novel β-galactosidase from Kluyvera intermedia and its potential for hydrolyzing lactose in milk. Food Biotechnology. Vol. 38, pg. 215–237, 2024, https://doi.org/10.1080/08905436.2024.2382088. [↩]
- M. Király, B. D. Kiss, P. Horváth, L. Drahos, A. Mirzahosseini, G. Pálfy, I. Antal, K. Ludányi. Investigating thermal stability based on the structural changes of lactase enzyme by several orthogonal methods. Biotechnology Reports. Vol. 30, pg. e00637, 2021, https://doi.org/10.1016/j.btre.2021.e00637. [↩]
- Z. Wang, J. Qi, J. M. Goddard. Concentrated sugar solutions protect lactase from thermal inactivation. International Dairy Journal. Vol. 123, pg. 105168, 2021, https://doi.org/10.1016/j.idairyj.2021.105168. [↩]
- V. Ambrogi, F. Bottacini, J. O’Callaghan, E. Casey, J. van Breen, B. Schoemaker, L. Cao, B. Kuipers, M. O’Connell Motherway, M. Schoterman, D. van Sinderen. Infant-associated bifidobacterial β-galactosidases and their ability to synthesize galacto-oligosaccharides. Frontiers in Microbiology. Vol. 12, pg. 662959, 2021, https://doi.org/10.3389/fmicb.2021.662959. [↩] [↩]
- V. Nolan, A. Collin, C. Rodriguez, M. A. Perillo. Effect of polyethylene glycol-induced molecular crowding on the enzymatic activity and thermal stability of β-galactosidase from Kluyveromyces lactis. Journal of Agricultural and Food Chemistry. Vol. 68, pg. 8875–8882, 2020, https://doi.org/10.1021/acs.jafc.0c02316. [↩]
- Y. Tanaka, A. Kagamiishi, A. Kiuchi, T. Horiuchi. Purification and properties of β-galactosidase from Aspergillus oryzae. The Journal of Biochemistry. Vol. 77, pg. 241–247, 1975, https://doi.org/10.1093/oxfordjournals.jbchem.a130713. [↩] [↩] [↩] [↩]
- S. K. Hassan. Characterization of beta-galactosidase enzyme kinetics and thermodynamics produced from Aspergillus oryzae. Pakistan Journal of Life and Social Sciences. Vol. 22, pg. 573–590, 2024, https://www.pjlss.edu.pk/pdf_files/2024_1/573-590.pdf. [↩] [↩] [↩]
- C. S. Leksmono, C. Manzoni, J. E. Tomkins, W. Lucchesi, G. Cottrell, P. A. Lewis. Measuring lactase enzymatic activity in the teaching lab. Journal of Visualized Experiments. Vol. 138, pg. e54377, 2018, https://doi.org/10.3791/54377. [↩]
- V. Vagenende, M. G. S. Yap, B. L. Trout. Mechanisms of protein stabilization and prevention of protein aggregation by glycerol. Biochemistry. Vol. 48, pg. 11084–11096, 2009, https://doi.org/10.1021/bi900649t. [↩] [↩]
- K. Gekko, S. N. Timasheff. Mechanism of protein stabilization by glycerol: preferential hydration in glycerol-water mixtures. Biochemistry. Vol. 20, pg. 4667–4676, 1981, https://doi.org/10.1021/bi00519a023. [↩] [↩]
- M. Wang, Y. Sheng, H. Cui, A. Li, X. Li, H. Huang. The role of glycerol in preserving proteins needs to be reconsidered. ACS Sustainable Chemistry & Engineering. Vol. 10, pg. 15175–15185, 2022, https://doi.org/10.1021/acssuschemeng.2c04695. [↩]
- F. Fassio, M. S. Facioni, F. Guagnini. Lactose maldigestion, malabsorption, and intolerance: a comprehensive review with a focus on current management and future perspectives. Nutrients. Vol. 10, pg. 1599, 2018, https://doi.org/10.3390/nu10111599. [↩]
- A. Bosso, L. R. I. Morioka, L. F. dos Santos, H. H. Suguimoto. Lactose hydrolysis potential and thermal stability of commercial β-galactosidase in UHT and skimmed milk. Food Science and Technology. Vol. 36, pg. 159–165, 2016, https://doi.org/10.1590/1678-457X.0085. [↩] [↩]
- X. Shi, D. Wu, Y. Xu, X. Yu. Engineering the optimum pH of β-galactosidase from Aspergillus oryzae for efficient hydrolysis of lactose. Journal of Dairy Science. Vol. 105, pg. 4772–4782, 2022, https://doi.org/10.3168/jds.2021-21760. [↩]
- Thermo Fisher Scientific. ONPG (o-nitrophenyl-β-D-galactopyranoside): instructions. https://documents.thermofisher.com/TFS-Assets/LSG/manuals/MAN0011194_ONPG_UG.pdf, 2011. [↩]
- J. H. Miller. Experiments in molecular genetics. Cold Spring Harbor Laboratory, 1972. [↩]
- Vernier Science Education. Colorimeter user manual. https://www.vernier.com/manuals/col-bta/, 2026. [↩] [↩]
- M. D. Olp, K. S. Kalous, B. C. Smith. ICEKAT: an interactive online tool for calculating initial rates from continuous enzyme kinetic traces. BMC Bioinformatics. Vol. 21, pg. 186, 2020, https://doi.org/10.1186/s12859-020-3513-y. [↩]
- A. Warmerdam, R. M. Boom, A. E. M. Janssen. β-Galactosidase stability at high substrate concentrations. SpringerPlus. Vol. 2, pg. 402, 2013, https://doi.org/10.1186/2193-1801-2-402. [↩]
- F. Gutierrez, J. Alcaino, V. Cifuentes, M. Baeza. Identification and characterization of a novel β-galactosidase active at low temperatures from the Antarctic fungus Tetracladium sp., expressed in Saccharomyces cerevisiae. Microbial Cell Factories. Vol. 24, pg. 223, 2025, https://doi.org/10.1186/s12934-025-02850-6 [↩]
- G. Le Guyader, V. Vieillard, M. Paul. Physicochemical stability study of MYL-1401O, a biosimilar of trastuzumab, following a transient temperature excursion. Journal of Oncology Pharmacy Practice. Vol. 27, pg. 847–856, 2021, https://doi.org/10.1177/1078155220940410. [↩]
- D. Li, Z. Wang, Y. Yu, H. Li, W. Luo, B. Chen, G. Niu, H. Ding. Biochemical insights into a novel family 2 glycoside hydrolase with both β-1,3-galactosidase and β-1,4-galactosidase activity from the Arctic. Marine Drugs. Vol. 21, pg. 521, 2023, https://doi.org/10.3390/md21100521. [↩]
- J. Hoppe, R. Drozd, E. Byzia, M. Smiglak. Deep eutectic solvents based on choline cation – physicochemical properties and influence on enzymatic reaction with β-galactosidase. International Journal of Biological Macromolecules. Vol. 136, pg. 296–304, 2019, https://doi.org/10.1016/j.ijbiomac.2019.06.027. [↩]
- A. Koššuthová, M. Antošová, V. Bauerová-Hlinková, J. A. Bauer, M. Polakovič. β-Galactosidase-catalyzed transglycosylation of tyrosol: substrates and deep eutectic solvents affecting activity and stability. Biomolecules. Vol. 15, pg. 801, 2025, https://doi.org/10.3390/biom15060801. [↩]
- J. M. R. Pinho, F. M. L. Passos. Solvent extraction of β-galactosidase from Kluyveromyces lactis yields a stable and highly active enzyme preparation. Journal of Food Biochemistry. Vol. 35, pg. 323–336, 2011, https://doi.org/10.1111/j.1745-4514.2010.00384.x. [↩]
- S. Ait Braham, E. H. Siar, S. Arana-Peña, H. Bavandi, D. Carballares, R. Morellon-Sterling, D. de Andrades, J. F. Kornecki, R. Fernandez-Lafuente. Positive effect of glycerol on the stability of immobilized enzymes: is it a universal fact? Process Biochemistry. Vol. 102, pg. 108–121, 2021, https://doi.org/10.1016/j.procbio.2020.12.015. [↩]
- A. Sanchez-Fernandez, S. Prevost, M. Wahlgren. Deep eutectic solvents for the preservation of concentrated proteins: the case of lysozyme in 1:2 choline chloride:glycerol. Green Chemistry. Vol. 24, pg. 4437–4442, 2022, https://doi.org/10.1039/D1GC04378A. [↩]
- J. Guo, N. Zhao, Y. Zhao, H. Jin, G. Sun, J. Yu, H. Zhang, M. Yu, D. Yang, Z. Liang. Effect of deep eutectic solvents on the activity and stability of cellulases and pectinases. ACS Omega. Vol. 8, pg. 45678–45686, 2023, https://doi.org/10.1021/acsomega.3c06088. [↩]
- K. Abels, E. M. Salvo-Halloran, D. White, M. Ali, N. R. Agarwal, V. Leung, M. Ali, M. Sidawi, A. Capretta, J. D. Brennan, J. Nease, C. D. M. Filipe. Quantitative point-of-care colorimetric assay modeling using a handheld colorimeter. ACS Omega. Vol. 6, pg. 22439–22446, 2021, https://doi.org/10.1021/acsomega.1c03460. [↩]
- A. J. Engelen, P. H. G. Randsdorp. Determination of neutral lactase activity in industrial enzyme preparations by a colorimetric enzymatic method: collaborative study. Journal of AOAC International. Vol. 82, pg. 112–118, 1999, https://doi.org/10.1093/jaoac/82.1.112. [↩]
- E. Fabris, M. Bulfoni, A. Nencioni, E. Nencioni. Intra-laboratory validation of alpha-galactosidase activity measurement in dietary supplements. Molecules. Vol. 26, pg. 1566, 2021, https://doi.org/10.3390/molecules26061566. [↩]
- A. Bechtel, I. Seitl, E. Pross, F. Hetzel, M. Keutgen, L. Fischer. Recombinant production of Paenibacillus wynnii β-galactosidase with Komagataella phaffii. Microbial Cell Factories. Vol. 23, pg. 263, 2024, https://doi.org/10.1186/s12934-024-02544-5. [↩]
- S. A. Ansari, A. A. Damanhory. Biotechnological application of Aspergillus oryzae β-galactosidase immobilized on glutaraldehyde modified zinc oxide nanoparticles. Heliyon. Vol. 9, pg. e13089, 2023, https://doi.org/10.1016/j.heliyon.2023.e13089. [↩]
- M. F. Eberhardt, J. M. Irazoqui, A. F. Amadio. β-Galactosidases from a sequence-based metagenome: cloning, expression, purification and characterization. Microorganisms. Vol. 9, pg. 55, 2021, https://doi.org/10.3390/microorganisms9010055. [↩]
- T. R. Jarrard, E. Brock, L. D. Hansen, J. D. Kenealey. Measuring β-galactosidase activity in opaque dairy solutions under optimum conditions for galactooligosaccharide synthesis by isothermal titration calorimetry. Journal of Dairy Science. Vol. 106, pg. 8312–8320, 2023, https://doi.org/10.3168/jds.2023-23400. [↩]