Abstract
Background/Objective: This study examined whether self-rated physical and mental health were associated with lifetime cannabis and amphetamine use in the 2021–2022 Canadian Student Tobacco, Alcohol and Drugs Survey (CSTADS).
Methods: Survey-weighted logistic regression was fitted in three stages among 55,207 students in grades 7-12, both health measures retained throughout: M1: plus grade; M2: plus demographic, geographic covariates; M3: plus co-occurring substance use. Variance was estimated with 500 bootstrap replicate weights.
Results: At M2, one-category worsening in mental health was associated with 47% higher odds of lifetime cannabis use (OR 1.47, 95% CI 1.42-1.53), attenuating to 1.26 (1.19-1.32) at M3. The equal-step assumption was rejected for both measures and outcomes (all p≤.003). Cannabis odds were 4.33 times higher at Poor than Excellent mental health (3.66-5.12). Physical health was weaker and stable (OR 1.08-1.11). At M2, mental health remained associated with amphetamine use (OR 1.20, 1.09-1.32) while physical health did not (OR 1.14, 0.97-1.33). Amphetamine associations attenuated to the null at M3 (mental health OR 1.00, 0.92-1.10). The physical health-cannabis association was present among girls (OR 1.27, 1.17-1.37) but not boys (OR 0.99, 0.91-1.08).
Conclusions: Estimates are associations given the cross-sectional design. Self-rated mental health is associated with both outcomes under primary adjustment (M2), but the amphetamine association is fully shared with co-occurring substance use whereas cannabis association is partly shared.
Keywords: adolescent substance use; self-rated health; cannabis use; amphetamine use; mental health; physical health; CSTADS
Introduction
Although prior research has established the association between health and wellness and substance use among adolescents, the 2021-2022 CSTADS was the first cycle of this survey series to include self-rated physical and mental health items1,2. Health Canada’s summary report gives a descriptive breakdown of past-12-month substance use by self-rated health, but does not model the confounding variables or test whether the two health domains interact. The present study addresses each of these gaps.
Canadian federal data show past-12-month use of cannabis and amphetamines among youth. Health Canada’s Canadian Student Tobacco, Alcohol and Drugs Survey (CSTADS, 2021-2022) shows that 7% of respondents in grades 7 to 12 reported using one or more illegal drugs. 18% reported cannabis use and 0.9% reported amphetamine use2. A decade of trend data from the same survey series shows the substantially shifting cannabis use patterns among Canadian adolescents following legalization3. Subsequent policy changes have also been associated with youth cannabis use. Recreational legalization was associated with a 69% increase in cannabis initiation among adolescents 15-184. A separate CSTADS analysis of 106,032 adolescents similarly found a measurable increase in cannabis use following the 2019 legalization of edibles and extracts5.
Adolescent substance use is linked with broader patterns of mental health and physical health. Prior research has shown connections between cannabis use and later mental health outcomes such as depression, suicidality, and psychological risks6,7. Canadian research has also found similar relationships. Butler et al. found that mental health problems were consistently associated with youth cannabis use across Canadian cross-sectional and longitudinal research8.
However, this literature is not entirely consistent in what they establish. The meta-analytic evidence that links cannabis to later depression, anxiety, and suicidality is prospective, and it concerns outcomes that follow use6. The Canadian evidence compares mental-health indicators with concurrent cannabis use in largely cross-sectional designs8. These are different and distinct claims, and only the former speaks to temporal ordering.
Prior research on adolescents near a tribal reservation in the U.S. Great Plains supports the forward direction specifically. Each five-point increase in anxiety symptoms was associated with 1.29 times the odds of cannabis use initiation in the following semester. Each five-point increase in depressive symptoms was associated with 1.34 times the odds9.
Outside of cannabis use, amphetamine use among adolescents was shown to have important health relevance. McKetin et al.’s systematic review and meta-analysis found that amphetamine use was associated with several mental health outcomes, including psychosis, depression, and suicidality10. Guerin et al. similarly reviewed health, cognitive, and functional outcomes among young people who use methamphetamine11.
Adolescent stimulant use is also characterized by a high degree of polysubstance use, with stimulant misuse frequently co-occurring with alcohol and cannabis use12. National surveillance data show the non-trivial pattern of nonmedical prescription stimulant use among US secondary students13. This co-occurrence is significant because it implies that any observed association between self-rated health and amphetamine use may have additional factors or explanations rather than by health perception itself.
Physical health is also shown to be strongly associated with adolescent substance use. Longitudinal research links physical inactivity in adolescence with higher risks of alcohol and illicit drug problems. In a Finnish population-based twin study, persistently inactive adolescents had 3.7 times the odds of illicit drug use in early adulthood compared to persistently active peers, which may reflect broader behavioral risk patterns14. Other research has found that physical inactivity, sedentary behavior, and substance use are interconnected rather than isolated occurrences15. More recent Canadian evidence from 24,274 secondary-school students links adherence to physical activity, sleep, screen-time, and substance-use recommendations with subsequent depressive and anxiety symptoms. This indicates how physical and mental health domains are behaviorally entangled in this age group16. This literature supports the inclusion of self-rated physical health as a predictor in the present study, especially because poorer self-rated physical health may reflect broader patterns of lifestyle, functioning, and risk behavior.
The central feature of this research is its focus on self-rated health. Self-rated health is valuable and provides a unique approach because it captures adolescents’ own perceptions of their physical and mental condition, rather than relying on external or clinical measures. Research has described adolescent self-rated health as a multifactorial construct shaped by physical, psychological, behavioral, and social factors17,18. Smaller school-based studies report that self-rated health co-occurs with higher adolescent alcohol and tobacco use19. Self-rated health has also been shown to decline as health-risk behaviors accumulate in adolescence20. The five-point scale remains a routine population indicator in school-based surveys21. Canadian studies linked behavioral factors to self-rated physical and mental health in this age group22.
Significance and Purpose. This study makes three contributions. First, no prior analysis of the CSTADS self-rated health items using the survey’s bootstrap replicate weight was identified. Second, it separates associations that survive full covariate adjustment from those that do not: the cannabis association persists while the amphetamine-mental health association survives demographic adjustment but not the addition of co-occurring substance use. This is a distinction Health Canada’s descriptive report does not test. Third, the physical-by-mental health interaction for amphetamine use is also not present in existing reports on this survey.
Four hypotheses were specified. H1: poorer self-rated physical and mental health would be associated with higher odds of lifetime cannabis and amphetamine use in minimally adjusted models. H2a: these associations would attenuate as demographic and geographic covariates were added. The magnitude of attenuation would indicate how much of each association is attributable to confounding. H2b: associations would attenuate further after adjusting for co-occurring tobacco, alcohol, and vaping use. These behaviors may reflect variance shared with co-occurring substance use, not confounding. H3: self-rated physical and mental health would interact, such that their joint associations with substance use depart from the product of their separate associations.
Theoretical Framework
This study draws on a cumulative-vulnerability risk perspective23. It is consistent with the problem behavior theory and posits that risk factors compound. Therefore, adolescents burdened across multiple different health risks and demographic burdens face disproportional risk relative to either domain. Simultaneous health risk behaviors were seen to interrelate20. H3 captures all of this by predicting that a joint burden of both physical and mental health may predict substance use beyond either one alone.
Scope and Limitations
This study is limited to the 2021-2022 CSTADS sample of students in grades 7-12 and to lifetime cannabis and amphetamine use as outcomes. Biological sex, socioeconomic status, and age are unavailable in the PUMF. The cross-sectional design permits association but not causal or temporal inference.
Methods
Research Design
This study used a cross-sectional secondary analysis design to examine associations between self-rated health and lifetime substance-use outcomes. As the design is cross-sectional, all estimates are interpreted as associations and no temporal or causal ordering is implied.
Participants or Sample
To examine this relationship, this study draws on data from the 2021–2022 Canadian Student Tobacco, Alcohol and Drugs Survey Public Use Microdata File1. The present analysis used the following variables to analyze the association: self-rated physical health, self-rated mental health, lifetime cannabis use, lifetime amphetamine use, and grade level, together with a prespecified set of covariates, comprising gender identity, sexual orientation, racial/ethnic self-description, province, school urban/rural location, and ever use of tobacco, alcohol, and vaping products.
Data Collection
CSTADS is a classroom-administered national survey with schools sampled across 9 of the 10 Canadian provinces (territories and on-reserves, special-needs, and military base schools excluded). New Brunswick did not participate in this cycle. Students completed the questionnaire in class after parental/guardian permission was obtained per school board policy. Participation was voluntary, and the protocol was reviewed by relevant ethics committees24.
In participation, 109 of 204 school boards approached agreed to participate (53%), 280 of 509 eligible schools participated (55%), and 62,104 of 93,786 eligible students participated (66.2%). 61,096 were retained in the final dataset. About 92% of students participated under passive parental permission and 8% under active permission.
Variables and Measurements
Self-rated physical health (GH_010) and self-rated mental health (GH_020) were each measured using a five-point scale: “Excellent” (1), “Very Good” (2), “Good” (3), “Fair” (4), “Poor” (5). Respondents who selected “I do not know” were excluded from the analysis. Substance use outcomes were determined as binary indicators reflecting ever use of cannabis (CAN_010) and amphetamine (MET_010). Lifetime cannabis use was coded as 1 for respondents reporting ever use and 0 for respondents reporting never use. Lifetime amphetamine use was coded as 1 for respondents reporting use in the past 12 months or use more than 12 months ago, and 0 for respondents reporting never use. Grade level (GRADE) was reported from Grade 7 to Grade 12. Grade level was imputed by Health Canada during data cleaning when it was inconsistent with the grades offered at the respondent’s school, using the median grade of the student’s class or, where that was unavailable, the student’s age. No record was excluded from this analytic sample for missing grade.
In the present analysis, both self-rated health items are retained throughout in their original ordering (Excellent =1 through Poor =5).
Additional covariates were drawn from this demographic information supplied within the PUMF. Gender identity (DVGENDER), sexual orientation (DVORIENT), racial/ethnic self-description (DVDESCRIBE), province (PROVID), and school urban/rural location (DVURBAN).
Gender identity and sexual orientation were retained as covariates because evidence documents substantially elevated use among gender-minority secondary-school students25.
Racial and ethnic self-description was similarly retained, as prior analyses of this same survey report differing substance-use prevalence across different subgroups26.
In the Atlantic provinces (Newfoundland and Labrador, Prince Edward Island, Nova Scotia), ethnic categories other than White were collapsed by Health Canada into a single “Another race/Multiple” category for disclosure control.
Co-occurring substance use comprised ever smoking a cigarette (SS_010), ever drinking alcohol (ALC_010), and any reported use of vaping products (ELC_026a through ELC_026c). Vaping has become so common among Canadian adolescents that it was included as a co-occurring substance-use covariate for this reason27,28.
Ever smoking a cigarette (SS_010) was subject to Health Canada’s core smoking imputation algorithms, applied before skip-pattern coding.
Missing and “I do not know” responses were treated differently depending on the variable. For the two health measures, the two substance use outcomes, and grade, these responses were dropped. For the demographic, geographic, and co-occurring substance-use covariates, however, these responses were kept as their own category rather than dropped. This way, the sample sizes stay the same across every regression model.
Three specific variables were not available in the CSTADS PUMF, which were biological sex, socioeconomic status, and age. These variables were removed by Health Canada during PUMF preparation to protect against re-identification24. Gender identity is therefore used in place of biological sex, and provinces together with urban/rural location serves as coarse geographic proxies for socioeconomic context. Grade level substitutes for age. This substitution is imperfect and residual confounding cannot be excluded. This limitation is addressed again in the discussion.
Procedure
The 2021–22 CSTADS surveyed 61,096 students in grades 7-12 between September 2021 and June 2022. Respondents were excluded sequentially for missing or selecting “I do not know” responses on self-rated physical health (n = 2,498), self-rated mental health (n = 2,301), lifetime cannabis use (n = 425), lifetime amphetamine use (n = 665), and grade level (n = 0). The final analytic sample comprised 55,207 students.
A further 806 respondents were retained in this analytic sample but could not be classified on the cannabis frequency item (CAN_020), having selected “I do not know” (n = 579) or not stating a response (n = 227). These responses contribute to all primary models but are excluded from the two alternative cannabis outcome definitions (past-12-month and weekly-or-more use). They are therefore based on n=54,401. The past-12-month amphetamine outcome is derived from MET_010 and retains the full analytic sample of n=55,207.
Data Analysis
The present analysis applied CSTADS PUMF sampling weight (WTPUMF) for point estimation24. Variance estimation was performed using the full set of 500 CSTADS bootstrap replicate weights (bsw1 through bsw500) supplied as a companion file to the PUMF. The CSTADS bootstrap weights are mean bootstrap weights, each formed by averaging twelve underlying replicates. The user guide specifies the corresponding variance estimator as v(θ) = (R / (B − 1)) Σ (θb − θ̄)² with R = 12 and B = 50024. Equivalently, software without native mean-bootstrap support may use Fay’s modified balanced repeated replication with a Fay coefficient of 0.7113. This replicate-weight approach follows standard resampling methodology for complex surveys29.
Analyses were conducted in R 4.6.0 (2026-04-24) using the survey package v4.530. The design was declared with svrepdesign() using WTPUMF as the sampling weight, bsw1-bsw500 as combined replicate weights, type = “other”, scale = 12/499, rscales = 1 for all 500 replicates, and mse = FALSE so that replicates are compared with their mean rather than the full-sample estimate, as the user guide specifies24. This yields 499 degrees of freedom. Confidence intervals for the focal regression coefficients were constructed using a t critical value based on 499 replicate degrees of freedom. Model coefficient p-values were obtained from the model-specific tests returned by the survey package, which uses model-specific residual degrees of freedom obtained by subtracting the number of estimated parameters from the 499 design degrees of freedom. Both quantities are therefore design-based. The full R code is provided as Supplementary File S1.
The CSTADS user guide recommends adjusting the weights for item non-response separately from total non-response. The adjustment ratio for the present analytic sample is 1.101. Because this ratio is applied as a constant multiplier, it cancels in the proportions and odds ratios reported here. Item non-response was, however, differential by grade (12.8% of grade 7 respondents excluded versus 7.2% of grade 12 respondents). Re-estimating prevalence with grade-specific non-response adjustment changed the cannabis estimate from 22.2% to 22.0% and left the amphetamine estimate unchanged at 1.5%. This confirms that differential item non-response by grade does not materially affect the estimates. Nonetheless, the analytic sample slightly under-represents younger adolescents relative to the full PUMF.
Models were fitted in three prespecified stages for each outcome. All three models include self-rated physical and mental health. Model 1 includes grade level. Model 2 adds the demographic and geographic covariates. Model 3 additionally includes use of tobacco, alcohol, and vaping products ever. The staging reflects an explicit causal rationale rather than mechanical covariate addition. Grade, gender, sexual orientation, race/ethnicity, and geography plausibly precede both self-rated health and substance use, and are treated as confounders. However, tobacco, alcohol, and vaping are not treated in the same way. Because co-occurrence of these behaviors with cannabis and amphetamine use is present, they may be consequences of the same underlying vulnerability that produces poor self-rated health. Therefore, adjusting for them risks conditioning on a mediator or on a descendant of shared unmeasured vulnerability. Thus, Model 2 is designated the primary adjusted specification, and Model 3 is interpreted as an assessment of how much of each association is shared with co-occurring substance use rather than as an estimate of a direct effect. Figure 1 shows the assumed causal structure underlying this staging.
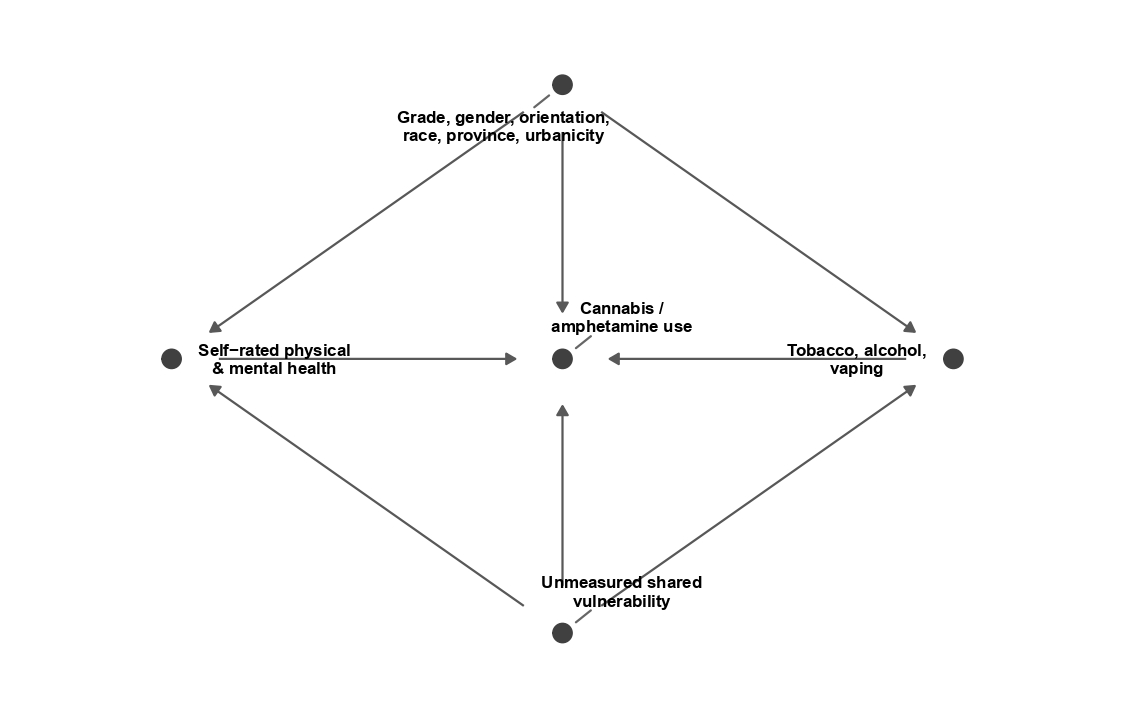
Figure 1 shows how grade, gender, orientation, race, province, and urbanicity precede both exposure and outcome. Five additional analyses were checked. First, whether each step of worsening self-rated health mattered equally. This was done by comparing the linear model to a version using separate categories (Wald test). Then the categorical specification was also refitted at Model 2. Third, whether physical and mental health had an interactive relationship, in addition to the additive models. Fourth, since the “ever used” category mixes one-time experimenters with regular users, the model was rerun on two stricter outcomes: past-12-month cannabis use and weekly-or-more cannabis use, plus past-12-month amphetamine use. Last, all models were run separately by gender and by grade band (7-9 vs. 10-12).
Model discrimination was analyzed with ROC curves and area under the curve (AUC). The confidence intervals were obtained from the replicate weights. Discrimination shows how much self-rated health is associated with substance-use status, not a prediction tool. Calibration was assessed by comparing weighted predicted and observed prevalence across deciles of predicted risk. Multicollinearity was assessed using variance inflation factors computed from the unweighted model matrix, reported per estimated coefficient rather than as generalised VIFs per factor.
AUC confidence intervals were obtained by recomputing the weighted AUC under each of the 500 replicate weights while holding the fitted model from the full sample fixed.
Ethical Considerations
No new primary data were collected for this study. All data were drawn from Health Canada’s 2021-2022 CSTADS Public Use Microdata File. Because the analysis used publicly available de-identified data, no separate institutional ethics approval was obtained for this secondary analysis.
Results
Sample Characteristics
| n | Wtd % | |
| Gender identity | ||
| Girl / woman | 24,590 | 43.1 |
| Boy / man | 26,439 | 47.3 |
| Another gender or not stated | 4,178 | 9.6 |
| Sexual orientation | ||
| Straight / heterosexual | 40,771 | 71.7 |
| Another sexual orientation | 5,833 | 10.5 |
| Not stated | 8,603 | 17.8 |
| Race / ethnicity | ||
| White | 37,038 | 58.2 |
| All other categories combined* | 18,169 | 41.8 |
| School location | ||
| Urban | 44,935 | 82.3 |
| Rural | 10,272 | 17.7 |
| Co-occurring substance use (ever) | ||
| Smoked a cigarette | 8,763 | 15.1 |
| Drank alcohol | 25,931 | 48.3 |
| Used a vaping product | 16,427 | 28.6 |
| Outcomes | ||
| Lifetime cannabis use | 11,532 | 22.2 |
| Lifetime amphetamine use | 852 | 1.5 |
*Includes all racial/ethnic self-descriptions other than White and respondents not stating a category. All nine categories were retained as separate levels in the regression models.
Table 1 presents the composition of the analytic sample. Weighted lifetime prevalence was 22.2% (95% CI 19.5-24.9) for cannabis and 1.5% (95% CI 1.2-1.7) for amphetamine.
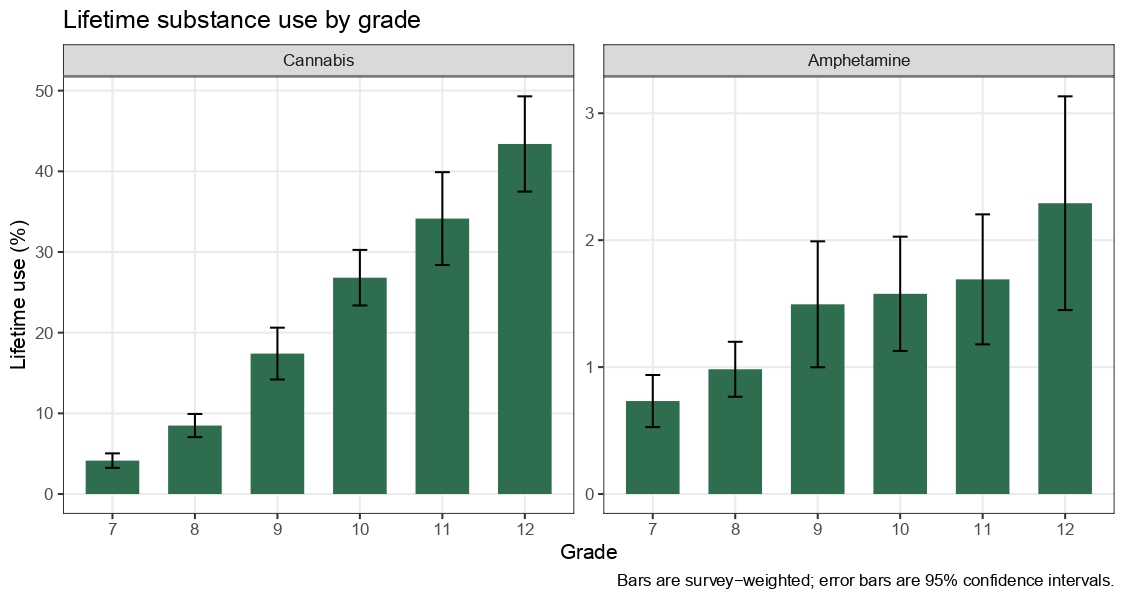
Lifetime use of both substances rose monotonically across grades (Figure 2), but at different scales. Cannabis climbed from under 5% in Grade 7 to over 40% in Grade 12. Amphetamine remained under 3% for all grades. Therefore, the grade gradient is the dominant source of variation for cannabis and minor for amphetamine.
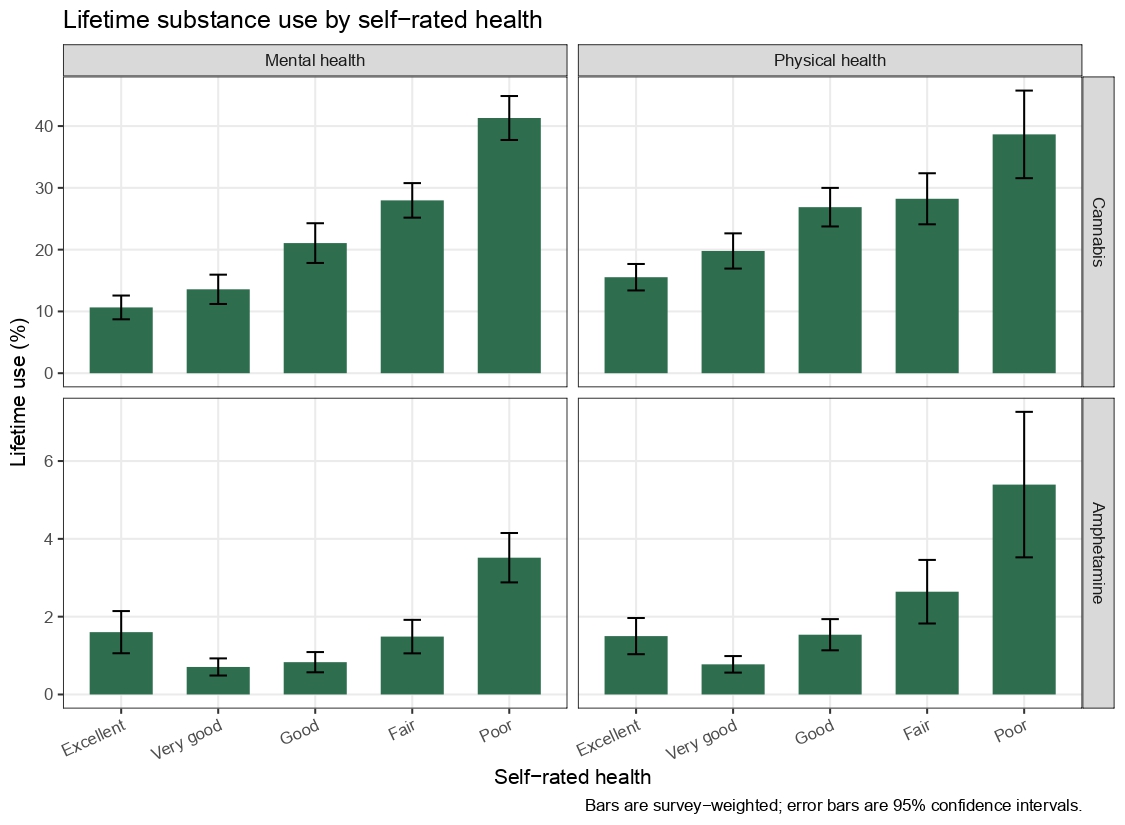
Figure 3 presents the unadjusted association between self-rated health and lifetime ever use of each substance. For cannabis, each panel shows an increasing prevalence of use across the five self-rated health categories, from Excellent to Poor. For amphetamine, for both mental and physical health, prevalence is not lowest at Excellent as a linear gradient would predict. It dips at Very Good and Good, then rises sharply at Fair and Poor. This departure from a linear gradient is visible before any adjustment, and it is the pattern the Wald test below formalizes.
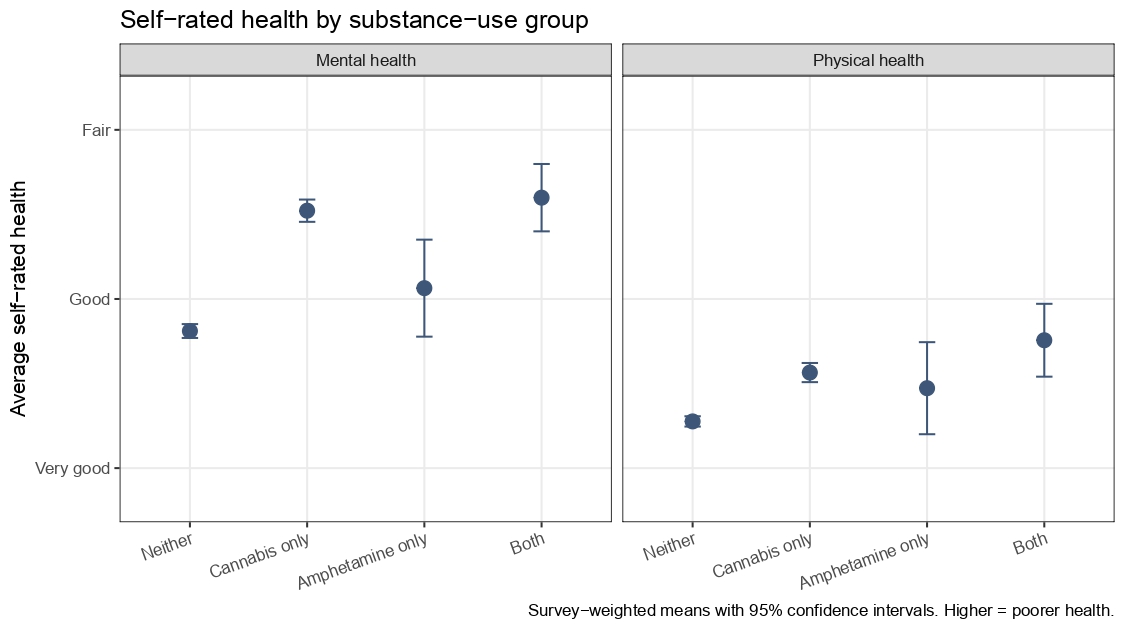
Figure 4 compares average self-rated health across substance-use groups. The separation between groups is substantially wider for mental health than for physical health. Adolescents reporting both substance use had the poorest rating on both domains, which is consistent with the pattern predicted by the cumulative-vulnerability framing.
Logistic Regression Models
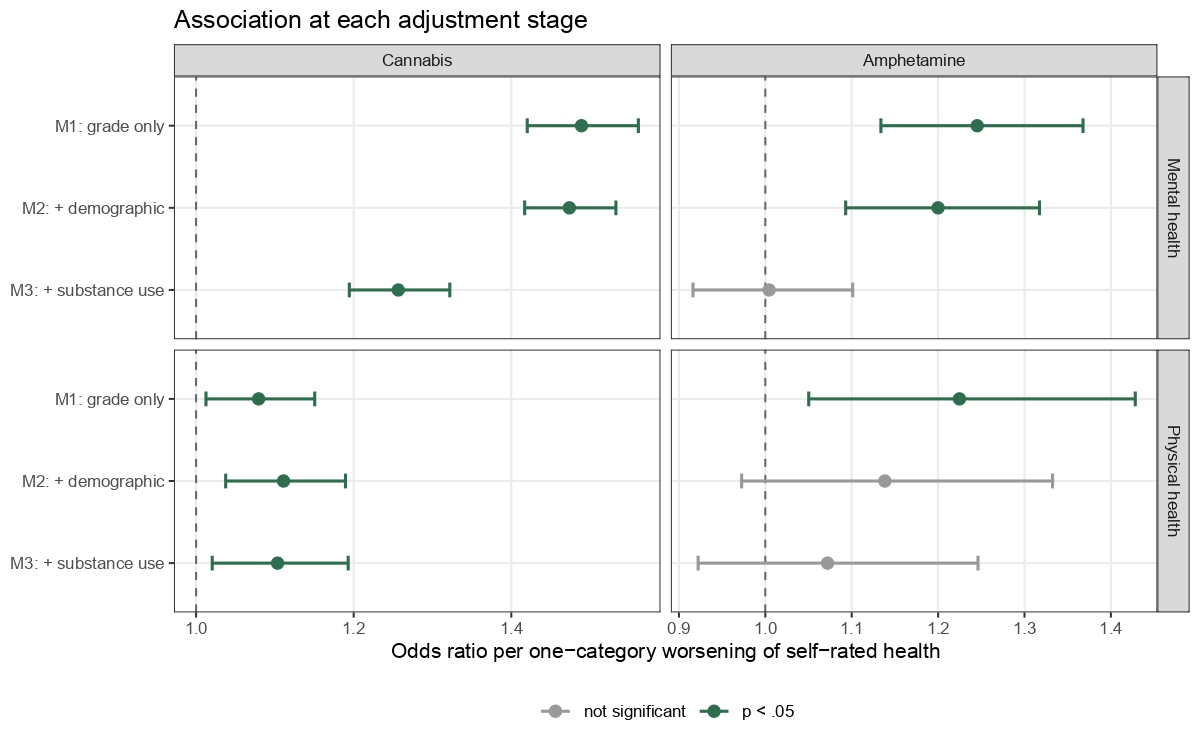
Table 2 summarizes the logistic regression models across the three adjustment stages (Figure 5). Each odds ratio is a per-category average. The equal-step assumption underlying this specification is formally tested and rejected. For cannabis, one category worsening in self-rated mental health was associated with an approximately 49% increase in cannabis use odds with grade adjustment alone (OR 1.49, 95% CI 1.42-1.56, p < .001). One category worsening in self-rated physical health was associated with an approximately 8% increase in cannabis use odds (OR 1.08, 95% CI 1.01-1.15, p = .019). These associations changed little after they were adjusted for demographic and geographic covariates (mental health OR 1.47, 1.42-1.53 p < .001; physical health OR 1.11, 1.04-1.19, p = .003). Mental health remained statistically significant after another addition of co-occurring substance use as a covariate (OR 1.26, 1.19-1.32, p < .001), as did physical health (OR 1.10, 1.02-1.19, p = .014). Therefore, H1 is supported for cannabis for both health measures. H2a is not supported for either measure, as neither association attenuated meaningfully after demographic and geographic covariates were adjusted. H2b is supported for mental health, which attenuated substantially once co-occurring substance use was added. However, physical health remained stable across all three stages.
For amphetamine, a different pattern was shown. With solely grade adjustments, one-category worsening of physical health was associated with 22% higher odds (OR 1.22, 1.05-1.43, p = .010), and one-category worsening in mental health was associated with 25% higher odds, approximately (OR 1.25, 1.13-1.37, p < .001). The physical association with amphetamine was no longer statistically significant after adjusting for demographic and geographic covariates (OR 1.14, 0.97-1.33, p = .106), and the mental health association was no longer statistically significant as co-occurring substance use was added (OR 1.00, 0.92 – 1.10, p = .925). Therefore, H2a is weakly supported for physical health, where the coefficient attenuated by roughly one-third, although the two estimates are not statistically distinguishable. H2b is supported for mental health, which remained significant at M2 but attenuated to the null once co-occurring substance use was added.
| Model | Phys OR | 95% CI | p | Ment OR | 95% CI | p |
| Lifetime cannabis use | ||||||
| Model 1: + grade | 1.08 | 1.01–1.15 | 0.019 | 1.49 | 1.42–1.56 | <.001 |
| Model 2: + demographic | 1.11 | 1.04–1.19 | 0.003 | 1.47 | 1.42–1.53 | <.001 |
| Model 3: + substance use | 1.10 | 1.02–1.19 | 0.014 | 1.26 | 1.19–1.32 | <.001 |
| Lifetime amphetamine use | ||||||
| Model 1: + grade | 1.22 | 1.05–1.43 | 0.010 | 1.25 | 1.13–1.37 | <.001 |
| Model 2: + demographic | 1.14 | 0.97–1.33 | 0.106 | 1.20 | 1.09–1.32 | <.001 |
| Model 3: + substance use | 1.07 | 0.92–1.25 | 0.364 | 1.00 | 0.92–1.10 | 0.925 |
Note. OR = odds ratio; CI = confidence interval. Health variables were interpreted as one-category worsening in self-rated health, so ORs above 1 indicate higher odds of lifetime substance use associated with poorer self-rated health. All models used the CSTADS sampling weight (WTPUMF) for point estimation and the full set of 500 bootstrap replicate weights for variance estimation. Confidence intervals were constructed on the log-odds scale using a t critical value with 499 replicate degrees of freedom. P-values are the coefficient-level tests returned by the survey package, which use model-specific residual degrees of freedom. N = 55,207 for all models.
Testing the Shape of the Health Gradient
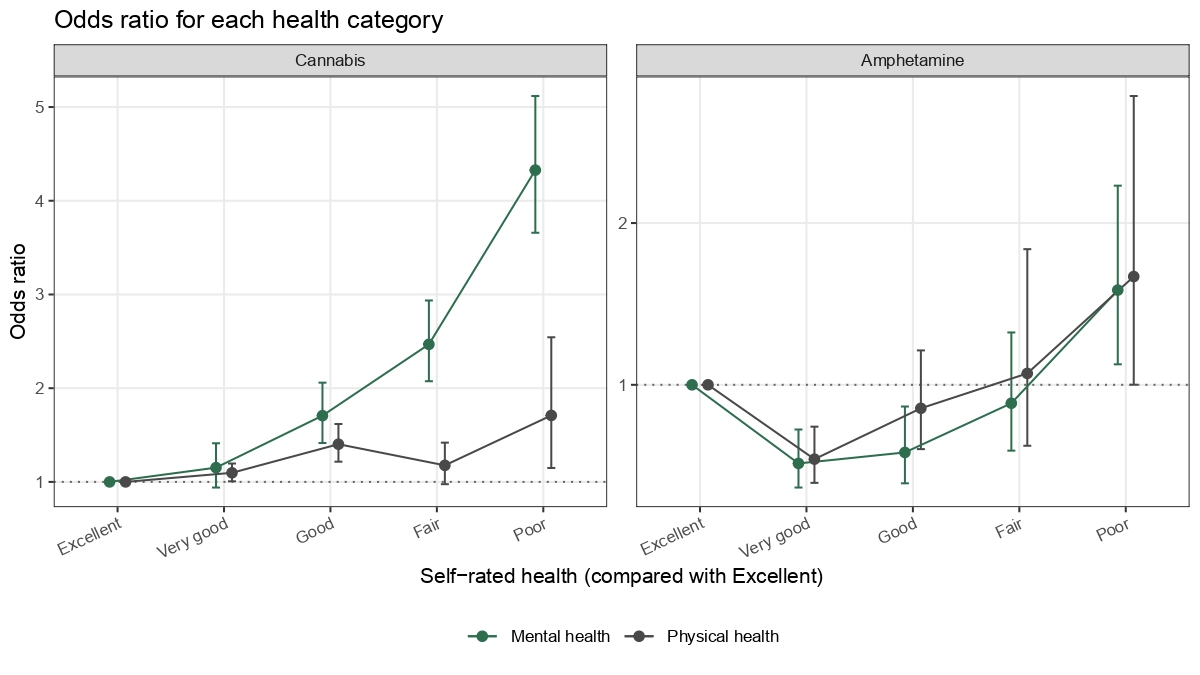
Wald tests comparing the linear and categorical specifications at Model 1 showed that each category change in self-rated health did not carry the same effect. The equal-step assumption was rejected for both health measures and outcomes (cannabis physical health χ² =14.5, p =.003; cannabis, mental health χ² = 23.1, p<.001; amphetamine, physical health χ² = 70.5, p <.001; amphetamine, mental health χ² = 50.2, p < .001; each df = 3). Risk is concentrated in the Fair and Poor categories rather than rising evenly across the scale. The single odds ratio in Table 2 should therefore be read as an average step across the gradient that is steeper at the poor end. The pattern held when Model 2 was refitted with both items entered categorically (Figure 6). For cannabis, the mental health association was monotonic, but the first step was not statistically significant. Relative to Excellent, odds ratios were 1.15 (0.94-1.41, p = .17) at Very good, OR 1.71 (1.41-2.06, p < .001) at Good, 2.47 (2.07-2.94, p < .001) at Fair, and 4.33 (3.66-5.12, p < .001) at Poor. The association is therefore carried by the Good-to-Poor range rather than by an even rise across all five categories. The cannabis physical health gradient was less regular. OR 1.10 (1.01-1.20, p = .036), OR 1.40 (1.22-1.62, p<.001), OR 1.18 (0.98-1.42, p = .088), and OR 1.71 (1.15-2.54, p = .008). For amphetamine, both health measures fell significantly below Excellent at Very good before rising at Poor. Physical health estimates were OR 0.54 (0.39-0.74, p < .001), OR 0.85 (0.60-1.21, p=.38), 1.07 (0.62-1.84, p = .81), and OR 1.67 (1.00-2.79, p = .050). For mental health, the OR was 0.51 (0.36-0.72, p<.001), 0.58 (0.39-0.87, p = .008), 0.89 (0.59-1.32, p =.55), and 1.59 (1.13-2.23, p = .008). The single linear term for amphetamine therefore reflects risks at the poor end of the scale rather than a consistent gradient. The non-monotonic mid-scale pattern should be treated as unstable given only 852 lifetime users.
Interaction Between Physical and Mental Health
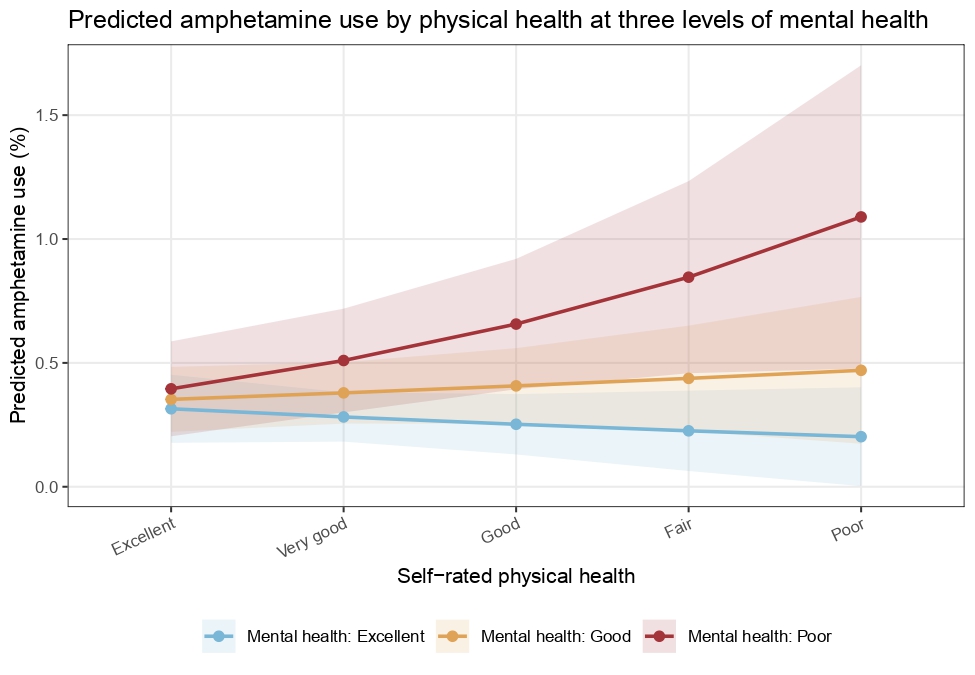
The interaction models were tested to determine whether the association between physical health and substance use varies across levels of mental health. The models were fitted at M2. For cannabis, the interaction was not statistically significant (OR 0.99, 95% CI 0.95 – 1.03, p = .67), providing no evidence that physical health association varies by mental health. For amphetamine, the interaction was statistically significant (OR 1.10, 95% CI 1.01-1.19, p = .027). Poorer physical health was not associated with amphetamine use among adolescents with Excellent mental health (OR 0.89, 95% CI 0.67-1.20). It was weakly associated with good mental health (OR 1.07, 0.90-1.29), and was associated with higher odds among those with poor mental health (OR 1.29, 1.09-1.53). Although physical health alone is not significantly associated with amphetamine use in M2, the interaction with mental health is significant, which indicates that this overall null may mask a positive association for adolescents reporting poor mental health. Therefore, physical health is associated with amphetamine use, mainly when mental health is also poor (Figure 7). H3 is supported for amphetamine but not cannabis.
Alternative Outcome Definitions
For past-12-month cannabis use (n = 54,401), the associations were similar to M2 (physical health OR 1.09, 95% CI 1.02-1.16, p = .013; mental health OR 1.50, 1.44-1.56, p < .001). For weekly-or-more cannabis use (n = 54,401), both associations became stronger (physical health OR 1.27, 95% CI 1.14-1.41, p < .001; mental health OR 1.55, 95% CI 1.44-1.67, p < .001). Therefore, these cannabis findings are not caused by grouping one-time users with regular users.
For past-12-month amphetamine use (n = 55,207), the physical health association remained non-significant (OR 1.05, 95% CI 0.82-1.35, p = .69). However, the mental health association remained significant (OR 1.23, 95% CI 1.07-1.41, p = .004), staying consistent with Model 2.
Analyses by Gender and Grade
All stratified and interaction models in this section were fitted at Model 2. For cannabis, poorer physical health was associated with higher cannabis use odds among girls (OR 1.27, 95% CI 1.17-1.37, p < .001) but no significant association for boys (OR 0.99, 95% CI 0.91-1.08, p = .83). The association between mental health and cannabis use was similar in both groups (girls OR 1.52 95% CI 1.42-1.63, p < .001; boys OR 1.48, 95% CI 1.41-1.55, p < .001). Across grade groups, the mental health association was stronger in grades 7-9 (OR 1.72, 95% CI 1.60-1.85, p < .001) than in grades 10-12 (OR 1.38, 95% CI 1.31-1.44, p < .001). The physical health association was likewise stronger in grades 7-9 (OR 1.19, 95% CI 1.07-1.32, p = .002) than in grades 10-12 (OR 1.07, 95% CI 1.01-1.15, p=.032).
Interaction terms were fitted with both health-by-gender terms in the same model. Constraining one health slope to be common across gender biases the other interaction estimate. For cannabis, the physical health x gender interaction was statistically significant (OR 0.77, 95% CI 0.71-0.83, p < .001). The positive physical health-cannabis association observed among girls was attenuated among boys. The mental health x gender interaction was not statistically significant (OR 0.94, 95% CI 0.87-1.02, p = .149), consistent with the similar stratified estimates in both groups.
The mental health x grade band interaction was statistically significant (OR 1.24, 95% CI 1.14-1.35, p < .001). The physical health x grade band interaction was also statistically significant (OR 1.13, 95% CI 1.01-1.26, p = .027), indicating that the physical health-cannabis association was likewise somewhat stronger among younger adolescents.
For amphetamine, poorer physical health was associated with higher odds among girls (OR 1.51, 95% CI 1.06-2.15, p = .024) but not among boys (OR 1.03, 95% CI 0.82-1.29, p = .81). The mental health association was present in both groups (girls OR 1.31, 95% CI 1.01-1.69, p = .039; boys OR 1.18, 95% CI 1.02-1.37, p = .029). However, when both health-by-gender terms were fitted jointly, neither interaction reached statistical significance (physical health x gender OR 0.69, 95% CI 0.42-1.11, p = .125; mental health x gender OR 0.89, 95% CI 0.65-1.23, p = .488). Given the rare use of amphetamine (852 lifetime users, 1.5% weighted prevalence), the stratified estimates by gender should be interpreted as exploratory. Students in the “another gender or not stated” category (n = 4,178) had a weighted lifetime amphetamine prevalence of 3.2%, approximately 2.5 times that of girls (1.2%) or boys (1.3%). Because this category combines gender-diverse respondents with non-respondents, this difference cannot be attributed to gender identity specifically, but it is consistent with prior Canadian evidence of elevated substance use among identified gender-minority secondary-school students25.
| Model | Lifetime cannabis use | Lifetime amphetamine use |
| Model 1: + grade | 0.760 (0.746-0.775) | 0.643 (0.610-0.675) |
| Model 2: + demographic | 0.805 (0.792-0.817) | 0.733 (0.705-0.761) |
| Model 3: + substance use | 0.944 (0.939-0.949) | 0.845 (0.827-0.864) |
Note. AUC = area under the receiver operating characteristic curve. Estimates use CSTADS survey weights; confidence intervals are from 500 bootstrap replicate weights with the model held fixed at the full-sample fit. N = 55,207 for all models.
At Model 2 which is the primary adjusted specification, discrimination was moderate and well above chance, but below what individual screening would require (Table 3; cannabis AUC 0.805, 95% CI 0.792-0.817; amphetamine 0.733, 0.705-0.761). AUC is higher in Model 3, and this comes from adding co-occurring substance use such as tobacco, alcohol, and vaping as well, not just from self-rated health. No model reported here is proposed as a prediction or screening instrument.
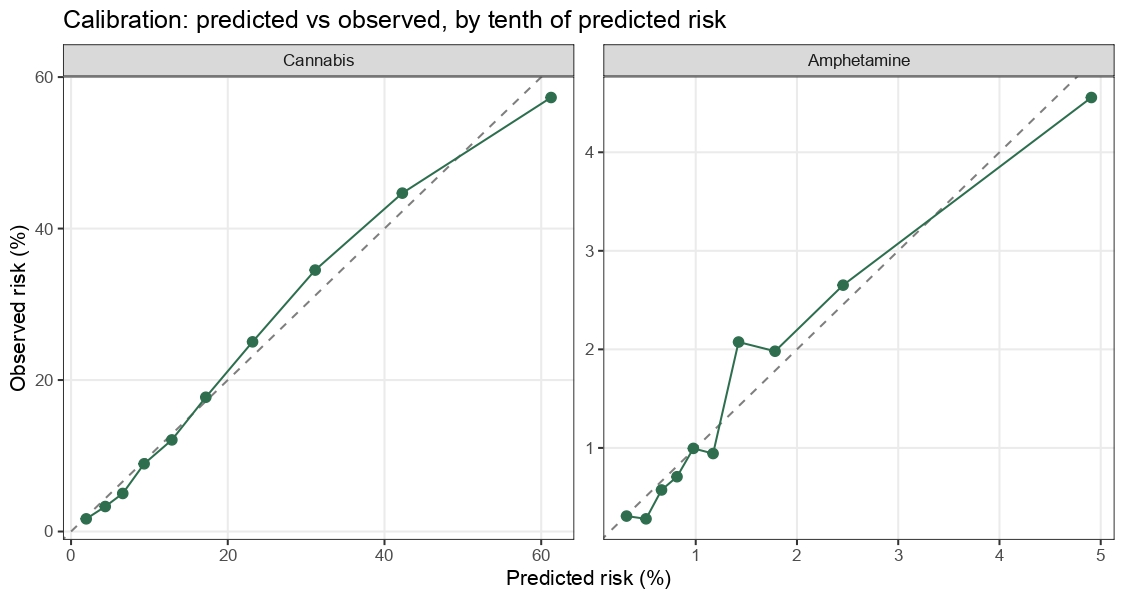
Predicted and observed risk were strongly correlated across risk deciles for both outcomes (Cannabis r = 0.994; Amphetamine r = 0.977) (Figure 8). The Archer-Lemeshow F-adjusted mean residual test however indicated the lack of fit for cannabis. F(9,499) = 4.89, p < .001, but not for amphetamine, F(9,499) = 1.30, p = .23. The cannabis decile shows underestimation of risk in the seventh to ninth deciles, reaching 3.4 percentage points, and overestimation in the highest decile by 4.0 points. This is consistent with the rejection of the equal-step assumption reported above. A single linear health term does not capture the steepening of risk at the poor end of the scale. Variance inflation factors were all below 2.4.
Discussion
The central finding of the study is that adolescents’ self-rated mental health is associated with lifetime cannabis use. This association holds after adjusting for demographic and geographic covariates in addition to other substance use. For amphetamine, the two health domains diverged. Under M2, self-rated mental health remained associated with lifetime use (OR 1.20, 1.09-1.32) while self-rated physical health did not (OR 1.14, 0.97-1.33), except among respondents who also reported poor mental health. The mental health association was also fully absorbed once co-occurring substance use entered at M3. While this does not suggest that poorer self-rated mental or physical health can diagnose or predict lifetime substance use, it suggests that adolescents’ self-rated health may reflect patterns that are relevant to cannabis use.
The weakening of the amphetamine association is itself informative. The further attenuation at M3 indicates variance shared with co-occurring substance use. Co-occurring use may act as a confounder, a mediator, or both. Adjusting for grade level alone does not provide sufficient data to claim an independent association.
Mental health was a much stronger correlate of cannabis use than physical health (M2 OR 1.47 vs 1.11), and this gap was held at every adjustment stage. Butler et al. examined the mental health-cannabis association using both longitudinal and cross-sectional Canadian data and reported a consistent positive association across both designs8. Their study did not model self-rated physical health, so the relative ordering of the two health domains observed here is not directly corroborated. Health Canada reports an 18% past-12-month cannabis use in grades 7-12 for this same survey cycle2. The present analysis estimates 22.2% (95% CI 19.5-24.9) for lifetime use, which is expected, given that lifetime use includes adolescents who used earlier. The grade gradient, rising from under 5% in Grade 7 to over 40% in Grade 12, matches the steep secondary-school increase in prior Canadian work31,32.
The difference in amphetamine use behavior is consistent with prior research. Zuckermann et al. document heavy poly-substance clustering among Canadian youth33, and cannabis consumption can take multiple alternative forms among adolescents34. It fits the present finding that the amphetamine-mental health association drops from OR 1.20 at M2 to 1.00 at M3 once tobacco, alcohol, and vaping enter the model. Cannabis retains an OR of 1.26 at M3, meaning it holds up better and less of it is absorbed by co-occurring use. The 2021-22 survey period also overlapped with pandemic disruption, which was perceived by youths to have affected adolescent substance use in Canada, and may limit comparison with earlier estimates35.
This physical-by-mental interaction for amphetamine suggests that risk is concentrated for students with both difficulties. Clinical evidence also shows how adolescents who report using nonmedical stimulants frequently show co-occurring psychiatric symptoms36.
The association between physical health and cannabis use was present for girls but not boys. This is consistent with earlier Canadian school-based evidence where health-related correlates of heavy cannabis use differ by gender, especially with mental health emerging as a correlate among girls, not boys37. In the present data, gender differences were located in physical health, while the mental health association was similar across genders. Gender differences in adolescent self-rated health are documented38.
Self-rated health is already collected in school-based surveys on the same five-point scale21, so it requires no new instrument. The association is large enough to separate groups. At the reference profile (grade at sample mean; girl; heterosexual; White; Ontario; Urban; physical health at Good), predicted lifetime cannabis prevalence rose from 11.2% at Excellent mental health, 12.7% at Very good, 17.7% at Good, 23.7% at Fair, to 35.3% at Poor. These are derived from the categorical Model 2 specification, not the linear one, consistent with the rejection of the equal-step assumption reported above. Most of the separation occurs between Good and Poor. This association was stronger in grades 7-9 than in grades 10-12. Risk is concentrated in the Fair and Poor categories, and this split with fair-or-poor is already reported by Health Canada and captures most of this signal2. The M2 AUC was 0.805 for cannabis and 0.733 for amphetamine. It is above chance but below what individual screening would require. The models underestimated risk by up to 3.4 percentage points in the seventh to ninth deciles. The cross-sectional design also means that these results cannot support the claim that improving self-rated mental health would reduce later substance use. Also, the amphetamine association is entirely shared with co-occurring substance use, so these data should not direct stimulant-specific prevention.
A few limitations should be considered when interpreting the results of the findings. First, the cross-sectional design of the study limits causal interpretation. The analysis cannot determine whether poorer self-rated health contributed to increased substance use odds or whether the substance use contributed to the poorer self-rated health, and both may have the same causes. Substance use may worsen how adolescents perceive their own health, and a poor self-rated health may lead adolescents to use substances in response. Prospective work reported 29% to 34% increased odds of cannabis-use initiation in the following semester per five-point increase in anxiety and depressive symptoms9. However, this study does not designate the ordering between the two.
Second, all measures are self-reported. Questions that ask about lifetime substance use are subject to recall bias and social desirability bias. Students may be inclined to under-report illegal behavior even in an anonymous survey. These biases may also differ by health status.
Third, some confounding variables may remain, despite the model adjusting for a broad set of covariates. Biological sex, socioeconomic status, and age are not available in the PUMF24. Although substitutes were implemented, they are still imperfect. Family environment and school characteristics are also unavailable. Fourth, the tobacco, alcohol, and vaping variables in Model 3 occur alongside the outcomes. Fifth, substance-use outcomes were mainly binary indicators. Although recent and frequent use were tested and considered, these do not identify severity or dependence. Finally, amphetamine use is rare at 1.5% weighted lifetime prevalence. This limits precision, particularly for the analyses with only gender and grade.
H1 was supported by both substances in minimally adjusted models. H2a was weakly supported only for amphetamine physical health. H2b was supported for cannabis mental health and for amphetamine mental health. H3 was supported for amphetamine but not cannabis. Overall, this study suggests a meaningful association between self-rated health of adolescents and lifetime cannabis use, while showing that the association with amphetamine use, though present under primary adjustment for mental health, is fully shared with co-occurring substance use. Its contribution is not that self-rated health is an independent identifier of lifetime substance use, but rather that self-rated mental health is associated with cannabis use after accounting for demographic characteristics and co-occurring substance use. Future research should use longitudinal analyses to test the order of the association, to see if changes in self-rated health come before changes in substance use, and if being able to identify a group through this association would benefit from targeted prevention. Self-rated health is simple to collect and already exists in school environment surveys. However, whether it can serve as a lever for allocating prevention resources is not established here. What these data do establish is that self-rated mental health is a robust population-level correlate of adolescent cannabis use that persists under primary adjustment, and that this warrants testing before any allocation decision rests on it.
Acknowledgements
This study is based on the 2021–2022 Canadian Student Tobacco, Alcohol and Drugs Survey (CSTADS) Public Use Microdata File, provided by Health Canada. The analysis and conclusions are the author’s own and do not represent the views of Health Canada. This research received no external funding and declares no conflict of interest.
References
- Health Canada. Canadian Student Tobacco, Alcohol and Drugs Survey (CSTADS) 2021–22 Public Use Microdata File. https://open.canada.ca/data/dataset/1f15ca45-8bfd-4f9c-9ec6-2c0c440e69c2/resource/f6761337-47e9-455a-a3c4-ea8516aa634f, 2023. [↩] [↩]
- Health Canada. Summary of results for the Canadian Student Tobacco, Alcohol and Drugs Survey 2021–22. https://www.canada.ca/en/health-canada/services/canadian-student-tobacco-alcohol-drugs-survey/2021-2022-summary.html, 2024. [↩] [↩] [↩] [↩]
- S. Goodman, S. A. Srugo, E. Krzeminska, H. Abramovici. Changes in patterns of use and perceptions of cannabis among students in Canada: a decade of data from the Canadian Student Alcohol and Drugs Survey. Drug and Alcohol Dependence Reports. Vol. 17, pg. 100399, 2025, https://doi.org/10.1016/j.dadr.2025.100399. [↩]
- H. V. Nguyen, S. Mital, S. Bornstein. Short-term effects of recreational cannabis legalization on youth cannabis initiation. Journal of Adolescent Health. Vol. 72, pg. 111–117, 2023, https://doi.org/10.1016/j.jadohealth.2022.09.003. [↩]
- S. Mital, H. V. Nguyen. Legalizing youth-friendly cannabis edibles and extracts and adolescent cannabis use. JAMA Network Open. Vol. 8, pg. e255819, 2025, https://doi.org/10.1001/jamanetworkopen.2025.5819. [↩]
- G. Gobbi, T. Atkin, T. Zytynski, S. Wang, S. Askari, J. Boruff, M. Ware, N. Marmorstein, A. Cipriani, N. Dendukuri, N. Mayo. Association of cannabis use in adolescence and risk of depression, anxiety, and suicidality in young adulthood: a systematic review and meta-analysis. JAMA Psychiatry. Vol. 76, pg. 426–434, 2019, https://doi.org/10.1001/jamapsychiatry.2018.4500. [↩] [↩]
- G. C. Williams, K. A. Patte, M. A. Ferro, S. T. Leatherdale. Associations between longitudinal patterns of substance use and anxiety and depression symptoms among a sample of Canadian secondary school students. International Journal of Environmental Research and Public Health. Vol. 18, pg. 10468, 2021, https://doi.org/10.3390/ijerph181910468. [↩]
- A. Butler, N. King, K. Battista, W. Pickett, K. A. Patte, F. J. Elgar, W. Craig, S. T. Leatherdale. Mental health and cannabis use among Canadian youth: integrated findings from cross-sectional and longitudinal analyses. International Journal of Drug Policy. Vol. 112, pg. 103926, 2023, https://doi.org/10.1016/j.drugpo.2022.103926. [↩] [↩] [↩]
- C. M. Barry, A. Jagtiani, M. D. Livingston, S. Talavera-Brown, H. LaBounty, E. Atkinson, J. R. Skinner, K. A. Komro. Anxiety and depressive symptoms as predictors of substance use initiation among adolescents living on and near a Tribal reservation in the Great Plains region of the U.S. Frontiers in Child and Adolescent Psychiatry. Vol. 3, pg. 1390793, 2024, https://doi.org/10.3389/frcha.2024.1390793. [↩] [↩]
- R. McKetin, J. M. Leung, E. Stockings, Y. Huo, J. Foulds, J. P. Lappin, C. Cumming, S. L. Arunogiri, J. T. Young, G. Sara, M. Farrell, L. Degenhardt. Mental health outcomes associated with the use of amphetamines: a systematic review and meta-analysis. EClinicalMedicine. Vol. 16, pg. 81–97, 2019, https://doi.org/10.1016/j.eclinm.2019.09.014. [↩]
- A. A. Guerin, T. Bridson, H. M. Plapp, G. Bedi. A systematic review and meta-analysis of health, functional, and cognitive outcomes in young people who use methamphetamine. Neuroscience & Biobehavioral Reviews. Vol. 153, pg. 105380, 2023, https://doi.org/10.1016/j.neubiorev.2023.105380. [↩]
- N. J. LaBossier, S. E. Hadland. Stimulant misuse among youth. Current Problems in Pediatric and Adolescent Health Care. Vol. 52, pg. 101265, 2022, https://doi.org/10.1016/j.cppeds.2022.101265. [↩]
- S. E. McCabe, J. E. Schulenberg, T. E. Wilens, T. S. Schepis, V. V. McCabe, P. T. Veliz. Prescription stimulant medical and nonmedical use among US secondary school students, 2005 to 2020. JAMA Network Open. Vol. 6, pg. e238707, 2023, https://doi.org/10.1001/jamanetworkopen.2023.8707. [↩]
- T. Korhonen, U. M. Kujala, R. J. Rose, J. Kaprio. Physical activity in adolescence as a predictor of alcohol and illicit drug use in early adulthood: a longitudinal population-based twin study. Twin Research and Human Genetics. Vol. 12, pg. 261–268, 2009, https://doi.org/10.1375/twin.12.3.261. [↩]
- M. C. Nelson, P. Gordon-Larsen. Physical activity and sedentary behavior patterns are associated with selected adolescent health risk behaviors. Pediatrics. Vol. 117, pg. 1281–1290, 2006, https://doi.org/10.1542/peds.2005-1692. [↩]
- J. Dabravolskaj, P. J. Veugelers, A. Amores, S. T. Leatherdale, K. A. Patte, K. Maximova. The impact of 12 modifiable lifestyle behaviours on depressive and anxiety symptoms in middle adolescence: prospective analyses of the Canadian longitudinal COMPASS study. International Journal of Behavioral Nutrition and Physical Activity. Vol. 20, pg. 45, 2023, https://doi.org/10.1186/s12966-023-01436-y. [↩]
- H. J. Breidablik, E. Meland, S. Lydersen. Self-rated health in adolescence: a multifactorial composite. Scandinavian Journal of Public Health. Vol. 36, pg. 12–20, 2008, https://doi.org/10.1177/1403494807085306. [↩]
- N. E. Fosse, S. A. Haas. Validity and stability of self-reported health among adolescents in a longitudinal, nationally representative survey. Pediatrics. Vol. 123, pg. e496–e501, 2009, https://doi.org/10.1542/peds.2008-1552. [↩]
- J. A. Zafra-Agea, C. García-Salido, E. Ramírez-Baraldes, M. Vilafranca-Cartagena, E. Colillas-Malet, A. Portabella-Serra, D. García-Gutiérrez. Self-perceived health, mood, and substance use among adolescents: an analysis to enhance family, community, and mental health care. Healthcare. Vol. 12, pg. 2304, 2024, https://doi.org/10.3390/healthcare12222304. [↩]
- A. da S. Bandeira, G. F. Del Duca, R. S. Delevatti, S. W. Manta, P. M. Silveira, L. dos S. Leonel, L. F. M. Rezende, K. S. Silva. Association between simultaneity of health-risk behaviours and self-rated health in Brazilian adolescents. PLOS ONE. Vol. 17, pg. e0271503, 2022, https://doi.org/10.1371/journal.pone.0271503. [↩] [↩]
- J. A. Zafra-Agea, M. Vilafranca-Cartagena, D. García-Gutiérrez, E. Ramírez-Baraldes, A. Portabella-Serra, C. García-Salido. Predictive markers and self-perceived health in adolescents: an exploration through a school-based public health survey. Adolescents. Vol. 5, pg. 16, 2025, https://doi.org/10.3390/adolescents5020016. [↩] [↩]
- H. Sampasa-Kanyinga, A. Lien, H. A. Hamilton, J.-P. Chaput. The Canadian 24-hour movement guidelines and self-rated physical and mental health among adolescents. Canadian Journal of Public Health. Vol. 113, pg. 312–321, 2022, https://doi.org/10.17269/s41997-021-00568-7. [↩]
- R. Jessor. Risk behavior in adolescence: a psychosocial framework for understanding and action. Journal of Adolescent Health. Vol. 12, pg. 597–605, 1991, https://doi.org/10.1016/1054-139X(91)90007-K. [↩]
- Health Canada. Canadian Student Tobacco, Alcohol and Drugs Survey 2021–22 Public Use Microdata File (PUMF) user guide. https://open.canada.ca/data/dataset/1f15ca45-8bfd-4f9c-9ec6-2c0c440e69c2/resource/7222b211-dc55-4836-bece-342a4d9718ae, 2024. [↩] [↩] [↩] [↩] [↩] [↩]
- T. Varatharajan, K. A. Patte, M. de Groh, Y. Jiang, S. T. Leatherdale. Exploring differences in substance use behaviours among gender minority and non-gender minority youth: a cross-sectional analysis of the COMPASS study. Health Promotion and Chronic Disease Prevention in Canada. Vol. 44, pg. 179–190, 2024, https://doi.org/10.24095/hpcdp.44.4.04. [↩] [↩]
- C. Sikorski, S. Leatherdale, M. Cooke. Tobacco, alcohol and marijuana use among Indigenous youth attending off-reserve schools in Canada: cross-sectional results from the Canadian Student Tobacco, Alcohol and Drugs Survey. Health Promotion and Chronic Disease Prevention in Canada. Vol. 39, pg. 207–215, 2019, https://doi.org/10.24095/hpcdp.39.6/7.01. [↩]
- A. G. Cole, M. Short, N. Aalaei, M. Gohari, S. T. Leatherdale. Identifying changes in e-cigarette use among a longitudinal sample of Canadian youth e-cigarette users in the COMPASS cohort study, 2017/18–2018/19. Addictive Behaviors Reports. Vol. 16, pg. 100458, 2022, https://doi.org/10.1016/j.abrep.2022.100458. [↩]
- M. Rotermann, H. Gilmour. Correlates of vaping among adolescents in Canada. Health Reports (Statistics Canada, Catalogue no. 82-003-X). Vol. 33, pg. 24–35, 2022, https://doi.org/10.25318/82-003-x202200700003-eng. [↩]
- J. N. K. Rao, C. F. J. Wu, K. Yue. Some recent work on resampling methods for complex surveys. Survey Methodology. Vol. 18, pg. 209–217, 1992, https://www150.statcan.gc.ca/n1/en/pub/12-001-x/1992002/article/14486-eng.pdf. [↩]
- T. Lumley. Analysis of complex survey samples. Journal of Statistical Software. Vol. 9, pg. 1–19, 2004, https://doi.org/10.18637/jss.v009.i08. [↩]
- A. M. Zuckermann, K. Battista, M. de Groh, Y. Jiang, S. T. Leatherdale. Prelegalisation patterns and trends of cannabis use among Canadian youth: results from the COMPASS prospective cohort study. BMJ Open. Vol. 9, pg. e026515, 2019, https://doi.org/10.1136/bmjopen-2018-026515. [↩]
- D. Hammond, E. Wadsworth, J. L. Reid, R. Burkhalter. Prevalence and modes of cannabis use among youth in Canada, England, and the US, 2017 to 2019. Drug and Alcohol Dependence. Vol. 219, pg. 108505, 2021, https://doi.org/10.1016/j.drugalcdep.2020.108505. [↩]
- A. M. E. Zuckermann, G. Williams, K. Battista, M. de Groh, Y. Jiang, S. T. Leatherdale. Trends of poly-substance use among Canadian youth. Addictive Behaviors Reports. Vol. 10, pg. 100189, 2019, https://doi.org/10.1016/j.abrep.2019.100189. [↩]
- A. Doggett, K. Battista, S. T. Leatherdale. Modes of cannabis use among Canadian youth in the COMPASS study; using LCA to examine patterns of smoking, vaping, and eating/drinking cannabis. Drugs: Education, Prevention and Policy. Vol. 28, pg. 156–164, 2021, https://doi.org/10.1080/09687637.2020.1769560. [↩]
- M. Chaiton, J. Dubray, A. Kundu, R. Schwartz. Perceived impact of COVID on smoking, vaping, alcohol and cannabis use among youth and youth adults in Canada. The Canadian Journal of Psychiatry. Vol. 67, pg. 407–409, 2022, https://doi.org/10.1177/07067437211042132. [↩]
- S. K. Vosburg, S. V. Faraone, J. H. Newcorn, A. L. Rostain, R. L. Findling, S. F. Butler, T. D. Govoni, J. L. Green. Prescription stimulant nonmedical use among adolescents evaluated for substance use disorder treatment (CHAT). Journal of Attention Disorders. Vol. 25, pg. 1859–1870, 2021, https://doi.org/10.1177/1087054720943283. [↩]
- A. W. Tu, P. A. Ratner, J. L. Johnson. Gender differences in the correlates of adolescents’ cannabis use. Substance Use & Misuse. Vol. 43, pg. 1438–1463, 2008, https://doi.org/10.1080/10826080802238140. [↩]
- A. Cosma, S. Abdrakhmanova, D. Taut, K. Schrijvers, C. Catunda, C. Schnohr. A focus on adolescent mental health and wellbeing in Europe, central Asia and Canada. Health Behaviour in School-aged Children international report from the 2021/2022 survey. Volume 1. Copenhagen: WHO Regional Office for Europe, 2023, https://www.who.int/europe/publications/i/item/9789289060356. [↩]