
Abstract
Alzheimer’s disease (AD) is a neurodegenerative disease characterized by cognitive decline, memory loss, and later, loss of basic physical functioning. It is the leading cause of dementia and represents a growing global health burden, projected to rise in the future. This study carried out an exploratory analysis of genetic and demographic risk factors associated with Alzheimer’s disease diagnostic status using the Alzheimer’s Disease Data Initiative (ADDI) Dataset, which included 1,500 individuals classified as cognitively healthy, having mild cognitive impairment (MCI), or having Alzheimer’s disease. The variables examined included age, sex, APOE genotype, Mini Mental State Examination (MMSE) scores, and geographic region. There were statistical analyses conducted in R using descriptive statistics and contingency table methods, including odds ratios with 95% confidence intervals, Fisher’s exact test, and chi-square tests. Age above 65 years was significantly associated with MCI relative to cognitively healthy status (OR = 3.18; 95% CI: 1.24-8.58; p = 0.017), whereas APOE ε4 carriage did not have any statistical significance in any disease group comparison. There was no statistically significant relationship between APOE ε4 carriage and diagnostic classification in the exploratory pairwise analyses (OR = 1.01; 95% CI: 0.68-1.51; p = 0.95). Such results may be due to some limitations in the dataset rather than biological processes. Because the synthetic group lacked environmental exposures, future research should associate genetic testing with lifestyle measurements to evaluate genetic and demographic relationships.
Introduction
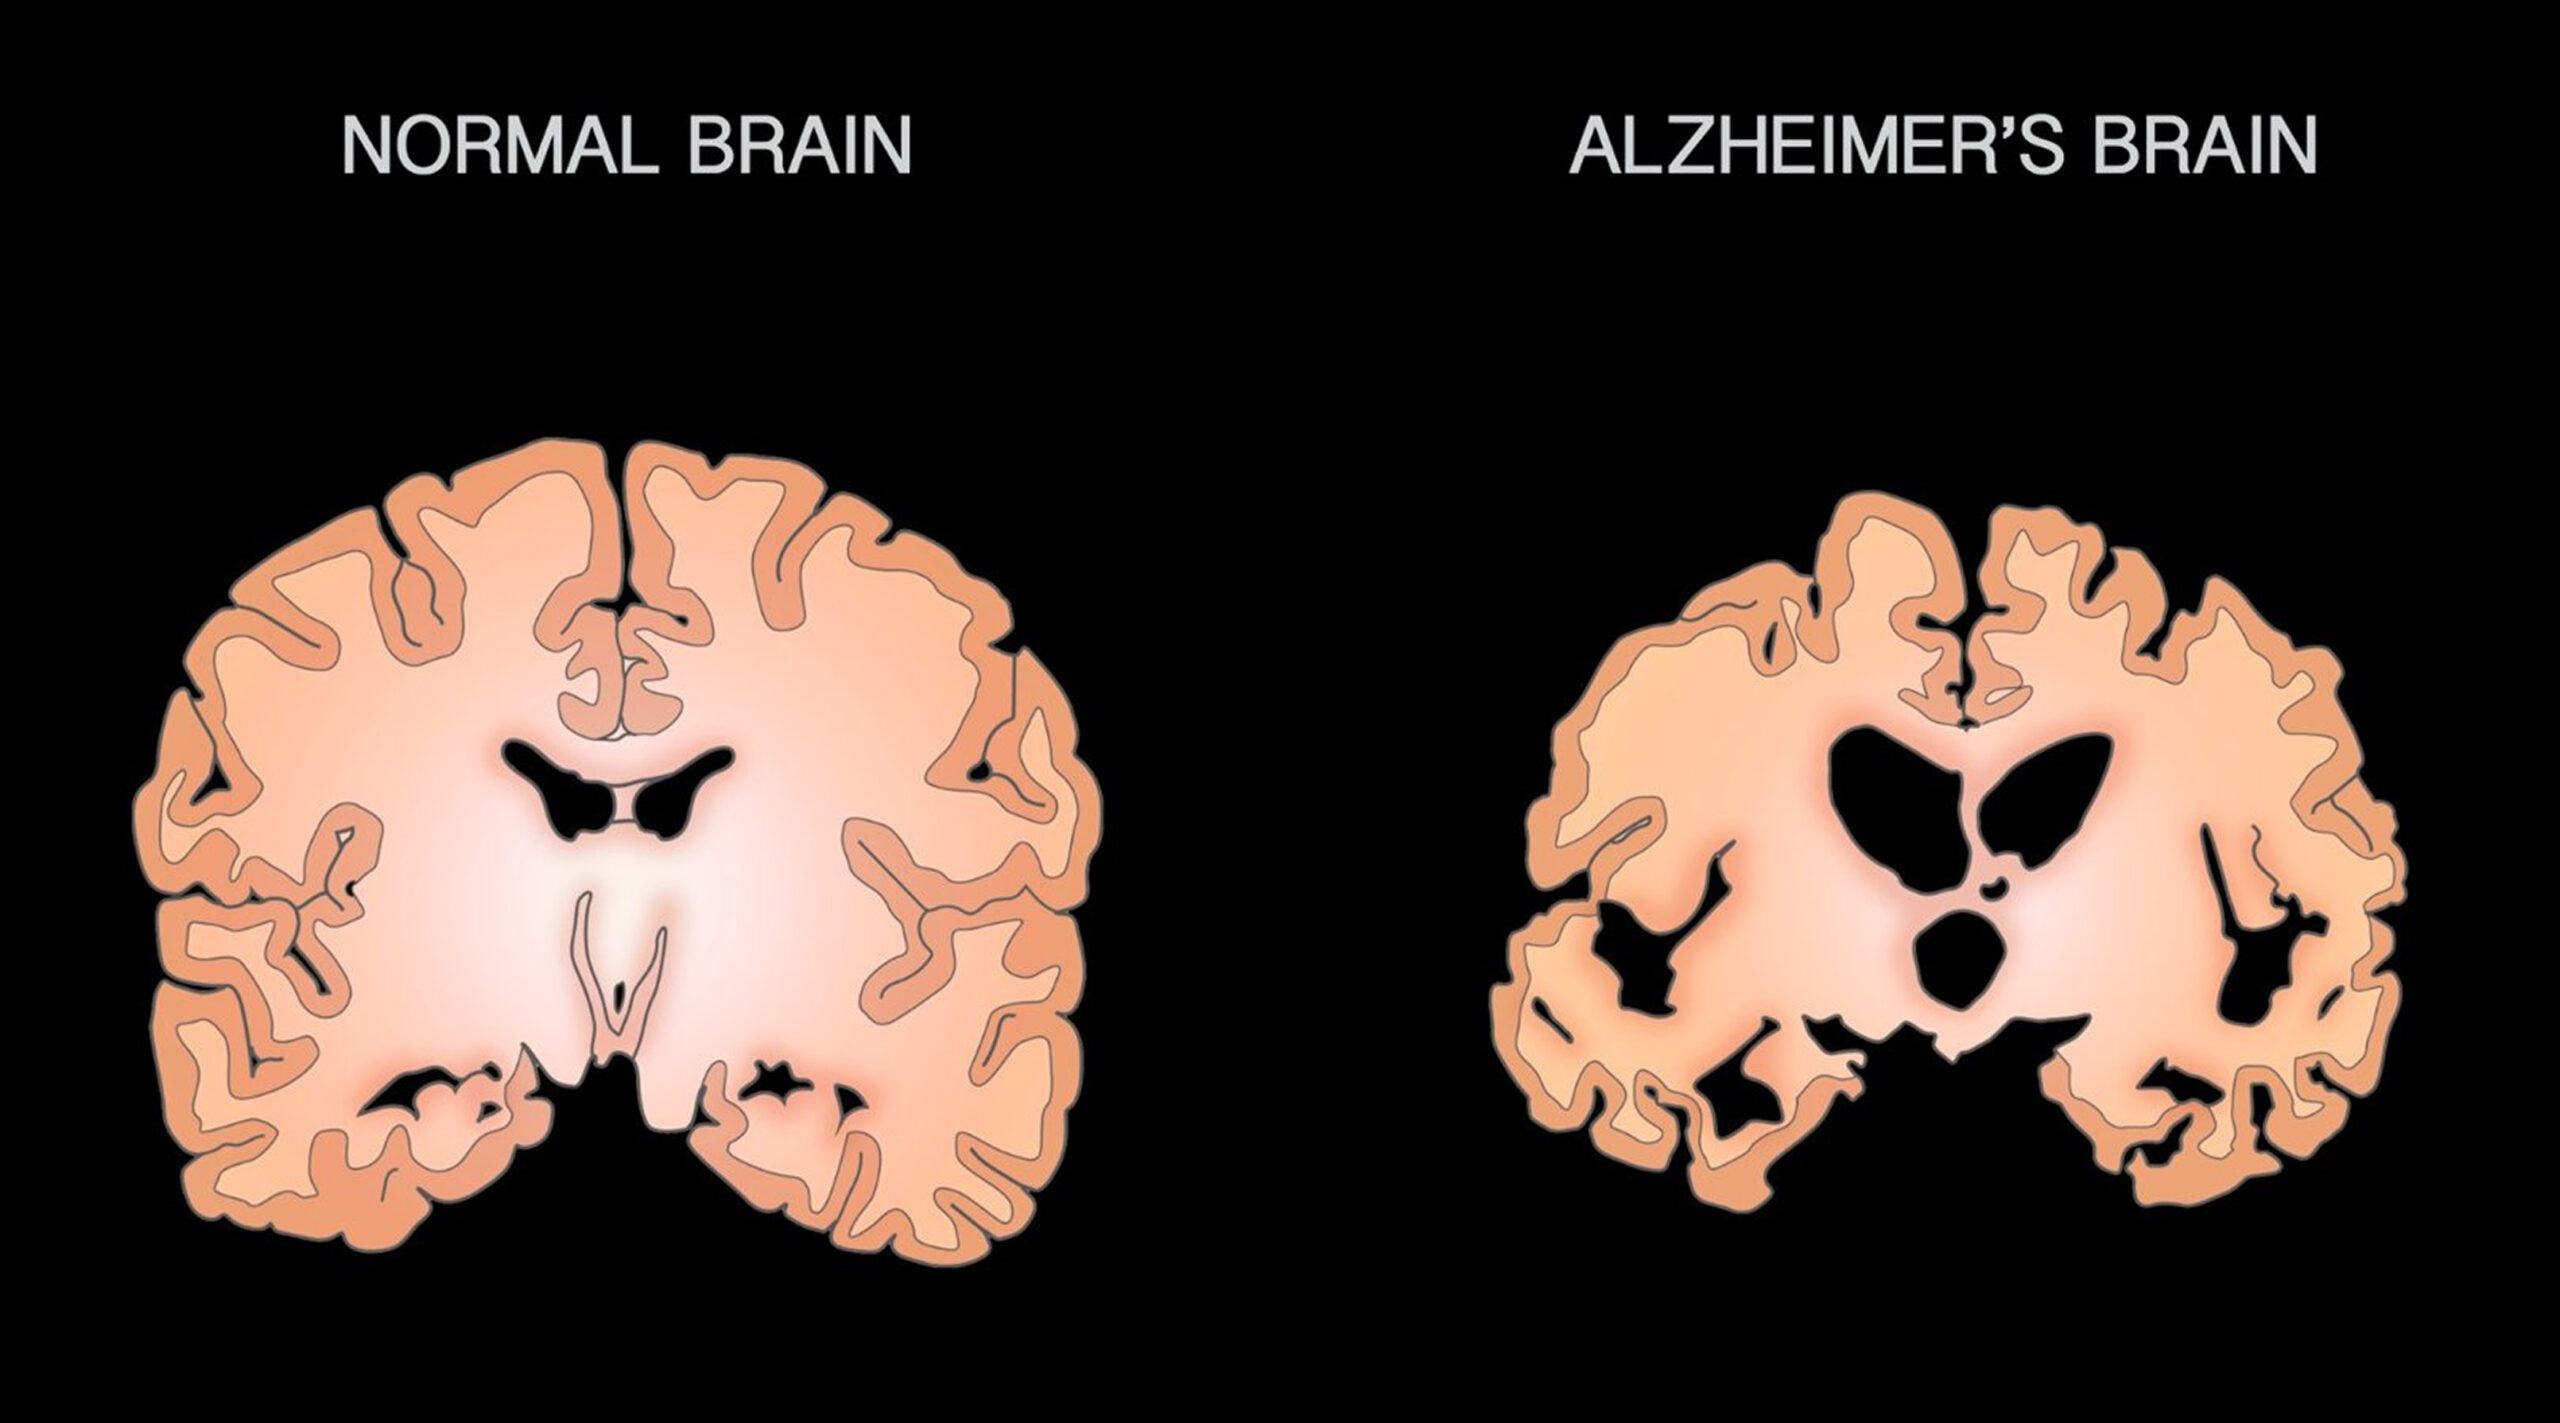
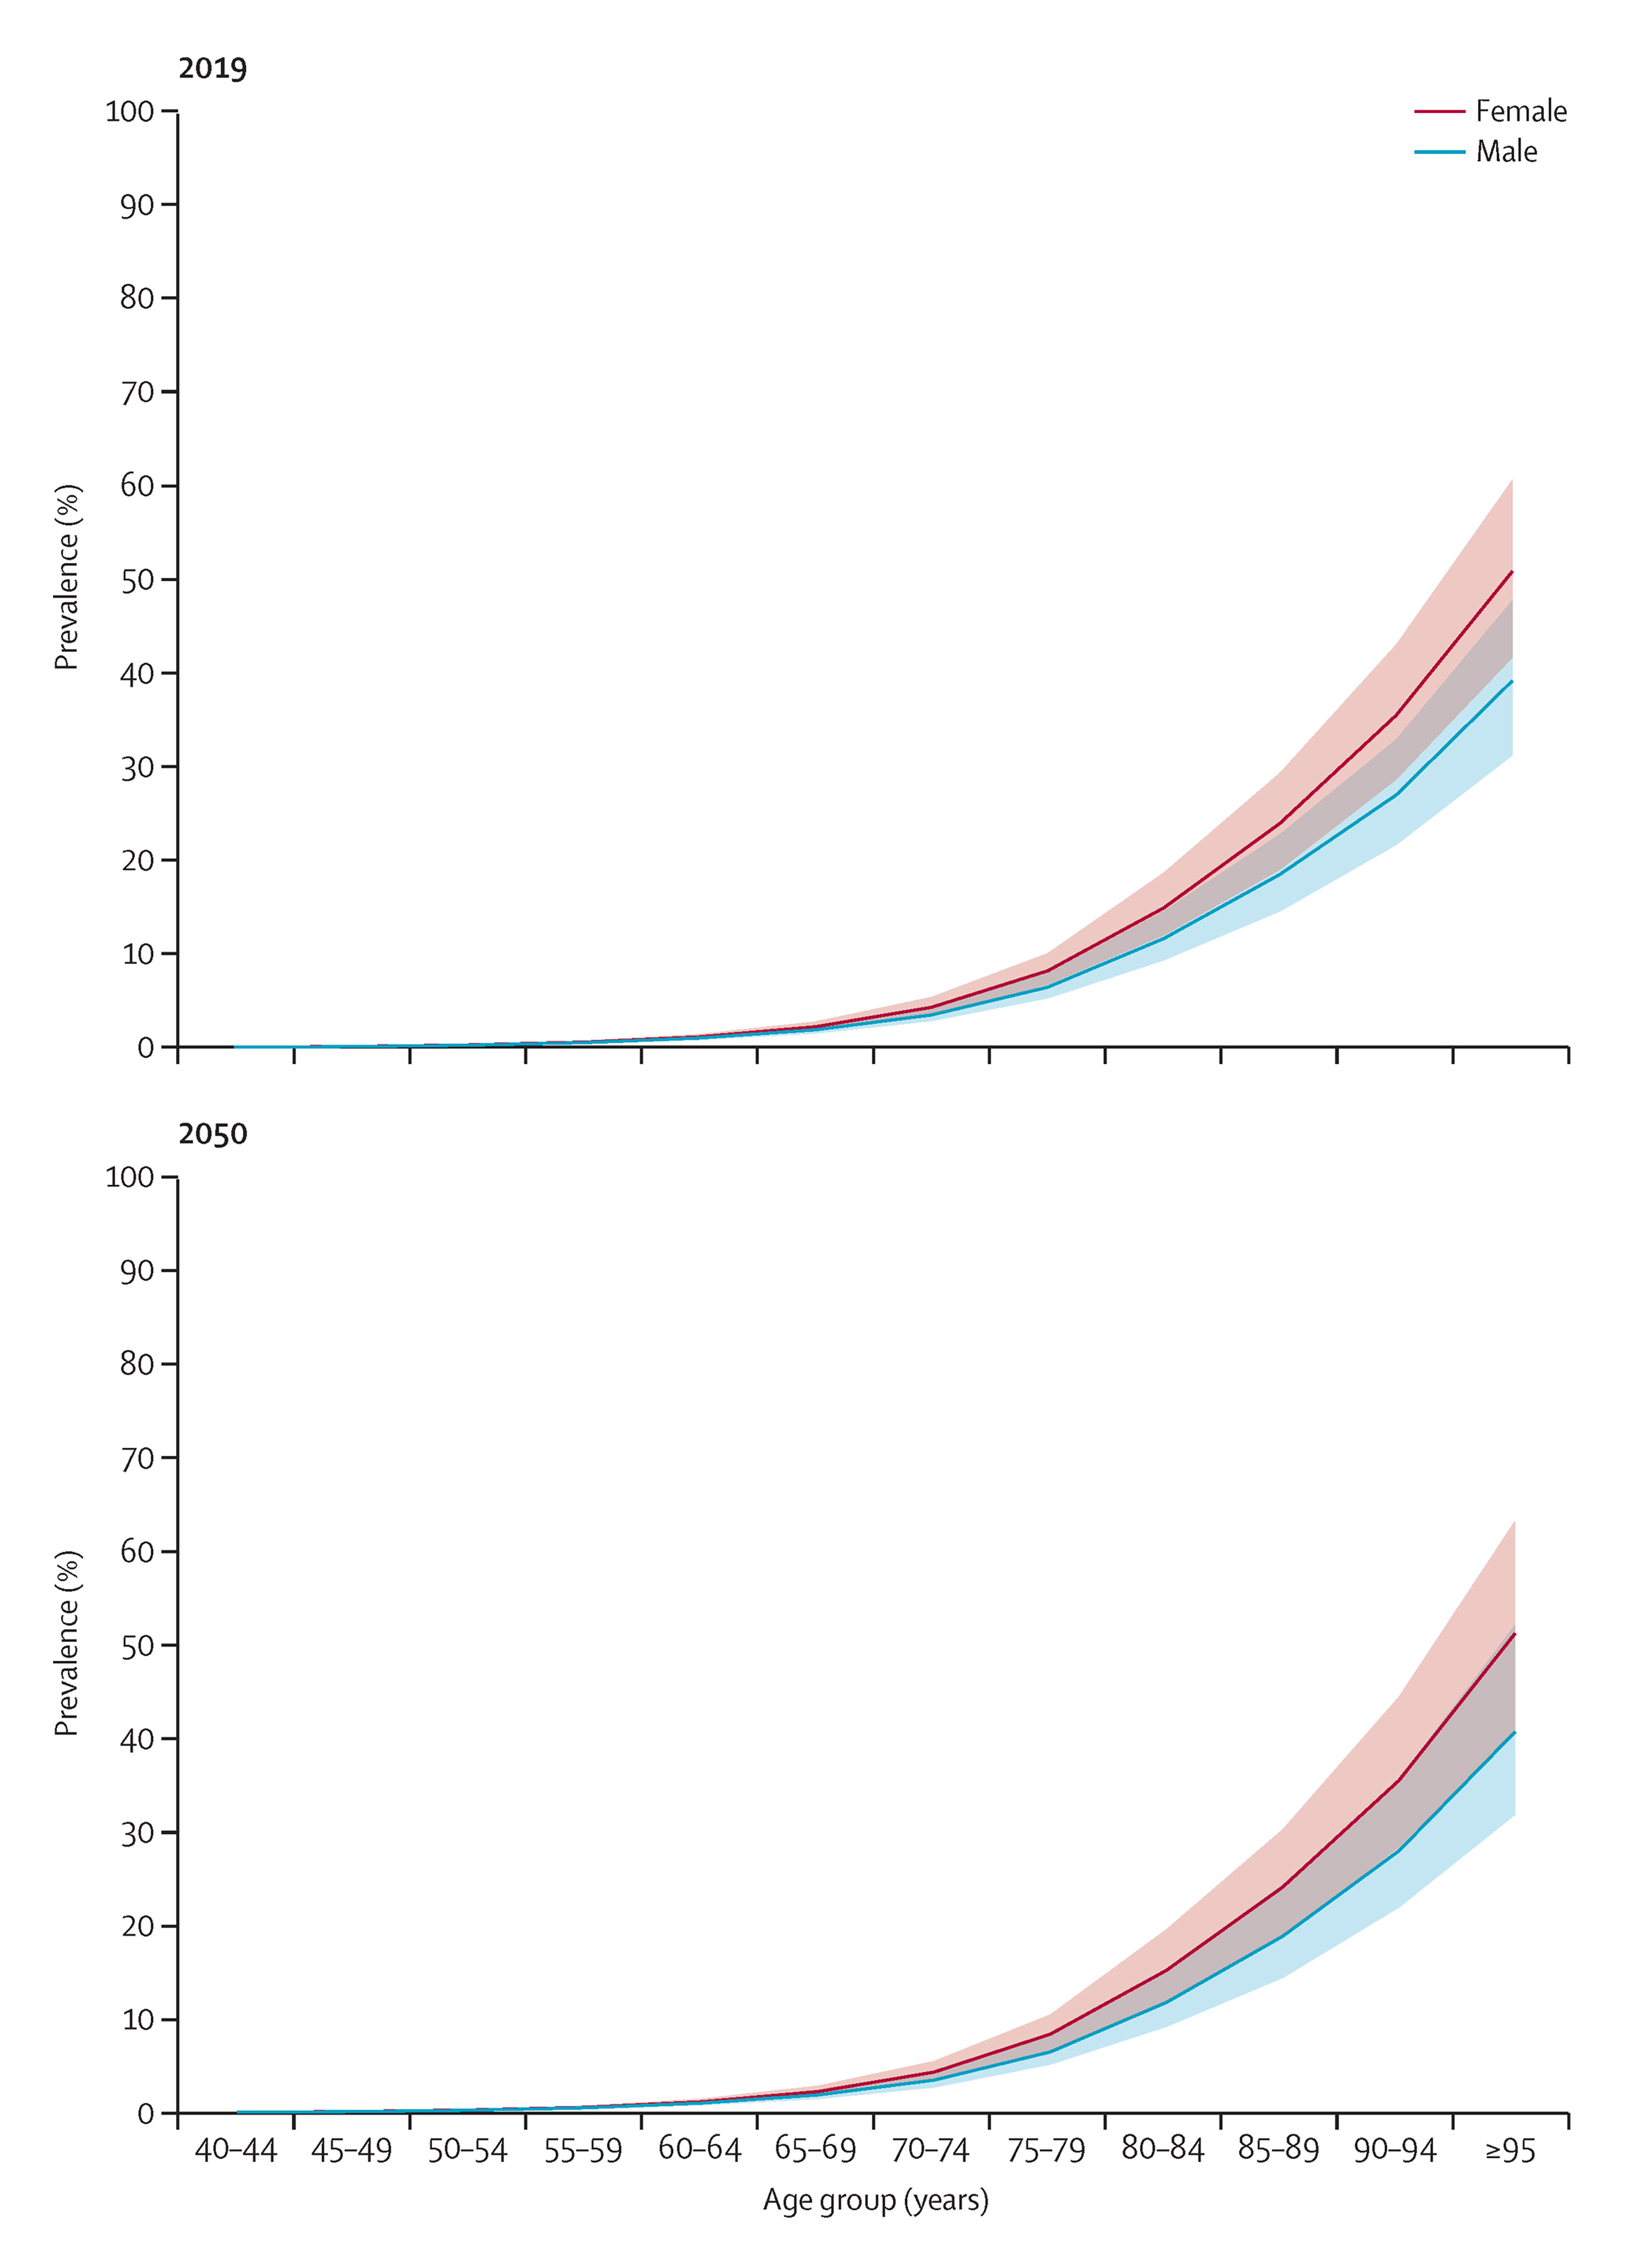
Alzheimer’s disease (AD) is a neurodegenerative disorder characterized by the loss of neurons and their connections in the cerebral cortex, within the hippocampus1. These changes lead to cognitive decline, memory impairment, and eventual loss of independent functioning2,3. Globally, neurodegenerative diseases represent a rising public health crisis. Around 55 million people worldwide are currently living with dementia, and this number is projected to rise to 139 million by 2050, according to the World Health Organization (WHO)4. Within the United States, current clinical records indicate that over 6.9 million individuals aged 65 and older suffer from an active AD diagnosis, generating healthcare infrastructure expenditures exceeding $360 billion annually, with long-term cost projections tracking past $1 trillion by mid-century5. In addition to the financial strain on healthcare companies, the toll on society includes an estimated 18.4 billion hours of informal care provided once a year by family members and other support systems6. So, improving models that analyze early diagnosis and patient factors is essential for better screening and treatment7.
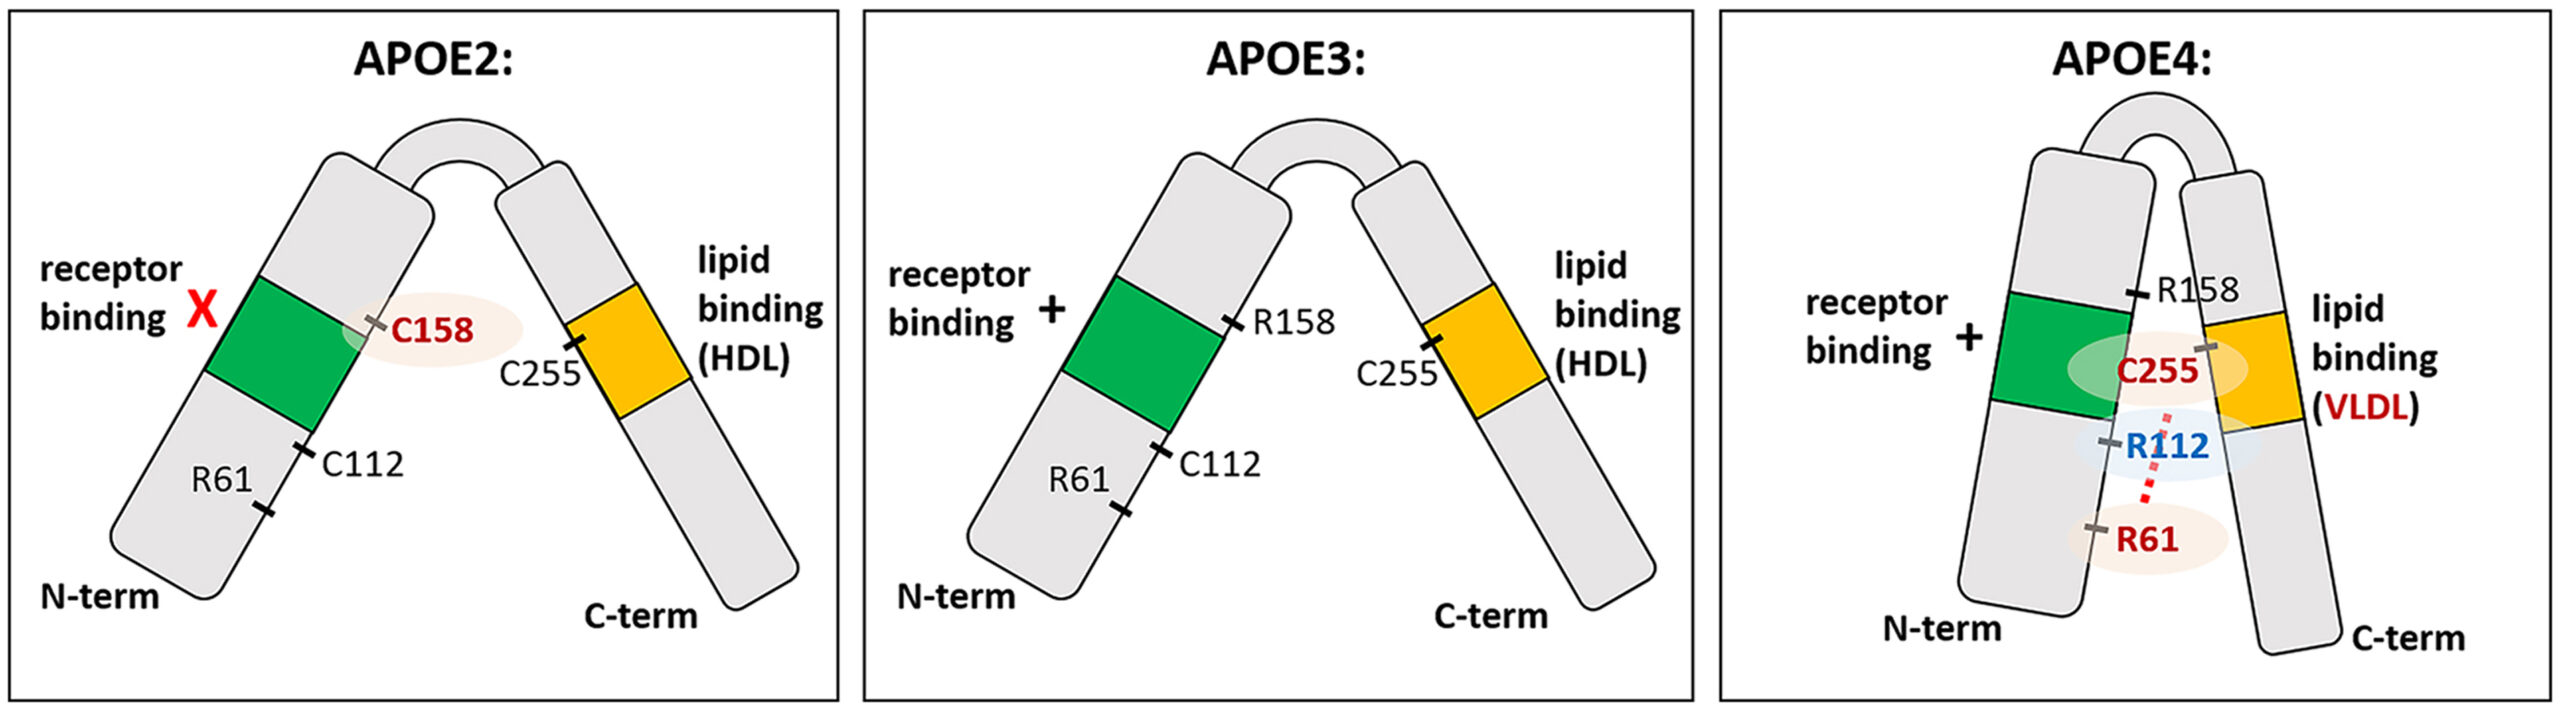
The biological basis of late-onset Alzheimer’s disease (AD) is complex and involves the interaction of genetic risk factors, demographic factors, and environmental exposures8. The main hallmarks of the disease, deposits of toxic amyloid-beta outside cells and tangles of tau proteins inside cells, can take decades to develop before symptoms appear3. Large-scale genetic studies have significantly expanded our understanding of the many genes involved in late-onset AD, identifying numerous risk areas related to immune system responses 9,10,11,12. The most important of these genes is apolipoprotein E (APOE), which is found on chromosome 1913. Variations of the APOE gene produce three main types of proteins, ε2, ε3, and ε4, which have different shapes and interact uniquely with lipid molecules14.
Individuals with one copy of the APOE ε4 allele have 3 to 4 times the risk of developing AD, and individuals with two copies of the APOE ε4 allele have 8 to 12 times the risk of developing AD compared to the most common ε3/ε3 type15. The ε4 protein structurally changes its interaction with fats and hinders the brain’s ability to remove amyloid plaque 16,17. However, the less common ε2 gene is seen as a protective factor that might delay the age at which the disease begins18.
Overall, genetic risk tests should be considered with fixed factors such as biological sex and age19,20. Long-term clinical systems show that advanced age is the main predictor for the progression from mild cognitive impairment (MCI) to an official dementia diagnosis21. On the other hand, deep-phenotyping research has found that the female sex is linked with increased tau pathology build-up and symptoms, and the biological mechanisms of this vulnerability are still under investigation22.
It can be noted that currently up to around 45% of the global burden of dementia can potentially be prevented or delayed through the proper management of 14 modifiable risk factors 23,24. Randomized controlled trials such as FINGER have demonstrated that a number of interventions are effective in maintaining cognitive performance and reducing the rate of cognitive decline in at-risk older patients25, including dietary modification, physical activity, cognitive training and metabolic monitoring. These changing factors interact within a complex system of socio-economic and structural factors such as childhood education, air quality, cardiovascular health, sleep hygiene and access to healthcare26,27.
While much has been done in terms of health factor studies, it is very complicated to analyze multiple variables due to ethical restrictions, costs, and confidential information problems28. To overcome these challenges, researchers are using synthetic data, computer-generated information, to simulate large groups of patients29. Some wonder whether these groups actually reflect real-world patterns observed in real human trials, although this method does make research more accessible30.
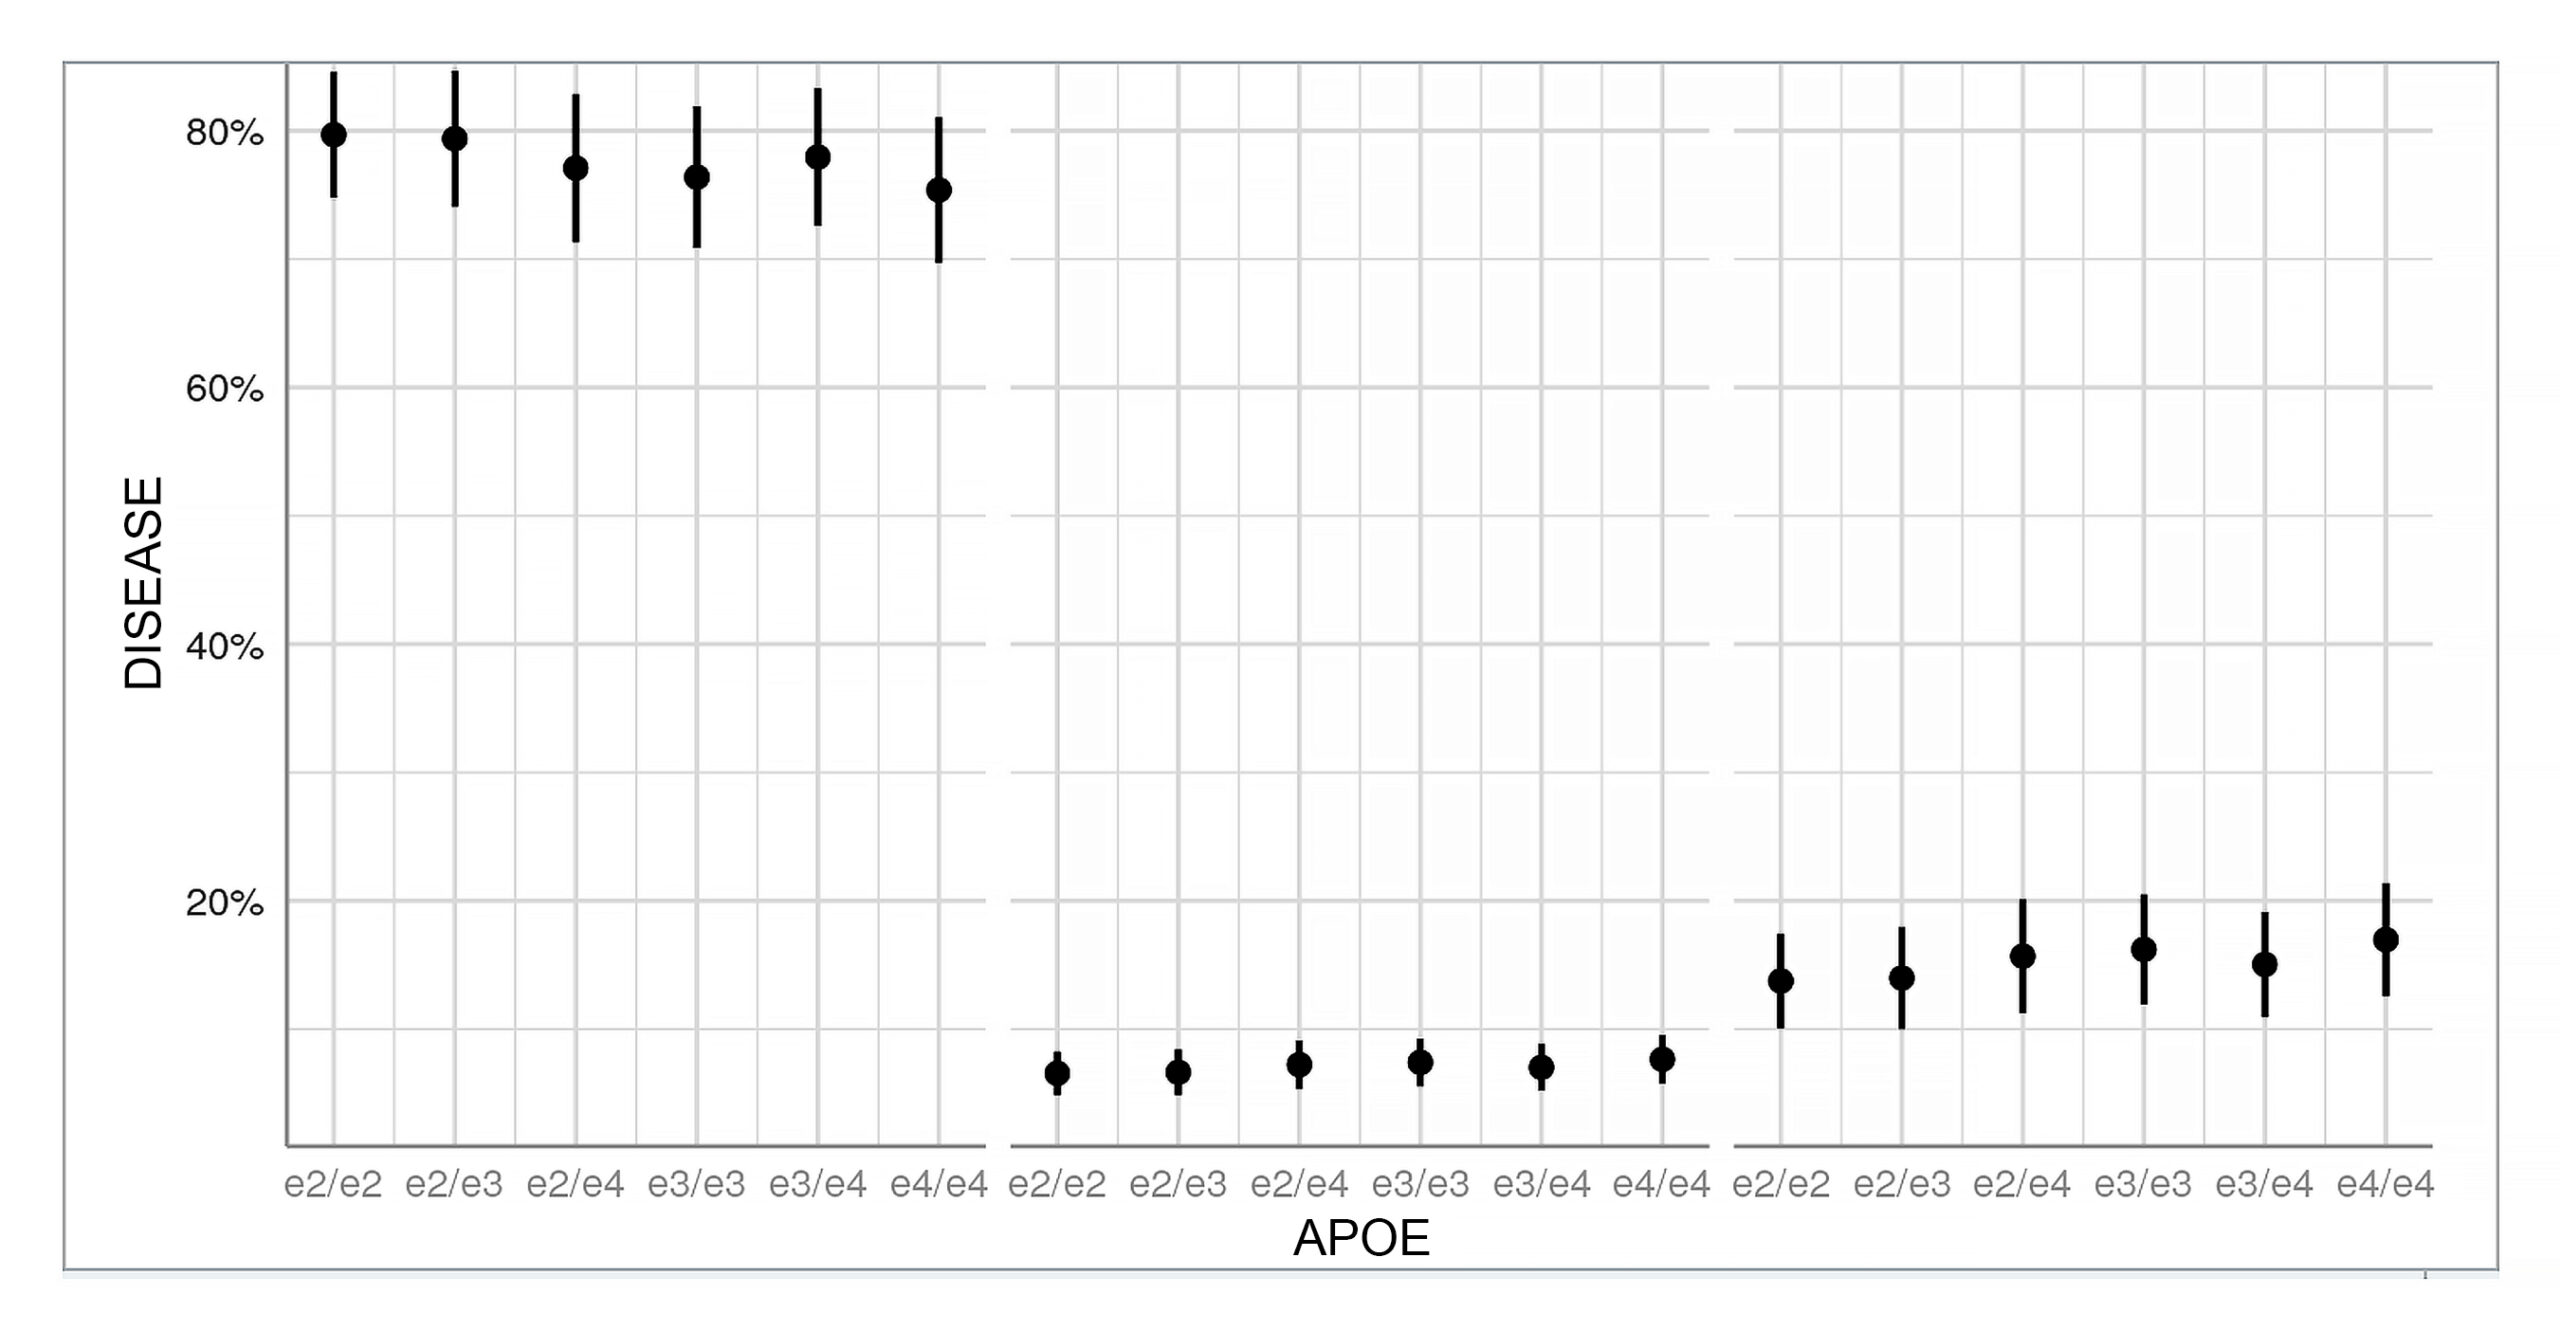
Figures 1-3 represent background images provided from outside resources. The original analysis results used in this research are shown in Figures 4-6, and details on the data sources are given in figure captions and Methods.
Methodology
Data Source and Study Population
Analysis is based on the ADDI (Alzheimer’s Disease Data Initiative) Synthetic Dataset. This dataset contains clinical and demographic information about 1,500 subjects diagnosed with cognitive health, mild cognitive impairment (MCI), and Alzheimer’s disease (AD). Variables analyzed were age, sex, APOE genotype, MMSE score, geographic region, and diagnosis.
Data Processing
The dataset was imported into R (version 4.3.2) for analysis. Completeness of the data was tested prior to the analysis. In the case of all primary variables used in this study using the ADDI Synthetic Dataset, there were no missing values in case of age, sex, APOE genotype, MMSE score, and diagnosis. Therefore, no imputation procedures were needed.
Age was grouped into clinically studied age groups, including <65 years and ≥65 years. Participants were measured for APOE genotype and carrier status (both carrier and non-carrier). The MMSE test score was grouped into clinically important categories: 25-30, 20-24, 15-19, and <10. These bins correspond to the bands of dementia severity that are mapped onto the Mini-Mental State Examination: questionable/normal, mild, moderate and severe. This is similar to what was characterized by Perneczky et al.34, who associated MMSE scores with Clinical Dementia Rating staging (questionable 26-29, mild 21-25, moderate 11-20, and severe 0-10). Each group consisted of five per level. The cut-off points are approximate and have no correlation with anything mentioned in the literature.
All analyses were performed in R version 4.3.235. Contingency table comparisons were performed using the base R functions chisq.test() and fisher.test(), with Fisher’s exact test used if any expected cell count was less than five. The odds ratios and 95% confidence intervals were determined by applying the continuity correction. Cumulative link mixed models were fitted using the function clmm() from the ordinal package36. The synthetic ADDI dataset37 was obtained from the AD Workbench. Subjects used in the analysis came from 9 geographical sites (countries). All key variables such as age, gender, APOE status, MMSE score, and diagnosis were present without any need for imputation.
After introducing age, sex, APOE genotypes and MMSE scores into the analysis, a further analysis of the relationship between these factors was performed, controlling for any differences between sites. This confirmed the results to be correct.
Statistical Analysis
Demographic and clinical characteristics were summarized by the diagnostic group using descriptive statistics. Contingency tables were used to compare disease groups within each APOE genotype group and within each age group.
Odds ratios (ORs) with 95% confidence intervals (CIs) were calculated to assess the strength of associations between predictor variables and disease status. Chi-square tests were used when expected cell counts were large enough, and Fisher’s exact tests were used when expected frequencies were less than five. Statistical significance was defined as p < 0.05.
As the primary aim of the present study was exploratory, the analyses were focused on pairwise associations rather than prediction. Thus, the results are interpreted as descriptive and hypothesis-generating.
To further investigate the relationships between variables, cumulative link mixed models were fitted with disease status treated as an ordinal outcome (Healthy < MCI < AD). Age, sex, APOE genotype, and MMSE score were included as fixed effects, and country was included as a random effect to account for geographical variation across the dataset.
Methodological Considerations
As this is not a predictive clinical model with alpha control, but rather a hypothesis generating and exploratory investigation, no formal statistical corrections for multiple comparisons (e.g., Bonferroni adjustments) were used for the pairwise computations. All reported p-values are to be considered as purely exploratory markers. Moreover, these pairwise contingency designs do not statistically control for confounding factors such as age or sex, and test raw cross-tabulations. Finally, the precise procedure for obtaining the synthetic diagnostic labels is not fully described in the materials available in the dataset. Therefore, it is impossible to verify whether MMSE scores were used directly for the assignment of the labels. Thus, MMSE was used descriptively for cognitive severity and not as an independent predictor. Since clinical diagnoses of AD and MCI are based on cognitive testing, MMSE would be expected to be strongly associated with diagnostic status by construction, and this association should be interpreted as a confirmation of internal consistency rather than as a demonstration of predictive value.
Results
Sample Composition
The dataset included 1,500 total participants across three disease groups:
| Diagnostic Group | Sample Size (n) | Mean Age (SD) | Sex (% Female) | APOE ε4 Carriers (n) | Mean MMSE Score |
| Healthy | 591 | 68.2 (5.1) | 52.4% | 145 | 28.4 |
| MCI | 528 | 71.4 (6.2) | 50.1% | 132 | 22.1 |
| AD | 381 | 75.6 (7.1) | 55.3% | 94 | 14.2 |
APOE ε4 Carriage and Disease Status
There was no statistically significant association between diagnostic group and APOE ε4 carriage in any pairwise comparison (Table 2). For the Healthy vs. AD comparison, the odds ratio was 1.01 (95% CI: 0.68-1.51; p = 0.95). For the Healthy vs. MCI comparison, the OR was 1.16 (95% CI: 0.73-1.84; p = 0.53), and for the MCI vs. AD comparison, the OR = 0.87 (95% CI: 0.66-1.16; p = 0.35).
| Comparison | Odds Ratio | 95% CI | p-value | Significant? |
| Healthy vs AD | 1.01 | 0.68-1.51 | 0.95 | No |
| Healthy vs MCI | 1.16 | 0.73-1.84 | 0.53 | No |
| MCI vs AD | 0.87 | 0.66-1.16 | 0.35 | No |
APOE ε4/ε4 and ε2 Carriage
The OR for homozygous APOE ε4/ε4 carriage in the comparison Healthy vs. AD was 0.80 (95% CI: 0.49-1.37; p = 0.40), not significant. In the same comparison, APOE ε2 carriage had an OR of 1.45 (95% CI: 0.97-2.17, p = 0.07). Although the odds ratio was > 1.0, this association was not statistically significant and is considered to be an exploratory result only (Table 3).
| Comparison | Odds Ratio | 95% CI | p-value | Significant? |
| APOE ε4/ε4 (Healthy vs AD) | 0.80 | 0.49-1.37 | 0.40 | No |
| APOE ε2 carriage (Healthy vs AD) | 1.45 | 0.97-2.17 | 0.07 | No |
Age and Cognitive Impairment
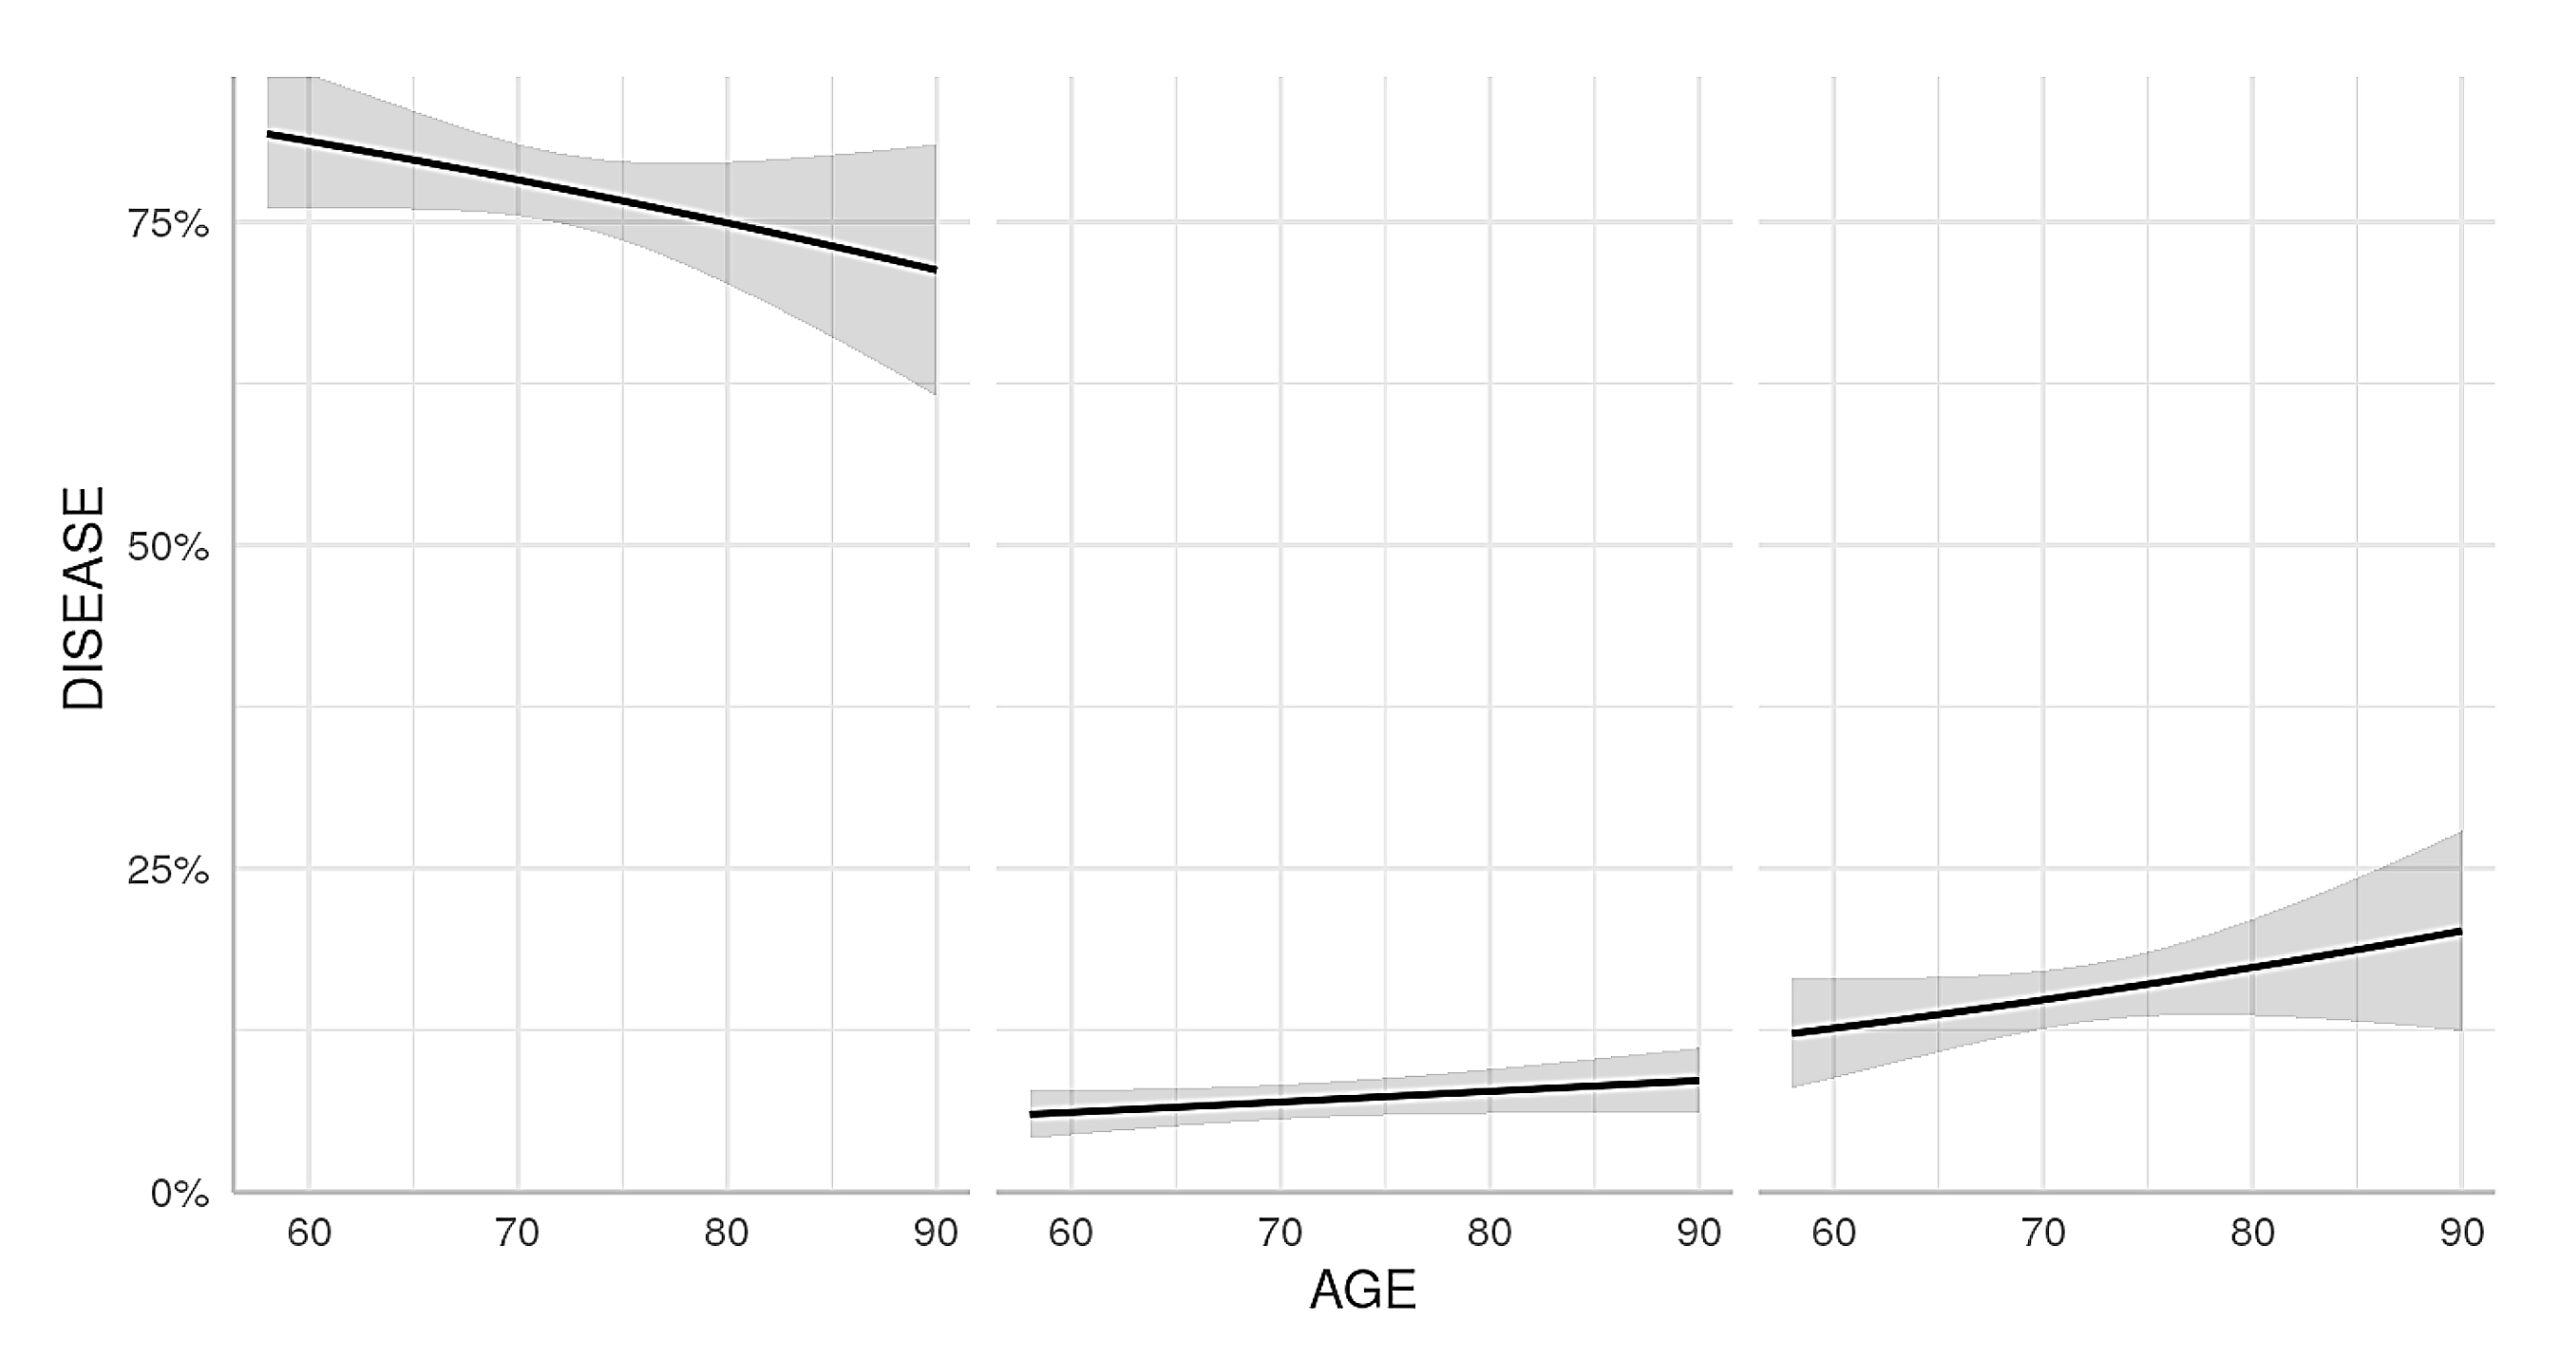
Individuals aged 65 years and older had a significantly increased risk for MCI compared to cognitively healthy status (OR = 3.18; 95% CI: 1.24-8.58; p = 0.017), indicating that those over 65 years had about 3 times the odds of MCI relative to healthy controls. The AD vs. Healthy comparisons between those over 65 years of age showed an odds ratio greater than 1.0 (OR = 1.54; 95% CI: 0.75-2.89; p = 0.22), but this was not statistically significant. For subjects younger than 65 years, neither comparison showed a statistically significant association (Table 4).
| Comparison | Age Group | Odds Ratio | 95% CI | p-value | Significant? |
| AD vs Healthy | Over 65 | 1.54 | 0.75-2.89 | 0.22 | No |
| AD vs Healthy | Under 65 | 0.72 | 0.41-1.40 | 0.32 | No |
| MCI vs Healthy | Over 65 | 3.18 | 1.24-8.58 | 0.017 | Yes |
| MCI vs Healthy | Under 65 | 0.57 | 0.27-1.25 | 0.16 | No |
Sex Comparisons
Difference in APOE genotypes in relation to sex among male and female subjects was analyzed. There was no significant association between sex and APOE ε4 carriage (OR = 1.16, 95% CI: 0.95-1.42, p = 0.14), APOE ε4/ε4 genotype (OR = 1.28, 95% CI: 0.97-1.69, p = 0.08), APOE ε3/ε3 genotype (OR = 0.82, 95% CI: 0.62-1.08, p = 0.17), or APOE ε2/ε2 genotype (OR = 1.08, 95% CI: 0.84-1.40, p = 0.54). These results demonstrate that the APOE genotypes are not significantly different with regard to sex.
| Comparison | Odds Ratio | 95% CI | p-value |
| Female vs Male (APOE ε4) | 1.16 | 0.95-1.42 | 0.14 |
| Female vs Male (APOE ε4/ε4) | 1.28 | 0.97-1.69 | 0.08 |
| Female vs Male (APOE ε3/ε3) | 0.82 | 0.62-1.08 | 0.17 |
| Female vs Male (APOE ε2/ε2) | 1.08 | 0.84-1.40 | 0.54 |
MMSE Group Comparisons
Distributions of APOE genotypes were also compared among five groups according to the levels of MMSE score (25-30, 20-24, 15-19, 10-14 and <10). No subgroups showed any significant relationship (Table 6). These results are considered to be exploratory.
| MMSE Category | Genotypes Tested | Sample Size (n) | Chi-Square / Fisher p-value | Overall Pattern |
| 25-30 | ε4, ε4/ε4, ε3/ε3, ε2/ε2 | 106 | p = 0.48 | Non-Significant |
| 20-24 | ε4, ε4/ε4, ε3/ε3, ε2/ε2 | 282 | p = 0.62 | Non-Significant |
| 15-19 | ε4, ε4/ε4, ε3/ε3, ε2/ε2 | 261 | p = 0.31 | Non-Significant |
| 10-14 | ε4, ε4/ε4, ε3/ε3, ε2/ε2 | 294 | p = 0.75 | Non-Significant |
| <10 | ε4, ε4/ε4, ε3/ε3, ε2/ε2 | 557 | p = 0.89 | Non-Significant |
Regional Variation in Disease Risk
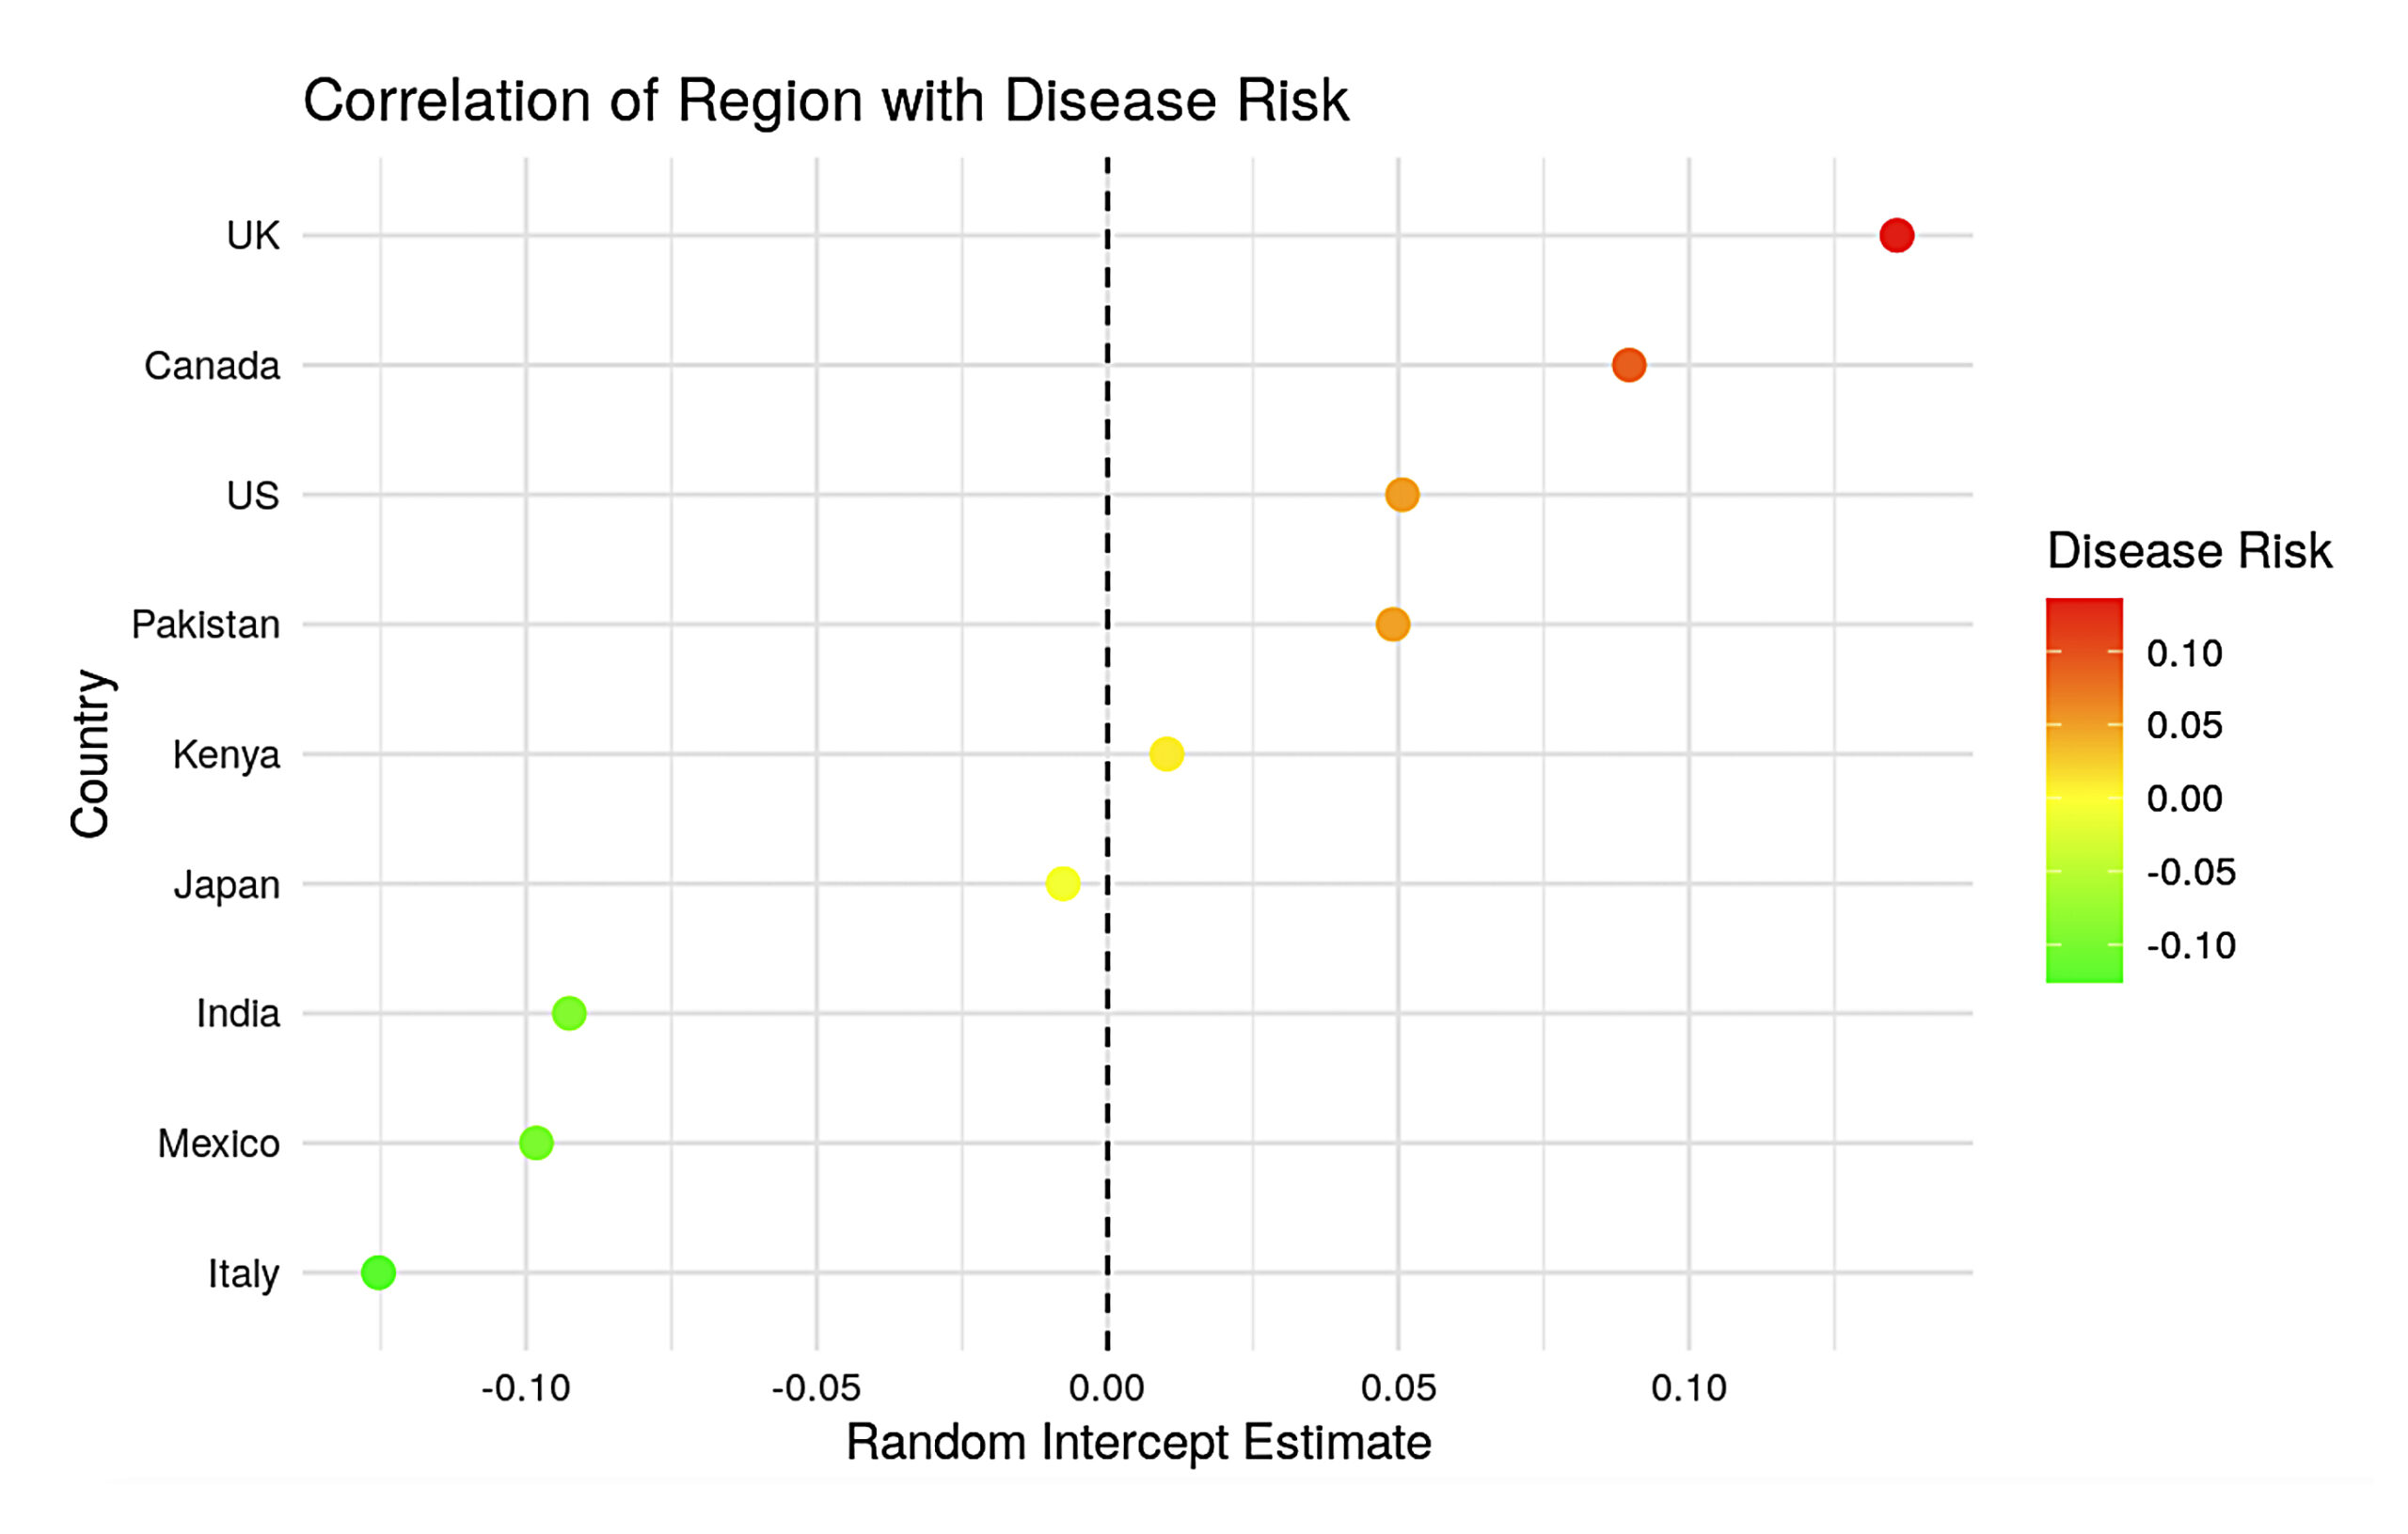
Exploratory visual analysis and cumulative link mixed modeling (CLMM) suggested modest variation in estimated disease risk across geographic regions (Figure 6). In the CLMM, country was included as a random effect while age, sex, APOE genotype, and MMSE score were included as fixed effects. The random intercept estimates were positive for the United Kingdom, Canada, and the United States and negative for Italy, Mexico, and India. Nevertheless, considering the small number of subgroups in each region and also the fact that the ADDI Synthetic Dataset is not created for simulating the actual geographic prevalence of the disease, the trends observed in these graphs must be cautiously analyzed. Moreover, the observed regional variation should not be interpreted as evidence for environmental risk factors, as the dataset does not contain direct environmental or lifestyle variables but may be a consequence of the synthetic data generation process.
Discussion
The analysis of the generated data resulted in a very unexpected outcome; namely, the carriage of the APOE ε4 allele had no statistically significant correlation with Alzheimer’s disease diagnosis (OR = 1.01; 95% CI: 0.68-1.51; p = 0.95). Compared to years of research proving that the ε4 allele is one of the major risk factors for developing late onset Alzheimer’s disease15. Research has shown that the ε4 allele hampers the brain’s ability to clear lipids, accelerates the formation of amyloid-beta plaques, and encourages neuroinflammation 14,19. Consequently, these results should not be interpreted as a reflection of real-world biology. On the contrary, the null hypothesis highlights the shortcomings of the process of generating the synthetic data and the fact that the model does not represent the existing association between genetics and disease outcomes30.
The ε4 frequency was similar across the healthy, MCI, and AD cohorts, showing that the synthetic dataset did not reproduce the ε4 enrichment observed in real AD populations, where the ε4 frequency is significantly increased in AD patients. Lack of association ε4 in the simulated data is an apparent mistake as far as actual medical records are concerned.
Such limitations are also seen with the APOE ε2 allele. The ε2 variant has been demonstrated in real-world cases to have a protective effect against the development of cortical atrophy and tau pathology38. Pairwise analysis on this synthetic dataset shows a non-significant association suggesting increased disease risk (OR = 1.45; 95% CI: 0.97-2.17; p = 0.07). This difference may be because of statistical noise or the synthetic data generating data for low frequency alleles. This is why synthetic models must be confirmed in the real world before being used to guide clinical decisions29.
On the other hand, age assessment was verified by the existing data. Strong association with mild cognitive impairment compared to the healthy control group in those >65 years (OR = 3.18; 95% CI: 1.24-8.58; p = 0.017). This is in line with clinical data that show that after the age of 65, metabolic changes increase cognitive vulnerability21.
The strong association of the MMSE with diagnosis status supports the hypothesis about consistency between cognition score and severity of the condition. Comparing these scores only verifies how the dataset was constructed. Because MMSE scores were used to build the synthetic diagnoses, this doesn’t actually prove real-world accuracy.
The results of the study show how complicated neurodegenerative diseases are. In the modern medicine field, genetics alone cannot be relied upon. The use of the polygenic risk score combined with tracking of the patient’s lifestyle is needed39. This study was confined to basic demographics since the ADDI dataset lacks other important factors such as diet, physical activity, and pollution.
Moving forward, only a joint investigation of the genetic data and actual environment will be applicable. The use of statistical models and analysis in large-scale real-life patient populations is necessary for proper identification of genetic and demographic risks and formulation of preventive measures.
Limitations
These limitations are important to keep in mind when interpreting our results. The first limitation of the study is the use of a synthetic dataset, which results in uncertainty as to whether the relationship observed is characteristic of the actual population of patients with AD. Synthetic data may not replicate the distributional characteristics of clinical cohorts. Null findings should not be interpreted as evidence against well-established associations reported in the literature. The second limitation is that the primary analyses were confined to pairwise contingency tables, while an exploratory cumulative link mixed model was applied as well. The third one is that only genetic and demographic factors could be studied, as environmental/lifestyle factors were not measured. Fourth, the sample size within individual subgroups, and in particular for MMSE-stratified analyses, was too small to detect small effect sizes. Null findings in those analyses should be viewed as inconclusive and not negative.
Conclusion
The relationships among APOE genotype, age, MMSE score, and geographical region in relation to AD diagnostic status were analyzed using the ADDI Synthetic Dataset. Being older than 65 was found to be significantly related to MCI as compared to cognitively healthy status; on the other hand, no significant relationship emerged from any pairwise analysis between APOE ε4 carrier and other variables. This indicates that Alzheimer’s disease is a multifactorial disorder; moreover, analyzing synthetic data in terms of complex gene relationships carries inherent weaknesses. The results presented in this paper can be used as the basis for future studies that will incorporate actual environmental and lifestyle factors together with genetic data.
Future Research Directions
Follow-up studies that would be most beneficial include adding real-world data regarding environmental exposures and lifestyle choices such as dietary quality, physical activity, pollution, cardiovascular history, educational attainment, and healthcare access. When paired with APOE genotype data in a larger study, this would allow testing of hypotheses as opposed to generating them. Another follow-up method that could prove useful in early prediction of disease progression would be biomarker data, brain imaging, and possibly machine learning algorithms.
References
- Alzheimer’s Association. 2024 Alzheimer’s disease facts and figures. Alzheimer’s & Dementia. Vol. 20, pg. 3708–3821, 2024, https://doi.org/10.1002/alz.13809. [↩]
- Alzheimer’s Association. 2024 Alzheimer’s disease facts and figures. Alzheimer’s & Dementia. Vol. 20, pg. 3708–3821, 2024, https://doi.org/10.1002/alz.13809. [↩]
- C. R. Jack Jr., D. A. Bennett, K. Blennow, M. C. Carrillo, B. Dunn, S. B. Haeberlein, D. M. Holtzman, W. Jagust, F. Jessen, J. Karlawish, E. Liu, J. L. Molinuevo, T. Montine, C. Phelps, K. P. Rankin, C. C. Rowe, P. Scheltens, E. Siemers, H. M. Snyder, R. Sperling, C. Elliott, E. Masliah, L. Ryan, N. Silverberg. NIA-AA research framework: toward a biological definition of Alzheimer’s disease. Alzheimer’s & Dementia. Vol. 14, pg. 535–562, 2018, https://doi.org/10.1016/j.jalz.2018.02.018. [↩] [↩]
- World Health Organization. Global status report on the public health response to dementia. https://www.who.int/publications/i/item/9789240033245, 2021. [↩]
- GBD 2019 Dementia Forecasting Collaborators. Estimation of the global prevalence of dementia in 2019 and forecasted prevalence in 2050. The Lancet Public Health. Vol. 7, pg. e105–e125, 2022, https://doi.org/10.1016/S2468-2667(21)00249-8. [↩]
- GBD 2019 Dementia Forecasting Collaborators. Estimation of the global prevalence of dementia in 2019 and forecasted prevalence in 2050. The Lancet Public Health. Vol. 7, pg. e105–e125, 2022, https://doi.org/10.1016/S2468-2667(21)00249-8. [↩]
- B. Winblad, P. Amouyel, S. Andrieu, C. Ballard, C. Brayne, H. Brodaty, A. Cedazo-Minguez, B. Dubois, D. Edvardsson, H. Feldman, L. Fratiglioni, G. B. Frisoni, S. Gauthier, J. Georges, C. Graff, K. Iqbal, F. Jessen, G. Johansson, L. Jönsson, M. Kivipelto, M. Knapp, F. Mangialasche, R. Melis, A. Nordberg, M. Olde Rikkert, C. Qiu, T. P. Sakmar, P. Scheltens, L. S. Schneider, R. Sperling, L. O. Tjernberg, G. Waldemar, A. Wimo, H. Zetterberg. Defeating Alzheimer’s disease and other dementias: a priority for European science and society. The Lancet Neurology. Vol. 15, pg. 455–532, 2016, https://doi.org/10.1016/S1474-4422(16)00062-4. [↩]
- G. Livingston, J. Huntley, K. Y. Liu, S. G. Costafreda, G. Selbæk, S. Alladi, D. Ames, S. Banerjee, A. Burns, C. Brayne, N. C. Fox, C. P. Ferri, L. N. Gitlin, R. Howard, H. C. Kales, M. Kivimäki, E. B. Larson, N. Nakasujja, K. Rockwood, Q. Samus, K. Shirai, A. Singh-Manoux, L. S. Schneider, S. Walsh, Y. Yao, A. Sommerlad, N. Mukadam. Dementia prevention, intervention, and care: 2024 report of the Lancet standing Commission. The Lancet. Vol. 404, pg. 572–628, 2024, https://doi.org/10.1016/S0140-6736(24)01296-0. [↩]
- C. Bellenguez, F. Küçükali, I. E. Jansen, L. Kleineidam, S. Moreno-Grau, N. Amin, A. C. Naj, et al. New insights into the genetic etiology of Alzheimer’s disease and related dementias. Nature Genetics. Vol. 54, pg. 412–436, 2022, https://doi.org/10.1038/s41588-022-01024-z. [↩]
- J.-C. Lambert, C. A. Ibrahim-Verbaas, D. Harold, A. C. Naj, R. Sims, C. Bellenguez, G. Jun, et al. Meta-analysis of 74,046 individuals identifies 11 new susceptibility loci for Alzheimer’s disease. Nature Genetics. Vol. 45, pg. 1452–1458, 2013, https://doi.org/10.1038/ng.2802. [↩]
- B. W. Kunkle, B. Grenier-Boley, R. Sims, J. C. Bis, V. Damotte, A. C. Naj, A. Boland, et al. Genetic meta-analysis of diagnosed Alzheimer’s disease identifies new risk loci and implicates Aβ, tau, immunity and lipid processing. Nature Genetics. Vol. 51, pg. 414–430, 2019, https://doi.org/10.1038/s41588-019-0358-2. [↩]
- I. E. Jansen, J. E. Savage, K. Watanabe, J. Bryois, D. M. Williams, S. Steinberg, J. Sealock, et al. Genome-wide meta-analysis identifies new loci and functional pathways influencing Alzheimer’s disease risk. Nature Genetics. Vol. 51, pg. 404–413, 2019, https://doi.org/10.1038/s41588-018-0311-9. [↩]
- E. H. Corder, A. M. Saunders, W. J. Strittmatter, D. E. Schmechel, P. C. Gaskell, G. W. Small, A. D. Roses, J. L. Haines, M. A. Pericak-Vance. Gene dose of apolipoprotein E type 4 allele and the risk of Alzheimer’s disease in late onset families. Science. Vol. 261, pg. 921–923, 1993, https://doi.org/10.1126/science.8346443. [↩]
- P. B. Verghese, J. M. Castellano, D. M. Holtzman. Apolipoprotein E in Alzheimer’s disease and other neurological disorders. The Lancet Neurology. Vol. 10, pg. 241–252, 2011, https://doi.org/10.1016/S1474-4422(10)70325-2. [↩] [↩]
- W. J. Strittmatter, A. M. Saunders, D. Schmechel, M. Pericak-Vance, J. Enghild, G. S. Salvesen, A. D. Roses. Apolipoprotein E: high-avidity binding to beta-amyloid and increased frequency of type 4 allele in late-onset familial Alzheimer disease. Proceedings of the National Academy of Sciences. Vol. 90, pg. 1977–1981, 1993, https://doi.org/10.1073/pnas.90.5.1977. [↩] [↩]
- P. B. Verghese, J. M. Castellano, D. M. Holtzman. Apolipoprotein E in Alzheimer’s disease and other neurological disorders. The Lancet Neurology. Vol. 10, pg. 241–252, 2011, https://doi.org/10.1016/S1474-4422(10)70325-2. [↩]
- C. G. Fernandez, M. E. Hamby, M. L. McReynolds, W. J. Ray. The role of APOE4 in disrupting the homeostatic functions of astrocytes and microglia in aging and Alzheimer’s disease. Frontiers in Aging Neuroscience. Vol. 11, pg. 14, 2019, https://doi.org/10.3389/fnagi.2019.00014. [↩]
- E. M. Reiman, J. F. Arboleda-Velasquez, Y. T. Quiroz, M. J. Huentelman, T. G. Beach, R. J. Caselli, et al. Exceptionally low likelihood of Alzheimer’s dementia in APOE2 homozygotes from a 5,000-person neuropathological study. Nature Communications. Vol. 11, pg. 667, 2020, https://doi.org/10.1038/s41467-019-14279-8. [↩]
- C. C. Liu, T. Kanekiyo, H. Xu, G. Bu. Apolipoprotein E and Alzheimer’s disease: risk, mechanisms and therapy. Nature Reviews Neurology. Vol. 9, pg. 106–118, 2013, https://doi.org/10.1038/nrneurol.2012.263. [↩] [↩]
- L. A. Farrer, L. A. Cupples, J. L. Haines, B. Hyman, W. A. Kukull, R. Mayeux, R. H. Myers, M. A. Pericak-Vance, N. Risch, C. M. van Duijn. Effects of age, sex, and ethnicity on the association between apolipoprotein E genotype and Alzheimer disease: a meta-analysis. JAMA. Vol. 278, pg. 1349–1356, 1997, https://doi.org/10.1001/jama.1997.03550160069041. [↩]
- A. J. Mitchell, M. Shiri-Feshki. Rate of progression of mild cognitive impairment to dementia — meta-analysis. Acta Psychiatrica Scandinavica. Vol. 119, pg. 252–265, 2009, https://doi.org/10.1111/j.1600-0447.2008.01326.x. [↩] [↩]
- A. Serrano-Pozo, S. Das, B. T. Hyman. APOE and Alzheimer’s disease: advances in genetics, pathophysiology, and therapies. The Lancet Neurology. Vol. 20, pg. 68–80, 2021, https://doi.org/10.1016/S1474-4422(20)30412-9. [↩]
- D. E. Barnes, K. Yaffe. The projected effect of risk factor reduction on Alzheimer’s disease prevalence. The Lancet Neurology. Vol. 10, pg. 819–828, 2011, https://doi.org/10.1016/S1474-4422(11)70072-2. [↩]
- G. Livingston, J. Huntley, K. Y. Liu, S. G. Costafreda, G. Selbæk, S. Alladi, et al. Dementia prevention, intervention, and care: 2024 report of the Lancet standing Commission. The Lancet. Vol. 404, pg. 572–628, 2024, https://doi.org/10.1016/S0140-6736(24)01296-0. [↩]
- T. Ngandu, J. Lehtisalo, A. Solomon, E. Levälahti, S. Ahtiluoto, R. Antikainen, L. Bäckman, T. Hänninen, A. Jula, T. Laatikainen, J. Lindström, F. Mangialasche, T. Paajanen, S. Pajala, M. Peltonen, R. Rauramaa, A. Stigsdotter-Neely, T. Strandberg, J. Tuomilehto, H. Soininen, M. Kivipelto. A 2 year multidomain intervention of diet, exercise, cognitive training, and vascular risk monitoring versus control to prevent cognitive decline in at-risk elderly people (FINGER): a randomised controlled trial. The Lancet. Vol. 385, pg. 2255–2263, 2015, https://doi.org/10.1016/S0140-6736(15)60461-5. [↩]
- G. Livingston, J. Huntley, K. Y. Liu, S. G. Costafreda, G. Selbæk, S. Alladi, et al. Dementia prevention, intervention, and care: 2024 report of the Lancet standing Commission. The Lancet. Vol. 404, pg. 572–628, 2024, https://doi.org/10.1016/S0140-6736(24)01296-0. [↩]
- S. Licher, S. Ahmad, H. Karamujić-Čomić, T. Voortman, M. J. G. Leening, M. A. Ikram, M. K. Ikram. Genetic predisposition, modifiable risk factors, and long-term risk of dementia. Journal of Alzheimer’s Disease. Vol. 68, pg. 529–536, 2019, https://doi.org/10.3233/JAD-180631. [↩]
- K. B. Rajan, J. Weuve, L. L. Barnes, E. A. McAninch, R. S. Wilson, D. A. Evans. Population estimate of people with clinical Alzheimer’s disease and mild cognitive impairment in the United States (2020–2060). Alzheimer’s & Dementia. Vol. 17, pg. 1966–1975, 2021, https://doi.org/10.1002/alz.12362. [↩]
- L. Gootjes-Dreesbach, et al. Variational autoencoder modelling of in silico (virtual) patient cohorts in dementia. Frontiers in Artificial Intelligence. Vol. 3, pg. 613956, 2020, https://doi.org/10.3389/frai.2020.613956. [↩] [↩]
- R. J. Chen, M. Y. Lu, T. Y. Chen, D. F. K. Williamson, F. Mahmood. Synthetic data in machine learning for medicine and healthcare. Nature Biomedical Engineering. Vol. 5, pg. 493–497, 2021, https://doi.org/10.1038/s41551-021-00751-8. [↩] [↩]
- BrightFocus Foundation. Alzheimer’s disease shrinks the brain. 2026, https://www.brightfocus.org/alzheimers/. [↩]
- GBD 2019 Dementia Forecasting Collaborators. Estimation of the global prevalence of dementia in 2019 and forecasted prevalence in 2050. The Lancet Public Health. Vol. 7, pg. e105–e125, 2022, https://doi.org/10.1016/S2468-2667(21)00249-8. [↩]
- C. G. Fernandez, M. E. Hamby, M. L. McReynolds, W. J. Ray. The role of APOE4 in disrupting the homeostatic functions of astrocytes and microglia in aging and Alzheimer’s disease. Frontiers in Aging Neuroscience. Vol. 11, pg. 14, 2019, https://doi.org/10.3389/fnagi.2019.00014. [↩]
- R. Perneczky, S. Wagenpfeil, K. Komossa, T. Grimmer, J. Diehl, A. Kurz. Mapping scores onto stages: Mini-Mental State Examination and Clinical Dementia Rating. The American Journal of Geriatric Psychiatry. Vol. 14, pg. 139–144, 2006, https://doi.org/10.1097/01.JGP.0000192478.82189.a8. [↩]
- R Core Team. R: a language and environment for statistical computing. https://www.R-project.org/, 2023. [↩]
- R. H. B. Christensen. ordinal — regression models for ordinal data. https://CRAN.R-project.org/package=ordinal, 2023. [↩]
- Alzheimer’s Disease Data Initiative. AD Workbench synthetic dataset. https://www.alzheimersdata.org, 2024. [↩]
- E. M. Reiman, J. F. Arboleda-Velasquez, Y. T. Quiroz, M. J. Huentelman, T. G. Beach, R. J. Caselli, et al. Exceptionally low likelihood of Alzheimer’s dementia in APOE2 homozygotes from a 5,000-person neuropathological study. Nature Communications. Vol. 11, pg. 667, 2020, https://doi.org/10.1038/s41467-019-14279-8. [↩]
- D. P. Wightman, I. E. Jansen, J. E. Savage, A. A. Shadrin, S. Bahrami, D. Holland, A. Rongve, et al. A genome-wide association study with 1,126,563 individuals identifies new risk loci for Alzheimer’s disease. Nature Genetics. Vol. 53, pg. 1276–1282, 2021, https://doi.org/10.1038/s41588-021-00921-z. [↩]