
Abstract
Background/Objective: International wildlife trade monitoring relies on accurate reporting from both importing and exporting nations. However, regulations built on this data often prove inadequate, as gaps in records allow disease risks to slip through the cracks. This study investigated discrepancies in United States live mammal import tracking data in the CITES Trade Database between 2000 and 2024.
Methods: Historical analysis was used to examine 3,842 live mammal import records downloaded from the CITES Trade Database. Using Python libraries (pandas, NumPy, SciPy, Matplotlib) in Jupyter Notebooks, data completeness and reporting discrepancies were analyzed. Differences between importer- and exporter-reported quantities were calculated, and a one-sample t-test, Wilcoxon signed-rank test, sign test, and bootstrap CI were conducted to assess the significance and robustness of the findings.
Results: Of the 3,842 total records, 77.0% were missing at least one reported quantity. Among the remaining 23.0% with both quantities present (n = 884), the mean absolute difference was 244.73 animals. A one-sample t-test confirmed the directional pattern was statistically significant (t(883) = -5.87, p < 0.001, 95% CI [-268.6, -134.0]), confirmed by a Wilcoxon signed-rank test (W = 21,468, p < 0.001) and sign test (291 vs. 122, p < 0.001).
Conclusions: CITES U.S. live mammal import records show incomplete reporting from one or both parties in a statistically significant portion of trade records, revealing the limitations in the current reporting systems. These findings suggest that current systems in place lack the reliability necessary to regulate international wildlife conservation and prevent zoonotic disease.
Keywords: CITES, wildlife trade, mammal imports, data discrepancy, zoonotic disease, public health surveillance, descriptive statistics
Introduction
Background and Context
In 2023 alone, 1.25 million people died from tuberculosis worldwide. Tuberculosis, recognized by the WHO as likely the world’s leading cause of death by a single infectious agent1, is not only found in humans but also in animals, most notably the millions of mammals that enter and exit the United States each year. The process of animal trade often creates opportunities for cross-species pathogen transmission2,3,4,5,6. More than 37 million live amphibians, birds, mammals, and reptiles were legally imported to the United States from 163 countries between 2000 and 20047,8, carrying pathogens such as tuberculosis, rabies, and anthrax that can be fatal to humans. Despite animal trade being a rapidly growing industry9, regulations are still weak and vary by country. Researchers have expressed concern that “Animals imported for commercial trade represent a substantial risk to human health”7. The recent global zoonotic disease outbreaks including SARS, MERS, and COVID-19 have demonstrated that human-animal interaction can pose serious risks to public health10,11,12.
The Convention on International Trade in Endangered Species of Wild Fauna and Flora (CITES) is a voluntary international agreement among countries to track and regulate wildlife trade to prevent extinction of traded species. These species are classified into three appendices ranging from a full commercial trade ban to regulated and monitored trade13,14. CITES operates under a dual-reporting system15,16,14 where each country reports its own import and export records independently. Without an enforced cross-reference policy, this system only works if both parties submit complete and accurate records. However, evidence suggests that this system fails to provide reliable trade data.
Prior research has identified systematic reporting discrepancies in the CITES database and possible reasoning behind it. Blundell and Mascia found substantial trade volume differences between CITES data and U.S. Customs data for U.S. wildlife trade across all taxa in all years17. Kolby and Reaser confirmed that the problem Blundell and Mascia found still existed nearly 20 years later18. Pavitt et al. documented that rather than reporting failures, differences in report timing and how countries define reporting codes may be the main factor for discrepancies16. Jenkins et al. further highlighted that weak regulation and enforcement of live animal imports into the U.S. contributed to these gaps8. This study extends prior work by taking a closer look at CITES-reported U.S. live mammal import records between 2000 and 2024 to quantify the scale and direction of reporting discrepancies.
Problem Statement and Rationale
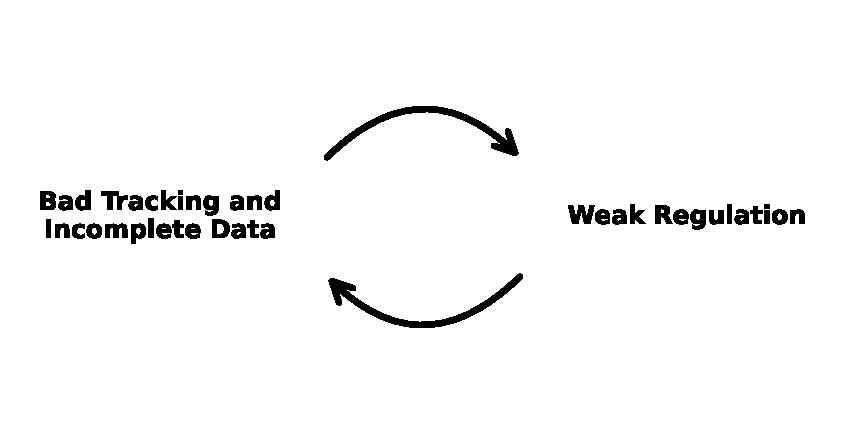
Even though there are databases that track animal trade, such as CITES, many data points remain unrecorded or incomplete. The high volume of cross-border trades, together with poor enforcement of trade tracking, make it difficult to identify trade routes, species, and trends required for regulation. Without strong regulation, countries do not face consequences for violations19,20,21, leaving no incentive for policy enforcement. Weak regulation results from unreliable trade tracking22, and poor quality of tracking affects the effectiveness of regulation, creating a self-reinforcing cycle, as depicted in Figure 1 below. These failures have real impacts on zoonotic disease outbreaks and pose risks to public health7,19.
This study examined missing or mismatched records that contributed to weak regulations and quantified the severity of the problem. By analyzing the CITES-reported U.S. live mammal import database, this study generated concrete statistics to examine the magnitude of missing or incomplete information. A synthesis of existing research was used to explain possible reasons for these inconsistencies.
Significance and Purpose
This study aims to extend prior studies by analyzing CITES-reported U.S. live mammal import records over a 24-year period to identify data discrepancies and demonstrate deficiencies of existing systems. These findings provide valuable input for policy makers to strengthen wildlife trade regulations and reduce associated public health risks.
Objectives
This study seeks to find answers for the following two questions using data from U.S. live mammal imports recorded in the CITES Trade Database from 2000 to 2024: First, what portion of records is incomplete, meaning missing either importer or exporter reported quantities? Second, among the records where both importer and exporter submitted reports, were the discrepancies significant on a recurring basis or were they just random noise in the system?
Scope and Limitations
This study is limited to legally recorded U.S. live mammal import records between 2000 and 2024 as reported in the CITES Trade Database. It does not capture illegal trade or other taxonomic classes. This study describes what the data shows. It does not attempt to explain why discrepancies happen.
Theoretical Framework
This study is built on the assumption that quality surveillance data is necessary for effective wildlife trade policy. The current gaps are not just accidents but reflect real weaknesses in regulations. The discrepancies in the wildlife tracking system stem from poor enforcement, which in turn makes it harder to design effective policies, creating the cycle shown in Figure 1. This study tests whether real trade data fits this theory.
Methodology Overview
This study used historical analysis as the inquiry approach, the CITES database for data collection, and descriptive statistics for analysis. The CITES database was used for this study because the information is publicly accessible and provides a comprehensive view of animal trade. Descriptive statistics were chosen for analysis because the data is mostly quantitative, allowing quantification of the overall scale of the discrepancies. This study was purely observational. It examined existing trade records without creating new data or conducting experiments.
Methods
Research Design
This study used an observational, cross-sectional design based on publicly available trade records from the CITES database. No new data were collected, and no human or animal subjects were involved, making it exempt from institutional review board oversight.
Data Source and Sample
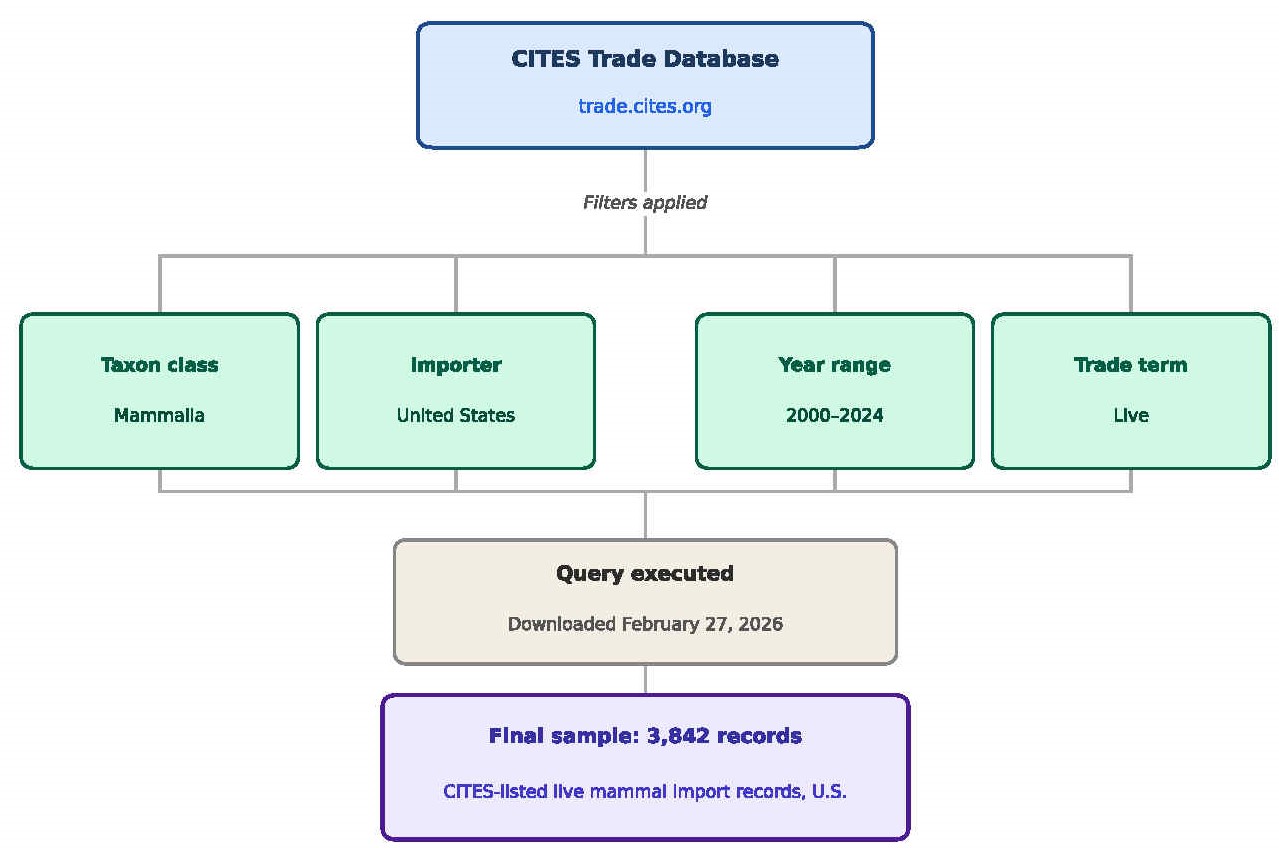
The CITES Trade Database15 (trade.cites.org) was used for publicly accessible wildlife trade records, and the data were downloaded as a .csv file that could be opened and examined as a spreadsheet. The study followed several steps to examine the CITES mammal trade data. The CITES website provided tools to sort through data based on time period, exporters, importers, sources, purposes, trade terms, and species. These filters were used to narrow down the data to only include mammals imported to the United States between 2000 and 2024, as shown in Figure 2 below. The filtered data were downloaded as a CSV file called “SortedCITESData.csv”, which included 3,842 trade records. The dataset was downloaded on February 27, 2026, which reflected a snapshot of the dataset as of the date of collection. When both parties submitted reports for the same trade, and their reports matched on key fields like taxon, year, purpose, source, and trade term, the trade was considered a complete record. It is worth noting that the Unit column was not consistent across all 884 complete records. Most records had blank unit fields, while some showed ‘Number of specimens’. Since both values refer to number of individual animals, they were treated as comparable in this study. When one party submitted the report, but the other party did not, the database generated single-sided entries. When both parties reported but the trade records did not align on the key fields, the database generated two single-sided entries. The Origin field was not used for matching records. The Exporter field was used across the analyses. Timing differences or re-exports may also lead to single-sided entries. This study examined the aggregate reporting discordance instead of shipment-level errors.
Variables
This study used both quantitative and qualitative data, and the quantitative data were more important for answering the research question of how substantial the gaps in tracking data were. Quantitative data included importer-reported quantity, exporter-reported quantity, year of trade, and the calculated difference between importer- and exporter-reported quantities. To compare discrepancies across different categories, qualitative fields including taxon, exporter, origin, purpose, source, and CITES appendix were used to group the records.
Procedure
This study used Jupyter Notebooks and Python libraries to examine the data. Starting from the downloaded CSV file, “SortedCITESData.csv”, the first step was to check the column names, view the first few rows, and count total records. Next, the program calculated how many records were missing the importer- or exporter-reported quantity, and how many had both quantities present. For each category, percentages were calculated to show how much of the data were incomplete. Third, since the discrepancy data did not follow a normal distribution, a series of statistical tests were run to verify the statistical significance of the findings. Finally, various graphs were plotted to visualize the analysis results.
Data Analysis
This study used Jupyter Notebooks as well as Python libraries to examine the data. Python libraries included pandas (to sort and organize data), NumPy (for calculations), Matplotlib (to create charts and graphs), and SciPy (statistical testing).
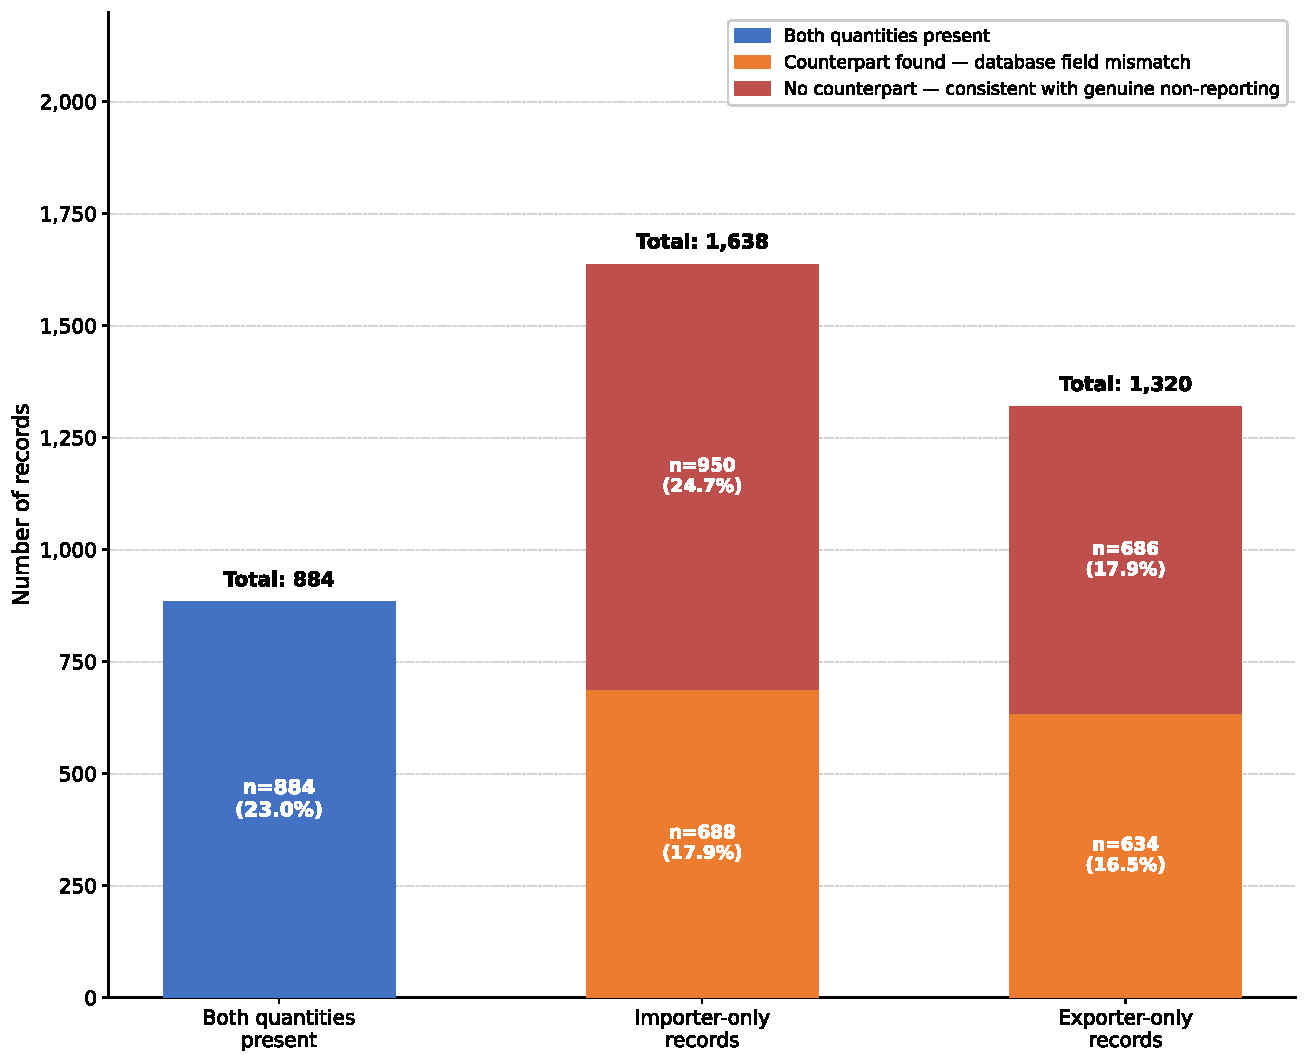
Data analysis was performed in three steps. The first step was looking at the dataset to categorize each data record into three groups: only importer-reported quantity, only exporter-reported quantity, or both importer- and exporter-reported quantities. Single-sided reports were matched with the opposing party’s report based on taxon, exporter, and year. If a matching entry was found, the record was classified as both sides reported but quantities unmatched, else the record was classified as no counterpart found. Then counts and percentages were calculated for each category to show how much of the data were incomplete or inconsistent. A bar chart was created to visualize these three categories with breakdown of missing and mismatch percentages. The exact number of records was labeled on top of each bar. See Figure 3 below.
The second step measured the magnitude and direction of the difference. For the 884 records that had both importer and exporter quantities, the program counted how many records matched exactly and how many differed. For the records with mismatched quantities, the difference (importer quantity minus exporter quantity) was calculated to test the direction of the disagreement, while the absolute difference was also calculated to quantify the size of disagreements.
In the third step, a series of analyses was performed to test whether the discrepancies were statistically significant. Table 1 describes each test and its purpose.
| Method | Purpose |
| One-sample t-test | Test whether the mean difference between the importer and exporter reported quantities was significantly different from zero |
| Bootstrap CI (10,000 resamples) | Resample data 10,000 times to build a more reliable confidence interval since the discrepancy data contains many zeros and a few large differences |
| Wilcoxon signed-rank test | Rank results based on absolute value to confirm t-test result without assuming normal distribution |
| Sign test | Count how many times the exporter reported higher quantities than importers |
| Winsorization (1st–99th percentile) | Exclude the top and bottom 1% of values to reduce influence of extreme outliers on the results |
| Grouped bootstrap (exporter-species-year level) | Since some records share the same exporter, species, and year, they were grouped before resampling to avoid repeated records producing non-independent results |
| Cohen’s d | Calculate the discrepancy size in standard units to measure the practical size of the effect and not just a statistical number |
| Stratified summaries | Compare mean absolute differences grouped by taxon, source, purpose, and exporter to measure data discrepancy in different groups |
Ethical Considerations
This study analyzed publicly available data from the CITES Trade Database for research purposes only. No human participants or animal subjects were involved. The data were used without modification to measure statistical trends. No personal or sensitive information was released. The author received no external funding.
Results
Data Completeness
This study collected a total of 3,842 records. The CITES database grouped records from both parties with reported quantities for the same trade instance into a single entry. Only 884 records (23%) resulted in a single entry, identified as a complete record. The remaining 2,958 records (77%) had only one party’s reported quantity. For the single-sided records, some had no counterpart at all, indicating non-reporting; others had a counterpart entry in the opposite group but with mismatched field values. There were 1,638 importer-only records, and 950 records of them had no counterpart. Among the 1,320 exporter-only records, 686 records had no counterpart. Figure 3 classifies the discrepancies by group.
Directional Analysis
For the 884 complete records, 471 records (53.3%) matched exactly. In 291 records (32.9%), the exporter reported higher quantities, while in the remaining 122 records (13.8%), the importer reported higher. The fact that exporters often reported higher suggested a real directional pattern.
Summary Statistics
Subtracting exporter quantities from importer quantities across all 884 complete records resulted in a mean difference of -201.27 animals (SD = 1,019.65). The negative value of the average represented that most of the time, exporters reported more than importers. To focus more on the actual size of discrepancies, the mean absolute difference was calculated, which resulted in an average absolute difference of 244.73 animals. Table 2 summarizes these numbers.
Statistical Significance
A one-sample t-test (t(883) = -5.87, p < 0.001, 95% CI [-268.6, -134.0]) confirmed that the pattern of exporters reporting higher quantities than importers was real, and there was less than 0.1% chance that this pattern happened by random chance. Cohen’s d = -0.20 indicated that even though the mean difference was statistically significant, the effect size was small. The gaps were not evenly distributed across all records. A small number of extreme records pushed the average difference higher.
Several additional tests were conducted to further verify the findings from the t-test. The Wilcoxon signed-rank test (W = 21,468, p < 0.001) confirmed the direction was real even without assuming normal distribution. A sign test on the 291 exporter-higher versus 122 importer-higher records (p < 0.001) confirmed exporters reported higher quantities more often than importers. The bootstrap 95% CI for the mean (10,000 resamples) of [-272.9, -137.7] closely matched the t-test CI of [-268.6, -134.0], confirming the result was reliable. The grouped bootstrap at the exporter-species-year level (783 groups) resulted in a 95% CI of [-275.7, -133.0] and t(782) = -5.62, p < 0.001, confirming the result held even when accounting for repeated exporter-species-year records.
| Statistic | Value |
| Records analyzed (both quantities present) | 884 |
| Records with exporter qty > importer qty | 291 (32.9%) |
| Records with importer qty > exporter qty | 122 (13.8%) |
| Records with equal quantities | 471 (53.3%) |
| Mean difference (importer minus exporter) | -201.27 animals |
| SD of difference | 1,019.65 |
| Mean absolute difference | 244.73 animals |
| t-statistic (one-sample t-test vs. 0) | -5.87 |
| p-value | <0.001 |
| Effect size (Cohen’s d) | -0.20 (small) |
| Median difference (importer minus exporter) | 0.00 animals |
| Bootstrap 95% CI for median | [0.00, 0.00] |
| Bootstrap 95% CI for mean | [-272.9, -137.7] |
| Grouped bootstrap 95% CI (exporter-species-year level) | [-275.7, -133.0], t(782) = -5.62, p < 0.001 |
Scatter Plot Analysis
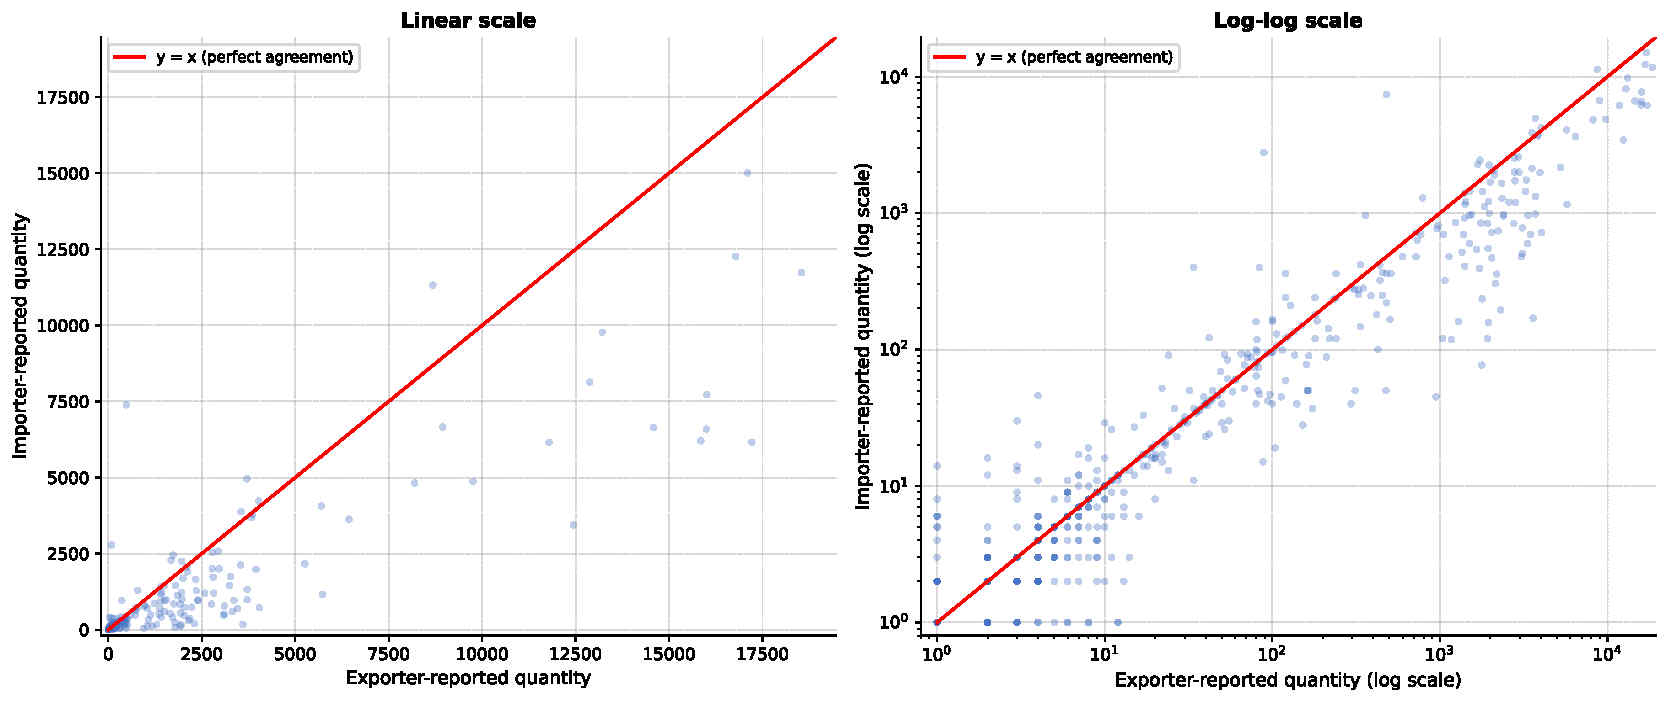
Figure 4 shows the scatter plot on both linear and log-log scales to visualize the size of discrepancies between the importer- and exporter-reported quantities for all 884 complete records. The exporter-reported quantities are graphed on the x-axis, and the importer-reported quantities are graphed on the y-axis. A y = x line in red indicates values that have equal importer- and exporter-reported quantities. The points below the red line represent exporter-reported higher quantities, while points above the line represent the opposite. A large portion of points deviate from the reference line. A cluster of points at the left corner of the linear scatter plot indicates that most trade gaps were small, but there were a few outliers with significant differences. This is consistent with the statistical finding that exporters reported higher quantities more often than importers.
Distribution of Discrepancy Magnitudes
Since 471 out of the 884 complete records (53.3%) matched exactly, the median difference across all complete records was zero. This indicated exact agreement was the most common outcome, meaning the current system was working correctly for routine trades.
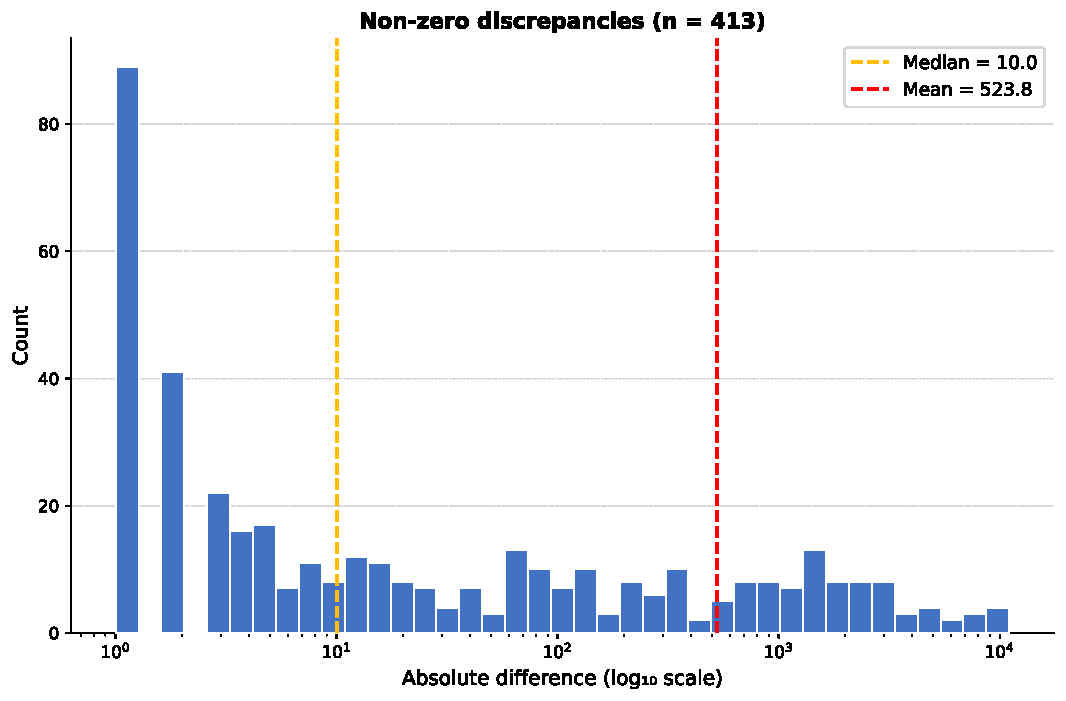
A closer look at the discrepancies showed a distribution of reporting failures. Figure 5 plots non-zero discrepancies (n = 413) on a logarithmic scale. The x-axis shows the absolute difference on a log scale, and the y-axis shows the count of records. The median was 10 animals, and the mean was 523.8 animals. Consistent with prior findings, the magnitude of most discrepancies was small; however, a small number of extreme records skewed the mean significantly higher.
The discrepancy analysis suggested that a large portion of trades were reported correctly. While many non-matching records existed, most of the inconsistencies were small; the major gaps existed in a small number of trades. The small reporting errors were likely caused by data-entry inconsistency or natural loss during transport. The extreme discrepancies may have reflected systematic deficiencies. The specific causes for the reporting failures were beyond the scope of this study.
Highest-Discrepancy Records
Table 3 showed the top 10 records with the largest absolute reporting difference. All of these records belonged to Macaca fascicularis (long-tailed macaques). 9 out of 10 were exported from China for scientific purposes, and one from Mauritius for medical use.
| Year | Taxon | Exporter | Purpose | Source | Importer qty | Exporter qty | Difference |
| 2008 | Macaca fascicularis | China | Scientific | Captive-bred | 6,159 | 17,214 | -11,055 |
| 2009 | Macaca fascicularis | China | Scientific | Captive-bred | 6,204 | 15,853 | -9,649 |
| 2015 | Macaca fascicularis | China | Scientific | Captive-bred | 6,590 | 15,997 | -9,407 |
| 2013 | Macaca fascicularis | China | Scientific | Captive-bred | 3,441 | 12,437 | -8,996 |
| 2007 | Macaca fascicularis | China | Scientific | Captive-bred | 7,720 | 16,010 | -8,290 |
| 2010 | Macaca fascicularis | China | Scientific | Captive-bred | 6,638 | 14,581 | -7,943 |
| 2024 | Macaca fascicularis | Mauritius | Medical | Born in captivity | 7,388 | 480 | +6,908 |
| 2014 | Macaca fascicularis | China | Scientific | Captive-bred | 11,730 | 18,543 | -6,813 |
| 2006 | Macaca fascicularis | China | Scientific | Captive-bred | 6,152 | 11,790 | -5,638 |
| 2012 | Macaca fascicularis | China | Scientific | Captive-bred | 4,872 | 9,753 | -4,881 |
The fact that most of the extreme discrepancies were concentrated in Macaca fascicularis trades exported from China suggested that trade reporting failures were likely a regulatory issue with a small number of countries rather than a widespread system failure.
Sensitivity Analysis
Table 4 summarizes the results with the full dataset versus excluding extreme records. Winsorizing at the 1st and 99th percentiles resulted in a mean of −183.43 animals (t(883) = -7.59, p < 0.001). Excluding the top 5% by absolute difference dropped the mean to −41.28 animals (t(838) = -5.59, p < 0.001). In both cases, the results showed the discrepancies remained statistically significant.
| Analysis | N | Mean difference | SD | t-statistic (p-value) |
| Full dataset | 884 | -201.27 | 1,019.65 | t(883) = -5.87, p < 0.001 |
| Winsorized (1st-99th percentile) | 884 | -183.43 | 718.66 | t(883) = -7.59, p < 0.001 |
| Top 5% outliers excluded | 839 | -41.28 | 214.04 | t(838) = -5.59, p < 0.001 |
Stratified Analysis by Taxon, Source, and Purpose
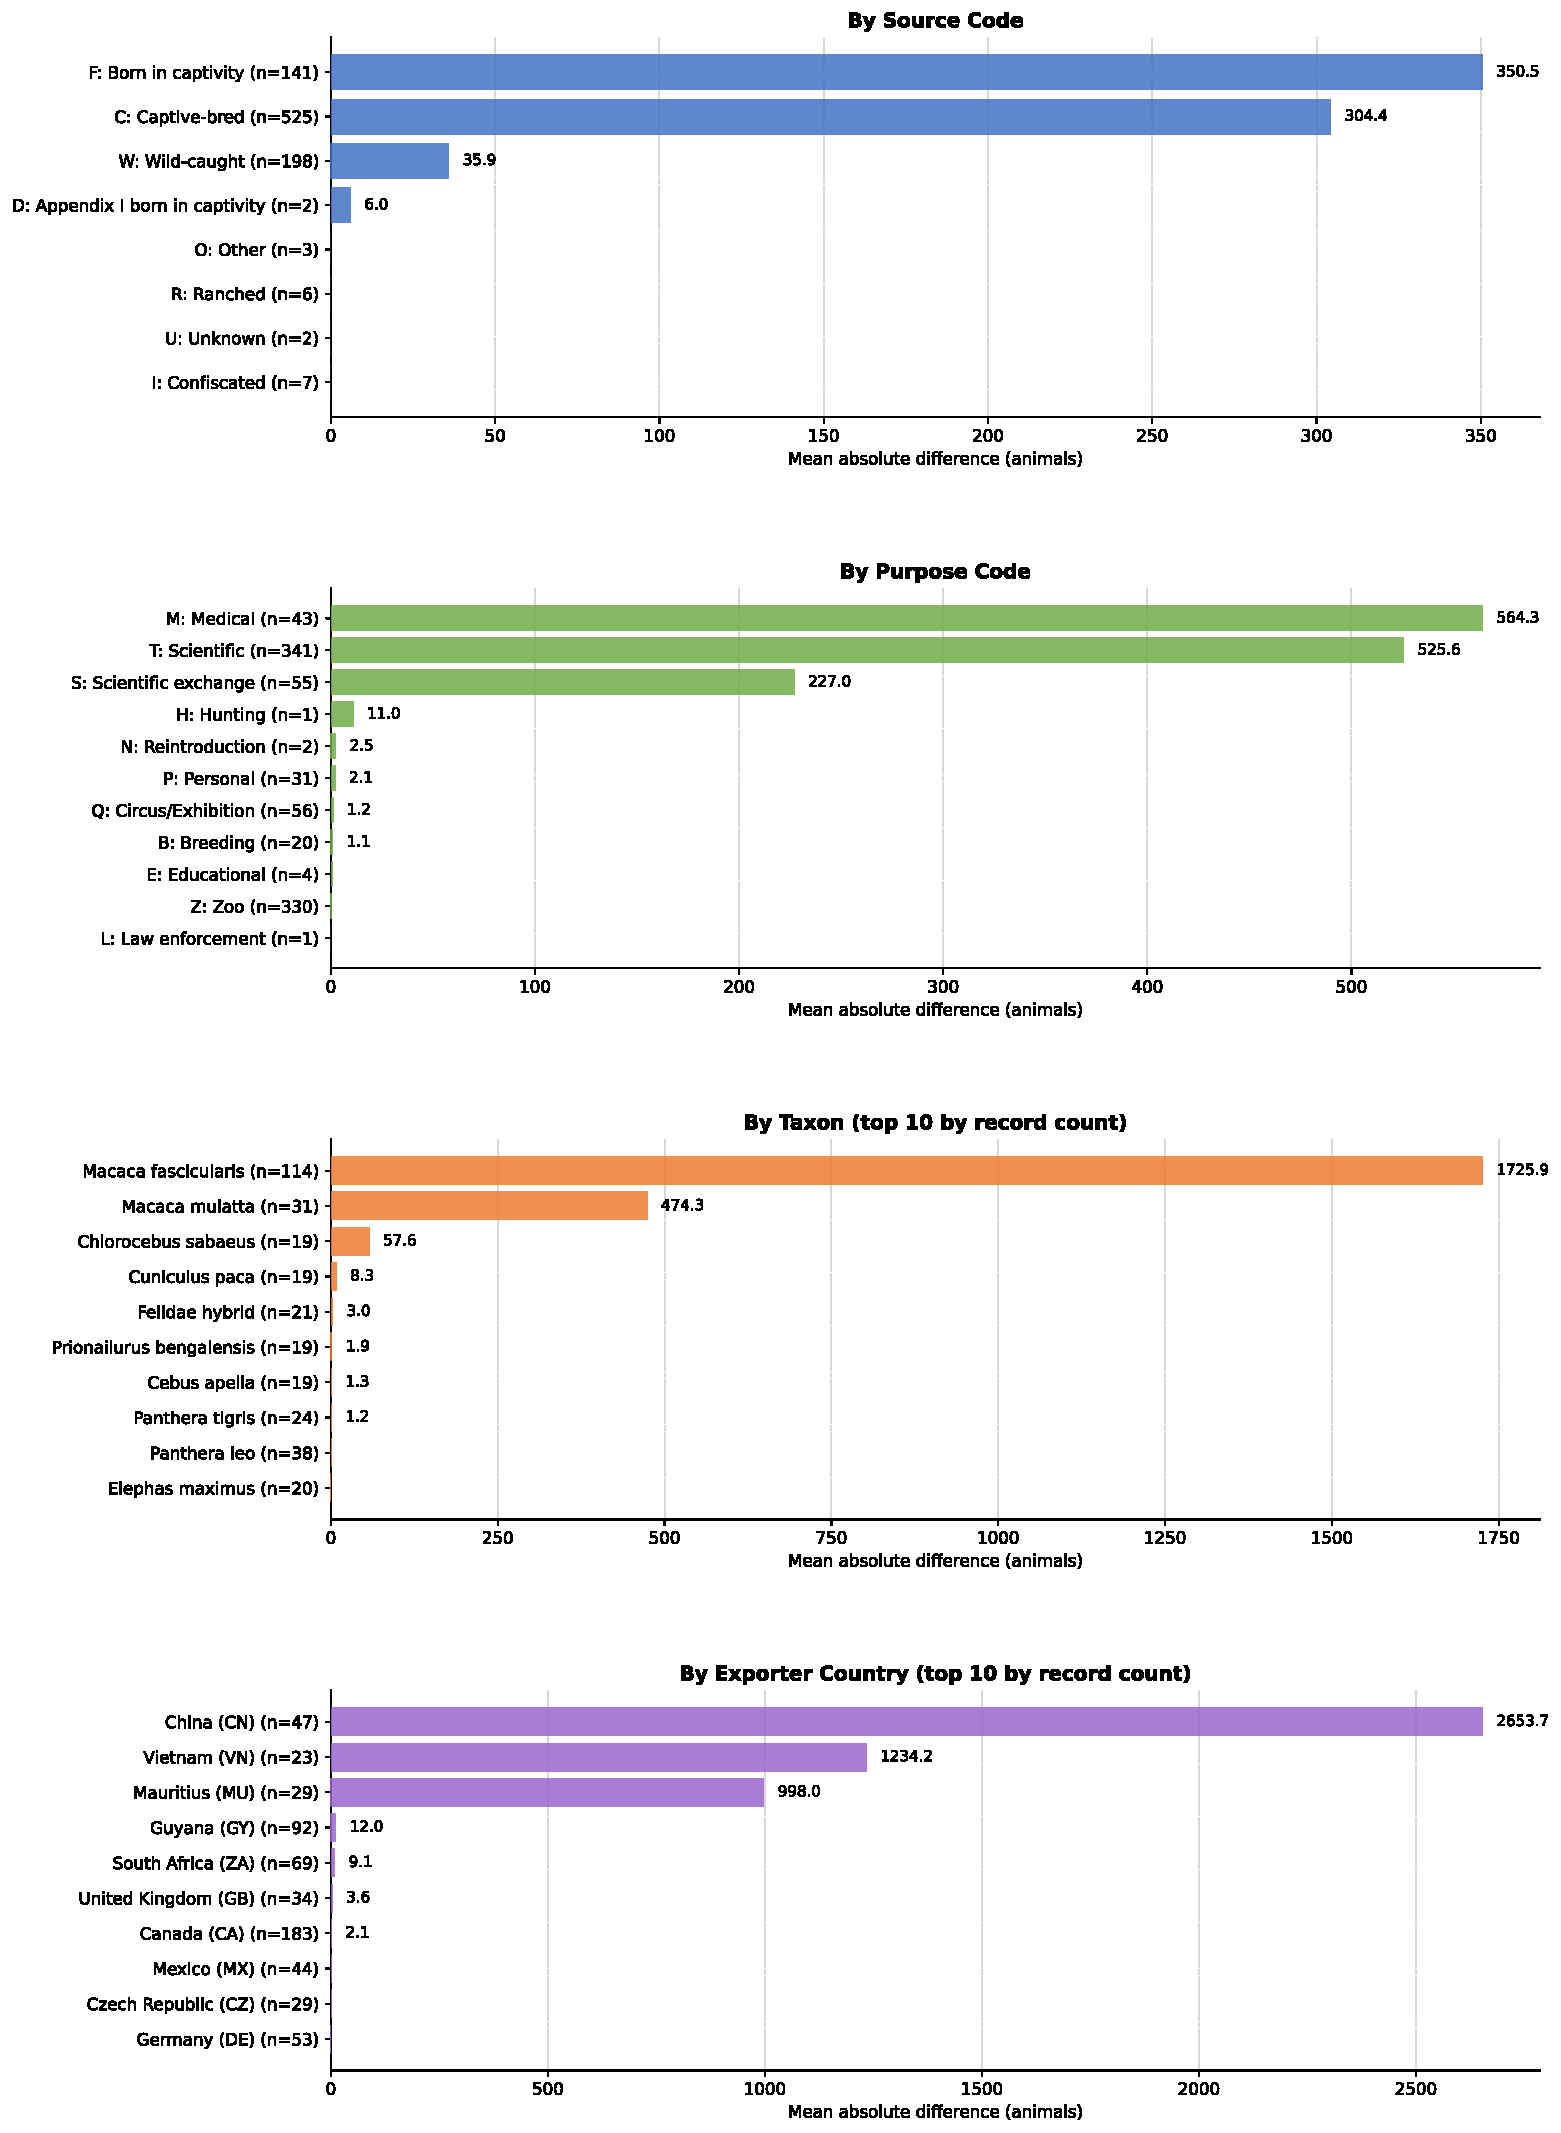
Figure 6 shows stratified analysis by source, purpose, taxon, and exporter. For each category, top 10 subgroups with highest record count are drawn. The mean absolute differences are represented by horizontal bars. Group name and record counts were labeled next to each bar. The figure reveals that reporting gaps were concentrated in specific subgroups.
- By source: Records coded F (Born in captivity, n = 141, 350.5 animals) showed the largest mean absolute difference. Records coded C (Captive-bred, n = 525, 304.4 animals) was a close second.
- By purpose: Records coded M (Medical, n = 43, 564.3 animals), T (Scientific, n = 341, 525.6 animals), and S (Scientific exchange, n = 55, 227.0 animals) had significantly more differences than all other groups, showing medical and scientific areas lacked reporting consistency.
- By taxon: Macaca fascicularis (n = 114, 1,725.9 animals) had the largest mean absolute difference, more than all other taxa combined.
- By exporter country: China (CN, n = 47, 2,653.7 animals) had the highest mean absolute difference, substantially higher than all other exporters.
Temporal Trends in Reporting Discrepancies
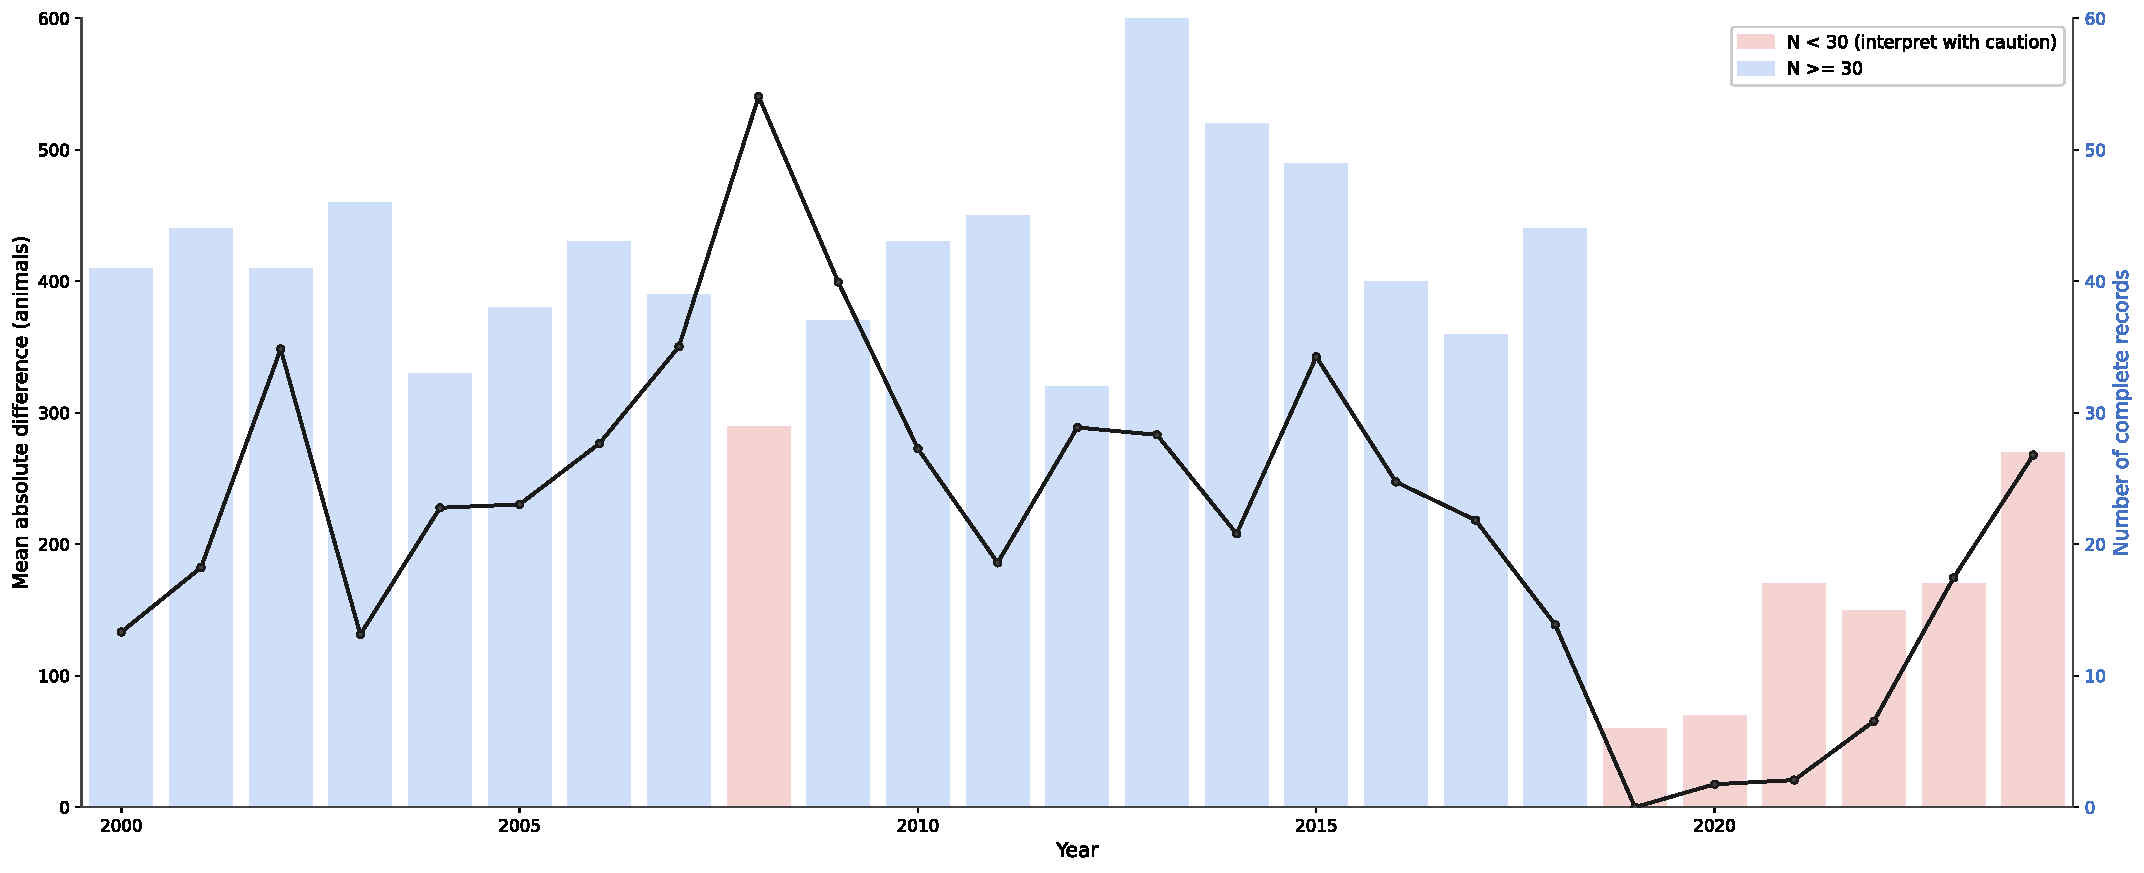
Figure 7 shows the mean absolute difference per year from 2000 to 2024 and the annual count of complete records. The black line represents the mean absolute difference. The background bars indicate the number of complete records. For years with fewer than 30 records, the bars are colored in red to flag that the results should be interpreted with caution. The small mean absolute difference (< 30 records) may have reflected the influence of one or two trade events rather than a broader pattern. Discrepancy levels fluctuated substantially from year to year. Most notably, in 2008, there was a spike in the mean absolute difference, which coincided with the financial crisis. A possible explanation is that during the financial crisis, some institutions may have been disrupted in trade reporting activities. It should be noted that the number of complete records in 2008 was below 30, so the variance may have been caused by a few outliers. The figure also shows that 2019 and 2020 had the lowest number of records, corresponding to the COVID-19 pandemic period. The number of records and the mean absolute difference both trended up from 2019-2020 lows and reached a local high in 2024. It is likely that as trade activities resumed after the pandemic, the discrepancy in reporting grew proportionally. The reporting gaps persisted throughout the entire period from 2000 to 2024. There was no clear downward trend, which suggested that the current regulatory system was not sufficient to enforce consistent tracking.
Geographic Patterns in Reporting Failures
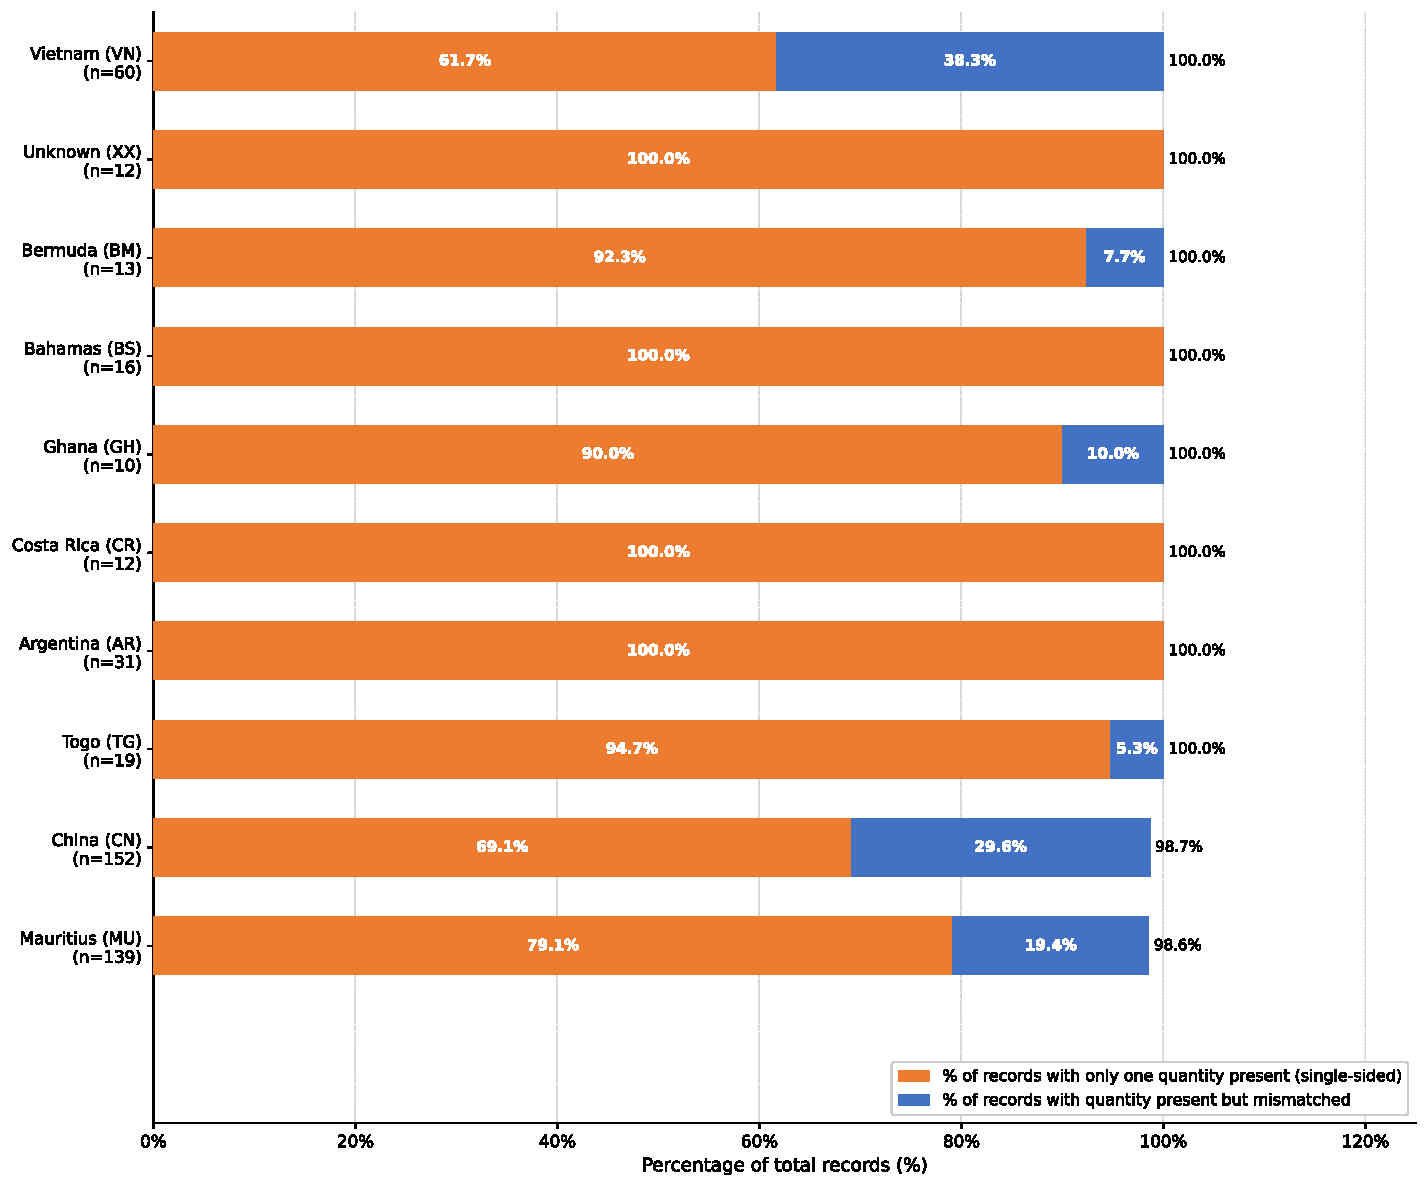
Figure 8 displays the top 10 exporting countries with the highest rates of combined single-sided and mismatched records. The percentage of single-sided versus mismatched records is shown orange and blue bar respectively. The number of total records is labeled near the y-axis. The exporter field records the country that issued the export permit, which may not be the same as the country of origin. The Unknown (XX) category means the country of origin was unknown. This poses a significant challenge to traceability and surveillance, which should be brought to the attention of the international wildlife trade organizations. Togo (TG, n = 19) and Ghana (GH, n = 10) had only one complete record each, so their discrepant percentages reflected a single trade event and should be interpreted with caution. A total of 4 out of the 10 countries had 100% single-sided reporting, indicating a complete absence of exporter-side reporting. Compared to mismatched records, which could be caused by reporting error, single-sided records indicate genuine non-reporting from one trade partner, which is a more fundamental reporting failure. Among the nations with more than 50 total records, Vietnam (VN, n = 60), China (CN, n = 152), and Mauritius (MU, n = 139) had a high rate of misreporting. Given the substantial number of records involved, these figures suggest potential weaknesses in trade reporting practices in these countries. Prior research has found that mammals in wildlife trade carry a disproportionate share of known zoonotic viruses, highlighting the public health significance of reporting gaps in high-volume trading countries2.
Discussion
Restatement of Key Findings
This study examined discrepancies in live mammal import tracking for the United States by analyzing CITES Trade Database records from 2000 to 2024. This was done to quantify the extent of gaps in the tracking system. Poor tracking was represented in two ways. Firstly, many trade records were incomplete, lacking importer-reported quantities, exporter-reported quantities, or both. Of the 3,842 total records, only 884 records (23%) were complete; the remaining 77% had only one party’s reported quantity. Secondly, many complete records had mismatched values. Among the 884 complete records, only 471 (53.3%) records had matched quantities, and the remaining 413 (46.7%) had missing or discrepant values. The mean absolute difference was about 245 animals per trade event, and exporters reported higher quantities more often than importers. The pattern was statistically significant (p < 0.001), and additional sensitivity analyses confirmed it was robust. This study also identified subgroups with the largest discrepancies, which indicated that the discrepancies were not uniformly distributed.
Interpretation of Findings
This study found that current tracking systems failed to provide consistent and accurate data for live mammal imports into the U.S. Although not covered through the data analysis, a quick scan of the sample trade records also revealed other missing data points that were unaccounted for in this study. An example of a commonly missing data point was a categorization of the animal being transported. The mis-categorization could be caused by limited resources, inadequate standardized digital infrastructure, or a lack of trained personnel to ensure accurate classification at the point of shipment. Missing categories might also arise from human error during manual data entry or, in some cases, the intentional omission of identifiers to evade regulatory scrutiny.
There was a pattern of exporters typically reporting more than importers. This was understandable because there were likely losses of animals during transport. However, larger differences between the two were difficult to explain by just attributing it to occurrences during transport. Through the literature review and data analysis, it was evident that mismatched data was not a coincidence or rare occurrence. The CITES database relies on a dual-reporting system which requires both parties to report independently. However, some countries may lack the infrastructure, systems, or resources to be able to invest heavily into properly tracking their animal trade7,23. Some discrepancies may also be from deliberate misreporting to hide illegal activity or smuggling20,23, while others could result from simple human errors when transferring handwritten records to digital databases. The high number of missing data points suggested that many countries did not prioritize CITES reporting or lacked the ability to submit complete trade information24,25. These issues were systemic and showed how problems identified in this study were not just individual incidents but instead reflected fundamental weaknesses in the regulation and dual-reporting systems as a whole.
Implications and Significance
Through this study, it is evident that current CITES live mammal tracking data are insufficient and inaccurate. This is reflected in an average difference of approximately 245 animals per trade. Results from this study aligned with Blundell and Mascia, who identified documentation discrepancies as a prevalent issue in CITES trade data for Appendix I and II species exported from Africa17. These findings are important for the broader context of wildlife conservation and public health. The CITES Database is the primary tracking system used internationally, especially for endangered species. Data that contains this level of inaccuracy raises questions about the effectiveness of the regulations that govern this system. Wildlife conservation laws based on this data may rest on an inaccurate understanding of animal trade trends, making this issue important to lawmakers. Risk to public health is also a concern, as the correlation between zoonotic disease outbreaks and poor tracking has been documented in prior research. Prevention of outbreaks requires proper screening, quarantining, and more, but with a substantial number of animals entering or leaving countries unaccounted for, possibility for disease spread and even illegal activity arise. These gaps can pose a danger to the public, requiring action.
Connection to Objectives
The statistical and descriptive analyses addressed the two research questions stated at the outset of this paper. First, this study found that a large portion of reports had missing or incomplete records. Among the total 3,842 records studied, 1,636 records (42.6%) were single-sided without a corresponding report from the other party; 1,322 records (34.4%) had both parties reporting but records were unmatched. Second, multiple statistical tests and sensitivity analyses, including a one-sample t-test, Wilcoxon signed-rank test, sign test, and bootstrap analyses, confirmed that the pattern was a recurring issue rather than random noise.
Recommendations
Due to the serious consequences of the lack of accurate and consistent tracking, future research is necessary. Examining animal trade outside of this study’s sample size could provide more insight into the quality of data. Data completeness could be sorted by importer/exporter to identify which parties report most completely and accurately. The progression of data completeness over time could also be quantified, to determine whether data quality has improved over time and whether new regulations have had an effect. From a policy perspective, it is evident that wildlife trade tracking and outbreak prevention measures need to be more heavily enforced, possibly by establishing protocols or built-in CITES flagging systems to confirm mismatched quantities. Some examples of protocols could be stricter logging of data by both parties or designating receivers of shipments to verify quantities and information.
Limitations
This study has several limitations. First, the analysis is restricted to legally recorded trade in the CITES database; illegal trades are not included in the research. Second, this study only examines the U.S. live mammal import records in the CITES database between 2000 and 2024. It does not inspect other periods, taxonomic groups, or importing nations. Third, the descriptive and statistical analyses established the existence and patterns of discrepancies but could not determine their specific causes. Fourth, the geographic analysis was restricted to exporters with 10 or more records, as results for low-volume exporters could be skewed by one or two trade events. Fifth, trade record matching was based only on taxon, exporter, and year; permit-level data would be needed for a more definitive classification.
Closing Thought
By examining U.S. live mammal import records between 2000 and 2024, this study quantified the failures of current tracking systems and used a simple, replicable data analysis approach for analyzing other samples of the CITES database, possibly helping future efforts to fill the gaps in international trade tracking.
The international community has spent decades building a wildlife trade monitoring system, but this study found that the current system did not work effectively. Data discrepancies were a recurring pattern over the study period, and misreporting was concentrated in a few wildlife trading hubs. The international community should collaborate on designing more effective policies, enforcing regulations across national borders, and improving technologies to reduce the risk of the next zoonotic disease outbreak.
Acknowledgments
The author thanks Karen Logue for reading drafts of this paper and providing valuable feedback to help refine it, and Ellen Mecklenburg for advising on the research methodology and providing suggestions to improve the manuscript.
Appendix: Citation-Support Matrix
| Major Claim | Ref # | Evidence |
| 1.25 million people died from tuberculosis worldwide in 2023; leading cause of death from single infectious agent | 1 | Reports 2023 TB death |
| 37 million live amphibians, birds, mammals, and reptiles were legally imported to the United States from 163 countries between 2000 and 2004 | 2,11 | Jenkins reports the 37 million number |
| Animals imported for commercial trade represent substantial risk to human health | 2 | Direct quote from paper |
| Wildlife trade linked to spread of tuberculosis, rabies, and anthrax | 2,3 | Both document zoonotic diseases in wildlife trade |
| Without reliable trade data, impossible to know which routes pose greatest disease risk | 3,5 | Both discuss how data gaps limit risk assessment |
| Systematic reporting discrepancies identified in the CITES database | 4,12,14 | All three found mismatches in CITES records |
| Some countries may lack the infrastructure, systems, or resources to properly track their animal trade | 2,7 | Both discuss capacity limitations |
| Some discrepancies may be due to deliberate misreporting to hide illegal activity or smuggling | 5,7 | Both discuss overlap between legal and illegal trade |
| Many countries did not prioritize CITES reporting or lacked the ability to submit complete trade information | 8,9 | Bush studied exotic pet trade; Olsen studied 36 years of U.S. wildlife trade |
| One-quarter of traded mammals carry three-quarters of known zoonotic viruses | 10 | Worldwide study on mammal trade and zoonotic risk |
| Regulatory frameworks are key for reducing zoonotic disease risk | 25 | Scoping review on trade regulations and disease prevention |
| Scale and patterns of global CITES-listed wildlife trade | 13,17 | Both tracked wildlife trade volumes and quota compliance |
| Importing animals can introduce new diseases to a country | 18,19,22,23 | All studied disease transmission in wildlife trade |
| SARS, MERS, and COVID-19 demonstrated that human-animal interaction can pose serious risks to public health | 20,21,24 | All linked pandemic diseases to wildlife-human contact |
| Whether countries follow CITES trading policies | 15,16 | Both checked CITES compliance and enforcement |
References
- GBD 2023 TB HIV Collaborators. Global, regional, and national burden of tuberculosis and multidrug-resistant tuberculosis by HIV status, 1990-2023: a systematic analysis for the Global Burden of Disease Study 2023. The Lancet Infectious Diseases. 2026, https://doi.org/10.1016/S1473-3099(26)00295-1. [↩] [↩]
- K. N. Shivaprakash, S. Sen, S. Paul, J. M. Kiesecker, K. S. Bawa. Mammals, wildlife trade, and the next global pandemic. Current Biology. Vol. 31, pg. 3671-3677, 2021, https://doi.org/10.1016/j.cub.2021.06.006. [↩] [↩] [↩] [↩] [↩] [↩]
- W. B. Karesh, et al. Ecology of zoonoses: natural and unnatural histories. The Lancet. Vol. 380, pg. 1936-1945, 2012, https://doi.org/10.1016/S0140-6736(12)61678-X. [↩] [↩] [↩]
- B. A. Han, et al. Undiscovered bat hosts of filoviruses. PLOS Neglected Tropical Diseases. Vol. 10, pg. e0004815, 2016, https://doi.org/10.1371/journal.pntd.0004815. [↩] [↩]
- K. F. Smith, et al. Reducing the risks of the wildlife trade. Science. Vol. 324, pg. 594-595, 2009, https://doi.org/10.1126/science.1174460. [↩] [↩] [↩]
- G. Brearley, et al. Wildlife disease prevalence in human-modified landscapes. Biological Reviews. Vol. 88, pg. 427-442, 2013, https://doi.org/10.1111/brv.12009. [↩]
- N. Marano, P. M. Arguin, M. Pappaioanou. Impact of globalization and animal trade on infectious disease ecology. Emerging Infectious Diseases. Vol. 13, pg. 1807-1809, 2007, https://doi.org/10.3201/eid1312.071276. [↩] [↩] [↩] [↩] [↩] [↩]
- P. T. Jenkins, K. Genovese, H. Ruffler. Broken screens: the regulation of live animal imports in the United States. Defenders of Wildlife, 2007. http://www.defenders.org/publications/broken_screens_report.pdf. [↩] [↩] [↩]
- M. Harfoot, et al. Unveiling the patterns and trends in 40 years of global trade in CITES-listed wildlife. Biological Conservation. Vol. 223, pg. 47-57, 2018, https://doi.org/10.1016/j.biocon.2018.04.017. [↩] [↩]
- P. Daszak, A. A. Cunningham, A. D. Hyatt. Emerging infectious diseases of wildlife: threats to biodiversity and human health. Science. Vol. 287, pg. 443-449, 2000, https://doi.org/10.1126/science.287.5452.443. [↩] [↩]
- S. S. Morse, et al. Prediction and prevention of the next pandemic zoonosis. The Lancet. Vol. 380, pg. 1956-1965, 2012, https://doi.org/10.1016/S0140-6736(12)61684-5. [↩] [↩]
- J. C. Cantlay, et al. Illegal wildlife trade and emerging infectious diseases. Animals. Vol. 11, pg. 1821, 2021, https://doi.org/10.3390/ani11061821. [↩] [↩]
- D. W. S. Challender, et al. Evaluating the feasibility of harvest quotas and trade regulation for a globally threatened tortoise. Global Ecology and Conservation. Vol. 20, pg. e00768, 2019, https://doi.org/10.1016/j.gecco.2019.e00768. [↩] [↩]
- E. V. Bragina, et al. International wildlife trade quotas are characterized by high compliance and coverage but insufficient adaptive management. Nature Ecology and Evolution. Vol. 8, pg. 2048-2057, 2024, https://doi.org/10.1038/s41559-024-02531-4. [↩] [↩] [↩]
- CITES. CITES trade database. Convention on International Trade in Endangered Species of Wild Fauna and Flora. https://trade.cites.org/. Accessed February 27, 2026. [↩] [↩] [↩]
- A. Pavitt, et al. Weighing the importance of CITES trade data relative to other sources of information. Biological Conservation. Vol. 235, pg. 134-141, 2019, https://doi.org/10.1016/j.biocon.2019.04.026. [↩] [↩] [↩]
- A. G. Blundell, M. B. Mascia. Discrepancies in reported levels of international wildlife trade. Conservation Biology. Vol. 19, pg. 2020-2025, 2005, https://doi.org/10.1111/j.1523-1739.2005.00253.x. [↩] [↩] [↩]
- J. E. Kolby, J. K. Reaser. Elucidating discrepancies among reported wildlife trade. One Health. Vol. 17, pg. 100686, 2024, https://doi.org/10.1016/j.onehlt.2024.100686. [↩] [↩]
- B. I. Pavlin, L. M. Schloegel, P. Daszak. Risk of importing zoonotic diseases through wildlife trade, United States. Emerging Infectious Diseases. Vol. 15, pg. 1721-1726, 2009, https://doi.org/10.3201/eid1511.090467. [↩] [↩] [↩]
- J. S. Sinclair, O. C. Stringham, B. Udell, N. E. Mandrak, B. Leung, C. M. Romagosa, et al. The international vertebrate pet trade network and insights from US imports of exotic pets. BioScience. Vol. 71, pg. 977-990, 2021, https://doi.org/10.1093/biosci/biab056. [↩] [↩] [↩]
- D. W. S. Challender, D. C. MacMillan. Poaching is more than an enforcement problem. Conservation Letters. Vol. 7, pg. 484-494, 2014, https://doi.org/10.1111/conl.12082. [↩] [↩]
- K. Gruetzmacher, et al. Preventing zoonotic spillover through regulatory frameworks governing wildlife trade: a scoping review. PLOS ONE. Vol. 20, pg. e0312012, 2025, https://doi.org/10.1371/journal.pone.0312012. [↩] [↩]
- K. M. Smith, C. C. Machalaba, H. Jones, P. Caceres, M. Popovic, K. J. Olival, et al. Wildlife hosts for OIE-listed diseases: considerations regarding global wildlife trade and host-pathogen relationships. Veterinary Medicine and Science. Vol. 3, pg. 71-81, 2017, https://doi.org/10.1002/vms3.64. [↩] [↩] [↩]
- E. R. Bush, S. E. Baker, D. W. Macdonald. Global trade in exotic pets 2006-2012. Conservation Biology. Vol. 28, pg. 663-676, 2014, https://doi.org/10.1111/cobi.12240. [↩] [↩]
- M. T. B. Olsen, J. Geldmann, M. Harfoot, D. P. Tittensor, B. Price, P. Sinovas, et al. Thirty-six years of legal and illegal wildlife trade entering the USA. Oryx. Vol. 55, pg. 432-441, 2021, https://doi.org/10.1017/S0030605319001169. [↩] [↩]