Abstract
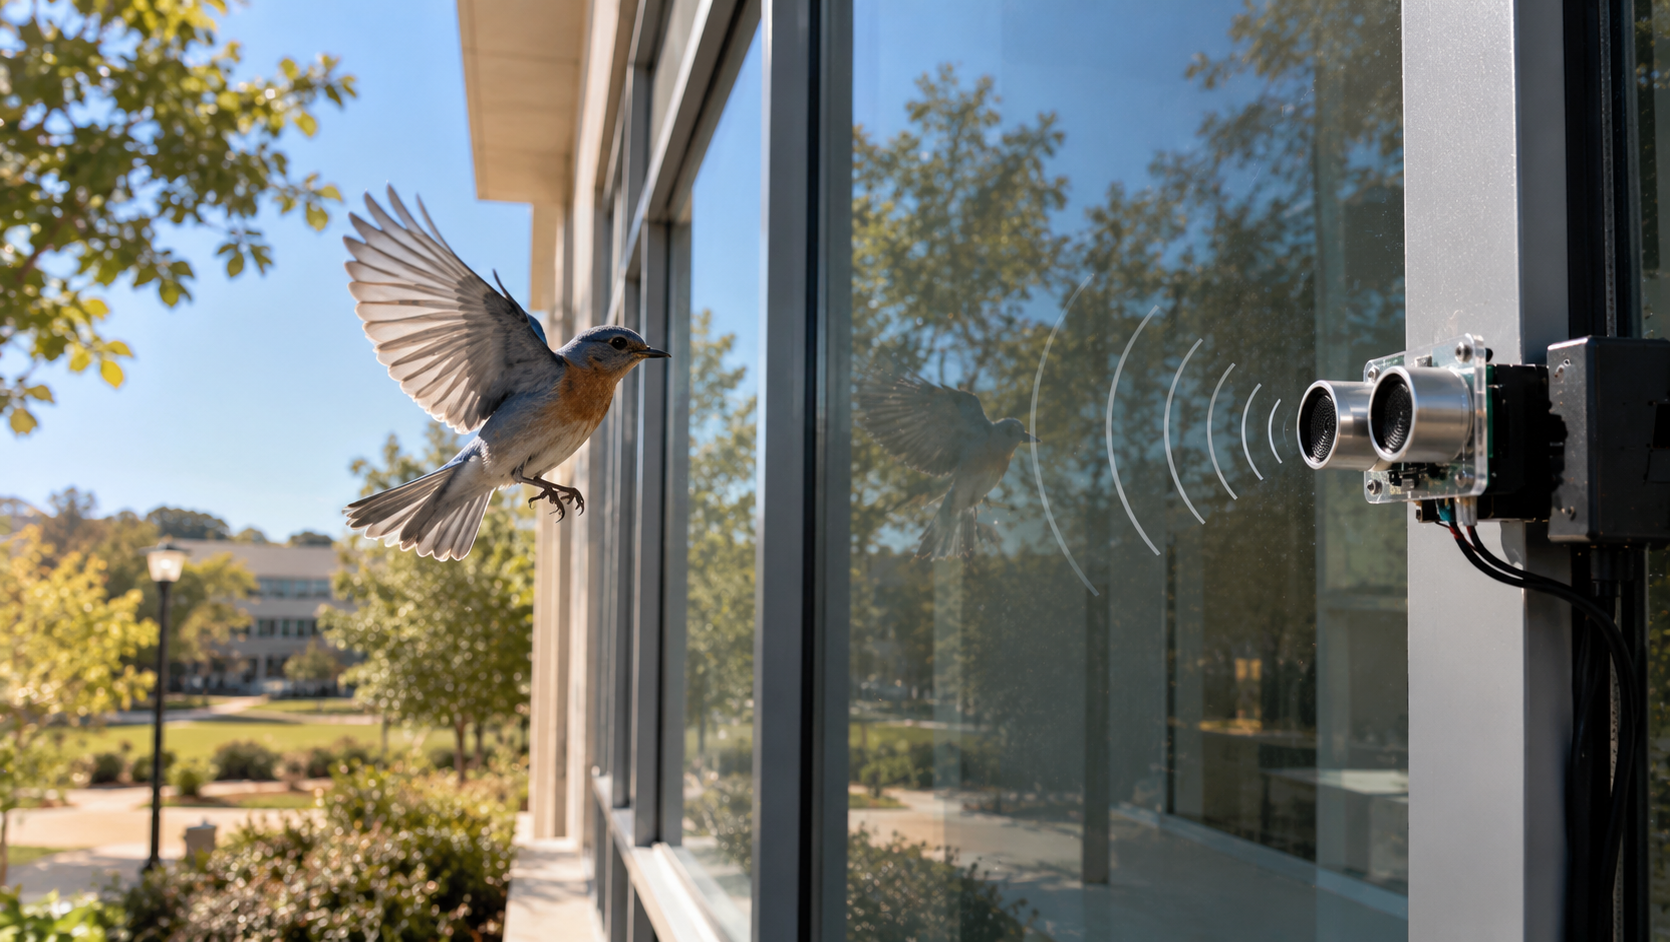
Hundreds of millions of birds are estimated to be killed each year by flying into the windows of buildings across America. Passive protective measures such as decals and patterned films have been used to protect birds; however, their use is inconsistent. Sensor-based active mitigation systems are being evaluated in wind-energy facilities, but their application to building glass is less established. Combining with a descriptive photographic survey of urban façades, we present a design of a configurable ultrasonic time-to-collision (TTC) trigger prototype for optical warnings. The proposed design uses ultrasonic distance measurements to estimate the radial closing speed of an object and then computes the TTC value based on the estimated speed. When the TTC value falls at or below a predetermined threshold, a visual warning signal is activated. Eight low-speed trials have shown that as we increase the size of the estimation window from 3 to 20 readings, mean within-trace speed-estimate variability is reduced by approximately 85% (from 1.49 m/s to 0.23 m/s). Using the manufacturer’s recommended lower bound for optimistic interval measurements of 60 milliseconds, this increases the minimum buffer fill time from 120 milliseconds to 1.14 seconds over the same window range. The experimental results show that the maximum sampling rate of this sensor is a primary design constraint with a hardware-specific trade-off between estimator smoothing and response latency. Performance evaluations of the proposed prototype for real-world applications need to be investigated further.
Keywords: Bird-Glass Collision, Time-to-Collision, Ultrasonic Sensor, Velocity Estimation, Façade Survey, Avian Warning
Introduction
Bird-glass collisions pose a major threat to many species of birds and account for a major cause of human-caused avian mortality1,2. Approximately 365 to 988 million birds die each year due to building collisions in the United States1. Despite high-rise buildings having the highest collision rates per building, they make up less than 1% of all bird deaths since they are relatively uncommon1. Most bird deaths from collisions occur in low-rise and medium-rise buildings, as well as residential homes1. Nocturnal migratory birds are especially vulnerable to building collisions2. Artificial light at night increases collision risks for migratory birds3 and there appears to be a strong association between migratory bird stopover density and the amount of artificial light at night4. Collision risk has been strongly linked to glass area, façade size and design, surrounding vegetation, and other architectural and landscape features near buildings5,6,7,8. Glass represents a perceptual hazard for the birds due to the transparency of some types of glass which makes them appear as open passageways through which birds can pass. Reflective types of glass may also mislead birds as they may reflect either the habitat or sky. The extent to which these reflections are apparent to birds may also depend on environmental conditions5,6,7,8.
Prevention techniques for bird collisions with glass include making the glass more visible to birds by applying patterns, decals, or markers9,10,11,12, as well as by using UV-reflective and other window films13,14. Field studies show that when applied correctly, exterior treatments significantly reduce bird collisions with glass, however, the effectiveness of the treatment is dependent upon both the treatment design and the location of application10,11,12. Reducing the amount of light emitted from buildings at night during migratory periods can also reduce the likelihood of bird strikes3. The architectural and glazing characteristics of a building can also affect the probability of bird strikes3. The architectural and glazing characteristics of a building can also affect the probability of bird strikes5,15,7,8. In addition, bird-protective treatments applied to the windows have been shown to decrease the likelihood of bird strikes9,10,11,12,16,14. All the aforementioned methods help to reduce the risk of bird strikes to varying degrees; however, many glazing treatments provide static visual cues that cannot adapt to changing environmental conditions. Additionally, many permanent glazing treatments may also alter the appearance of a building and/or its physical properties, which may prevent building owners and architects from voluntarily installing them.
There are many non-passive ways to minimize bird-building collisions. Non-passive ways include human-made structures which provide warning signals via acoustic and/or visual stimuli (e.g. the acoustic lighthouse provided both sound and light to help prevent bird collisions17). Wind-energy projects utilize automated detection systems with either optical or other types of sensors to identify approaching birds and subsequently activate deterrents or shut down turbines to avoid collisions18,19,20,21. The DTBird system is a two-dimensional (2D) optical detection system that has been previously documented19. Research was conducted on the IdentiFlight system to evaluate its capability to automatically detect, classify, and track eagles22. Researchers conducted field studies to assess how effective automatic turbine shutdowns were in avoiding collision incidents18,23. Many IdentiFlight systems incorporate estimated flight paths and time-to-collision thresholds in their operations of turbines18. As stated earlier, these studies illustrate how sensor-activated systems and TTC-related decision rules can be implemented to reduce avian collision risk. Based on prior research, this study evaluates another area of application for sensor-based collision reduction technologies: the design and characterization of an ultrasonic TTC trigger that activates an optical warning at building windows.
This study designs an ultrasonic TTC trigger by leveraging commercial-off-the-shelf (COTS) components and characterizes the performance of the closing-speed estimator at low speeds in a laboratory environment. In conjunction with our fieldwork, we conducted a descriptive photography study of urban building façades throughout the greater Seattle area to identify observable glazing properties related to bird-window collisions. We do not use the photographic survey to assess building-specific collision risk or population level frequency. Since the photographic survey and evaluation of the closing-speed estimator are methodologically independent, survey observations cannot determine the placement of sensors, extent of façade coverage by sensors, range of operation for sensors, warning wavelength, and number of sensors.
The prototype uses a range-based sensor-gated control system to create a temporary visual warning for objects that meet a pre-determined TTC criterion within the sensor field of view. The ultrasonic sensor only provides distance information. It does not provide orientation or side-to-side movement information. Hence, it cannot determine if an object is on a collision path toward the glazing. Typically, the emitter remains off until a valid measurement has been obtained. If a valid measurement occurs, then the emitter follows the hold and reset procedures described in the Methods section. This study does not address whether an event-driven operation will generate less light pollution or decrease habituation. These issues are related to design decisions and are hypotheses. Finally, a visual emitter is driven by the controller from behind a transparent panel that resembles architectural glazing.
Our rationale for TTC triggering is that as closing speed increases, the amount of warning time available decreases for a given spatial threshold. In our formulation, recent timestamped range measurements are used to estimate radial closing speed. TTC can be calculated by dividing current range by the estimated radial closing speed. Our study did not evaluate if this mechanism provides a consistent or biologically significant warning margin. Oblique approaches may result in much lower radial closing speed relative to airspeed. Also, crossing paths may result in decreasing range without intersecting the window.
Studies involving bird-vehicle interactions indicated that captive cowbirds maintained their flight initiation distances regardless of the simulated approach speed. Thus, they had less time to react when approached by a vehicle at a high speed24. Conversely, free ranging turkey vultures demonstrated shorter effective TTCs and had a greater number of close encounters with vehicles when approached rapidly by a truck25. Although vehicle-based studies provide an impetus to examine the importance of warning time, they do not provide a quantifiable measure of safety (or “biological adequacy”) in relationship to the encounter between a bird and glass.
To estimate closing speed, we applied a least squares fit to distance versus recorded time over a sliding window of different sizes to evaluate how window length impacts on the stability of velocity estimation; however, increasing the window size also resulted in longer buffer fill times. This may mask some of the dynamics of the motion. Only data collected from a slowly moving target manipulated manually was used to characterize the data set. Consequently, we cannot determine either the end-to-end latency of the trigger or the performance of the system at avian approach speeds.
During the development phase of the firmware, we used a configurable velocity gate of 1–30 m/s. This was solely a test software configuration. There is no statistical basis for selecting this range of velocities based upon empirical evidence of how fast birds close in radially. All data collected were analyzed offline without applying the experimental velocity gate. Due to the interaction between the flight path of the bird and the geometric layout of the sensors located near the façade, there are presently no validated operating speed limit established for the prototype.
We used a typical WS2812B RGB (Red-Green-Blue) LED (Light-Emitting Diode) strip in our prototype as the emitter. We did not measure the spectral output of the LED strip, and we did not test the behavioral response of any animal to the emitted light. We used a BH1750 sensor to monitor ambient light, but we did not use these readings to test if the LED light fell within an organism’s visual range. Therefore, from an engineering viewpoint, the optical component of the prototype can be viewed as a generic prototypical cue, and not a warning stimulus that has been optimized for use with specific bird species.
Methods
Descriptive Façade Survey
Photographs of 121 building façades were taken at locations throughout the Seattle metropolitan area including downtown Seattle and Redmond. The photographs were taken during a time period of November 2024 – May 2026. We selected the buildings regardless of their façade appearance prior to photography. Each photograph of a building façade was reviewed after it was photographed with a smartphone camera. Since the descriptive façade survey provides architectural context for our TTC study, it cannot be used to represent a statistically valid sample of building façades in greater Seattle. We provided the survey results in the Results section.
Previous studies have indicated that a combination of factors related to the use of glass in a building façade (extent of glazing), the ability of a window to reflect light (reflective appearance), and the design of the façade itself (façade structure) influence whether birds will collide with windows5,15. Furthermore, several forms of surface treatment (e.g., film, marker, pattern) have been evaluated as potential ways to reduce bird-window collisions9,10,11,12,13,14,26.
Photographs of façades were obtained under many types of weather and sky conditions, from multiple viewing angles, and with varying amounts of ambient light. Therefore, the reflective appearance of the façades could only be described by visible environmental characteristics; it was not possible to quantify reflectance.
Prototype Hardware
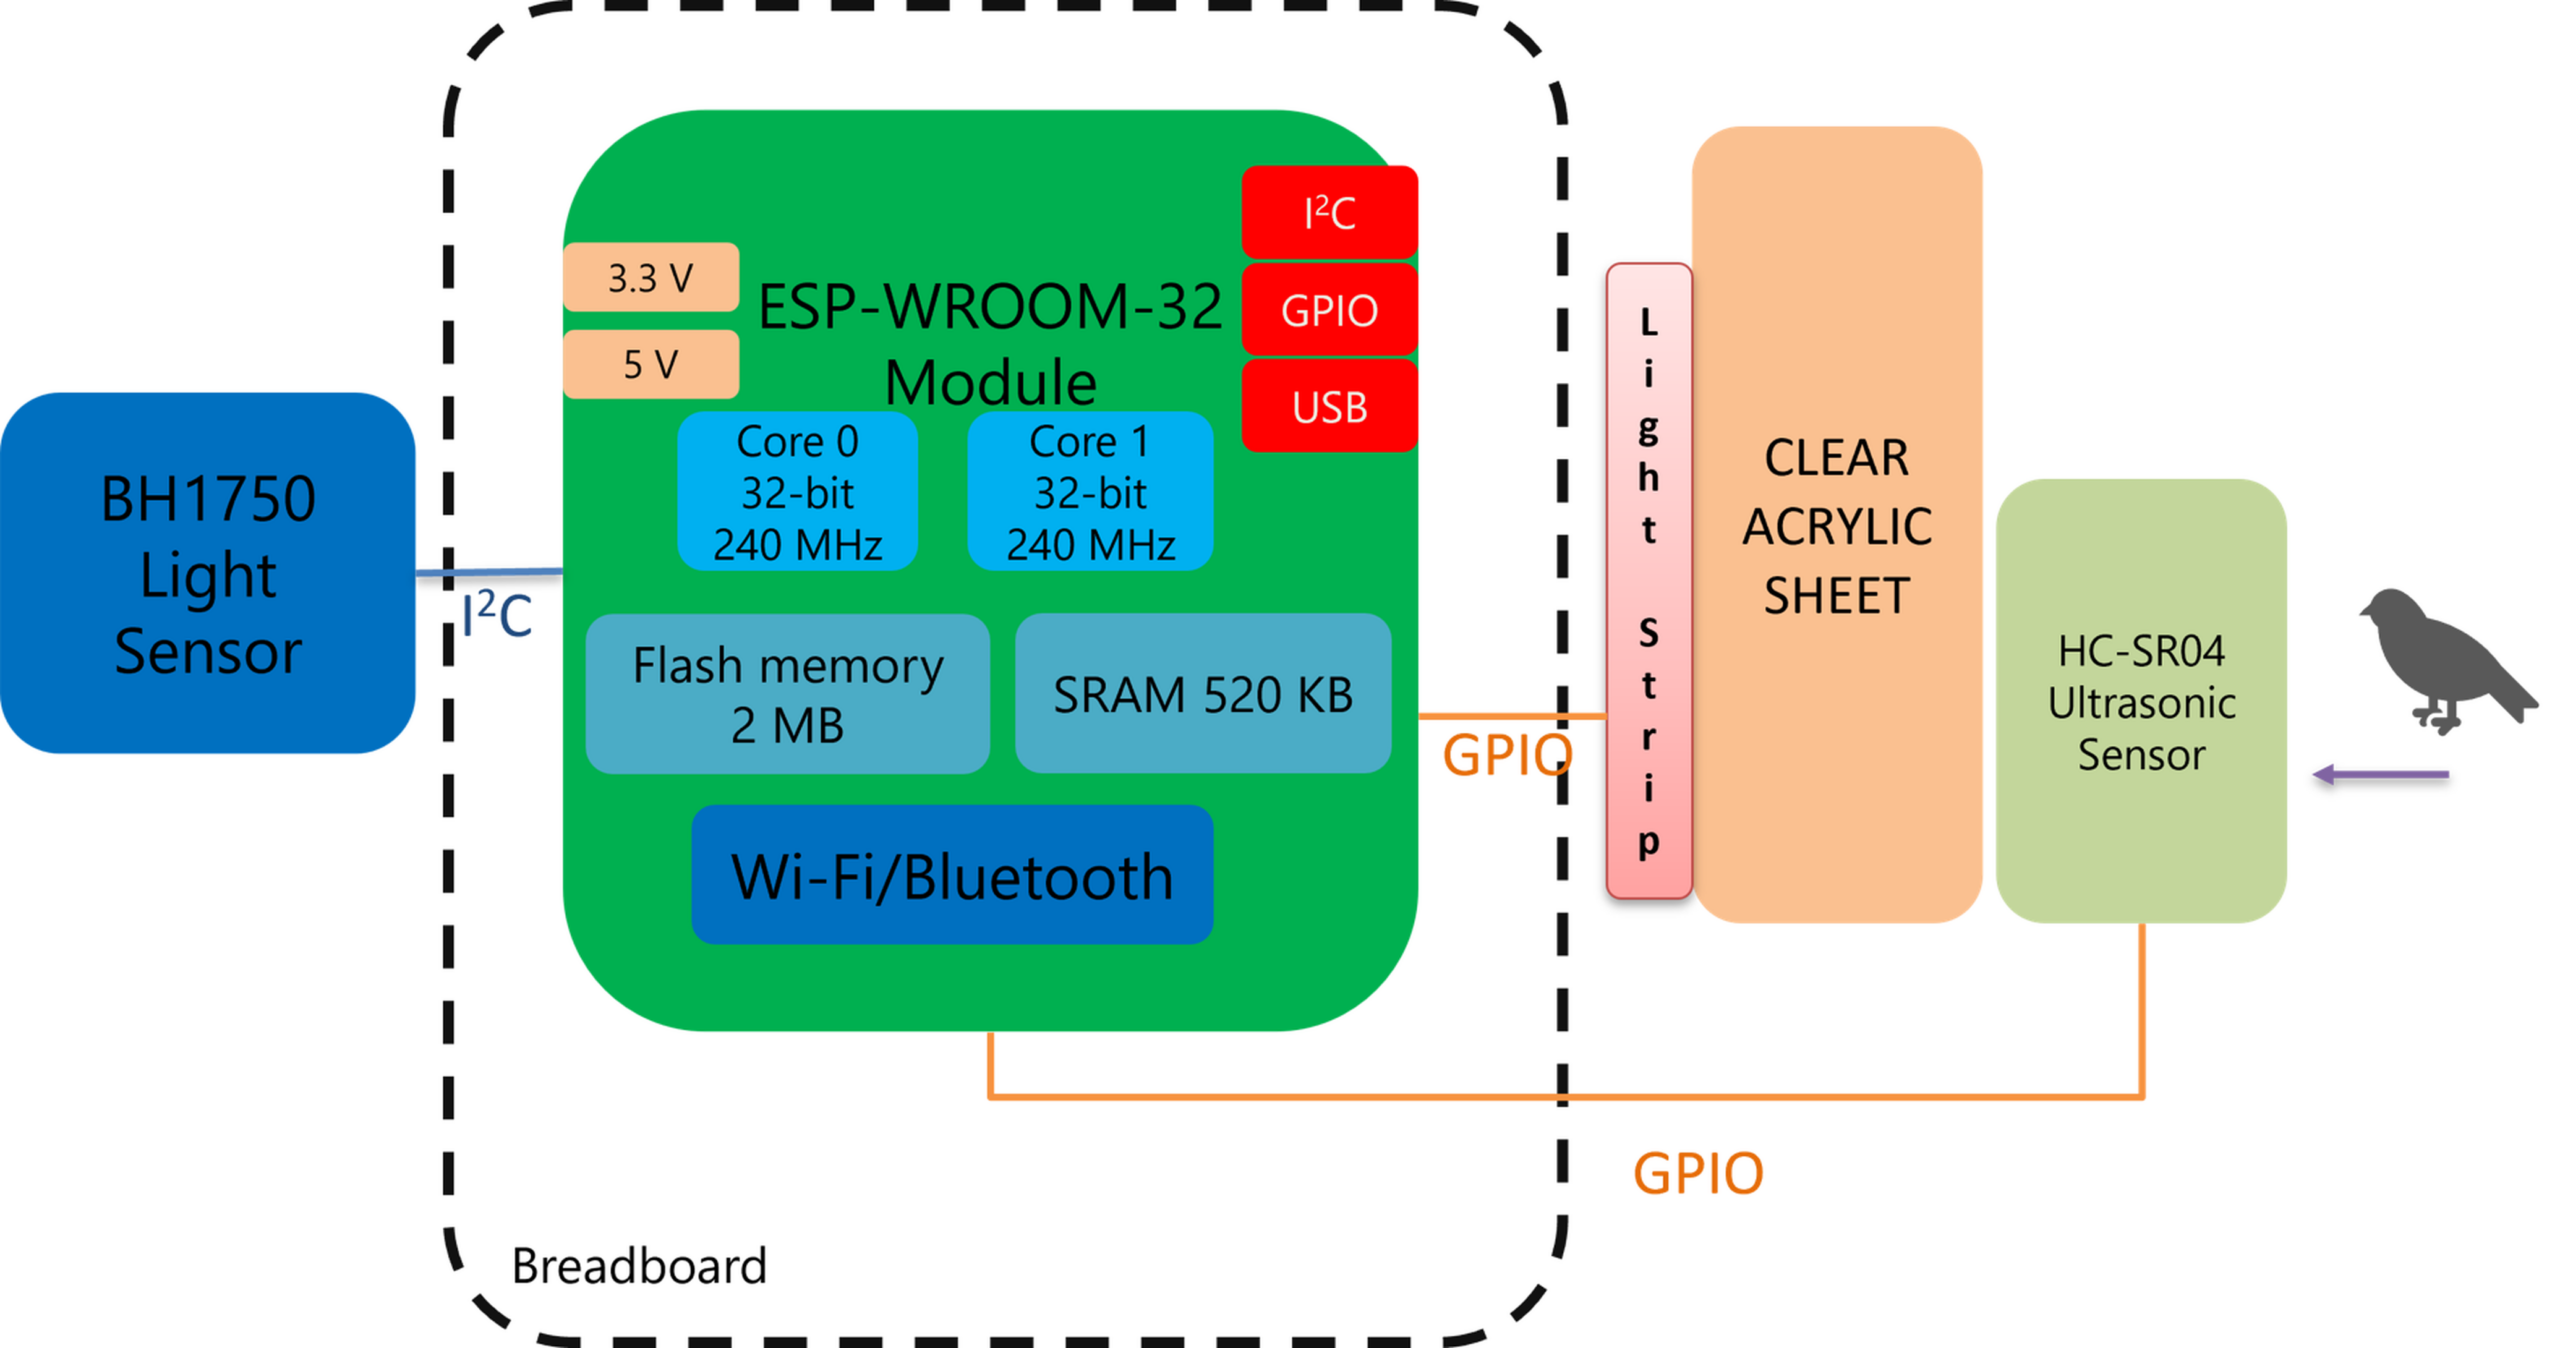
We created a prototype on a breadboard based on an ESP-WROOM-32 microcontroller module (dual core, 240 MHz, 520 kB SRAM, 2 MB Flash), which is depicted in Figure 1. Descriptions of the additional hardware components utilized follow below:
• HC-SR04 Ultrasonic Sensor: The HC-SR04 ultrasonic sensor provides distance measurement capabilities. As stated by the manufacturer’s specifications for the ultrasonic sensor, the sensor has a measurement range of 3-450 cm and a resolution of approximately 0.3 cm. However, we were unable to verify this claim within our study. The ultrasonic sensor operates at a power supply voltage of 5 V. The TRIG input to the ultrasonic sensor receives 3.3 V logic (directly from ESP32 GPIO 12). A two-resistor voltage divider is utilized to reduce the ECHO output from the nominal 5 V to approximately 3.3 V. A 1 kΩ resistor is connected in series with ECHO and GPIO 13. A 2 kΩ resistor is connected in series with GPIO 13 and ground. When ECHO outputs the nominal 5 V, the voltage divider generates approximately 3.3 V at GPIO 13. We did not examine how mounting position of the ultrasonic sensor influences its functionality; how the ultrasonic sensor performs under various types of climatic conditions; how reflections off glass surfaces impact its performance; its beam width; or its coverage area relative to the dimensions of the building façade. The 1 kΩ /2 kΩ voltage divider is not shown in Figure 1.
• BH1750 Digital Light Sensor: A 16-bit sensor that measures ambient light levels via the I2C bus. The sensor can measure ambient light levels varying from 0-65535 lux.
• Visual Warning Strip: A strip containing 60 separately addressable WS2812B LEDs mounted behind an acrylic panel. The LEDs operate at a fixed brightness level of 64 out of 255 potential levels.
• Moving Target: A 3D-printed bird model.
Firmware and Trigger Logic
We used a laptop to develop the firmware for controlling the hardware. The firmware was programmed in C++ using the Arduino IDE. The Arduino IDE compiled the firmware into a binary file and uploaded it to the microcontroller through the USB cable connecting the laptop to the board.
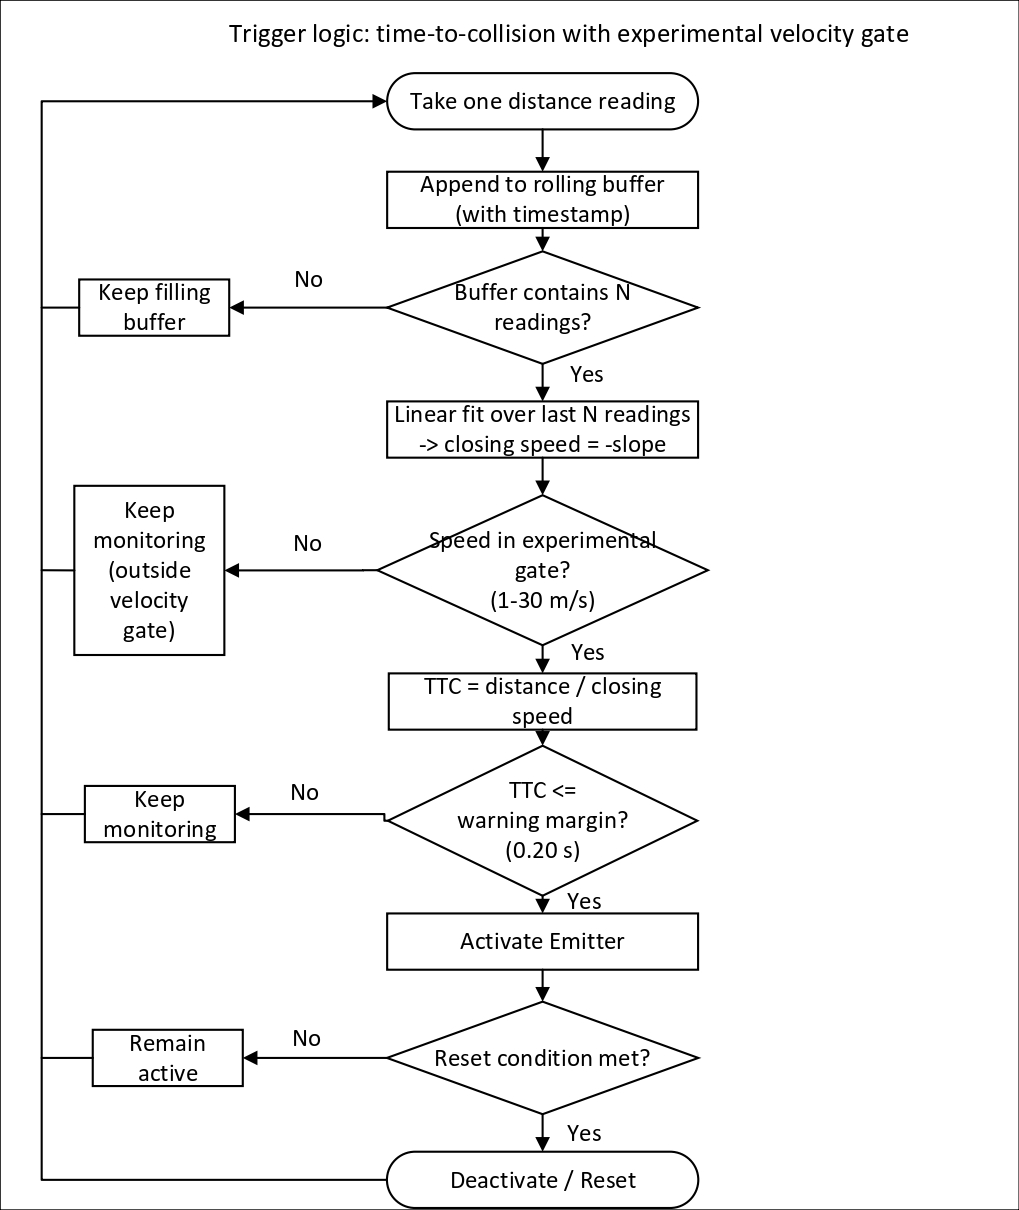
The TTC firmware continually calculated the target’s closing speed and time until impact. It was based on an ongoing sequence of acquire-estimate-decide (Figure 2). The acquire-estimate-decide sequence included acquiring a new measurement; adding that measurement to the rolling buffer; estimating closing speed; using the experimental velocity gate; calculating TTC; evaluating the warning condition; and resetting the emitter state.
Each time the controller completed a control cycle, a valid ultrasonic distance measurement and corresponding microsecond timestamp were added to the rolling buffer. After the rolling buffer contained enough measurements, the closing speed was calculated via a least-squares linear regression on the relationship between distance and time. The negative of the slope of the regression line indicated a positive radial closing speed. TTC was determined by dividing the current distance reading by the calculated closing speed. Since we estimated this value only along a single dimension (the sensor axis), it cannot be used by itself to confirm whether the moving target would collide with the glass.
Only when the estimated closing speed fell within the experimental 1–30 m/s gate and the calculated TTC was less than or equal to the 0.20-s warning threshold did an optical warning activate. A single qualifying estimate activated the emitter. Once activated, the emitter remained active for at least 500 ms while measurement and estimation continued. Following the minimum 500 ms activation period, the trigger reset following three successive control cycles that did not meet the activation requirements. Following reset, the emitter could be reactivated immediately upon meeting the activation requirements.
The TTC threshold, velocity-estimation window, velocity gate, minimum emitter activation period, and reset count were configurable parameters within the firmware. We chose the following values for our experimental selection of the control settings in the proof-of-concept implementation. The 500-ms minimum activation period was chosen to allow for a continuous warning and to minimize rapid changes. The three-cycle reset criterion was chosen to provide a continuous warning and to minimize rapid changes. As these were experimental selections for the proof-of-concept implementation and had not been tested with respect to how they affect avian responses to the system (habituation), repeated triggering, etc., we did not investigate their effect on bird response to the system.
The firmware utilized recorded timestamps instead of assuming equally spaced measurements. In regard to latency analysis, 60 ms was utilized as an optimistic lower-bound based on the manufacturer’s recommendation of more than 60 ms between measurements. This study characterized the estimator through a series of bench tests. The end-to-end trigger latency or actual warning margin was not tested.
The controller configured the ambient light sensor to operate in continuous high resolution mode for recording the ambient illumination. This illumination value was not involved in TTC trigger. The controller read its most recent conversion value directly from the BH1750 sensor’s register. The impact of I2C register access time on the overall TTC trigger latency was ignored in this study.
We then applied velocity estimation window lengths of 3, 5, 8, 10, 15 and 20. The nominal 15-ms request interval, 0.20-s time to collision (TTC) threshold, and 1–30 m/s gate were used as the test parameters. There is no biological justification for these parameters. The acoustic round trip from 4.5 m (at 21.5°C) takes approximately 26 ms, which is longer than the 15 ms. The minimum latency between each measurement is at least 60 ms according to the HC-SR04 manufacturer. The 15-millisecond request interval should not be considered a reasonable full range data collection cycle nor can it support claims of reasonable warning margins.
Estimator Characterization on Real Traces
The proposed prototype for TTC trigger implementation is built upon the following principles:
• Raw data collection: an experiment in which a target was slowly moved toward a standard HC-SR04 ultrasonic distance sensor. The same method was applied to eight different experimental trials. In each trial, 134 distance readings were obtained. A microsecond timestamp was associated with each reading. Note that the sensor was supposed to take a reading every 15 ms (nominal spacing). However, we used the exact microsecond time each reading actually occurred instead of uniform sampling intervals. This allowed the velocity calculations to account for irregular measurement intervals. There was no approach interval used for the analysis. All the readings were valid during the entire time period of recording, including those obtained while the target was stationary, accelerating or decelerating.
• Filtering/smoothing of raw sensor data: it is possible that the ultrasonic sensor will produce false random spikes when detecting a target. Typically, these spikes can be removed from raw sensor data. This study purposely processed raw, unfiltered sensor data to evaluate how robustly the system operates. The only smoothing method employed was the linear least squares fit.
• Velocity calculation: all readings were organized into short, overlapping windows (sliding windows) of size 3, 5, 8, 10, 15, or 20. Subsequently, least squares were used to fit the readings within each window. The slope of the resulting fitted line represented the target’s velocity. The slope became negative as the target was approaching the sensor. For the TTC calculation, we reversed the sign of this slope to obtain a positive closing speed. The resulting value was then converted from cm/s to m/s. For each trace and window length, we calculated the population standard deviation of the sliding-window speed estimates.
Our experimental data describe how sliding window length affects the variability of speed estimates in a laboratory setting. However, our data do not address the accuracy and bias of speed estimates or evaluate the overall performance of the TTC trigger. In addition, our setup is not ready to be used in a real-world scenario to calculate TTC. As we manually pushed a 3D-printed bird across a workbench, the velocity was calculated by timing it with a stopwatch over a fixed 37-cm bench interval. Due to the arbitrary interval selection and unknown stopwatch resolution, comparison of velocities was removed from the quantitative analysis. Additional limitations included operator timing uncertainty, speed variations from manual movement, and temporal misalignment between the stopwatch interval and ultrasonic sliding-window estimates. The experiment was too slow to be able to accurately predict how the sensor would perform against real-time, fast bird flight speeds. To test this sensor on live birds, we require an accurate testing method using either an automated track with a motor or a gravity-drop system with photogates to precisely locate the position of the moving target.
We used a 3D-printed bird model as a moving target in our experiment. Its shape and size were similar to those of a small bird, which presents a rigid, matte surface to the ultrasonic sensor. We kept the room temperature at 21.5 °C to calibrate the speed of sound.
Analysis
Stationary range variation was analyzed in a second set of ten recorded traces (t1-t10). The recordings were taken using a short-range test bench where the intended approach was from about 45 cm to 8 cm; however, some recordings did not cover this entire range. At the beginning of every trace, the target was placed approximately 42 cm away from the sensor. Only valid distance measurements were used. For each trace, the baseline was determined as the median of the first 20 valid distance measurements. An initial segment ended right before the first series of three consecutive readings that departed from that baseline by more than 1.5 cm in either direction. If no such series existed, then all valid readings were used. Each segment had to have at least 10 readings and all ten traces qualified. The sample standard deviation (n-1 denominator) of each selected segment was calculated in centimeters. As stated previously, noise excursions can meet the endpoint criterion while the target remains stationary, therefore the length of each segment reflects that criterion. The ten segment lengths and corresponding standard deviations are reported in the Results. Two distinct data sets were utilized for these two analyses. The first analysis utilized eight complete traces for the sliding windows and the second analysis used stationary segments from ten captured traces for the stationary noise. The recordings were not paired and stationary range variation cannot be measured by assessing target speed error.
In this study, we introduce a stationary-baseline displacement-to-noise ratio (DNR), which can be used to analyze system performance. The proposed DNR is described as vΔt/σd, where v is an assumed radial closing speed, Δt represents an assumed interval between valid readings, and σd = 0.6 cm is a rounded nominal input slightly less than the median (0.646 cm) and RMS (0.668 cm) value. DNR describes the relationship between the expected intersample displacement and the background noise of stationary range readings. We only use the DNR = 3 baseline calculation to compare designs. It does not reflect actual bird detection, measured speed errors, or warning reliability. With 60 ms being an optimistic lower bound for the measurement interval, buffer filling requires at least 120 ms for a three reading window and 1.14 s for a twenty reading window as illustrated in Table 1. As such, the reduction of speed estimate variability due to larger windows leads to significantly greater latency. These calculations provide a timing constraint only and cannot be used to determine overall TTC performance.
| Velocity-estimation window (N) | Required intervals (N – 1) | Minimum buffer-fill latency at 60 ms |
| 3 | 2 | 120 ms |
| 5 | 4 | 240 ms |
| 8 | 7 | 420 ms |
| 10 | 9 | 540 ms |
| 15 | 14 | 840 ms |
| 20 | 19 | 1,140 ms |
Note that since each sliding window has multiple readings and each reading takes at least 60 ms, the minimum buffer-fill latency for a specific window size was calculated as the number of intervals between readings, N – 1, multiplied by 60 ms, where N is the window length. However, the manufacturer of the sensor recommends waiting longer than 60 ms between triggers, our calculated values are optimistic lower bounds. Our calculation also did not include real-world delays such as the first valid measurement, computation, other control-processing delays, emitter activation, and biological response. Therefore, actual real-world delays would be significantly longer.
Results
Descriptive façade survey
The descriptive study recorded variation in glazing conditions on the sampled urban façades. Photographs of the sampled urban façades documented variations in both the size (extent) and uniformity (continuity) of glazing; the presence of recognizable environmental reflections; evidence of treatment applied to the surface of the glazing; and whether the glazed portion of the façade was broken up by an opaque or projecting architectural feature. Figure 3 provides illustrations of four examples of visible characteristics of the façades and represents typical photographic examples from the 121 surveyed façades. These four examples were also included among the 121 surveyed façades, including the deliberately selected treated-glazing example.
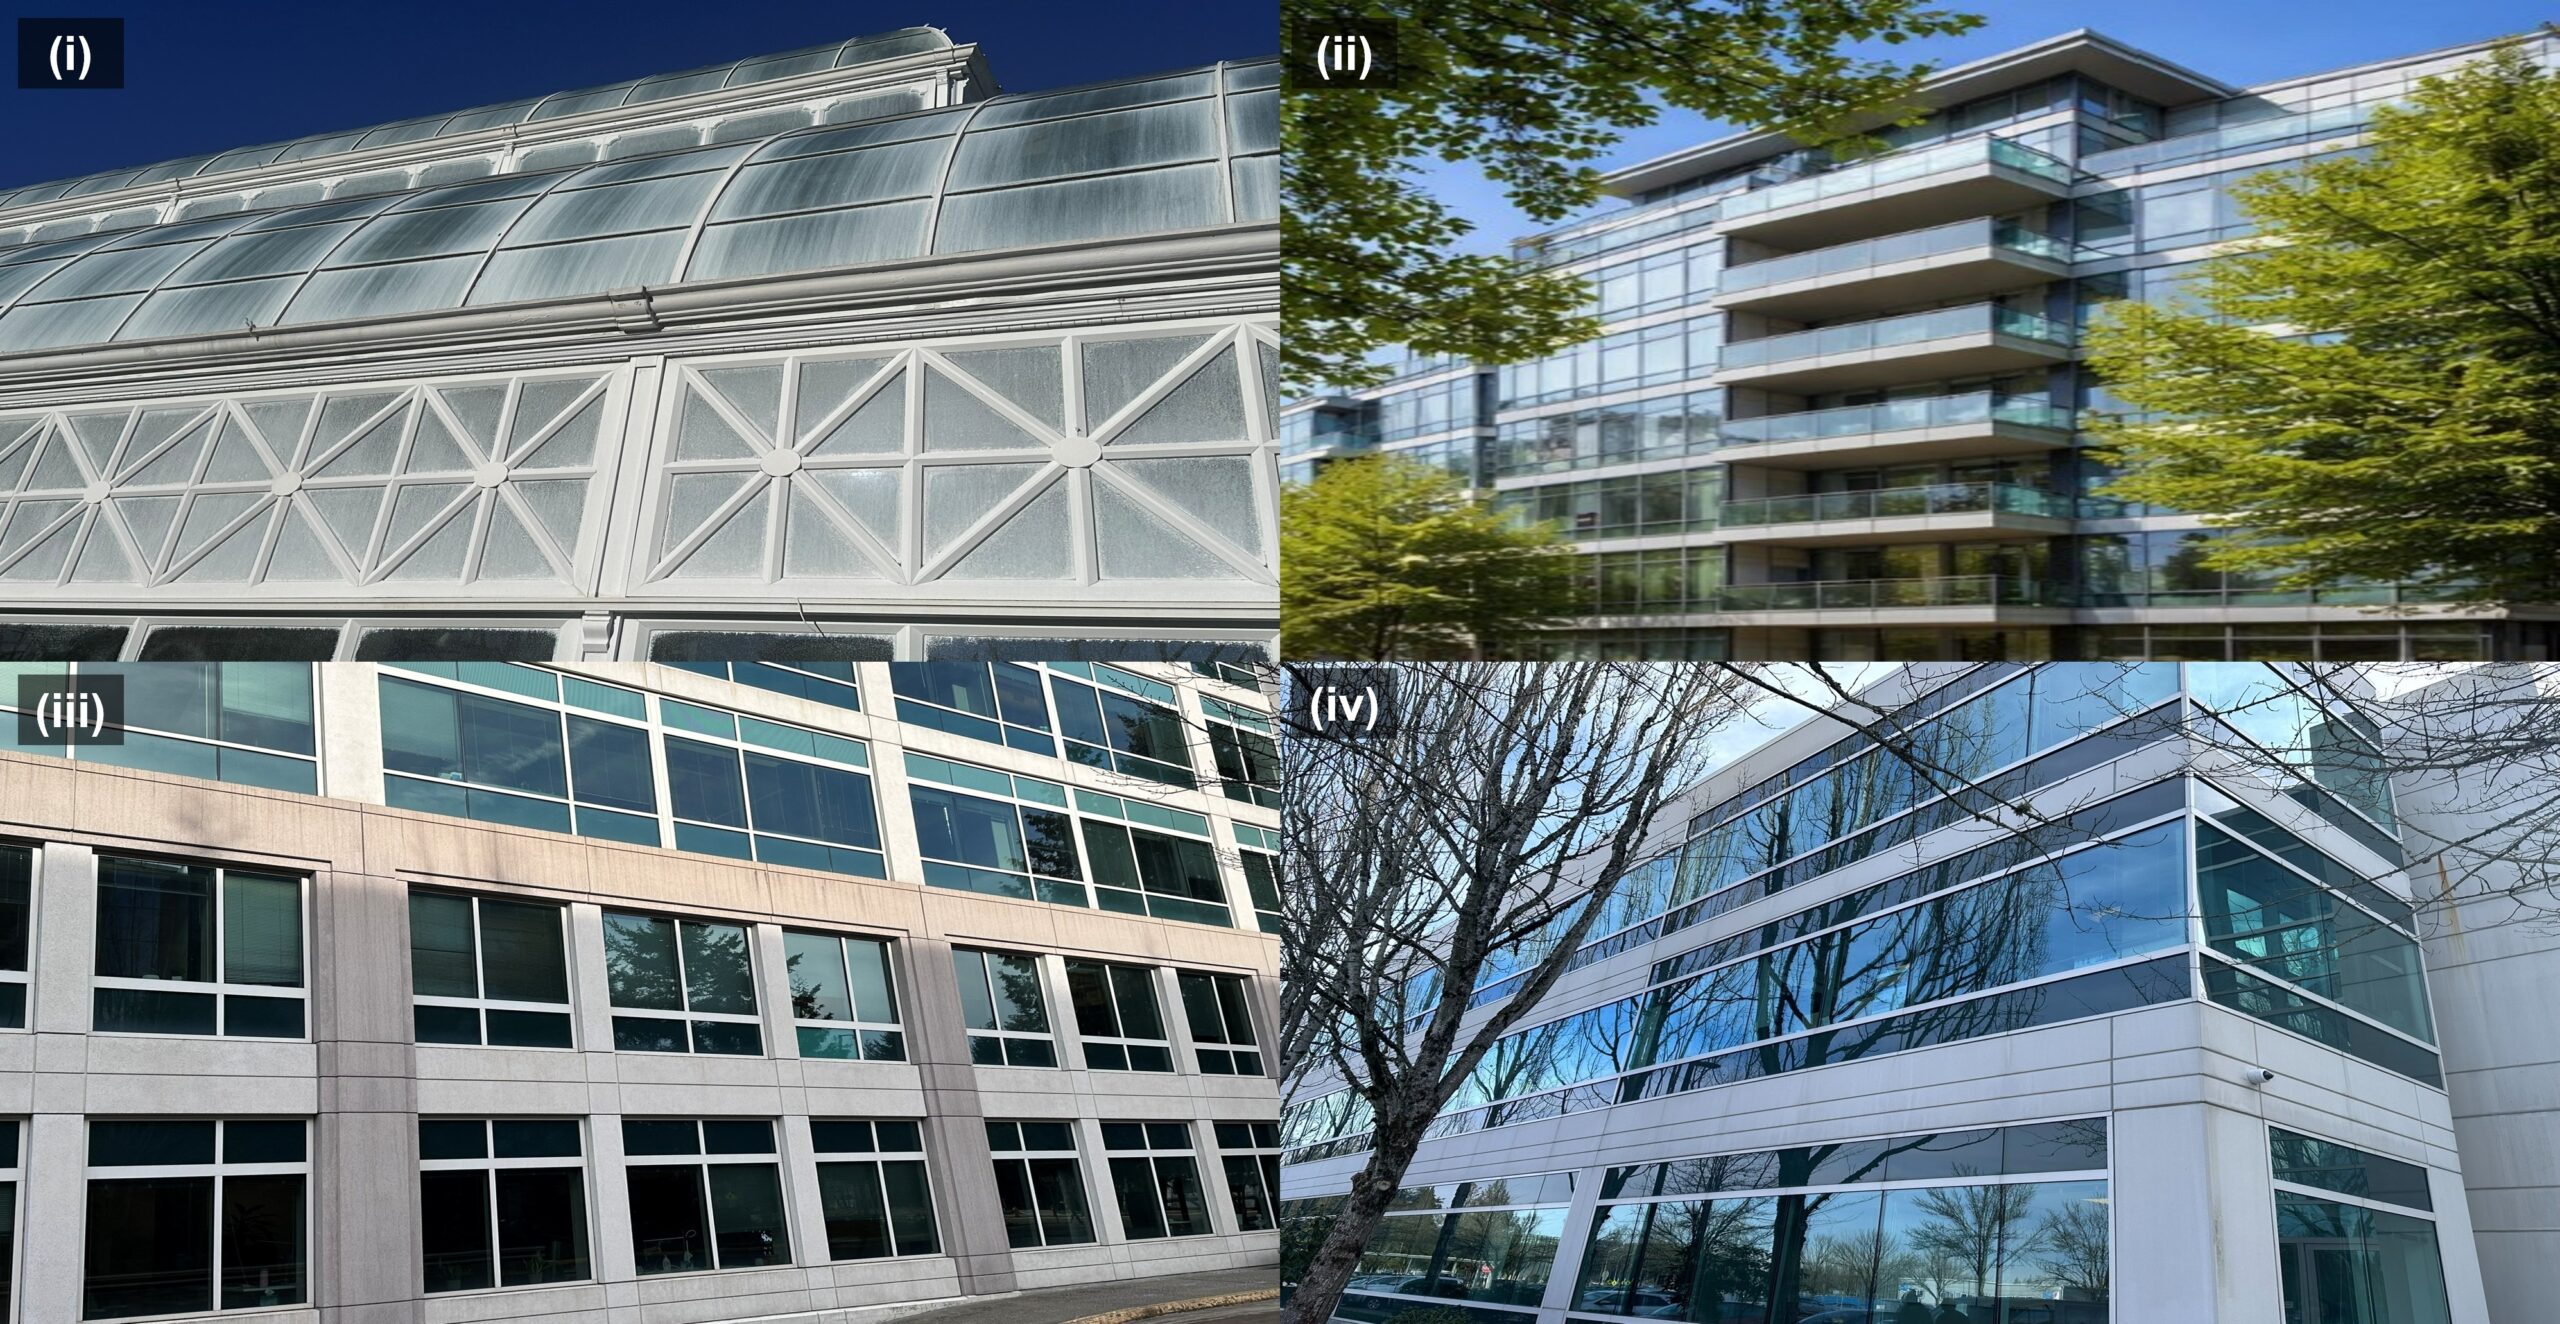
These findings provide a basis for the development of an active warning system based upon existing glazing systems. The survey did not quantify the number of birds hitting windows nor did it quantify the prevalence of window hits on a regional basis.
Relationship between Velocity-Estimation Window Length and Speed-Estimate Variability
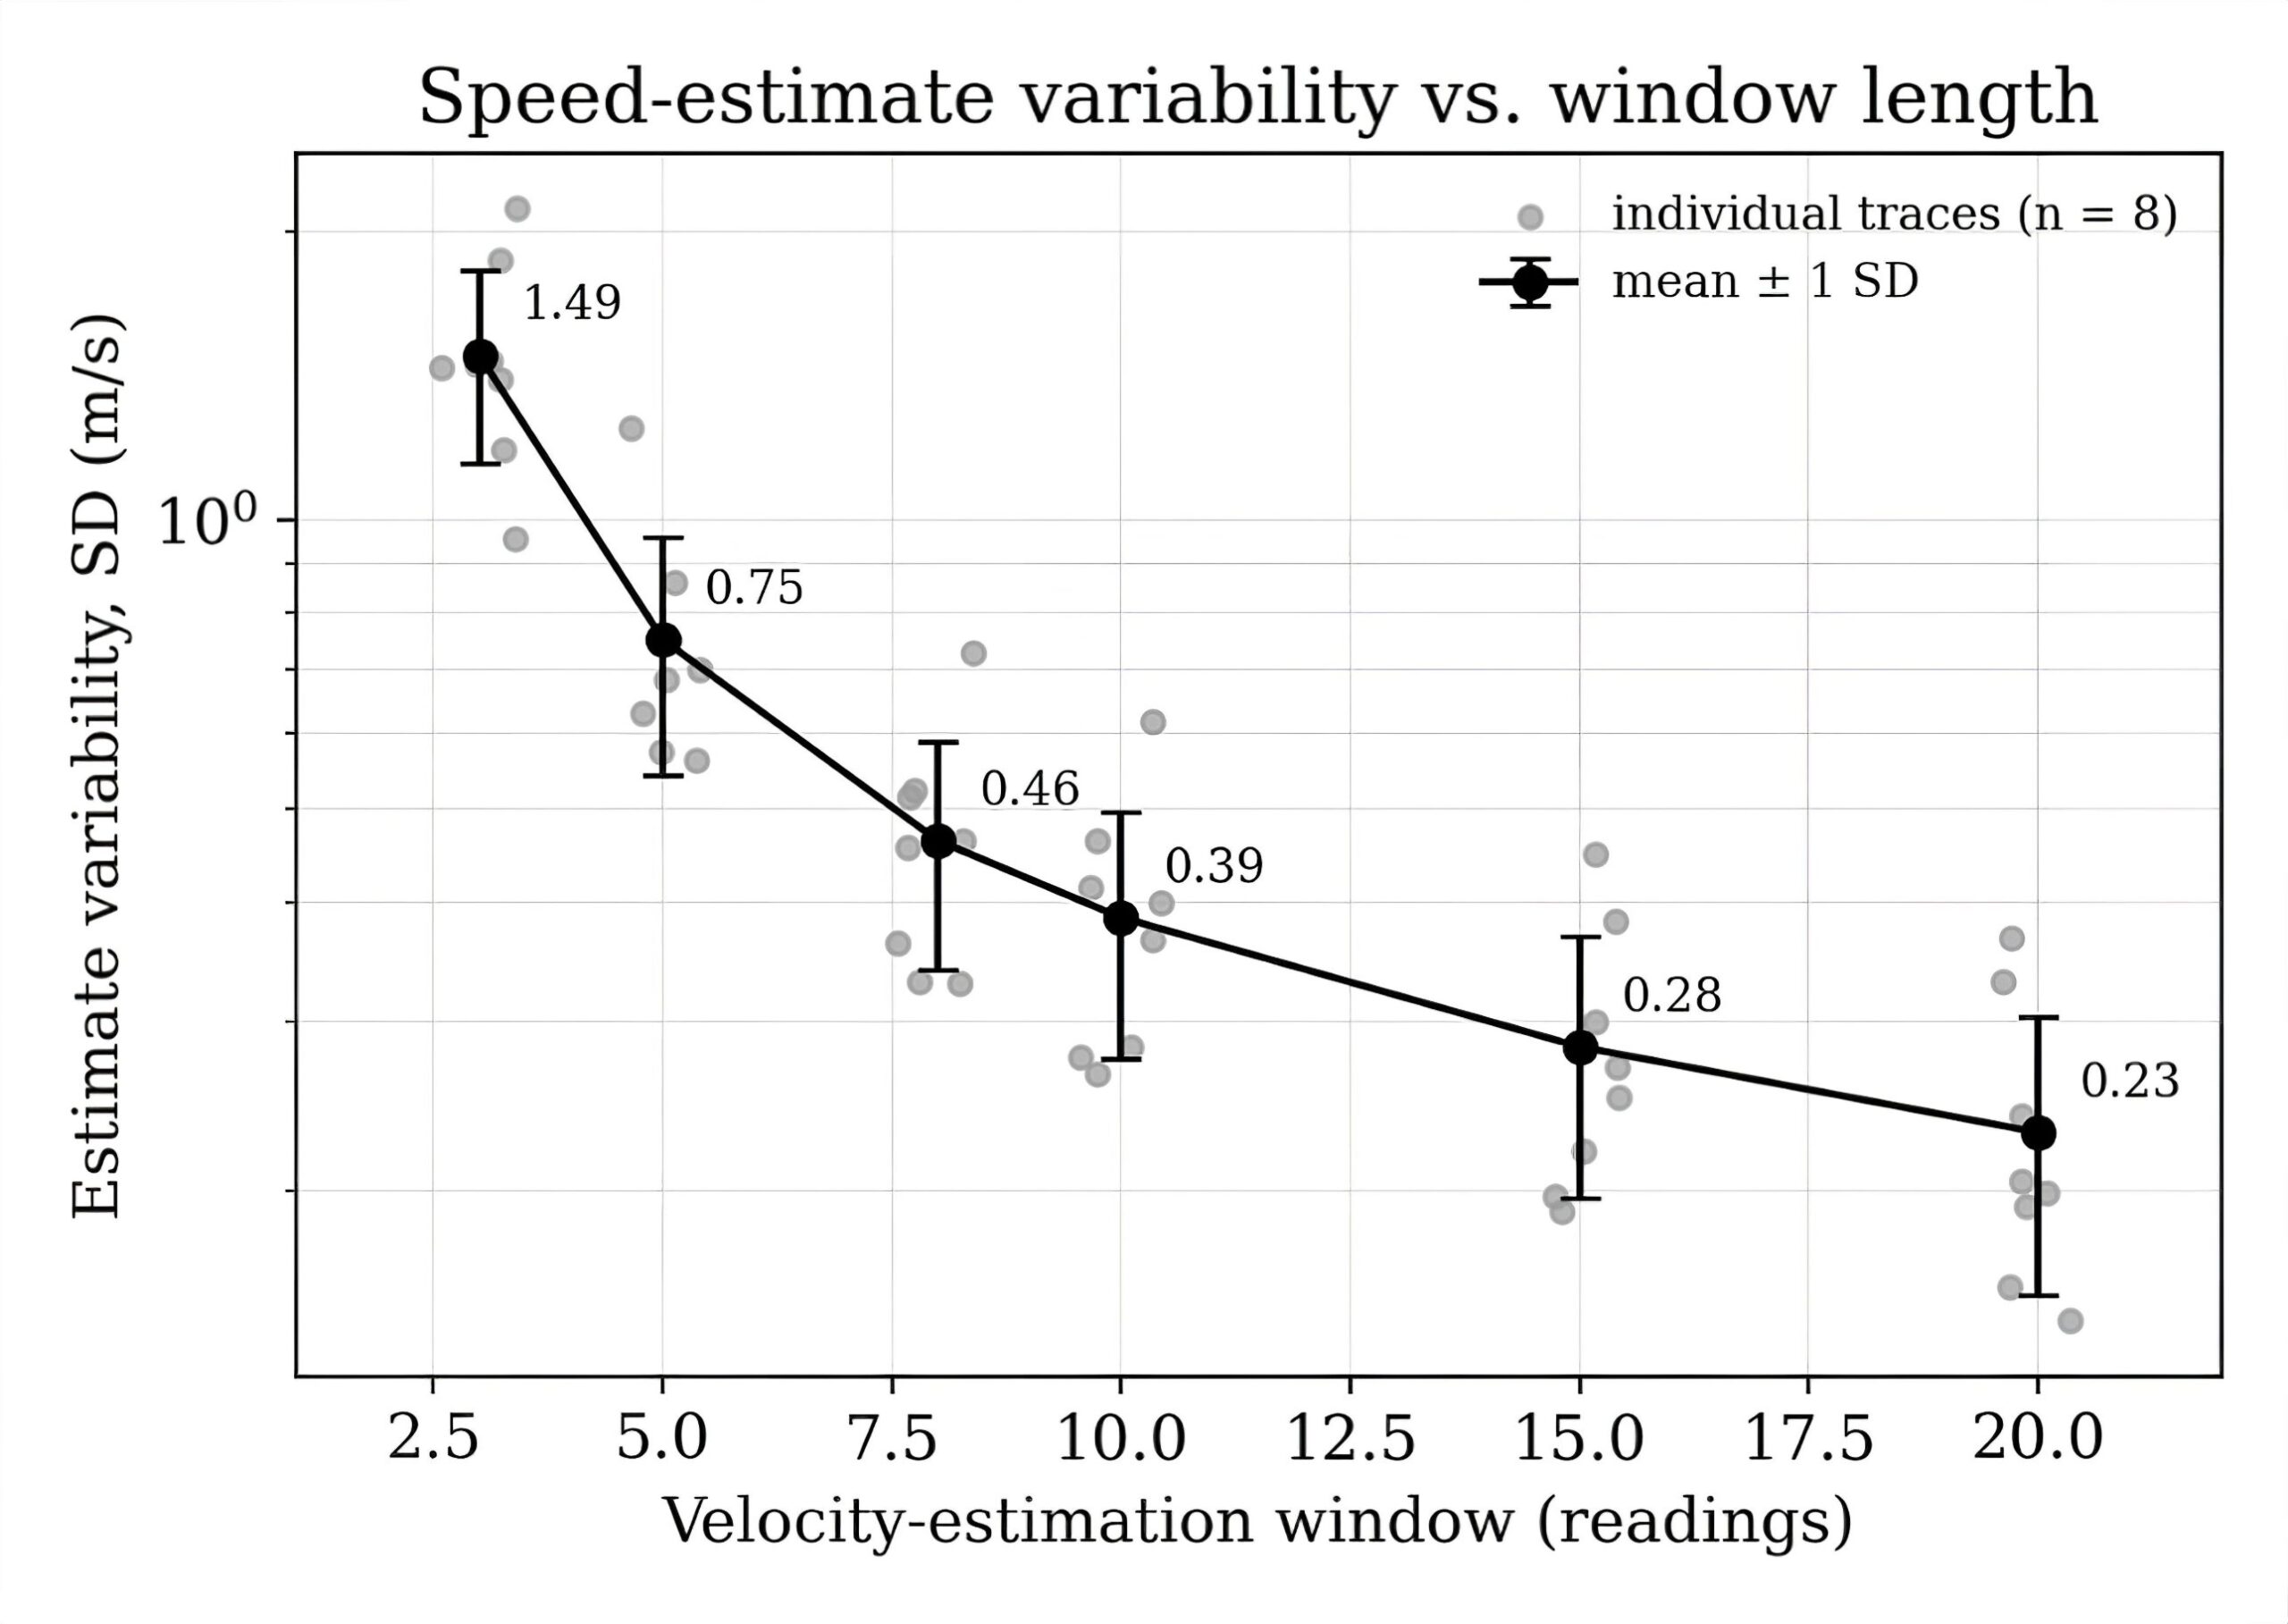
Figure 4 shows the relationship between velocity-estimation window length and speed-estimate variability over eight low-speed, hand-moved traces. For each full trace, including non-motion readings, the population standard deviation of sliding-window closing-speed estimates was determined using window lengths of three, five, eight, ten, fifteen, and twenty readings. The average within-trace standard deviation over eight traces decreased as window length increased from 1.49 m/s at three readings to 0.23 m/s at twenty readings. The intermediate averages were 0.75 m/s at five readings, 0.46 m/s at eight readings, 0.39 m/s at ten readings, and 0.28 m/s at fifteen readings. There was a 6.5 times decrease from the beginning to end of the range. Gray dots illustrate the individual-trace values; black dots and associated error bars show the average ±1 standard deviation of the population of traces. It should be noted that these values illustrate the stability of the speed estimate across complete capture sessions versus its accuracy.
There are several factors that could cause variability in the speed estimate: transition from stationary to motion; change in moving speed; dynamic range issues; timing variations; and the rolling fit itself. A longer window requires more valid readings prior to generating the first estimate. In addition, once the buffer is filled, the estimator reacts much slower to changes in motion. Table 1 quantifies the minimum time required to fill the buffer.
Stationary Range Variation and Illustrative DNR
Each of the 10 traces used to identify the initial stationary segments in the data set contained 15 to 134 readings, as indicated in Table 2. The standard deviation of the range (distance) for each segment ranged from 0.151 to 1.174 cm (median = 0.646 cm; mean = 0.588 cm; root-mean-square = 0.668 cm). Figure 4 illustrates how the estimation of speed varied among all eight separate complete traces; however, because the speed estimates are in different units than the distance estimates, they cannot be directly compared to determine the amount of range error that occurred during the controlled motion.
| Trace | Selected readings | Baseline (cm) | Range SD (cm) |
| t1 | 134 | 41.53 | 0.456 |
| t2 | 36 | 41.99 | 0.151 |
| t3 | 15 | 41.99 | 0.232 |
| t4 | 78 | 42.02 | 0.628 |
| t5 | 29 | 42.46 | 1.174 |
| t6 | 77 | 42.00 | 0.711 |
| t7 | 15 | 41.53 | 0.189 |
| t8 | 94 | 41.99 | 0.664 |
| t9 | 62 | 40.57 | 0.745 |
| t10 | 68 | 42.22 | 0.929 |
Using σd = 0.6 cm and a time interval (assumed to be 15 ms) for DNR = 3, algebraically DNR occurs at v = 1.2 m/s. Assuming slow radial velocities that do not exceed 0.20 m/s, DNR would be less than or equal to 0.5. If the radial velocity was based upon the published 8–23 m/s range of mean equivalent cruising airspeeds for all bird species27, the calculated DNR would be between 20–58. Using the measured median of 0.646 cm instead provides a DNR = 3 crossing of 1.29 m/s and a calculated bird airspeed scenario of 18.6–53.4. Neither the slow speed scenario (which is not a DNR measurement from the hand-moved traces) nor the bird airspeed scenario (which does not represent façade-relative closing speed) provides evidence of estimator accuracy, a reliable speed threshold, or bird warning performance. The 15 ms interval reflects the short-range trace-capture setting; however, it is much shorter than the manufacturer’s recommended measurement cycle. Table 1 depicted the buffer-fill latency when the 60 ms is used as an optimistic lower-bound interval. For actual intervals longer than 60 ms, the buffer-fill latency is higher than the values reported in Table 1.
Since we did not have enough documentation for the timing resolutions, trajectories, and alignment of the ultrasonic fit, comparisons made by stopwatch were not included in either analysis of accuracy or bias.
Discussion
The intent behind conducting a façade survey was to provide insight into the actual design elements (architectural) of each building as they exist today. In our study we documented building glass characteristics including glazing extent, reflections, façade division, and surface treatment. These observations provided architectural context for developing a non-invasive warning approach for bird-building collisions that would not require permanent modification of the building’s façade or major remodeling.
In contrast to typical sensors which activate an alarm when a target enters a defined area (based on distance) regardless of its velocity, our TTC system activates the alarm based upon time using estimated radial closing speed of the approaching target. However, we have not demonstrated that the prototype is capable of maintaining constant warning times as expected. Instead, our experiments characterized how velocity-estimation window length impacts on speed-estimate variability under low-speed laboratory conditions. The end-to-end activation of the TTC system, the achievable warning margin, the time it takes for a TTC system to activate after a target is detected, and whether there are false alarms or activations missed were not assessed.
The results of our study indicate that the stability of the velocity calculation increases with an increase in the sliding window size. However, it takes a longer time to collect that many readings. At the assumed minimum measurement interval of 60 ms, it takes around 540 ms to fill a smooth 10-reading window initially, compared with 1.14 s for a 20-reading window. We need to measure this interval under real-world conditions instead of relying on nominal software estimates.
Furthermore, our experiment did not distinguish between the effects of dynamic range error. Motion generated by hand may include both acceleration/deceleration of the target as well as changes to the target’s orientation. Ultrasonic returns from a target will vary based upon the geometry of the return and whether multiple paths exist between the sensor and target. The complete data set contains all stationary-motion transitions. Timing variations as well as these transitions contribute to the variation in the plotted speed estimates. A motorized track or gravity-fed cart that has its own position/photogate reference would allow for separation of the target motion from the sensor/estimator error.
The published cruising airspeed and the estimated closing speed of the bird also need to be addressed as these two speeds are not interchangeable. Because of this, our study did not define any specific DNR thresholds or minimum closing speeds for real-world applications.
Future work
As future work, we will pursue the following areas.
Testing of an end-to-end system within a controlled environment. A robotic track or gravity-driven target is necessary as a source for velocity measurement; it will replace manual movement of the 3D bird and provide automated light-sensor (photogate) input. In addition, fixed distance and TTC controllers will be installed on the same hardware as the robotic track, so that additional tests can be conducted with varying distances and extreme lateral angles to assess detectability and coverage of the façade using one sensor.
Biological optimization can be further enhanced by selecting warning wavelengths that are specific to each bird species’ visual sensitivity. Behavioral studies have demonstrated that species-specific response depends upon the wavelength used for a warning signal; the pulse rate (pulsing); the amount of ambient light present at the time of exposure to the warning signal; the type of exposure (first or subsequent); and the length of time that the bird is exposed to the warning signal. For example, in response to various wavelengths of light, cowbirds displayed different levels of avoidance behavior28. Similarly, Canada geese demonstrated differing behaviors based on whether they were exposed to 483-nm light or 631-nm light, and also based upon the presence/absence of pulsing; the level of ambient light; and the order in which they were exposed to the two types of light29. Finally, a recent study using a drone to approach birds indicated that the birds were able to detect and evade the drone at an earlier stage when the drone emitted a blue light that was specifically tuned to their vision30. Our prototype only has standard RGB LEDs. Further study needs to apply a specialized UV light source in a controlled environment.
Real world scaling and ethics regulatory. An array of spatially-separated sensors or an imaging system would need to be developed so as to enable estimation of trajectory and differentiation between collision course and intersecting path. Biological verification of the model would require live-animal (bird) experimentation in compliance with applicable regulatory and ethical approval processes. Additionally, a comprehensive building façade coupled with standardized collision monitoring would need to be performed in order to determine which elements of the building façades are associated with higher levels of bird collisions.
Conclusion
We developed, built, and tested a prototype of an ultrasonic configurable TTC-trigger for use in bird-glass warning systems. The façade survey as part of this project provided us with a visual reference point (architectural) of the different types of glass utilized throughout the surveyed facades. Our study indicated that increasing the estimation window length reduced speed-estimate variability but increased the minimum buffer-fill latency. This represents a trade-off between smoothing and responsiveness, which should be considered with appropriate selection of the estimation window size and sensor hardware for future implementation. While our prototype is not ready for the field, it provides a solid foundation for future controlled high-speed testing, end-to-end performance validation, and biological trials.
Acknowledgments
I thank everyone who helped me with this research. I thank the anonymous reviewers for their thoughtful and constructive comments, which substantially improved the clarity and quality of this manuscript.
References
- S. R. Loss, T. Will, S. S. Loss, P. P. Marra. Bird-building collisions in the United States: estimates of annual mortality and species vulnerability. The Condor: Ornithological Applications. Vol. 116, pg. 8–23, 2014. [↩] [↩] [↩] [↩]
- K. S. Nichols, T. Homayoun, J. Eckles, R. B. Blair. Bird-building collision risk: an assessment of the collision risk of birds with buildings by phylogeny and behavior using two citizen-science datasets. PLoS ONE.Vol. 13, pg. e0201558, 2018. [↩] [↩]
- B. M. Van Doren, D. E. Willard, M. Hennen, K. G. Horton, E. F. Stuber, D. Sheldon, A. H. Sivakumar, J. Wang, A. Farnsworth, B. M. Winger. Drivers of fatal bird collisions in an urban center. Proceedings of the National Academy of Sciences. Vol. 118, pg. e2101666118, 2021. [↩] [↩] [↩]
- K. G. Horton, J. J. Buler, S. J. Anderson, C. S. Burt, A. C. Collins, A. M. Dokter, F. Guo, D. Sheldon, M. A. Tomaszewska, G. M. Henebry. Artificial light at night is a top predictor of bird migration stopover density. Nature Communications. Vol. 14, pg. 7446, 2023. [↩]
- C. S. Riding, T. J. O’Connell, S. R. Loss. Building façade-level correlates of bird–window collisions in a small urban area. The Condor: Ornithological Applications. Vol. 122, pg. duz065, 2020. [↩] [↩] [↩] [↩]
- D. Klem, C. J. Farmer, N. Delacretaz, Y. Gelb, P. G. Saenger. Architectural and landscape risk factors associated with bird–glass collisions in an urban environment. The Wilson Journal of Ornithology. Vol. 121, pg. 126–134, 2009. [↩] [↩]
- A. C. Lopes, G. O. C. Rocha, M. F. de Oliveira Passos, L. Barçante, C. S. de Azevedo. The influence of building surroundings and glass cover in bird collisions. Birds. Vol. 5, pg. 703–711, 2024. [↩] [↩] [↩]
- B. V. Li, Y. Fang, S.-Y. Liao, S. R. Loss, X. Li, L. Zhu. Scale-dependent effects of urban vegetation and artificial lights at night on bird-building collisions in China. Biological Conservation. Vol. 310, pg. 111375, 2025. [↩] [↩] [↩]
- C. D. Sheppard. Evaluating the relative effectiveness of patterns on glass as deterrents of bird collisions with glass. Global Ecology and Conservation. Vol. 20, pg. e00795, 2019. [↩] [↩] [↩]
- K. L. De Groot, A. G. Wilson, R. McKibbin, S. A. Hudson, K. M. Dohms, A. R. Norris, A. C. Huang, I. B. J. Whitehorne, K. T. Fort, C. Roy, J. Bourque, S. Wilson. Bird protection treatments reduce bird-window collision risk at low-rise buildings within a Pacific coastal protected area. PeerJ. Vol. 10, pg. e13142, 2022. [↩] [↩] [↩] [↩]
- B. B. Brown, S. Santos, N. Ocampo-Peñuela. Bird-window collisions: mitigation efficacy and risk factors across two years. PeerJ. Vol. 9, pg. e11867, 2021. [↩] [↩] [↩] [↩]
- R. R. Lawson, T. J. O’Connell, J. A. Elmore, C. S. Riding, G. J. Riggs, S. R. Loss. Window markers reduce bird–window collisions in a real-world application. Ornithological Applications. Vol. 128, pg. 1–10, 2026. [↩] [↩] [↩] [↩]
- J. P. Swaddle, L. C. Emerson, R. G. Thady, T. J. Boycott. Ultraviolet-reflective film applied to windows reduces the likelihood of collisions for two species of songbird. PeerJ. Vol. 8, pg. e9926, 2020. [↩] [↩]
- J. P. Swaddle, B. Brewster, M. Schuyler, A. Su. Window films increase avoidance of collisions by birds but only when applied to external compared with internal surfaces of windows. PeerJ. Vol. 11, pg. e14676, 2023. [↩] [↩] [↩]
- D. Klem, C. J. Farmer, N. Delacretaz, Y. Gelb, P. G. Saenger. Architectural and landscape risk factors associated with bird–glass collisions in an urban environment. The Wilson Journal of Ornithology. Vol. 121, pg. 126–134, 2009. [↩] [↩]
- J. P. Swaddle, L. C. Emerson, R. G. Thady, T. J. Boycott. Ultraviolet-reflective film applied to windows reduces the likelihood of collisions for two species of songbird. PeerJ. Vol. 8, pg. e9926, 2020. [↩]
- T. J. Boycott, S. M. Mullis, B. E. Jackson, J. P. Swaddle. Field testing an “acoustic lighthouse”: combined acoustic and visual cues provide a multimodal solution that reduces avian collision risk with tall human-made structures. PLoS ONE. Vol. 16, pg. e0249826, 2021. [↩]
- A. E. Duerr, A. E. Parsons, L. R. Nagy, M. J. Kuehn, P. H. Bloom. Effectiveness of an artificial intelligence-based system to curtail wind turbines to reduce eagle collisions. PLoS ONE. Vol. 18, pg. e0278754, 2023. [↩] [↩] [↩]
- C. Ballester, S. M. Dupont, A. Corbeau, T. Chambert, O. Duriez, A. Besnard. A standardized protocol for assessing the performance of automatic detection systems used in onshore wind power plants to reduce avian mortality. Journal of Environmental Management. Vol. 354, pg. 120437, 2024. [↩] [↩]
- C. Gémard, O. Duriez, O. Chappe, G. Duclos, A. Besnard. Towards a better understanding of avian collision in wind energy facilities using automatic detection systems. Journal of Applied Ecology. Vol. 62, pg. 1437–1448, 2025. [↩]
- J. Fluhr, O. Duriez, C. Blary, T. Chambert, B. Almasi, P. Byholm, N. H. Buitendijk, J. Champagnon, M. Dagys, W. Fiedler, C. Francesiaz, F. Jiguet, S. Lee, A. Millon, F. Monti, L. Morcelet, R. Nathan, B. A. Nolet, R. Nuijten, P. Pilard, C. Ponchon, A. Roulin, C. D. Santos, O. Spiegel, K. Schalcher, A. De Seynes, G. Spanoghe, M. Wikelski, R. Žydelis, A. Besnard. Eoldist, a web application for estimating cautionary detection distance of birds by automatic detection systems to reduce collisions with wind turbines. Wind Energy. Vol. 28, pg. e2971, 2025. [↩]
- C. J. W. McClure, L. Martinson, T. D. Allison. Automated monitoring for birds in flight: proof of concept with eagles at a wind power facility. Biological Conservation. Vol. 224, pg. 26–33, 2018. [↩]
- C. J. W. McClure, B. W. Rolek, L. Dunn, J. D. McCabe, L. Martinson, T. Katzner. Eagle fatalities are reduced by automated curtailment of wind turbines. Journal of Applied Ecology. Vol. 58, pg. 446–452, 2021. [↩]
- T. L. DeVault, B. F. Blackwell, T. W. Seamans, S. L. Lima, E. Fernández-Juricic. Speed kills: ineffective avian escape responses to oncoming vehicles. Proceedings of the Royal Society B: Biological Sciences. Vol. 282, pg. 20142188, 2015. [↩]
- T. L. DeVault, B. F. Blackwell, T. W. Seamans, S. L. Lima, E. Fernández-Juricic. Effects of vehicle speed on flight initiation by turkey vultures: implications for bird-vehicle collisions. PLoS ONE. Vol. 9, pg. e87944, 2014. [↩]
- D. Klem Jr. Preventing bird-window collisions. The Wilson Journal of Ornithology. Vol. 121, pg. 314–321, 2009. [↩]
- T. Alerstam, M. Rosén, J. Bäckman, P. G. P. Ericson, O. Hellgren. Flight speeds among bird species: allometric and phylogenetic effects. PLoS Biology. Vol. 5, pg. e197, 2007. [↩]
- B. Goller, B. F. Blackwell, T. L. DeVault, P. E. Baumhardt, E. Fernández-Juricic. Assessing bird avoidance of high-contrast lights using a choice test approach: implications for reducing human-induced avian mortality. PeerJ. Vol. 6, pg. e5404, 2018. [↩]
- R. Lunn, P. E. Baumhardt, B. F. Blackwell, J. P. Freyssinier, E. Fernández-Juricic. Light wavelength and pulsing frequency affect avoidance responses of Canada geese. PeerJ. Vol. 11, pg. e16379, 2023. [↩]
- R. B. Lunn, B. Blackwell, P. Baumhardt, A. Talbot, I. Di Domenico, E. Fernández-Juricic. Light tuned to the avian eye elicits early detection and escape from an approaching aircraft. Royal Society Open Science. Vol. 12, pg. 250047, 2025. [↩]