Abstract
Extreme weather events impose significant human and economic costs, though the annual relationships among hydroclimatic factors associated with these events are not well understood. This study aims to quantify how hydroclimatic extremes in precipitation, top-layer soil moisture, and air temperature are correlated with extreme land-surface runoff in Houston, Texas. Using daily time series for the years 1980–2023 from NASA’s Western Land Data Assimilation System, the frequency and severity of extreme events meeting or exceeding the 95th percentile of historical records were identified. In addition to the correlations between the extreme hydroclimatic variables and extreme runoff (Pearson r and Spearman ρ), long-term secular trend analysis, cross-variable relationships, and lag-1 autocorrelations were conducted. Correlation p-values were calculated using the effective sample sizes to account for interannual persistence and separately adjusted using the Benjamini–Hochberg false discovery rate method to account for multiple testing. The findings reveal that extreme precipitation and soil moisture showed strong positive association with extreme runoff. Extreme heat frequency was inversely correlated with extreme runoff frequency, though the remaining correlations between heat and runoff were not significant. Secular trend analysis showed statistically significant increases in extreme-heat variables, whereas precipitation, soil moisture, and runoff variables exhibited no significant long-term trends. Overall, the results indicate that changes in soil moisture and precipitation provide important context for evaluating periods of high runoff. The findings also suggest areas for further research to better understand the conditions associated with extreme runoff in different geographies and to inform urban stormwater management.
Keywords: Urban Runoff, Soil Moisture, Precipitation, Extreme Weather, Houston, Climate Analysis
Introduction
Extreme weather events have caused tremendous human and financial losses in the United States. Between 1980 and 2024, extreme weather events in the United States resulted in over 16,000 deaths and more than $2.9 trillion in damages1. In 2017, severe storms, flooding, and wildfires led to over $305 billion in losses, setting a record as the costliest year for climate-related disasters in United States history; these effects are projected to compound further over the next 10 years2,3. Extreme hydrological (water-related) events have become an especially dangerous threat in the Southern United States. On July 4, 2025, exceptionally heavy rainfall across the upper Guadalupe River basin produced catastrophic flooding in Central Texas that killed at least 135 people, including 27 campers and staff members at Camp Mystic4.
This study aims to investigate a critical hydrological process: land-surface runoff. Land-surface runoff, as it is used in this study, refers to the combined amount of modeled surface and subsurface water fluxes. Events like the July 2025 Central Texas floods demonstrate the importance of examining the climatic and hydrological conditions associated with extreme land-surface runoff, as new insights can inform local risk assessments and help vulnerable regions, like those in Texas, prepare for future extreme events. While many climate factors related to Earth’s hydrological cycle have been linked to land-surface runoff, their annual relationships with runoff dynamics remain difficult to quantify2,5.
This study examines the correlations among extreme temperature, precipitation, soil moisture, and extreme land-surface runoff in the Houston area of Texas. Houston is an important site for examining runoff dynamics because it combines a very flat plain setting, bayou-based drainage (streams used as stormwater channels), and a humid climate that produces frequent heavy rainfall and tropical storms6,7,8. These conditions are important because Houston also has aging infrastructure, extensive urban development, and widespread impervious surfaces, factors which increase the amount of rainfall converted to runoff and make the city especially vulnerable to its many intense storms3,6,8,9,10,11.
The climate data for this study span from 1980 through 2023 and are divided into two types of variables: (1) the frequency (the number of extreme days in a given year) and (2) the severity of an event (the average result on each extreme day in a given year), to capture two distinct dimensions of extreme weather. The analysis examines how the frequency and severity of extreme temperature, extreme precipitation, and extreme soil moisture days correlate with the frequency and severity of extreme runoff events. The rationale for this project is to clarify how land and atmospheric processes relate to extreme land-surface runoff, and to provide important insights into local watershed characteristics and runoff risk at an urban location in the Houston area.
Previous research has identified soil moisture as a key factor associated with surface runoff, as it influences the amount of storage available before incoming precipitation is converted to runoff12,13. When soil moisture is higher, there is less unsaturated soil to store rainfall, increasing the likelihood that precipitation will lead to runoff13,14. In contrast, dry soil requires longer or more intense storms to produce extreme runoff, since there is a greater volume of unsaturated soil beforehand13,14.
Precipitation is the primary source of water for runoff events for an area like Houston, though its relationship to runoff also relies heavily on antecedent wetness: precipitation on wetter soil will exceed available storage capacity more quickly15,16. Rainfall intensity also plays a role in this process, since more intense storms can rapidly overwhelm soil infiltration thresholds15.
Temperature further influences runoff by altering soil moisture, as warmer conditions may accelerate evapotranspiration and soil drying before rainfall. This can potentially increase the amount of unsaturated soil and, in turn, reduce runoff. This relationship between temperature and runoff is highly context-dependent, however, because temperature can also alter other hydrological processes that affect runoff response17. This reality makes temperature a complicated but important factor to analyze.
Based on this previous literature, I hypothesize that extreme precipitation and extreme soil moisture will positively correlate with both extreme runoff frequency and severity, as more saturated soil has limited remaining storage capacity, and intense rainfall can exceed infiltration capacity, generating rapid runoff. I also hypothesize that extreme heat will negatively correlate with the extreme runoff variables: higher temperatures can increase evaporative demand, which decreases soil moisture and raises the precipitation required to produce runoff.
Methods
Research Design
This study is observational, using correlations and statistical analysis to evaluate the relationships between extreme climate variables and extreme land-surface runoff. The independent variables in this study are the frequency and severity of precipitation, temperature, and soil moisture. The dependent variables are the frequency and severity of extreme runoff events. As stated earlier, the frequency of an event was defined as the number of extreme days in a given year, and the severity was defined as the average result across each extreme day in a given year. Annual aggregation of the data was used to avoid intra-year seasonality. Extreme events were defined as events meeting or exceeding the 95th percentile of historical data for each variable. Percentile thresholds, including the 95th percentile, are commonly used to define extreme weather events, with studies often using values between the 90th and 99th percentiles18,19,20. In this study, the 95th percentile threshold is used as a middle ground that captures relatively rare and high-magnitude events while also ensuring there are enough data points for a robust statistical analysis. As a sensitivity analysis, all correlations in Table 1 were also evaluated using 90th and 99th percentile thresholds. While individual correlation coefficients and p-values varied modestly, the overall patterns remained consistent, indicating that this study’s findings were not dependent on the specific percentile threshold used (results not shown here).
Data Collection
All data for the hydroclimatic and runoff variables were gathered from NASA’s Western Land Data Assimilation System (WLDAS) Noah-MP 3.6 Land Surface Model Level 4 Daily 0.01° × 0.01° dataset, Version D1.0 (WLDAS_NOAHMP001_DA1_D1.0). WLDAS provides modeled land-surface variables generated with the Noah-MP land-surface model on a 0.01° × 0.01° grid. Houston was represented by one WLDAS grid cell centered at 29.75° N, 95.25° W in the area of east Houston. This cell was chosen as a representative area of the city. Daily data from January 1, 1980, through December 31, 2023, were retrieved through NASA’s Goddard Earth Sciences Data and Information Services Center (GES DISC) web interface. Daily values at this location were extracted directly without any spatial averaging.
The variables used in the study include 2-m air temperature (Tair_f_tavg), precipitation flux (Rainf_f_tavg), top-layer volumetric soil moisture at 0–10 cm (SoilMoi00_10cm_tavg), surface runoff (Qs_tavg), and subsurface runoff (Qsb_tavg). All five variables were daily mean values. Tair_f_tavg was converted from Kelvin to degrees Celsius by subtracting 273.15. Rainf_f_tavg, Qs_tavg, and Qsb_tavg were provided as rates in kg m-2 s-1 and converted to mm day-1 by multiplying by 86,400 seconds per day, using the equivalence of 1 kg m-2 = 1 mm of water. Daily total runoff (Runoff_mm_day) was calculated by summing the converted surface and subsurface runoff values. Soil moisture remained in its provided units of m3 m-3. Although the data were checked for fill values, no missing or invalid values were present in the utilized daily time series.
Procedure
The subsequent steps involved using the Python programming language and JupyterLab for data analysis and visualization. I used Python for data analysis due to its efficiency in handling large datasets. JupyterLab was an ideal platform for running the code due to its data visualization and organizational capabilities.
To analyze climate extremes, the NumPy percentile function was first used to identify the days when each climate variable (soil moisture, precipitation, temperature, and runoff) met or exceeded the 95th percentile of records for that variable. Days with a result of zero were excluded from the runoff and precipitation calculations, since including them would heavily dilute the 95th percentile cutoffs for these events. Then, looping through each year in the time series, all the days that met or exceeded the percentile threshold were averaged out, and the NumPy size function was employed to store the number of extreme days each year. These steps allowed me to quantify the annual frequency and severity of each extreme climate event.
To evaluate the relationships between the hydroclimatic variables and extreme runoff, both linear and monotonic correlations were conducted using Python (specifically with scipy.stats and statsmodels). For each of the 12 variable pairs, Pearson’s correlation coefficient (r) was calculated to measure the strength and direction of linear relationships, while Spearman’s rank correlation coefficient (ρ) was used to assess monotonic and potentially non-linear relationships. To account for potential annual persistence across the time series, I calculated pair-specific one-year lag autocorrelation coefficients (lag-1 r) for each hydroclimatic and runoff variable over the 1980–2023 period. Since autocorrelations like these can decrease the number of independent annual observations, pair-specific effective sample sizes (Neff) were estimated for each hydroclimatic and runoff variable correlation using the Dawdy–Matalas method. The p-values for the 12 Pearson and 12 Spearman correlations were calculated using the effective sample sizes to account for interannual persistence. The resulting p-values were also separately adjusted using the Benjamini–Hochberg (BH) false discovery rate (FDR) method to account for multiple testing. Significance was determined at a threshold of padj < 0.05. Frequency variables among the extreme events cover the full 44-year study period (N = 44), while nominal sample sizes for severity variables vary (N = 39–44) because years with zero extreme days were excluded from severity calculations to avoid skewing the annual data points.
To gain insight into potential associations between the hydroclimatic events, I calculated a Pearson correlation matrix (r) across all extreme heat, precipitation, and soil moisture variables. Because these associations were contextual and not the focus of the study, I did not test for statistical significance.
To test for long-term secular trends that could have affected the runoff correlations, I conducted Pearson correlations (r) for each annual hydroclimatic and runoff variable against time (1980–2023). To account for multiple testing across the trends, p-values were adjusted using the Benjamini–Hochberg (BH) false discovery rate (FDR) method; statistical significance was evaluated at a threshold of padj < 0.05.
Results
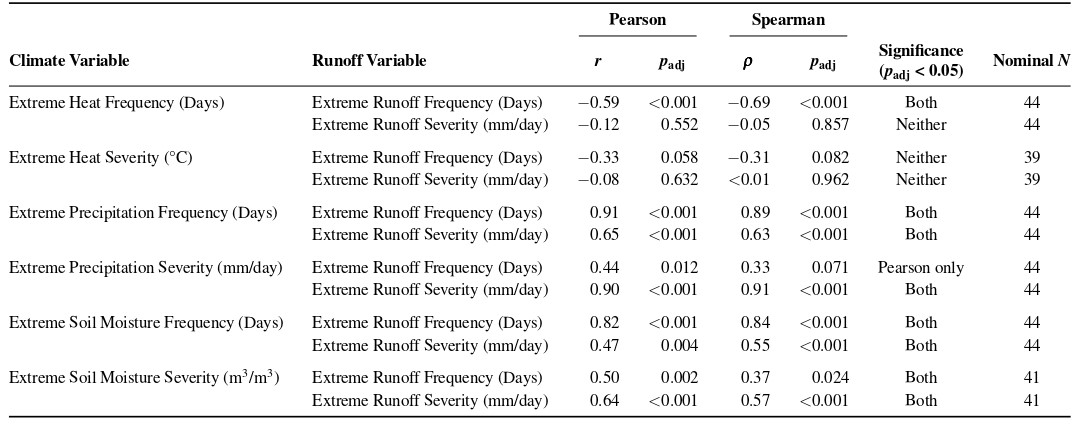
The primary results of the study are shown in Table 1. After Neff and Benjamini–Hochberg (BH) adjustment, 9 of the 12 relationships were statistically significant in at least one correlation test, and 8 were significant in both Pearson and Spearman analyses (Table 1). All the combinations of extreme soil moisture and extreme runoff variables were positively correlated and showed significance in both tests. The extreme precipitation and extreme runoff variables were also positively correlated and significant in both tests, with the exception of extreme precipitation severity and extreme runoff frequency, where the correlation was only significant in the Pearson test (r = 0.44, padj = 0.012; ρ = 0.33, padj = 0.071). The strongest relationships appeared between extreme precipitation frequency and extreme runoff frequency (r = 0.91, ρ = 0.89) and between extreme precipitation severity and extreme runoff severity (r = 0.90, ρ = 0.91). Among the extreme heat variables, extreme heat frequency was negatively correlated with extreme runoff frequency (r = -0.59, padj < 0.001; ρ = -0.69, padj < 0.001). Correlations for the remaining combinations of heat and runoff variables (heat frequency–runoff severity, heat severity–runoff frequency, and heat severity–runoff severity) were not statistically significant in either test.
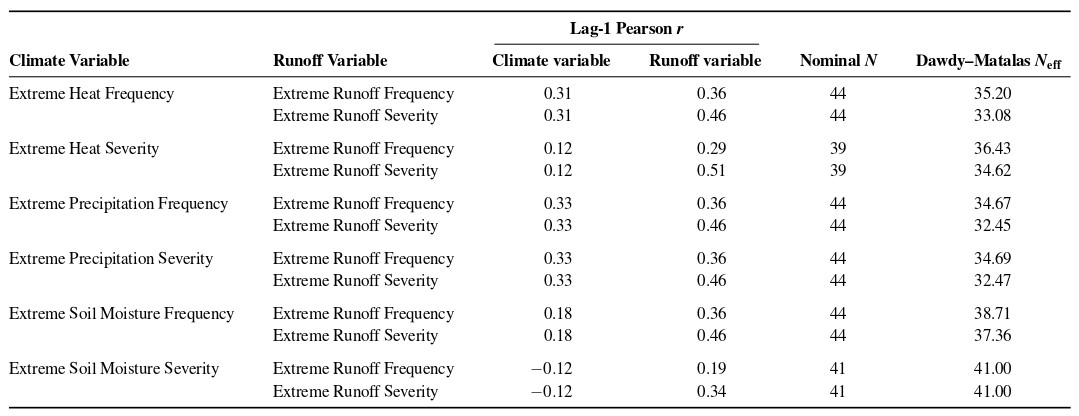
The assessment of interannual persistence across the time series revealed varying lag-1 autocorrelation coefficients for the hydroclimatic and runoff variables (Table 2). Variables in correlation pairs that used all 44 years showed the following results: extreme runoff frequency r1 = 0.36, extreme runoff severity r1 = 0.46, extreme precipitation frequency r1 = 0.33, extreme precipitation severity r1 = 0.33, extreme heat frequency r1 = 0.31, and extreme soil moisture frequency r1 = 0.18. Autocorrelation coefficients varied for pairs with nominal sample sizes below 44 because years with no severity values were excluded. Across the 12 pairs, Neff values ranged from 32.45 for the correlation between extreme precipitation frequency and extreme runoff severity to 41.00 for the correlation between soil moisture severity and runoff severity. The smallest Neff values appeared in pairs involving extreme runoff severity and other hydroclimatic variables with positive autocorrelation coefficients. Pairs with extreme soil moisture severity had Neff values capped at their nominal sample sizes of 41 because soil moisture severity displayed a negative lag-1 autocorrelation (r1 = -0.12).
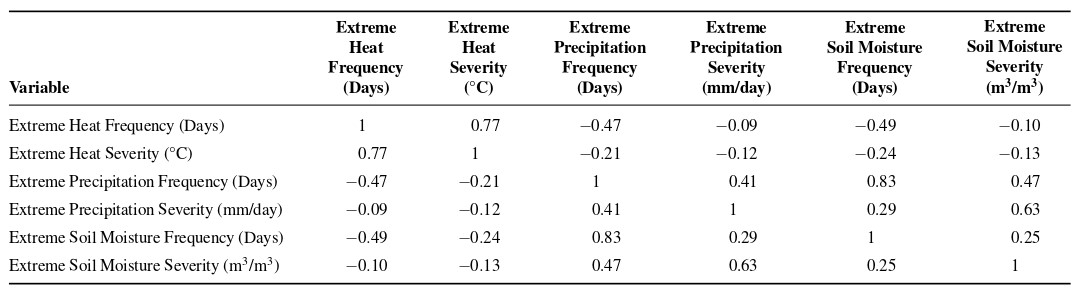
The contextual analysis of intervariable correlations among hydroclimatic events revealed potential relationships between specific variables (Table 3). Extreme heat frequency, for example, exhibited moderate inverse relationships with extreme precipitation frequency (r = -0.47) and extreme soil moisture frequency (r = -0.49). Extreme heat severity also showed an inverse relationship with the frequency of extreme soil moisture (r = -0.24). Furthermore, multiple wet extremes appeared to be strongly coupled. A key example of this is extreme precipitation frequency, which exhibited strong correlation with extreme soil moisture frequency (r = 0.83) and a moderate association with soil moisture severity (r = 0.47). Overall, across the two categories of hydroclimatic extremes (wet and thermal), each variable correlated positively with other variables of the same type (wet versus thermal), but generally showed inverse relationships with variables from the other category. These correlations were not tested for significance, so they are interpreted qualitatively.
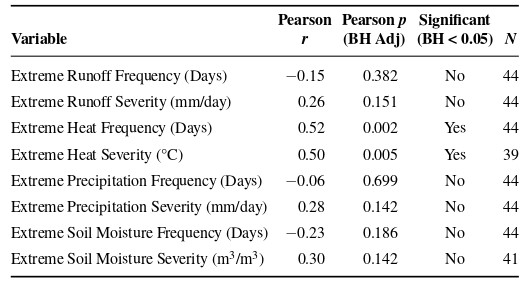
Linear secular trend analyses across the time series revealed statistically significant long-term increases for extreme heat frequency (r = 0.52, padj = 0.002, Significant = TRUE, N = 44) and severity (r = 0.50, padj = 0.005, Significant = TRUE, N = 39) after false discovery rate (FDR) correction (Table 4). In contrast, long-term trends for extreme runoff, extreme precipitation, and extreme soil moisture variables were not statistically significant.
Discussion
The primary goal of this research was to quantify the relationships between key annual extreme hydroclimatic variables (precipitation, temperature, and soil moisture) and annual extreme runoff in Houston, Texas, to gain insights into extreme weather events in this city. Across the 1980–2023 time series, extreme runoff frequency and severity were strongly and positively associated with extreme precipitation and soil moisture. Extreme heat frequency negatively correlated with extreme runoff frequency, but the remaining correlations between heat and runoff were not statistically significant. The overall similarities between Pearson (r) and Spearman (ρ) correlation coefficients indicate that most of the observed relationships showed linear and monotonic patterns.
Extreme Precipitation
The precipitation findings strongly support the hypothesis that extreme precipitation is associated with both the frequency and severity of extreme runoff events. The especially strong correlation between extreme precipitation frequency and extreme runoff frequency (r = 0.91, ρ = 0.89) indicates that years with more days exceeding the extreme precipitation threshold tended to contain more days exceeding the extreme runoff threshold. Similarly, the close relationship between extreme precipitation severity and extreme runoff severity (r = 0.90, ρ = 0.91) indicates that years with more intense precipitation extremes tended to experience more intense extreme runoff events.
These findings are consistent with precipitation being the primary source of runoff water. Runoff occurs when rainfall exceeds the storage of a land-surface system, meaning that the magnitude and frequency of precipitation influence how quickly soil storage capacity is overwhelmed and how much runoff is generated15,16. Research also indicates that the relationship between rainfall and runoff differs across hydroclimatic settings and event characteristics21,22. During more severe events, rainfall can drive significant runoff and flooding17. The results of this study align with those findings, displaying strong positive precipitation–runoff correlations for both frequency and severity variables.
It is also worth noting the distinction in this study’s results between extreme precipitation frequency and severity. Precipitation frequency was most strongly correlated with runoff frequency, while precipitation severity was most strongly correlated with runoff severity. These dynamics suggest that precipitation frequency and severity correspond with different dimensions of extreme runoff, demonstrating an important concept for future analysis of the annual relationship between precipitation and runoff.
Extreme Soil Moisture
The soil moisture results also support the study’s hypothesis. Notably, extreme soil moisture frequency was strongly associated with extreme runoff frequency (r = 0.82, ρ = 0.84), and extreme soil moisture severity was strongly associated with extreme runoff severity (r = 0.64, ρ = 0.57). These results indicate that years with higher soil moisture extremes tend to have more frequent and severe extreme runoff events.
This pattern is consistent with the role of soil moisture in runoff generation. When soil is wet, there is less unsaturated soil to soak up new rainfall, increasing the potential for runoff12,13,14. Studies have also shown that soil moisture can affect runoff efficiency and the timing of runoff response, although these relationships are dependent on storm and soil characteristics13,15. Overall, the results support prior research in affirming that runoff is associated not only with water input from the atmosphere but also with the amount of water already stored in the soil13,14.
Table 3 supports this interpretation. Extreme precipitation frequency was strongly associated with extreme soil moisture frequency (r = 0.83), and extreme precipitation severity was positively associated with extreme soil moisture severity (r = 0.63). These correlations suggest that years with more frequent and severe precipitation extremes may be more likely to have wetter soils. This coupling is relevant, given that both extreme precipitation and extreme soil moisture were strongly and positively correlated with extreme runoff; it suggests that extreme runoff may be most likely to occur in a very wet environment created by a combination of these events.
The strong association between precipitation and soil moisture also means that these two hydroclimatic conditions should not be viewed as fully independent. More likely, their relationships partially reflect the interconnectivity of the hydrological cycle, where precipitation can increase soil moisture and generate runoff, while soil moisture can affect how efficiently later precipitation is converted into runoff13,15. Given this association, the correlations in this study cannot determine the independent relationships that soil moisture and precipitation have with runoff. Instead, they show that both events are meaningful indicators of years with more frequent and severe extreme runoff.
Extreme Heat
The results for extreme heat partially support the original hypothesis. Extreme heat frequency was strongly and negatively correlated with extreme runoff frequency (r = -0.59, ρ = -0.69), suggesting that years with more extreme heat days tended to have fewer extreme runoff days. The other three extreme heat–runoff pairs were not statistically significant in either analysis.
One possible interpretation for the direction of the correlation between extreme heat frequency and extreme runoff frequency is that more heat may increase evapotranspirative demand and contribute to drier surface and subsurface conditions, leaving more soil storage available when precipitation occurs23. The fact that extreme heat variables (particularly heat frequency) were negatively associated with extreme soil moisture and precipitation (Table 3)supports this idea. This is likely not the only phenomenon at play, however, as temperature can affect evapotranspiration, vegetation activity, atmospheric moisture, and precipitation processes simultaneously, making the direction of temperature–runoff correlations heavily context-dependent17,24. Accounting for these additional factors and their relationships with annual temperature and runoff was beyond the scope of this study.
The absence of significant correlations in three of the extreme heat–extreme runoff pairs may also be meaningful. Extreme heat may be more closely associated with runoff frequency than with runoff severity because once precipitation and soil moisture exceed high thresholds, those wet conditions may be more important than temperature in runoff severity. This interpretation is consistent with previous studies, which have found that the relative impact of precipitation, soil moisture, and temperature on runoff varies with hydroclimatic context16,17.
Persistence and Long-Term Trends
The pair-specific autocorrelation analysis indicates that multiple annual variables were not fully independent from year to year. In correlation pairs that used all 44 years, variables showed the following results: extreme runoff frequency r1 = 0.36, extreme runoff severity r1 = 0.46, extreme precipitation frequency r1 = 0.33, extreme precipitation severity r1 = 0.33, extreme heat frequency r1 = 0.31, and extreme soil moisture frequency r1 = 0.18. This interannual persistence resulted in pair-specific Dawdy–Matalas effective sample sizes (Neff) ranging from 32.45 to 41.00 (Table 2). While accounting for autocorrelation slightly reduced the number of independent observations, it only changed the statistical significance of one relationship in the study: the Spearman correlation between extreme precipitation severity and extreme runoff frequency was no longer significant after adjusting for Neff and multiple testing.
Secular trend analysis reveals that both extreme heat frequency (r = 0.52, padj = 0.002) and extreme heat severity (r = 0.50, padj = 0.005) increased significantly from 1980 to 2023 (Table 4). None of the other precipitation, soil moisture, or runoff variables showed significant linear trends over time after false discovery rate (FDR) adjustment. This mismatch in long-term trends between annual extreme heat and annual extreme runoff in Houston highlights the complex relationship of these variables, as an increase in temperature is not always linked to a proportional decrease in runoff. Instead, this study’s results suggest that soil conditions, storm characteristics, and other hydrological conditions seem to be more tied to annual extreme runoff.
Implications
This 44-year analysis highlights the distinct relationships between certain extreme hydroclimatic variables and annual extreme runoff in Houston, Texas. By distinguishing the frequency from the severity of extreme events, the results indicate that (a) precipitation frequency correlated most strongly with runoff frequency, (b) precipitation severity aligned most strongly with runoff severity, and (c) soil moisture was positively associated with both dimensions of extreme runoff. The analysis also showed that temperature had a different relationship with extreme runoff than the wet hydroclimatic variables: extreme heat frequency was negatively correlated with extreme runoff frequency, while extreme heat severity showed no significant correlation with extreme runoff frequency or severity.
In practice, the findings indicate that assessments of extreme runoff conditions in Houston should account for both precipitation and soil moisture in their modeling. More specifically, the strong precipitation–soil moisture coupling and the positive correlation of each of these variables with extreme runoff suggest that trends in wet conditions can provide important context for evaluating the likelihood of high-runoff years. Extreme temperatures may also prove helpful in these evaluations, though the fact that only one of four extreme heat–runoff correlation pairs was significant suggests that more research is needed to better understand this relationship. Additionally, because land-surface runoff can contribute to flooding when local storage and drainage capacity are exceeded, these findings may provide helpful context for local annual flood-risk assessments in parts of Houston25.
Limitations and Recommendations
Precipitation, soil moisture, and runoff are physically linked and are inherently part of the same hydrological system12,26. For example, Table 3 illustrates that extreme precipitation frequency and extreme soil moisture frequency had a strong potential correlation (r = 0.83). The analyses in this study were unable to fully separate the individual associations of precipitation and soil moisture with extreme runoff. In addition, multiple variables exhibited lag-1 autocorrelations, which reduced the effective number of independent annual observations in the 44-year series. Future research could address these limitations by incorporating new methods that evaluate hydroclimatic variables independently while also accounting for temporal persistence to maintain a sufficient sample size.
Furthermore, both the frequency and severity of extreme heat showed statistically significant increases over the time series. Even though trend analysis found no statistically significant long-term changes in extreme precipitation, soil moisture, or runoff, the trends of increasing heat may still influence the hydroclimatic conditions associated with extreme runoff. Fully separating long-term change from year-to-year variability was beyond the scope of this study, though future research could address whether long-term changes in temperature, precipitation, and soil moisture independently contribute to changes in annual extreme runoff.
In addition, this study analyzed a ~1 km2 grid cell in the Houston urban area. The results, therefore, may not be applicable in locations with different climates, soil, topography, or hydrologic characteristics. Future studies should compare the observed runoff relationships with other areas of Houston and other urban environments around the world.
Finally, extreme events were identified using daily WLDAS data, which may have led to multi-day storms being counted as separate extremes and the exclusion of flash runoff events that only occurred for a few hours. Additionally, this analysis did not account for changes in Houston’s urban land cover, impervious surfaces, drainage capacity, or other stormwater management infrastructure over the study period. These factors can affect infiltration, runoff pathways, and the overall accumulation of water during storms and therefore may have influenced the observed associations between hydroclimatic extremes and runoff25,27. Future research could analyze event-based extremes with a multivariable approach incorporating land cover trends, imperviousness, and stormwater infrastructure data to gain a more comprehensive perspective on factors associated with runoff in Houston.
Closing Thought
It is essential to continue conducting studies like this one, as anthropogenic (human-induced) climate change is projected to increase the danger of extreme runoff and other extreme weather events3,28. Improving understanding of the hydroclimatic and surface processes associated with runoff can help identify high-risk periods, inform hydrological modeling, and lead the way for more resilient urban stormwater management infrastructure29,30.
Acknowledgments
I would like to thank Dr. Benjamin Cook of Columbia University’s Climate School for his incredible support in gathering data and mentoring my research. I would also like to thank Ms. Machac and all of the Packer Collegiate Institute ISR faculty and staff for their valuable guidance during my work.
Supplementary Material
The pseudocode used for data processing and statistical analysis is provided in Supplementary Material.
References
- National Centers for Environmental Information. Billion-dollar weather and climate disasters: Overview. National Oceanic and Atmospheric Administration, 2025, https://www.ncei.noaa.gov/access/billions/. [↩]
- A. AghaKouchak, F. Chiang, L. S. Huning, C. A. Love, I. Mallakpour, O. Mazdiyasni, H. Moftakhari, S. M. Papalexiou, E. Ragno, M. Sadegh. Climate extremes and compound hazards in a warming world. Annual Review of Earth and Planetary Sciences. Vol. 48, pg. 519–548, 2020, https://doi.org/10.1146/annurev-earth-071719-055228. [↩] [↩]
- J. Nielsen-Gammon, S. Holman, A. Buley, S. Jorgensen, J. Escobedo, C. Ott, J. Dedrick, A. Van Fleet. Assessment of historic and future trends of extreme weather in Texas, 1900–2036: 2024 update. Office of the State Climatologist, Texas A&M University, 2024, https://texas2036.org/wp-content/uploads/2023/06/2024_ClimateReport.pdf. [↩] [↩] [↩]
- Texas Senate General Investigating Committee on the July 2025 Flooding Events & Texas House General Investigating Committee on the July 2025 Flooding Events. Report on the Camp Mystic flood disaster of July 4, 2025. Texas Legislature, 2026 (June 18), https://www.house.texas.gov/pdfs/committees/355/Report-on-the-Camp-Mystic-Flood-Disaster-of-July-4-2025.pdf?v=1. [↩]
- D. R. Easterling, G. A. Meehl, C. Parmesan, S. A. Changnon, T. R. Karl, L. O. Mearns. Climate extremes: Observations, modeling, and impacts. Science. Vol. 289, 5487, pg. 2068–2074, 2000, https://doi.org/10.1126/science.289.5487.2068. [↩]
- M. D. Statkewicz, R. Talbot, B. Rappenglück. Changes in precipitation patterns in Houston, Texas. Environmental Advances. Vol. 5, Article 100073, 2021, https://doi.org/10.1016/j.envadv.2021.100073. [↩] [↩]
- L. Zhu, S. M. Quiring, I. Guneralp, W. G. Peacock. Variations in tropical cyclone-related discharge in four watersheds near Houston, Texas. Climate Risk Management. Vol. 7, pg. 1–10, 2015, https://doi.org/10.1016/j.crm.2015.01.002. [↩]
- L. Zhu, K. Emanuel, S. M. Quiring. Elevated risk of tropical cyclone precipitation and pluvial flood in Houston under global warming. Environmental Research Letters. Vol. 16, 9, Article 094030, 2021, https://doi.org/10.1088/1748-9326/ac1e3d. [↩] [↩]
- C. Li, M. Liu, Y. Hu, T. Shi, X. Qu, M. T. Walter. Effects of urbanization on direct runoff characteristics in urban functional zones. Science of the Total Environment. Vol. 643, pg. 301–311, 2018, https://doi.org/10.1016/j.scitotenv.2018.06.211. [↩]
- T. G. Nodine, G. Conley, C. A. Riihimaki, C. Holland, N. G. Beck. Modeling the impact of future rainfall changes on the effectiveness of urban stormwater control measures. Scientific Reports. Vol. 14, Article 4082, 2024, https://doi.org/10.1038/s41598-024-53611-1. [↩]
- W. Zhang, G. Villarini, G. A. Vecchi, J. A. Smith. Urbanization exacerbated the rainfall and flooding caused by Hurricane Harvey in Houston. Nature. Vol. 563,7731, pg. 384–388, 2018, https://doi.org/10.1038/s41586-018-0676-z. [↩]
- W. T. Crow, F. Chen, R. H. Reichle, Y. Xia, Q. Liu. Exploiting soil moisture, precipitation, and streamflow observations to evaluate soil moisture/runoff coupling in land surface models. Geophysical Research Letters. Vol. 45, 10, pg. 4869–4878, 2018, https://doi.org/10.1029/2018GL077193. [↩] [↩] [↩]
- D. Penna, H. J. Tromp-van Meerveld, A. Gobbi, M. Borga, G. Dalla Fontana. The influence of soil moisture on threshold runoff generation processes in an alpine headwater catchment. Hydrology and Earth System Sciences. Vol. 15, pg. 689–702, 2011, https://doi.org/10.5194/hess-15-689-2011. [↩] [↩] [↩] [↩] [↩] [↩] [↩]
- G. Meißl, K. Klebinder, T. Zieher, V. Lechner, B. Kohl, G. Markart. Influence of antecedent soil moisture content and land use on the surface runoff response to heavy rainfall simulation experiments investigated in Alpine catchments. Heliyon. Vol. 9, 8, Article e18597, 2023, https://doi.org/10.1016/j.heliyon.2023.e18597. [↩] [↩] [↩] [↩]
- N. K. Singh, R. E. Emanuel, B. L. McGlynn, C. F. Miniat. Soil moisture responses to rainfall: implications for runoff generation. Water Resources Research. Vol. 57, Article e2020WR028827, 2021, https://doi.org/10.1029/2020WR028827. [↩] [↩] [↩] [↩] [↩]
- Q. Ran, J. Wang, X. Chen, L. Liu, J. Li, S. Ye. The relative importance of antecedent soil moisture and precipitation in flood generation in the middle and lower Yangtze River basin. Hydrology and Earth System Sciences. Vol. 26, pg. 4919–4931, 2022, https://doi.org/10.5194/hess-26-4919-2022. [↩] [↩] [↩]
- C. Wasko, A. Sharma. Global assessment of flood and storm extremes with increased temperatures. Scientific Reports. Vol. 7, Article 7945, 2017, https://doi.org/10.1038/s41598-017-08481-1. [↩] [↩] [↩] [↩]
- S. Jian, C. Yin, Y. Wang, X. Yu, Y. Li. The possible incoming runoff under extreme rainfall event in the Fenhe River Basin. Frontiers in Environmental Science. Vol. 10, Article 812351, 2022, https://doi.org/10.3389/fenvs.2022.812351. [↩]
- A. Vaidyanathan, S. R. Kegler, S. S. Saha, J. A. Mulholland. A statistical framework to evaluate extreme weather definitions from a health perspective: a demonstration based on extreme heat events. Bulletin of the American Meteorological Society. Vol. 97, 10, pg. 1817–1830, 2016, https://doi.org/10.1175/BAMS-D-15-00181.1. [↩]
- A. M. G. Klein Tank, F. W. Zwiers, X. Zhang. Guidelines on analysis of extremes in a changing climate in support of informed decisions for adaptation (WMO-TD No. 1500). World Meteorological Organization, 2009, https://www.ecad.eu/documents/WCDMP_72_TD_1500_en_1.pdf. [↩]
- L. Tarasova, S. Basso, M. Zink, R. Merz. Exploring controls on rainfall-runoff events: 1. time series-based event separation and temporal dynamics of event runoff response in Germany. Water Resources Research. Vol. 54, 10, pg. 7711–7732, 2018, https://doi.org/10.1029/2018WR022587. [↩]
- Y. Zheng, G. Coxon, R. Woods, J. Li, P. Feng. Controls on the spatial and temporal patterns of rainfall-runoff event characteristics—a large sample of catchments across Great Britain. Water Resources Research. Vol. 59, 6, Article e2022WR033226, 2023, https://doi.org/10.1029/2022WR033226. [↩]
- L. E. Condon, A. L. Atchley, R. M. Maxwell. Evapotranspiration depletes groundwater under warming over the contiguous United States. Nature Communications. Vol. 11, Article 873, 2020, https://doi.org/10.1038/s41467-020-14688-0. [↩]
- M. L. Goulden, R. C. Bales. Mountain runoff vulnerability to increased evapotranspiration with vegetation expansion. Proceedings of the National Academy of Sciences. Vol. 111, 39, pg. 14071–14075, 2014, https://doi.org/10.1073/pnas.1319316111. [↩]
- T. D. Fletcher, M. J. Burns, K. L. Russell, P. Hamel, S. Duchesne, F. Cherqui, A. H. Roy. Concepts and evolution of urban hydrology. Nature Reviews Earth & Environment. Vol. 5, pg. 789–801, 2024, https://doi.org/10.1038/s43017-024-00599-x. [↩] [↩]
- Y. Zhong, B. Tian, H. Kim, X. Yuan, X. Liu, E. Zhu, Y. Wu, L. Wang, L. Wang. Over 60% precipitation transformed into terrestrial water storage in global river basins from 2002 to 2021. Communications Earth & Environment. Vol. 6, Article 53, 2025, https://doi.org/10.1038/s43247-024-01967-7. [↩]
- U.S. Environmental Protection Agency. Urbanization – stormwater runoff. CADDIS: Causal Analysis/Diagnosis Decision Information System, 2015, https://www.epa.gov/caddis/urbanization-stormwater-runoff. [↩]
- A. Alborzi, Y. Zhao, A. Nazemi, A. Mirchi, I. Mallakpour, H. Moftakhari, S. Ashraf, R. Izadi, A. AghaKouchak. The tale of three floods: from extreme events and cascades of highs to anthropogenic floods. Weather and Climate Extremes. Vol. 38, Article 100495, 2022, https://doi.org/10.1016/j.wace.2022.100495. [↩]
- L. R. N. P. Rentachintala, M. G. M. Reddy, P. K. Mohapatra. Urban stormwater management for sustainable and resilient measures and practices: a review. Water Science and Technology. Vol. 85, 4, pg. 1120–1140, 2022, https://doi.org/10.2166/wst.2022.017. [↩]
- M. J. Webb, C. M. Albano, D. Bozkurt, R. D. Garreaud, A. M. Wilson, G. Yu, M. L. Anderson, F. M. Ralph. Antecedent moisture enhances early warning of atmospheric river flood hazards. Nature Communications. Vol. 17, Article 2693, 2026, https://doi.org/10.1038/s41467-026-69286-3. [↩]