

Abstract
In humid, high temperatures regions, cooling typically accounts for most high-rise office building expenditure due to solar heat gain from large glass facades. This study evaluates the solar heat reduction of low-cost Zinc Oxide (ZnO) nanoparticle coatings on glass panels. Six Polyvinyl Acetate (PVAc) ZnO coating formulations were tested, using 0.5 μm or 5 μm ZnO nanoparticles at concentrations of 0.5%, 1.0%, and 1.5% by wet mass. Temperature changes under solar exposure were recorded in 5-minute intervals for 1 hour in coated glass (0.02mm) panel-mounted Styrofoam boxes, relative to an uncoated glass control. Contrary to the initial hypothesis, the PVAc 5 μm ZnO coatings performed better than the PVAc 0.5 μm ZnO coatings at equivalent concentrations. For 5 μm ZnO nanoparticle size, solar heat reduction efficiency peaked at 1.5%, while 0.5 μm coating performance was inconsistent at different concentrations. All ZnO coatings reduced light transmission, though 5 μm ZnO exhibiting higher transparency than 0.5 μm ZnO coatings at equivalent concentration (69-83%). The findings in the study show that larger ZnO nanoparticle coatings can be effectively used for low-cost solar heat reduction, while sub-micron nanoparticle sizes demonstrate clumping and decreased solar heat reduction. Additional research should focus on optimizing the transparency, UV reflection, water resistance, and solar heat reduction to enable widespread commercial use for green buildings.
Keywords: Zinc Oxide, Nanoparticles, Polyvinyl Acetate, Solar Heat Reduction, Glass Coatings.
Introduction
In countries with warm climates, the use of air conditioning is widespread. This results in significant waste heat from the condensers and high expenditures in energy1,2. In tall office buildings with transparent glass panels, the indoor temperature rises considerably from sunlight, specifically from the infrared spectrum of light. A low-cost solution would be applying a coating that reflects infrared and UV rays, allowing the glass to be translucent while maintaining low interior temperatures. If implemented correctly, energy costs can be reduced, and the urban heat island effect3,4 can be lessened. The urban heat island effect significantly increases cooling demand and demand rises further during heat waves5. One way to combat the urban heat island effect is the implementation of passive solar heat reduction methods. Kalwry et al. concluded that curtain façade walling systems show a significant improvement in energy usage6. Instead of involving large architectural changes to buildings, glass coatings can achieve similar solar heat reduction effects7. Glass coatings commonly use mineral filters, crystalline compounds that physically manipulate light through their structure. Bao et al. demonstrated that applying a TiO2@SiO2 mineral filter coating to glass significantly improved its thermal insulation compared to untreated glass8. Mineral filters work by absorbing UV rays and converting it into heat. Mineral filters also have a high refractive index and are able to reflect UV rays9. The most common mineral filters are Zinc Oxide (ZnO) and Titanium Dioxide, which can be found in sunscreens10. When comparing the two compounds, Titanium Dioxide has a higher refractive index and is more commonly used in white paints11. However, a high refractive index would cause a coating of the nanoparticle to have low transparency, interfering with light in the visible wavelength. For this reason, ZnO is more favorable than Titanium Dioxide for a glass coating.
To effectively apply ZnO nanoparticles to glass, it would have to be mixed with a binder to allow the nanoparticles to form a clear film with the highest amount of absorption. A binder such as PVAc can be used to both attach the ZnO to the glass12 and emit thermal radiation, allowing for solar heat reduction. A study done by Abd El-Wahab et al. showed samples of ZnO exhibiting no damage or cracking until 500 °C. The weight and color of ZnO nanoparticles also did not change under high temperatures13 PVAc has a high viscosity, and a method to mix dry ZnO nanoparticles in the solution is the addition of Isopropyl Alcohol (IPA), which has a much lower surface tension than PVAc14 and fully evaporates without leaving any residue.
Regarding ZnO-integrated composite films, a study by Sui et al. investigated the properties of ZnO and Polyvinyl Alcohol (PVA) hybrid nanofibers in the application of nanomaterials for electronic devices. The electrospinning technique was used to produce dry fibers with a concentration of ~1% ZnO quantum dots. This hybrid nanofiber material was compared to ZnO quantum dots, PVA fibers, and PVA/ZnO spin-cast film. The study showed that the electro-spun hybrid fibers have a much higher photoluminescence (PL) intensity from the wavelengths of 350-600 nm than the three other materials. The uniform dispersal of ZnO quantum dots and high surface-to-volume ratio gave the nanofibers higher PL intensities. This goes to show that a composite coating of ZnO nanoparticles and PVA can have a high heat emittance15. The study demonstrates the optical benefits of ZnO distribution within a polymer and the importance of nanoparticle density and concentration. Although the study involves PVA instead of PVAc, both of these compounds are vinyl-based polymers that have similar optical properties.
This research paper investigates the solar heat reduction of ZnO nanoparticle coating on glass with varying concentrations and nanoparticle sizes. This will be achieved by mixing different amounts and sizes of ZnO nanoparticles and PVAc in a solution to coat glass panes. The glass panes will then be placed on top of empty Styrofoam boxes with temperature probes to measure the internal simulated room temperature.
The hypothesis posits that the internal temperature would be the lowest when both the concentration of the nanoparticles is the highest and the nanoparticle size is the lowest. These variables in theory allow for the largest ZnO-covered surface area and greater solar heat reduction. In addition to surface area, when the particle size is close to the wavelength of light, Mie scattering occurs16. This process is used in solar panels to increase the efficiency of the individual cells17. A study by Chen et al. showed that the optical performance of ZnO nanoparticles is heavily dictated by the particle morphology and size. The research demonstrated how changes in particle size drastically change the FT-IR spectra of the medium and, when a back light is used, can change the color in the visible spectrum. When comparing the interaction of 0.5 μm and 5 μm ZnO nanoparticles with light, 0.5 μm had much more efficient resonant Mie scattering, which allowed for a greater amount of backscattering, and solar heat reduction18. A study by Hwang et al. tested six cells with various glass formulations placed outside. The temperature was recorded every 5 minutes. Variations in his data that exceeded comfort limits were attributed to temperature throttling and uncontrolled floating air humidity19. To address these limitations, a controlled experiment was conducted to minimize such data variability in this study. Unlike prior studies that focused on individual optical properties or outdoor setups, this work isolates the combined impact of nanoparticle size and concentration on the cooling performance of thin ZnO coatings.
This study evaluated the solar heat reduction of 0.02mm ZnO coatings (5 μm and 0.5 μm ZnO nanoparticles at 0.5%, 1%, and 1.5% concentrations) applied to glass panels mounted over Styrofoam boxes. The coatings were tested in two experimental phases, firstly under direct sunlight and then under a reptile bulb. Excluded from the investigation are tests of different mineral filters, variable coating thicknesses, and long-term coating degradation under high humidity and UV. The constraints of the study include limitations in sample size, testing duration, and testing equipment of greater accuracy.
Methods
Materials & Equipment
Clock, Styrofoam boxes, temperature probes, glass panes, tape, 5 μm ZnO nanoparticles, 0.5 μm ZnO nanoparticles, Polyvinyl Acetate (PVAc), distilled water, IPA, clear liquid soap, gloves, N95 mask, beaker, digital scale, glass rod, micropipette, micrometer, reptile bulb, microscope.
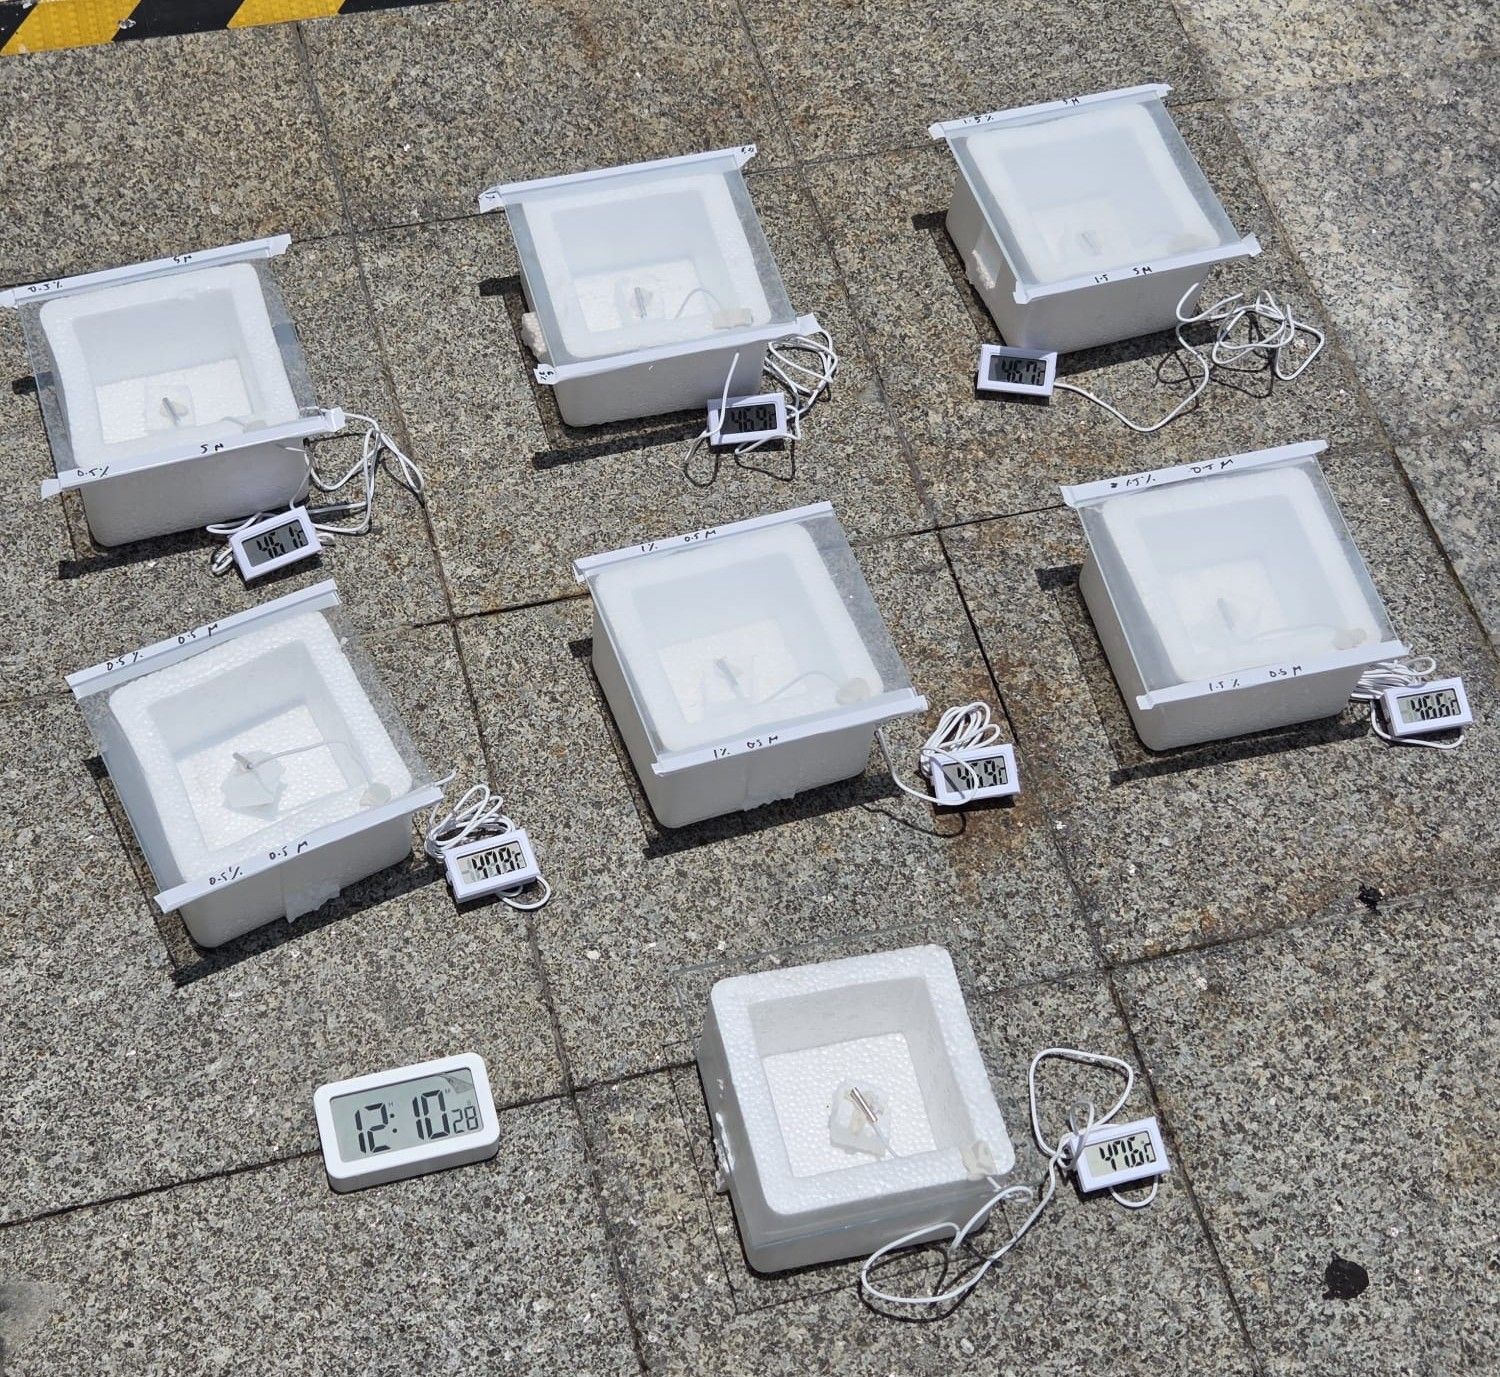
For the first experiment setup, 7 boxes and temperature probes were used to collect data. One panel was left untreated and was used as the baseline for comparison. The 7 glass panels were placed on top of identical Styrofoam boxes. Each box individually had a temperature probe placed in the middle of the box, and a coated or uncoated glass pane for the experiment. These 7 boxes collected data for the 5 μm ZnO nanoparticles of 0.5%, 1%, and 1.5% concentrations, the 0.5 μm ZnO nanoparticles of 0.5%, 1%, and 1.5% concentrations, and an untreated panel as a control. The concentrations were determined as the percentage mass of ZnO in the coating before it was dried. The mass of the materials was determined by a digital scale, and the clear liquid soap was added using a micropipette. All the boxes were then placed next to one another and exposed to the sun under the same conditions and for the same duration. The temperature of each box was recorded every five minutes for the duration of an hour. The data was then graphed to determine the coating mixture with the greatest solar heat reduction.
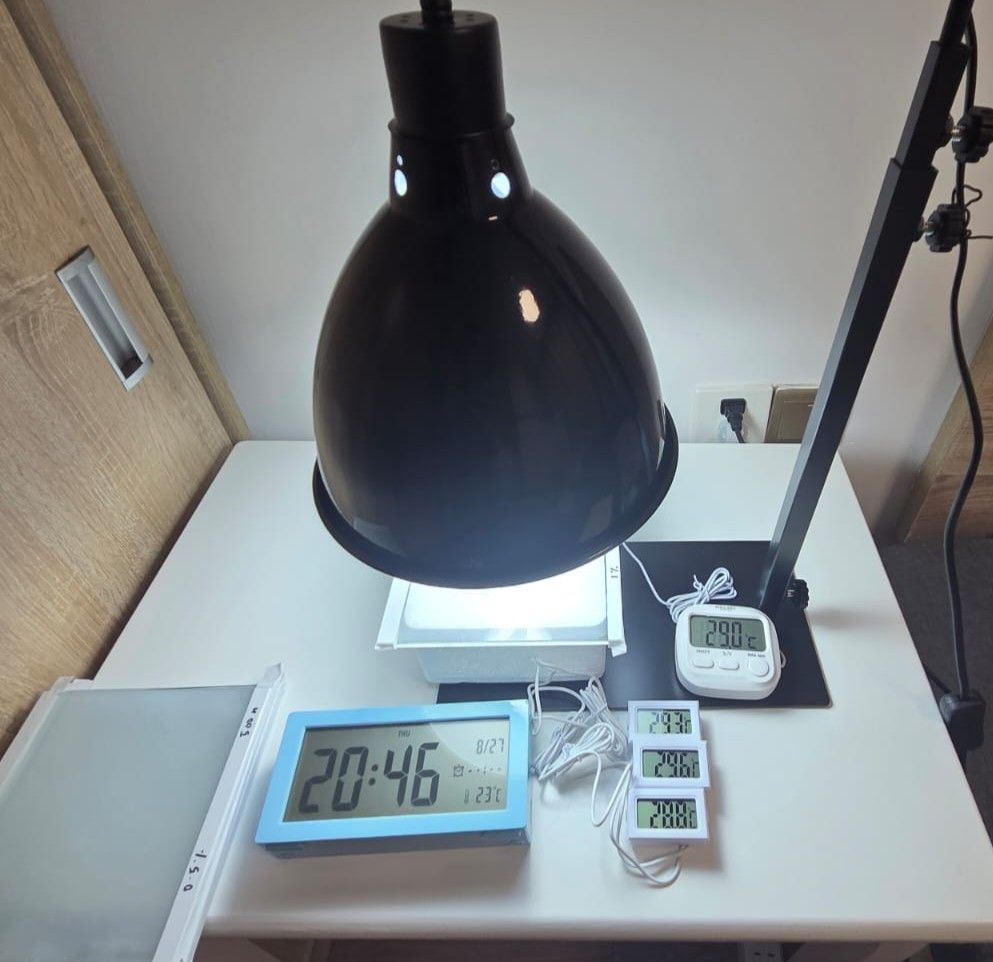
In a second controlled experiment, the same 7 coating formulations were applied on new panes, and 4 separate temperature probes placed in the corners of each box were used to collect data. An additional panel of pure PVAc was used as an additional test. Each individual Styrofoam box was placed under a reptile lamp for a duration of 45 minutes, while using 4 separate thermometers in the different regions of the box to determine an average value. The temperature was recorded every five minutes. Each temperature probe had the same starting temperature of 22.7 °C ±0.5°C. The air conditioning in the room was set to 22.0°C and the reptile bulb was 10 cm away from the glass. The bulb produced a light intensity of 524 Lux measured with a smartphone.
The PVAc glue used was commonly available clear, brand name Mont Marte Signature Clear PVA Glue (PVAc in chemical composition). The composition of the glue is not publicly available. Commercial clear PVAc glues have a composition of 30% PVAc and 70% water. Standard economic and school-grade liquid PVA glues (such as Elmer’s or generic student formulations) consistently consist of 30% PVAc to exhibit certain drying speeds and viscosities.
The dimensions of the interior of the Styrofoam boxes were 9.5cm by 9.5cm wide and 6.2cm deep. The glass panels were 150mm by 150mm wide and 4.90mm thick. The coats fully covered the opening of the box when the panels were placed over the boxes.
Research Design
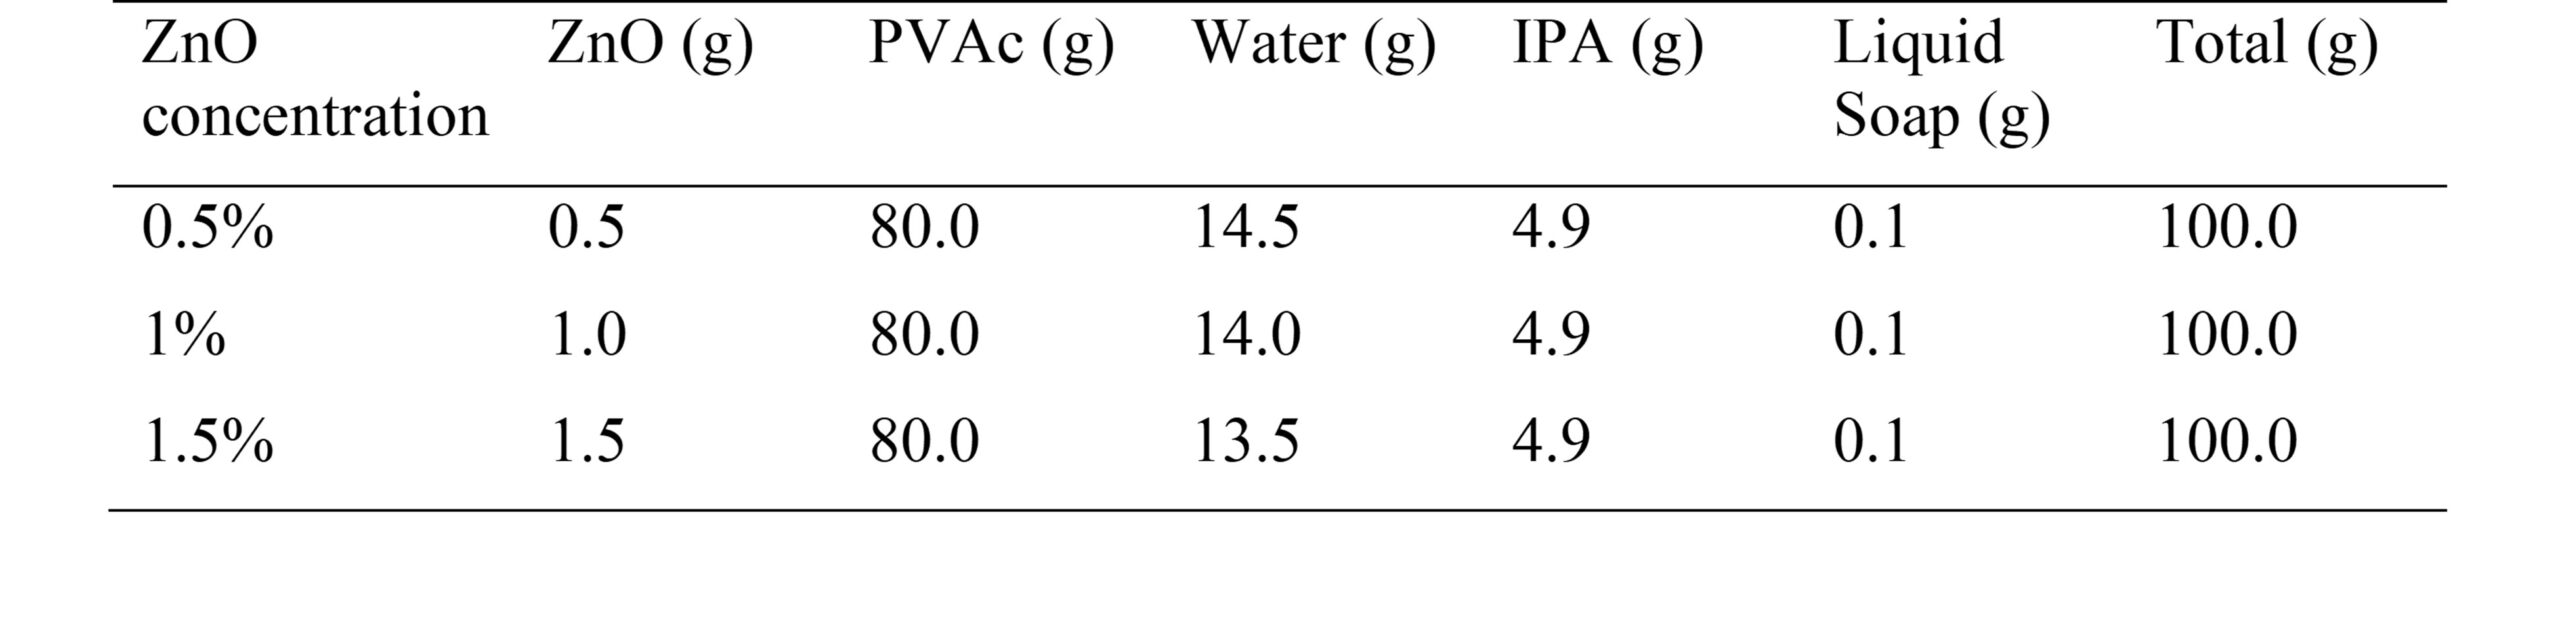
To prepare the coatings, 4.9 g of IPA, 0.1 g of clear liquid soap, and ZnO nanoparticles were added to a beaker. 1 g of ZnO per percentage mass was added (for example, 1 g for a concentration of 1%). The solution was then made up to 20 g with distilled water, and the solution was stirred with the glass rod vigorously for 5 minutes, forming a homogeneous white suspension. 80 g of PVAc was then added to the solution and stirred for 3 minutes; then the solution was left for 10 minutes to allow air bubbles to escape.
For the application of the coatings, white electrical tape of thickness 0.15mm (measured using a micrometer) was laid on the left and right borders of the glass pane. The coating solution was then poured onto the top edge of the pane (with ZnO suspension remaining stable throughout application), and a glass rod was pulled smoothly along the tape, leaving a uniform film on the glass pane with the same thickness as the tape. The same process was done for all the coatings. After coating, the glass panes were left to dry indoors overnight. Using a micrometer, the thickness of the glass panes without coating was determined to be 4.90mm in 3 separate locations. This was repeated with the dry coating and a measurement of 4.92mm was the result in the same 3 locations after the coating was applied for all glass coatings. The thickness of the dry coating was 0.02mm, the difference of the two.
The composition of the coating was designed to allow for a uniform distribution of the nanoparticles. ZnO nanoparticles when dry are attracted to each other due to Van der Waals forces20. This causes clumps to form if the powder is directly added to water or PVAc. To prevent this, the ZnO nanoparticles are first mixed into an initial suspension of distilled water, Isopropyl Alcohol (IPA), and clear liquid soap. This is to mix the nanoparticles evenly throughout the liquid, and then into the PVAc. The IPA has a low surface tension that decreases when Al2O3 was added in a study21, allowing the dry powder to mix. Clear liquid soap is used to overcome the Van der Waals forces between the ZnO nanoparticles22, forming the initial suspension. In the final dry coating, the distilled water and IPA evaporate, leaving the PVAc, ZnO, and a negligible amount of clear liquid soap.
Data Collection
To ensure the samples were subjected to the same conditions, all 7 boxes were placed side by side in direct exposure to the sun for the same time period. At 12:05, the 7 boxes were put under the sun with a starting temperature of 42.3°C ±0.5°C, and a picture was taken every 5 minutes for a duration of 60 minutes until the final reading at 13:05. There was a temperature probe in each box. The temperature of each box was then recorded from the photo, and then entered into an Excel spreadsheet. The temperature difference with respect to the control was then calculated. To determine the effectiveness of the coatings, the temperature of each sample was subtracted from the uncoated control for every 5 minute interval. The temperature change over the 60 minutes was calculated for all six coatings, and the differences were graphed to show the solar heat reduction based on the nanoparticle size and concentration.
In the second experiment, each box was exposed a reptile bulb for the duration of 45 minutes. A picture was taken every 5 minutes, and the 4 temperature readings for each box were taken down. The average of these 4 readings were then plotted in a graph against one another in Excel.
The independent variable was the size and concentration of the ZnO nanoparticles, and the dependent variable was the internal temperature of each box. The control variables were the insulation of the box, duration of exposure, type of exposure, starting internal temperature (±0.5°C) and thickness of ZnO coating. The control variables for the second experiment changed slightly with intensity of light source, distance from the light source and duration of exposure.
The equipment and materials used in the study were generally non-toxic and safe. Basic safety rules were followed throughout the experiment to ensure the safety of personnel. Gloves and N95 masks were used when handling the ZnO nanoparticles. The experiment did not include testing on live subjects or equipment with restrictive guidelines.
Results
Phase 1 Experimental Results
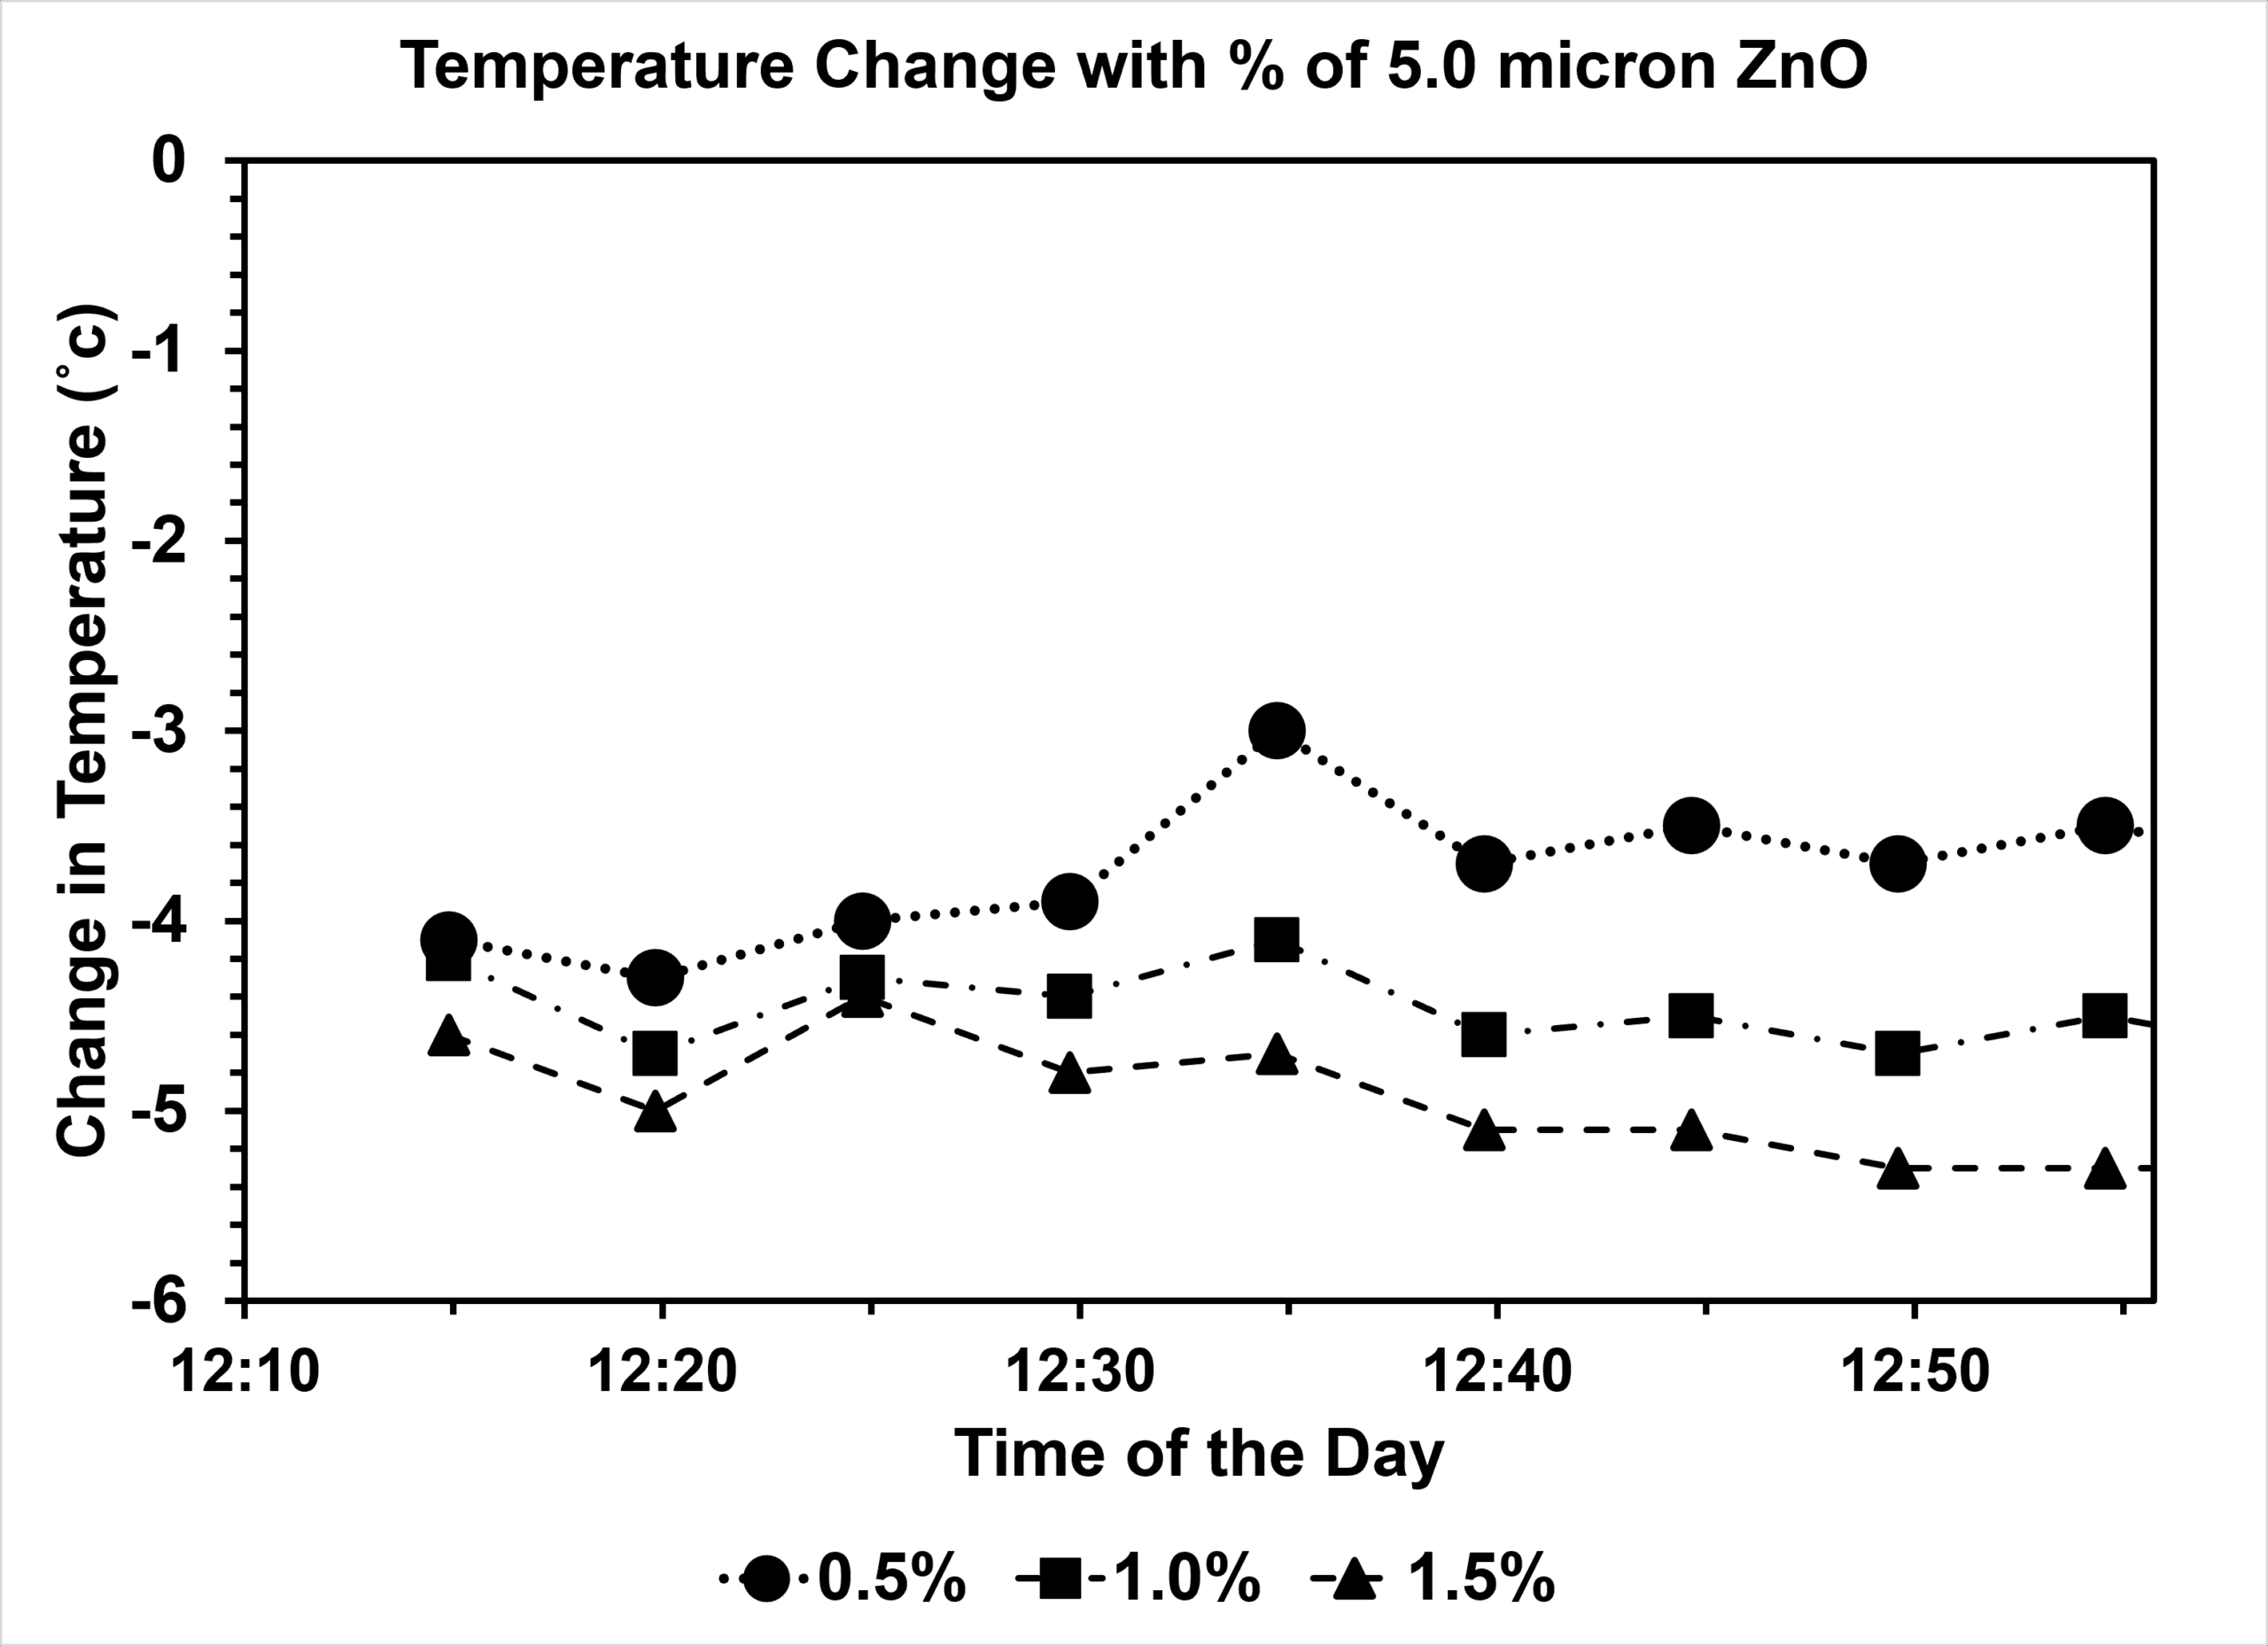
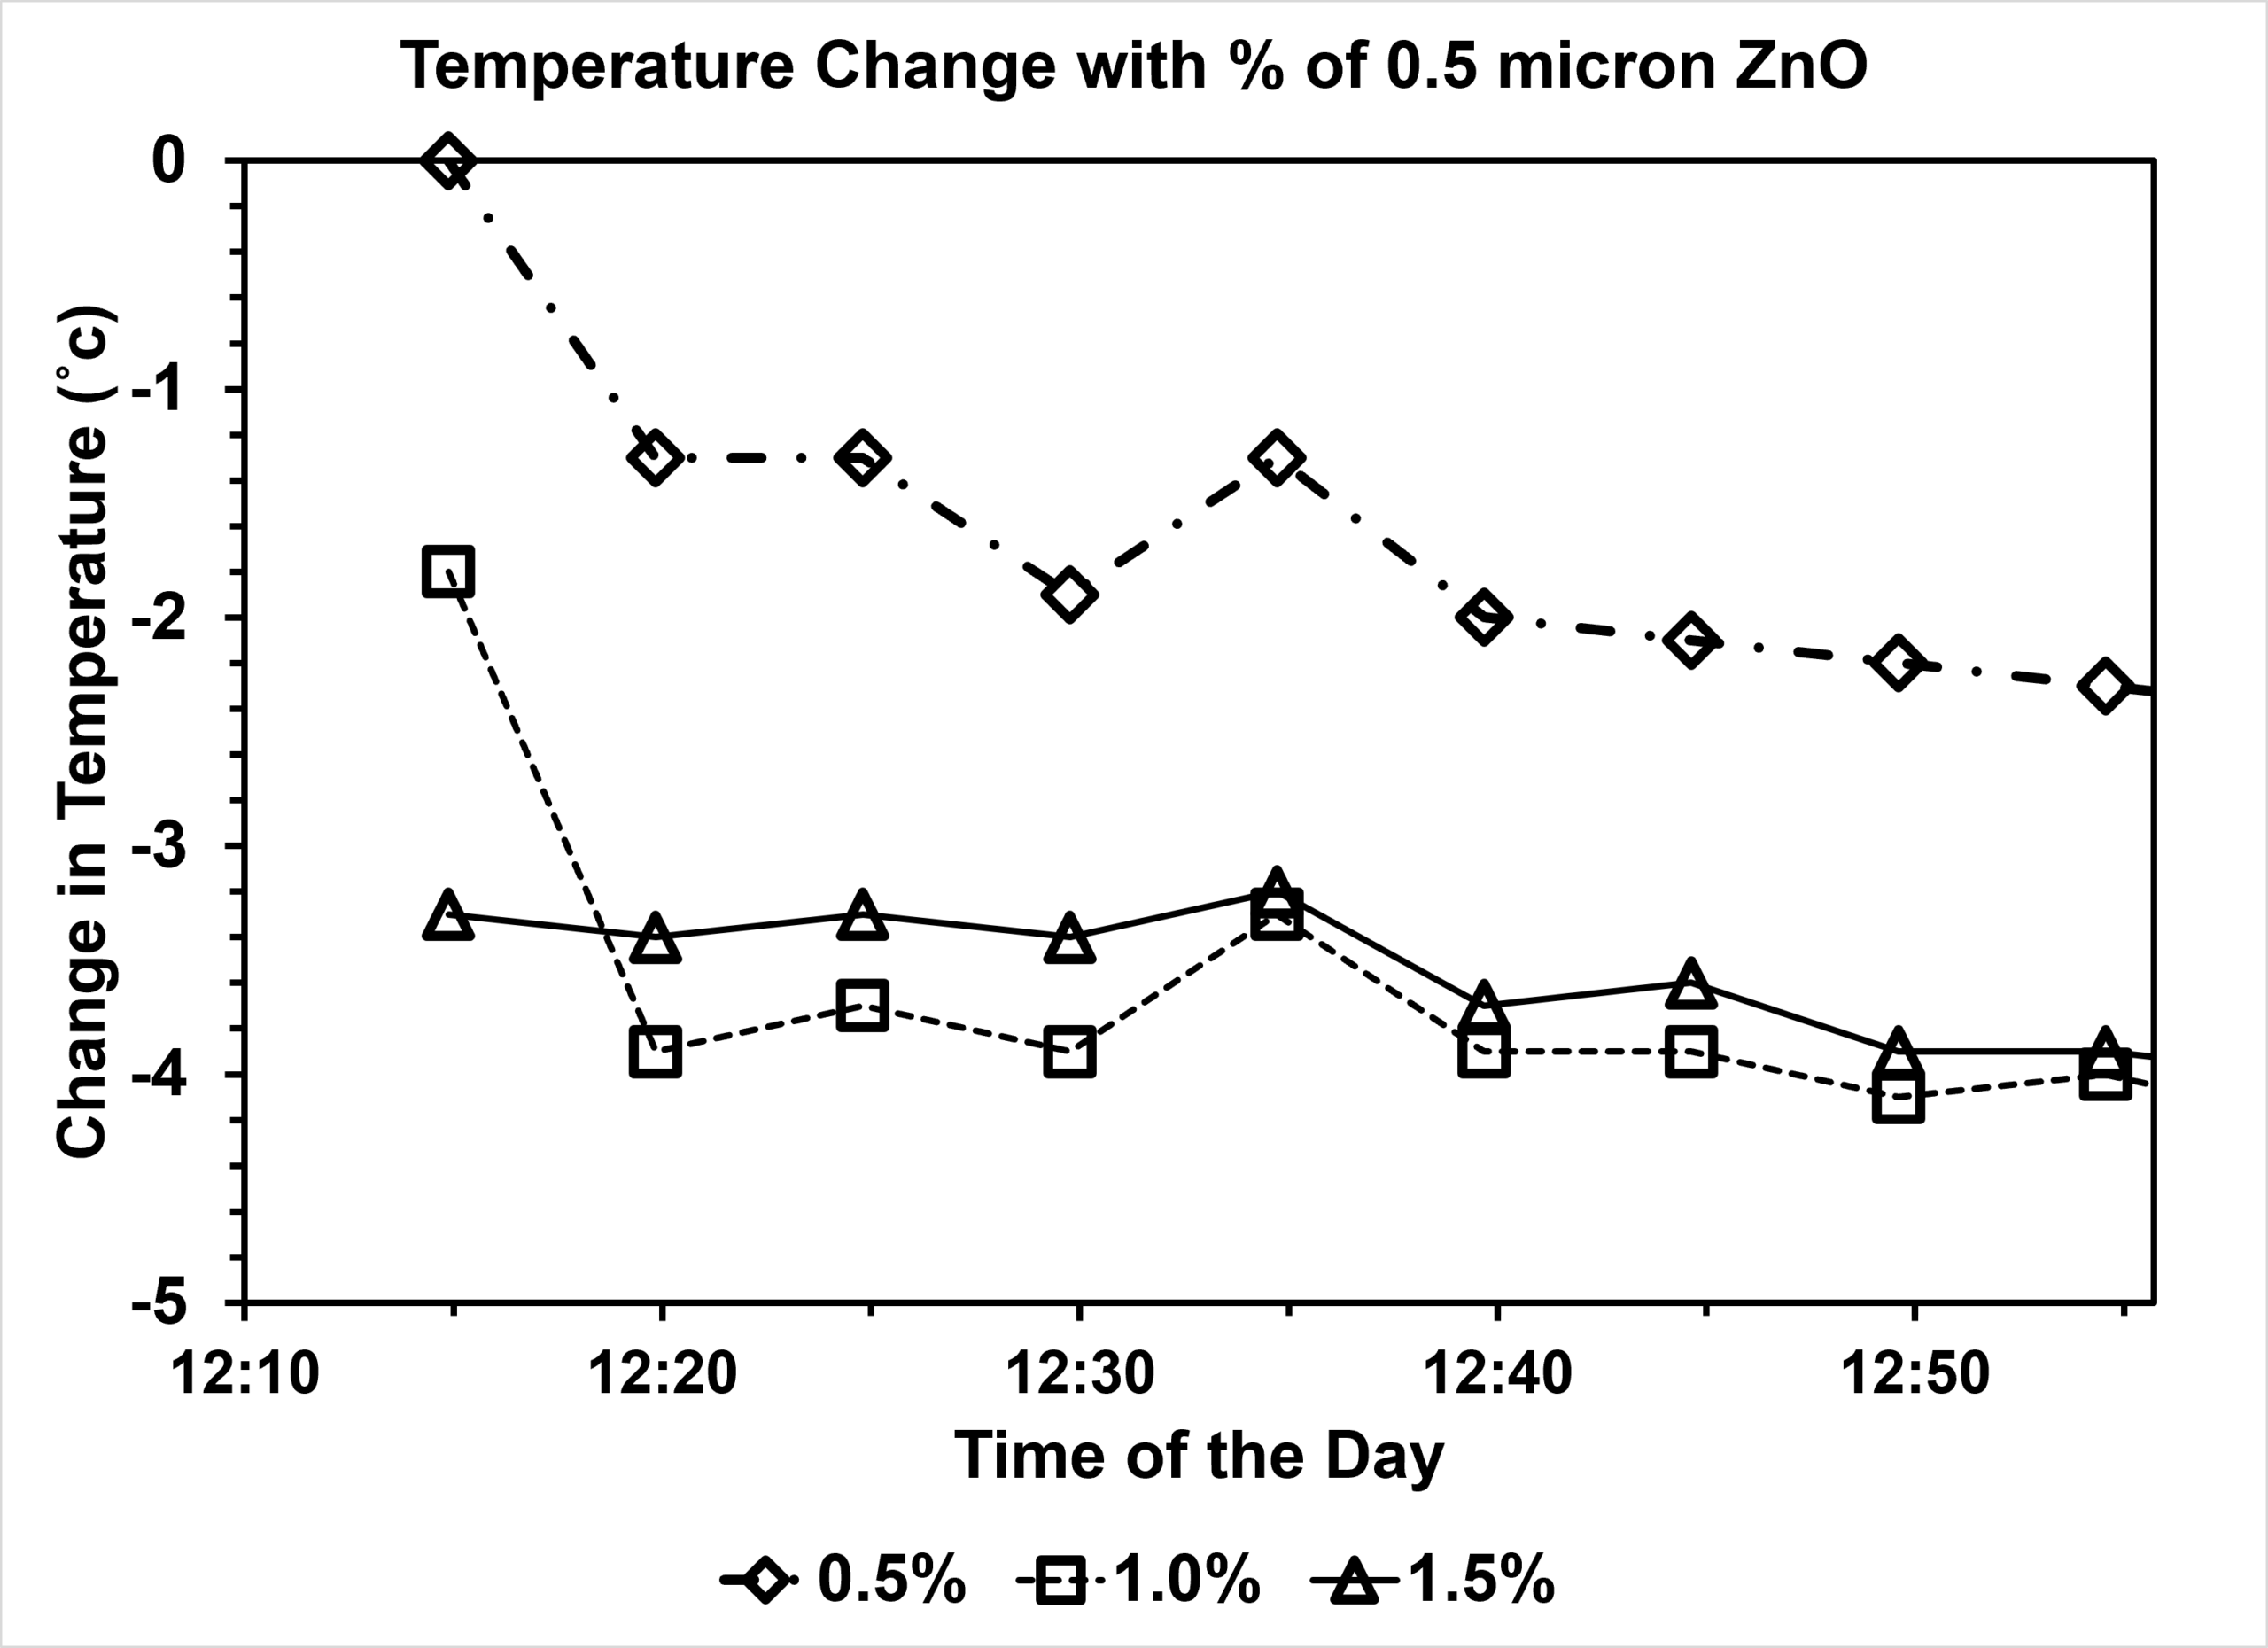
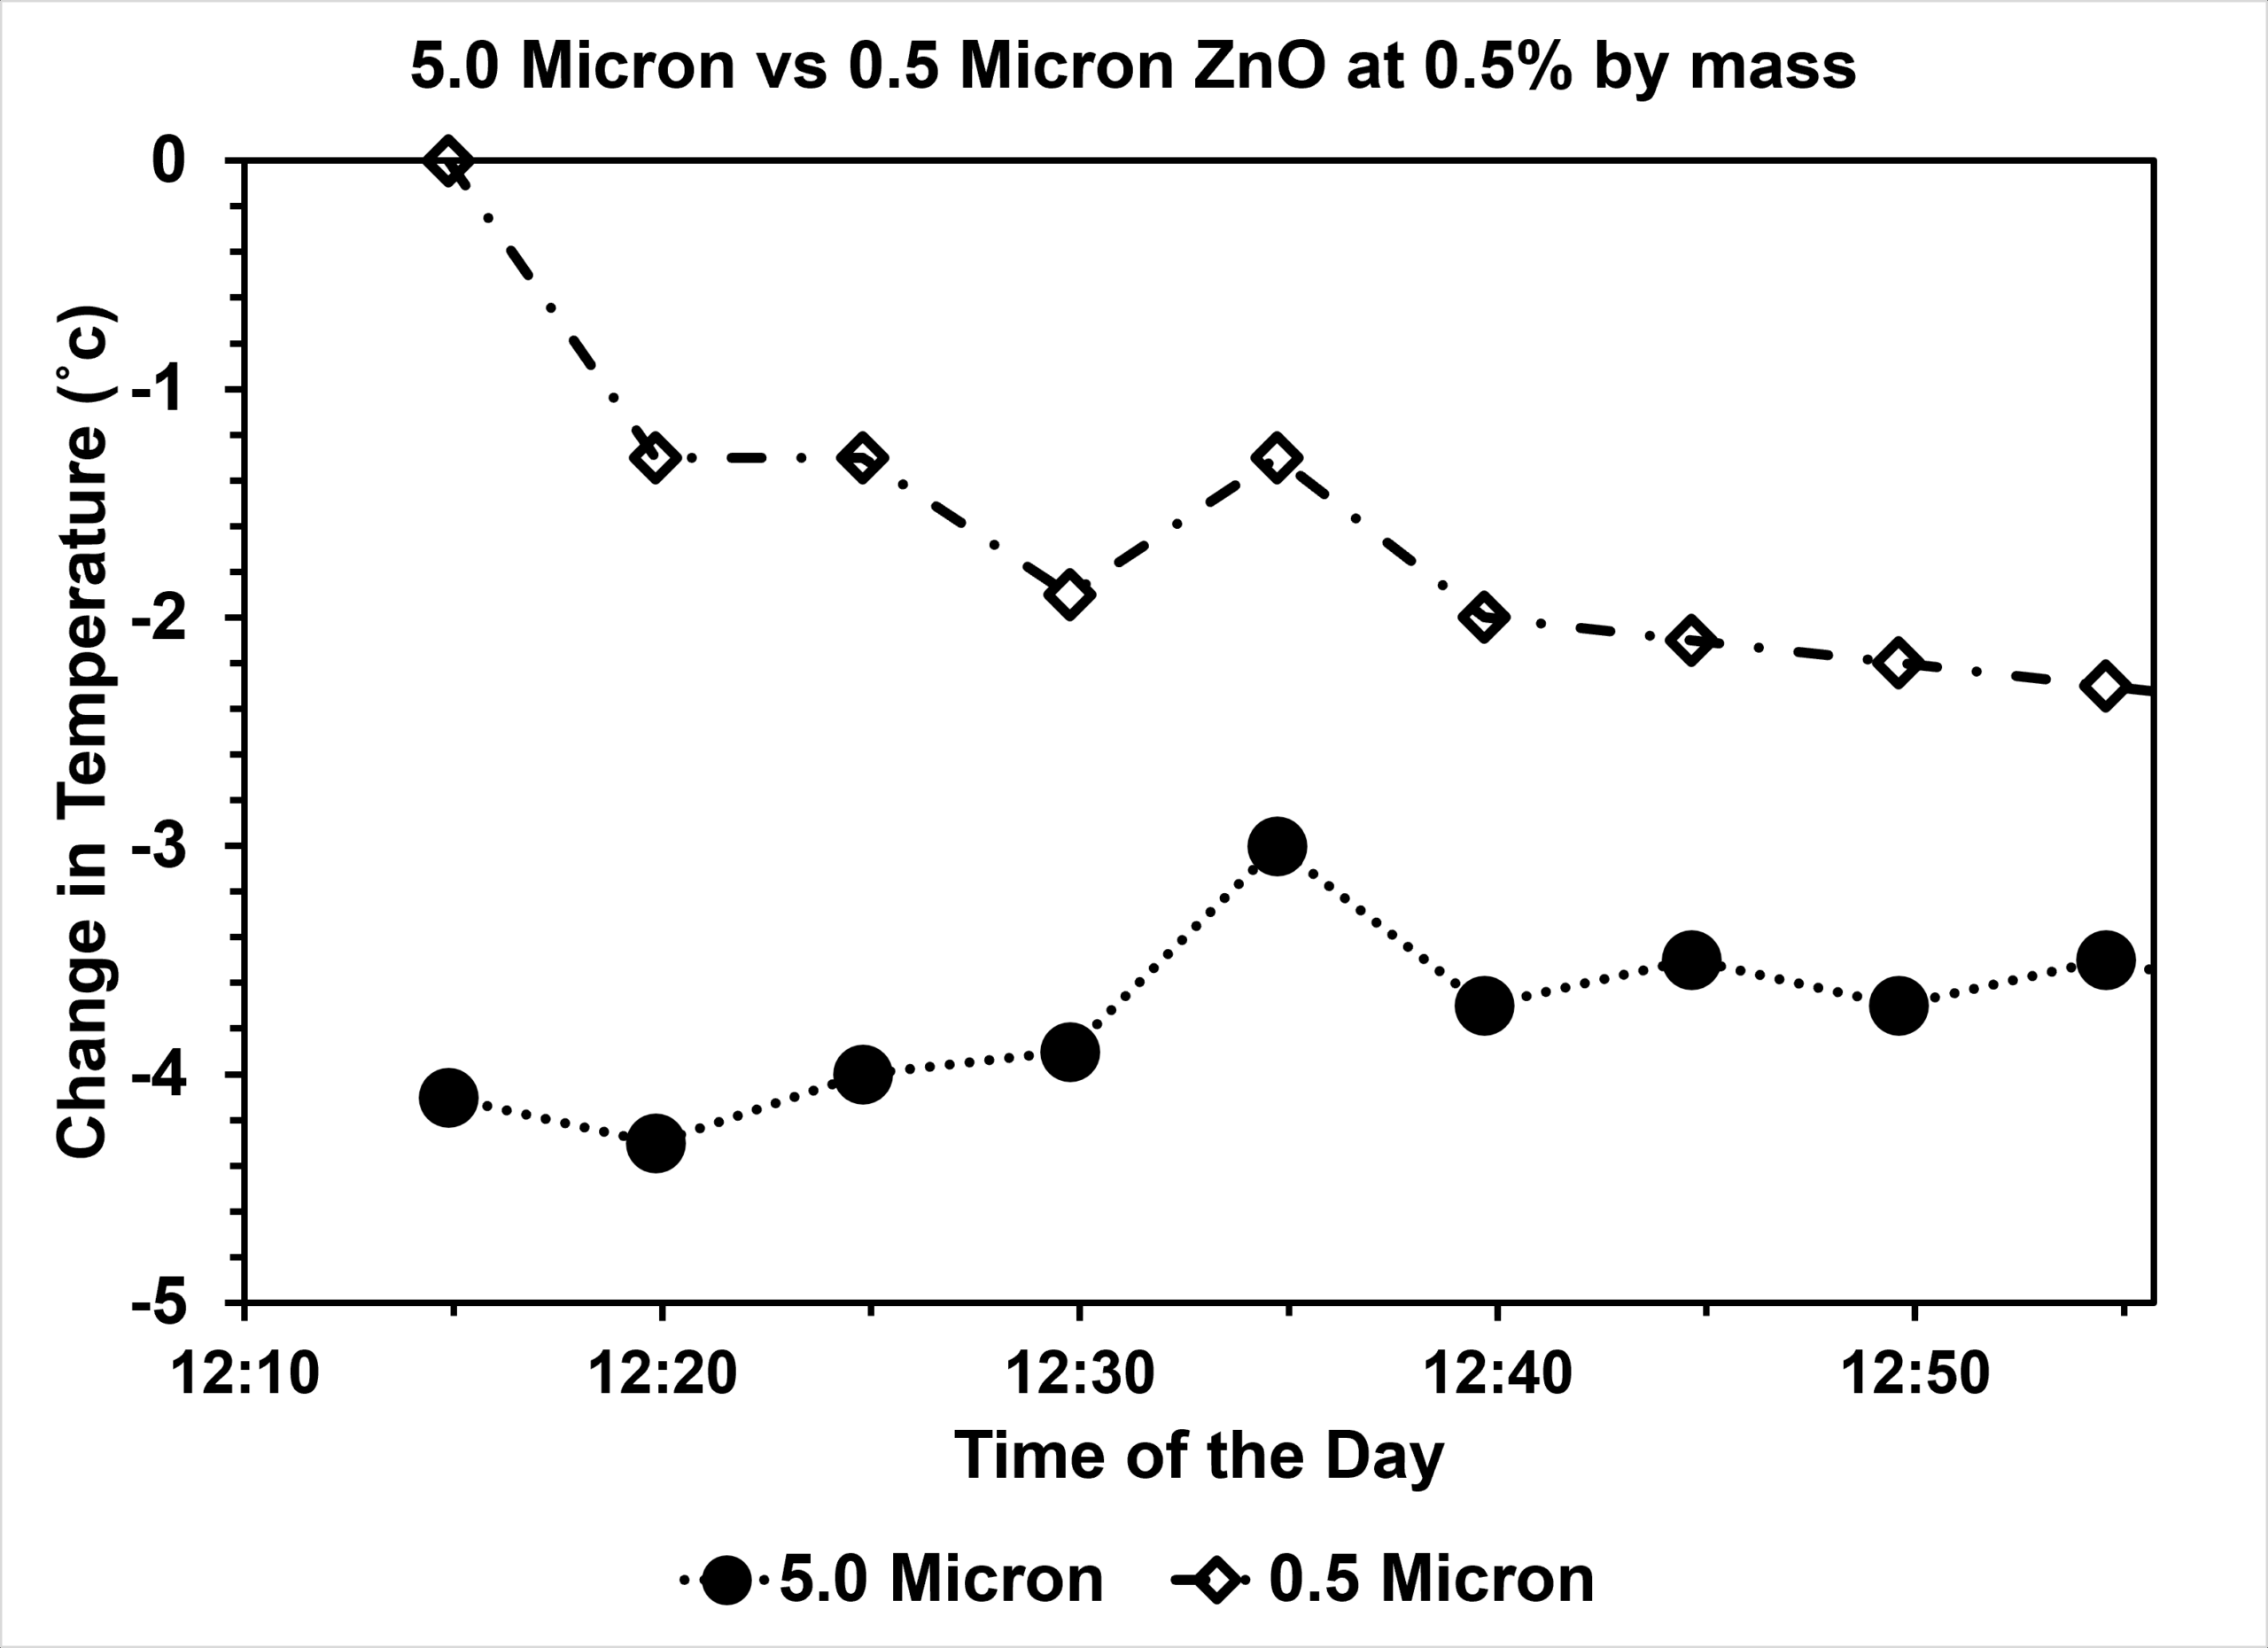
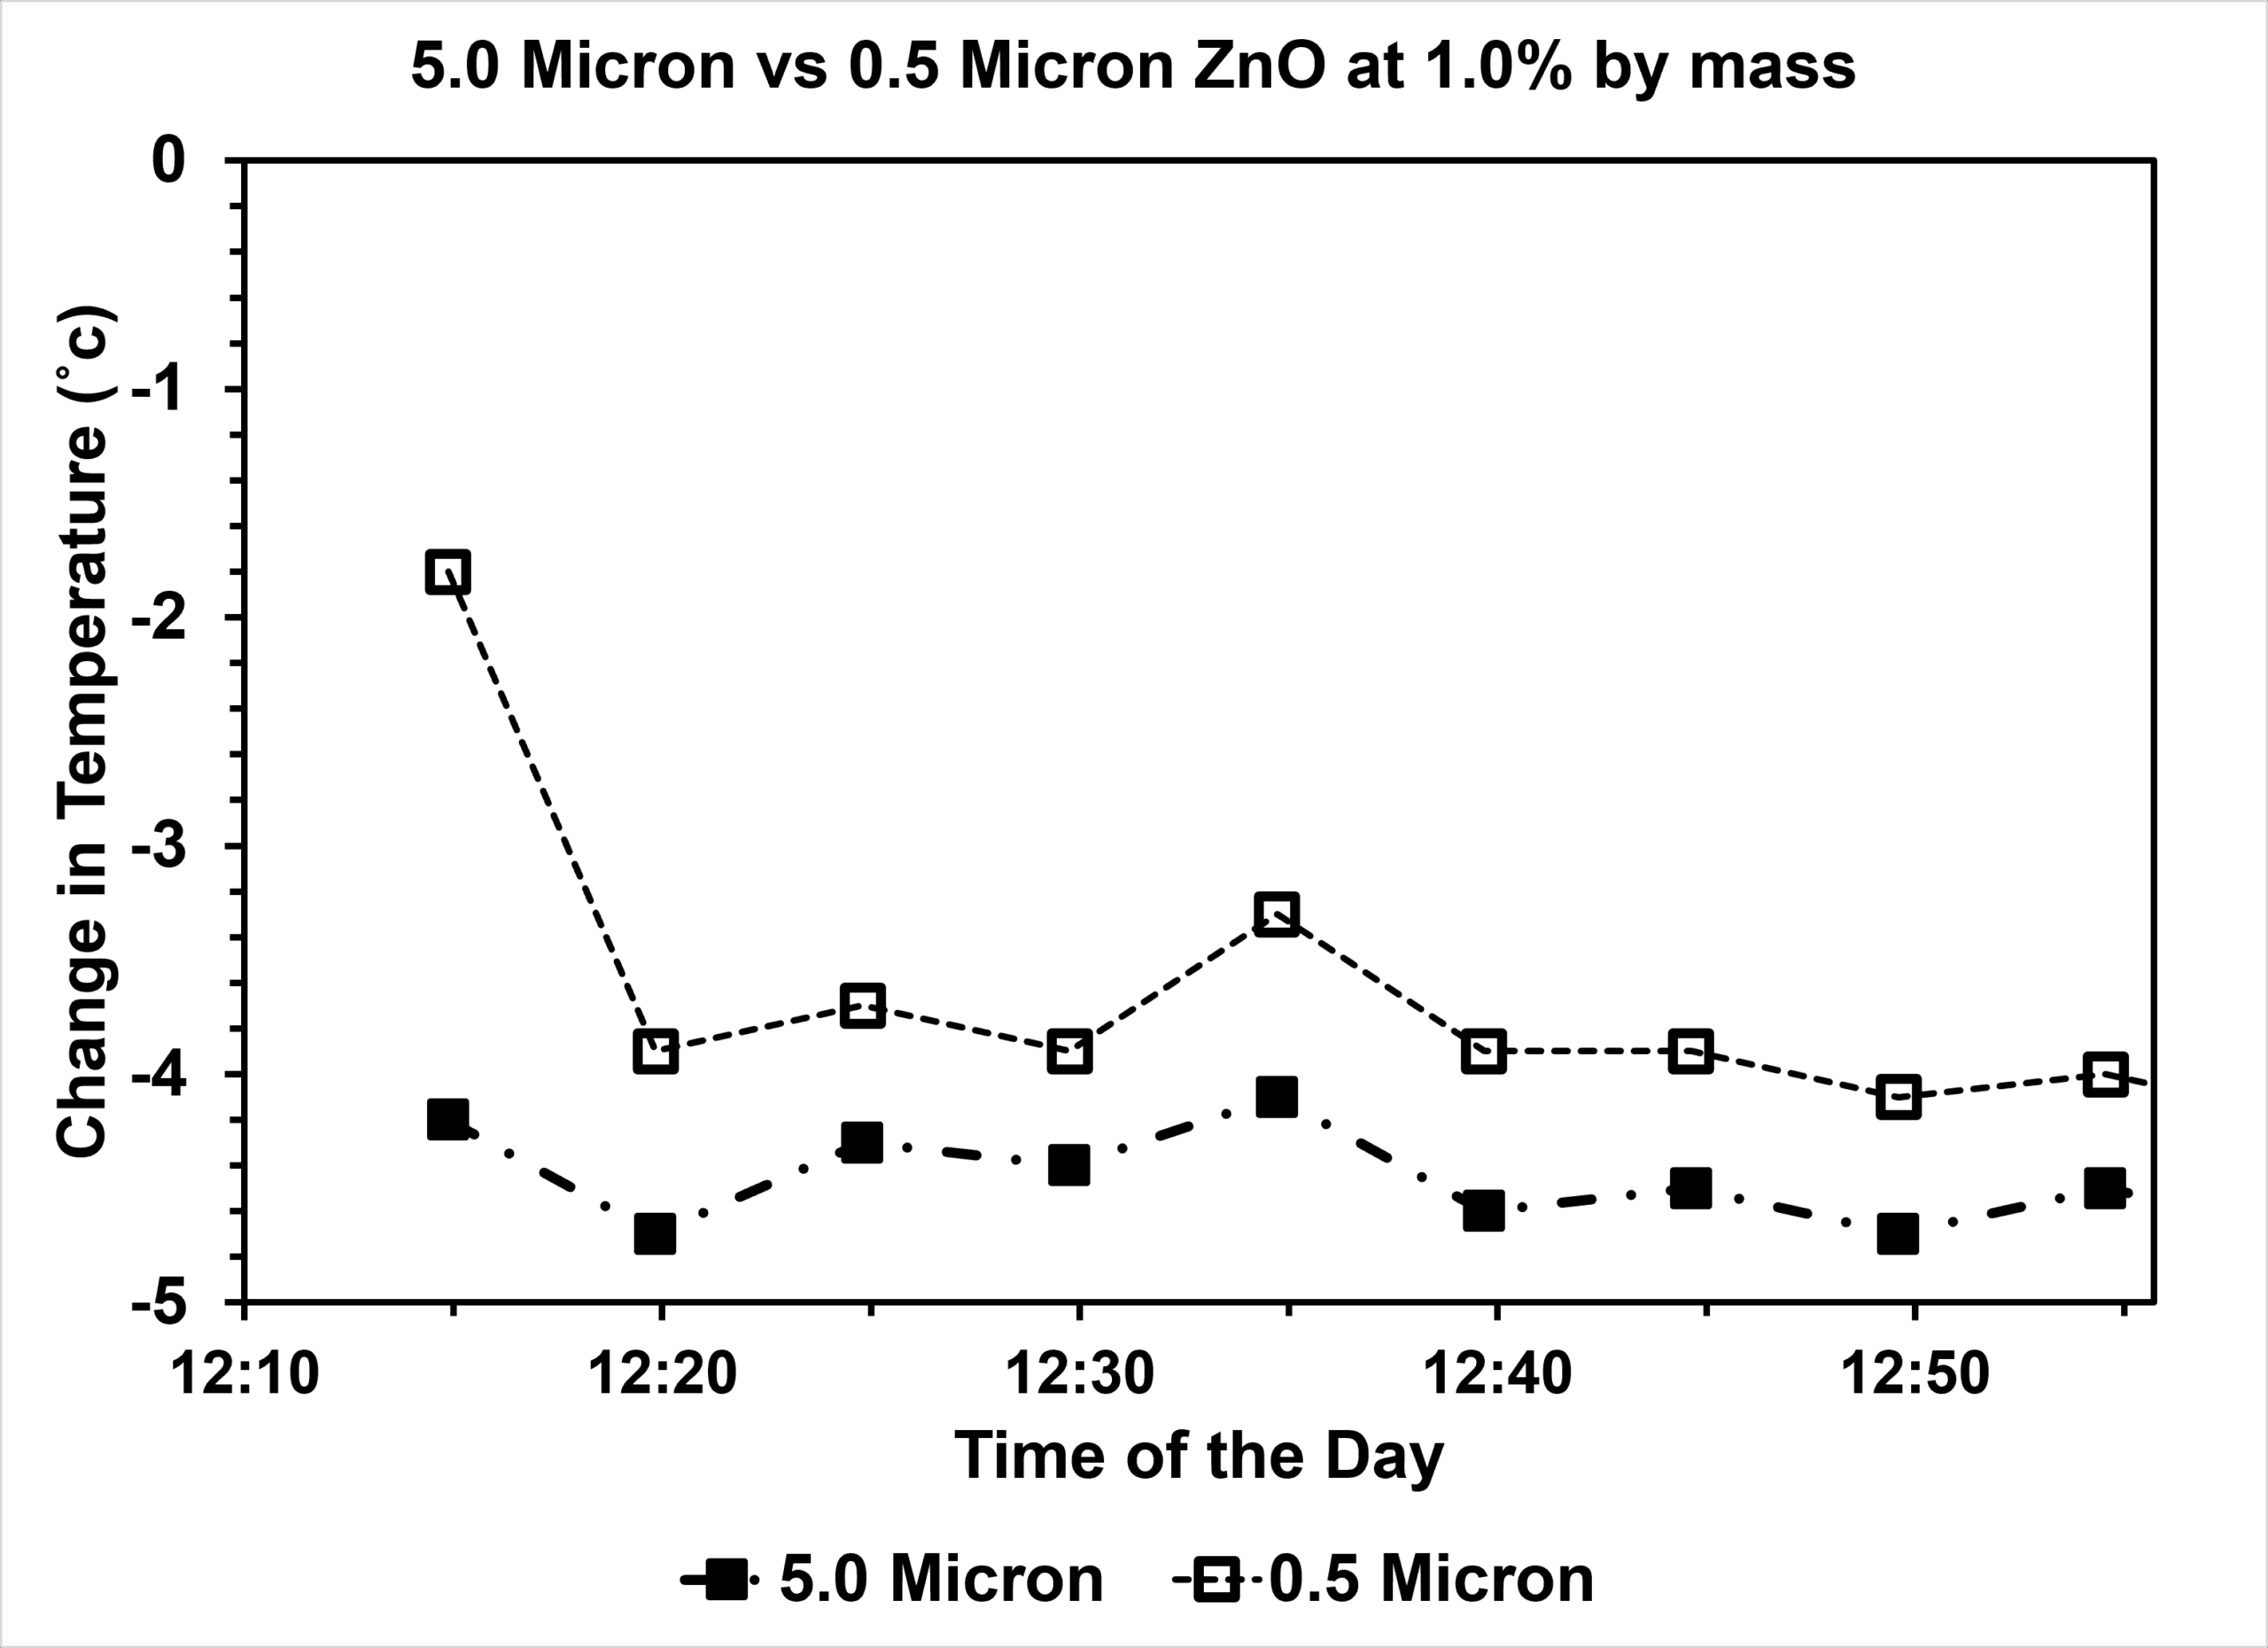
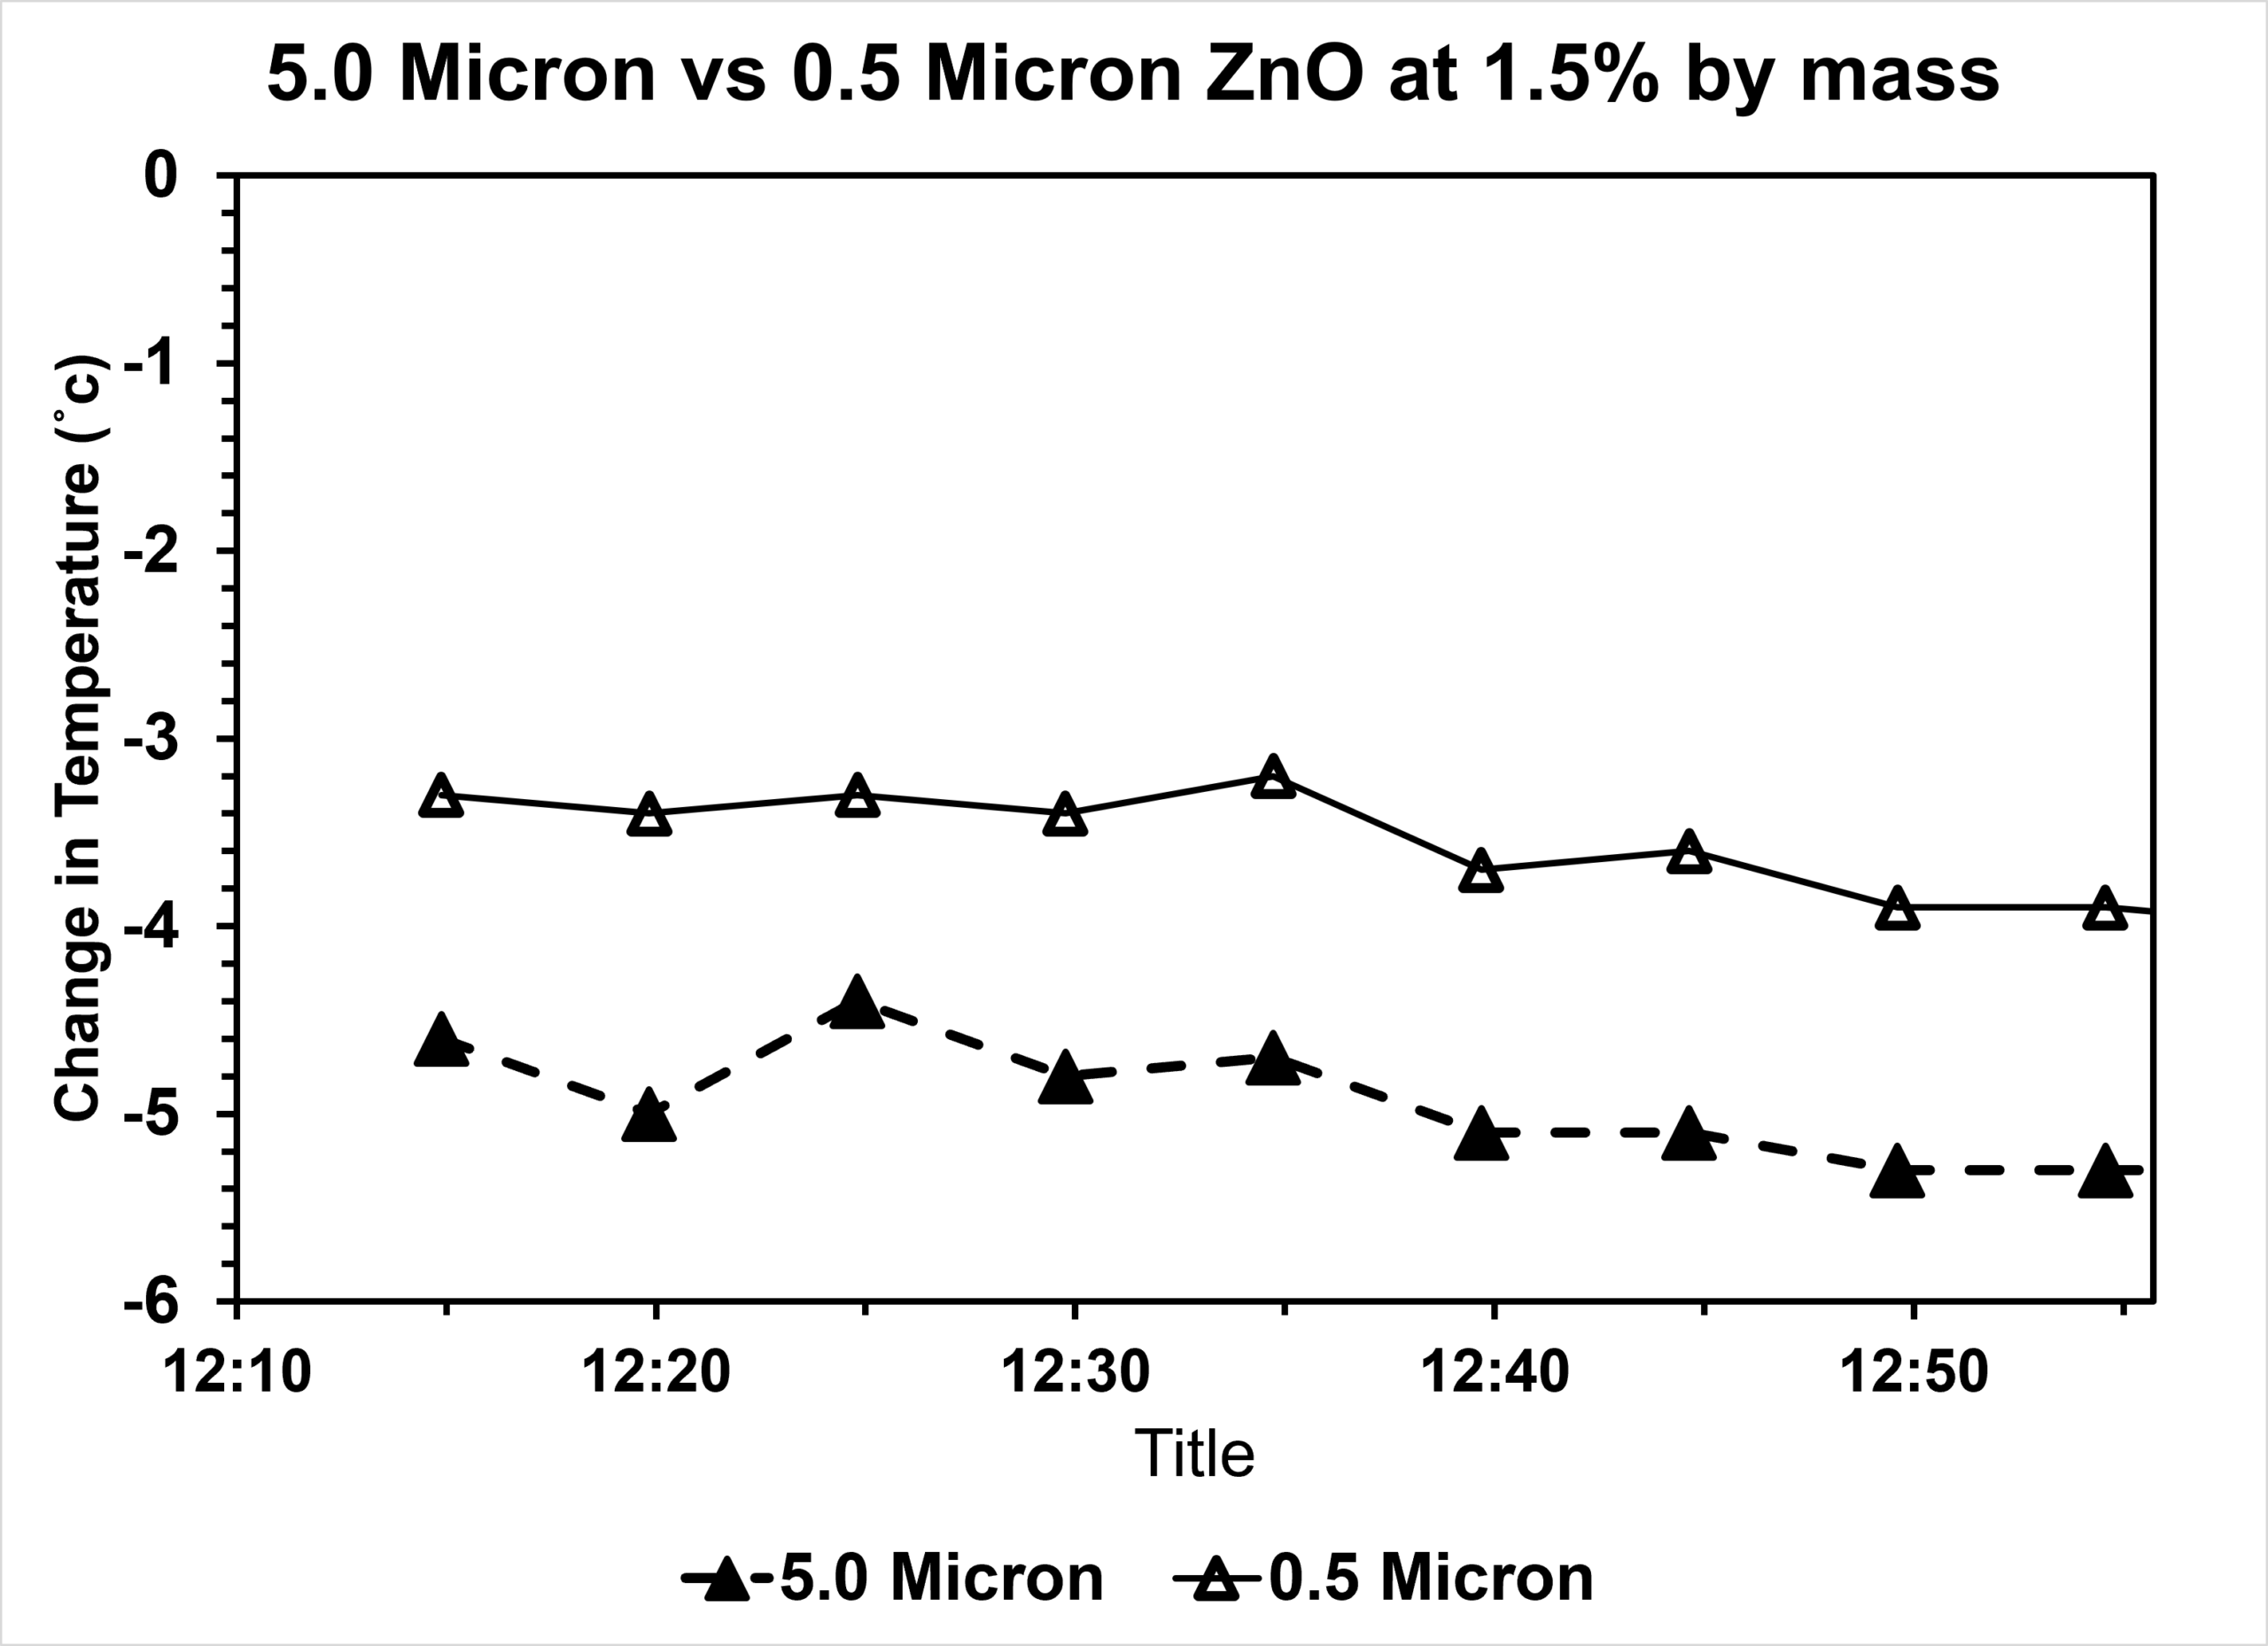
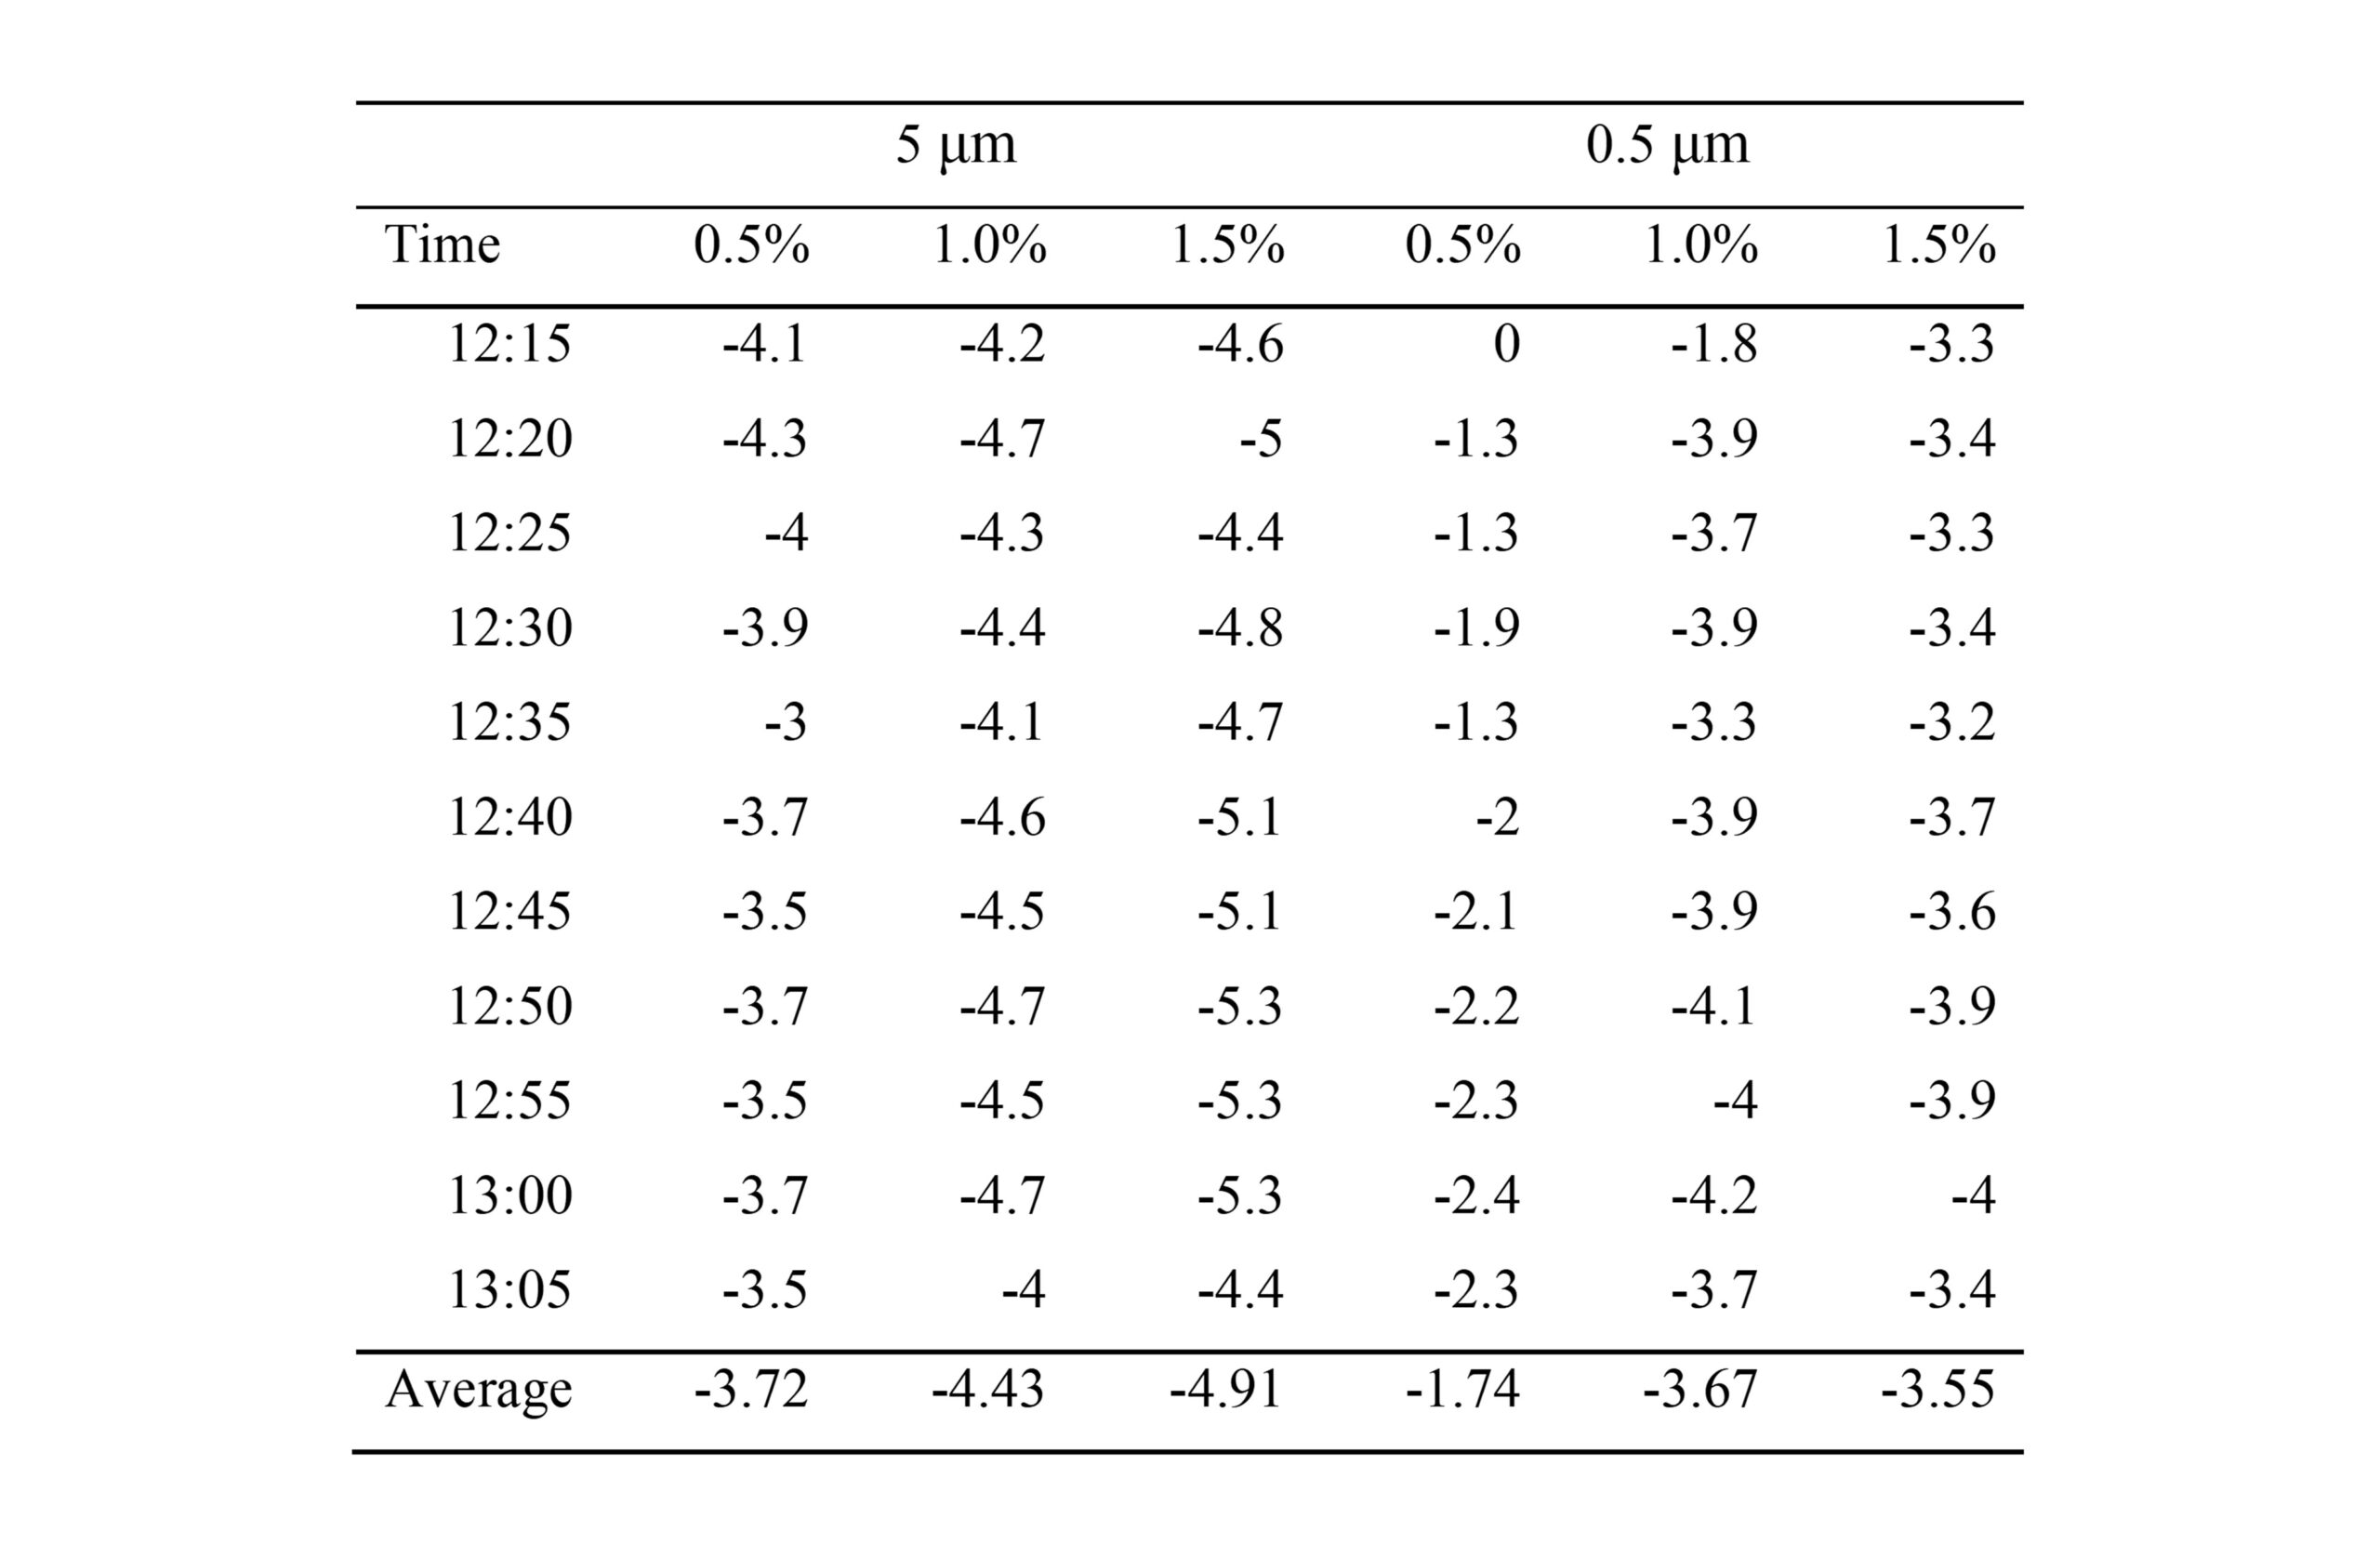
The results of the experiment show that for the 5 μm ZnO coatings (Fig. 3), as the concentration of ZnO increases, the solar heat reduction also increases, consistent with the initial hypothesis. However, the 0.5 μm ZnO coatings (Fig. 4) deviated from the overall trend. Instead of the 1.5% ZnO coating being the most effective of the three, the 1.0% actually performs better for all readings except for the first reading at 12:15. For all of the coatings at the same concentration, the 5 μm ZnO performed better than the 0.5 μm ZnO. The 1% and 1.5% ZnO coatings had an average difference of ~1°С (Fig. 6 and Fig. 7), while the 0.5% coatings had the largest average difference of ~2°С (Fig. 5).
Phase 2 Experimental Results
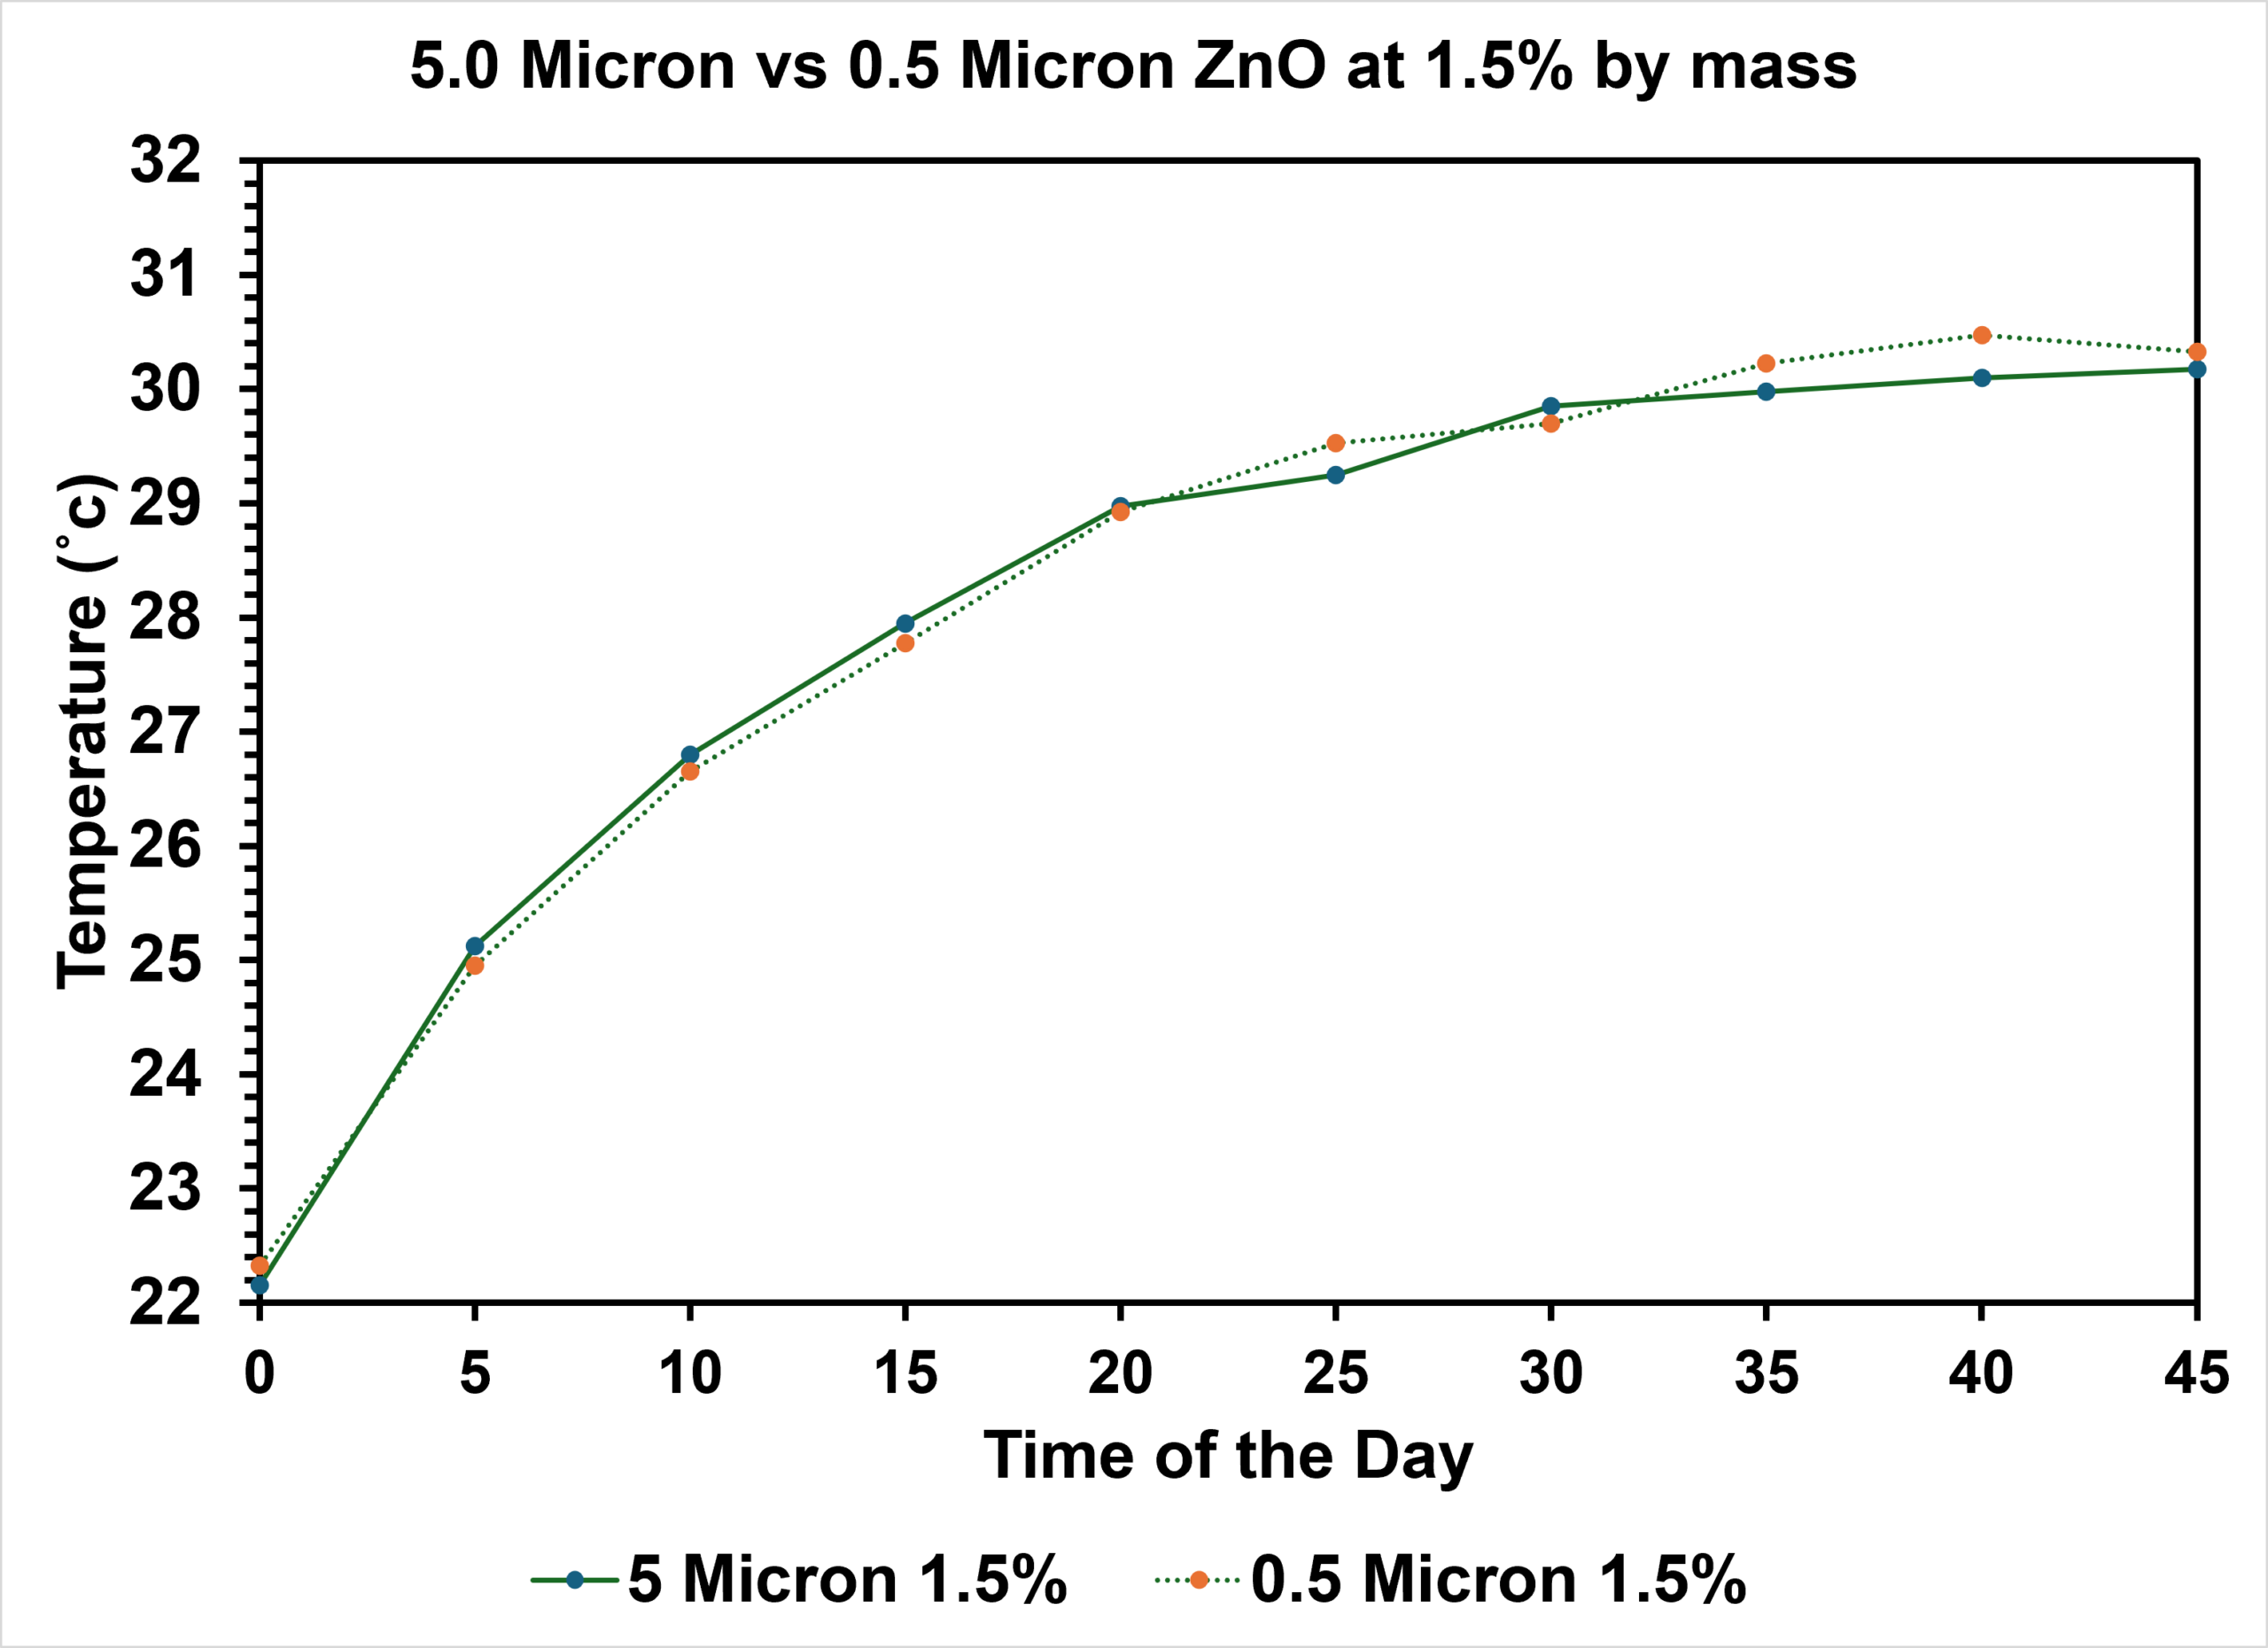
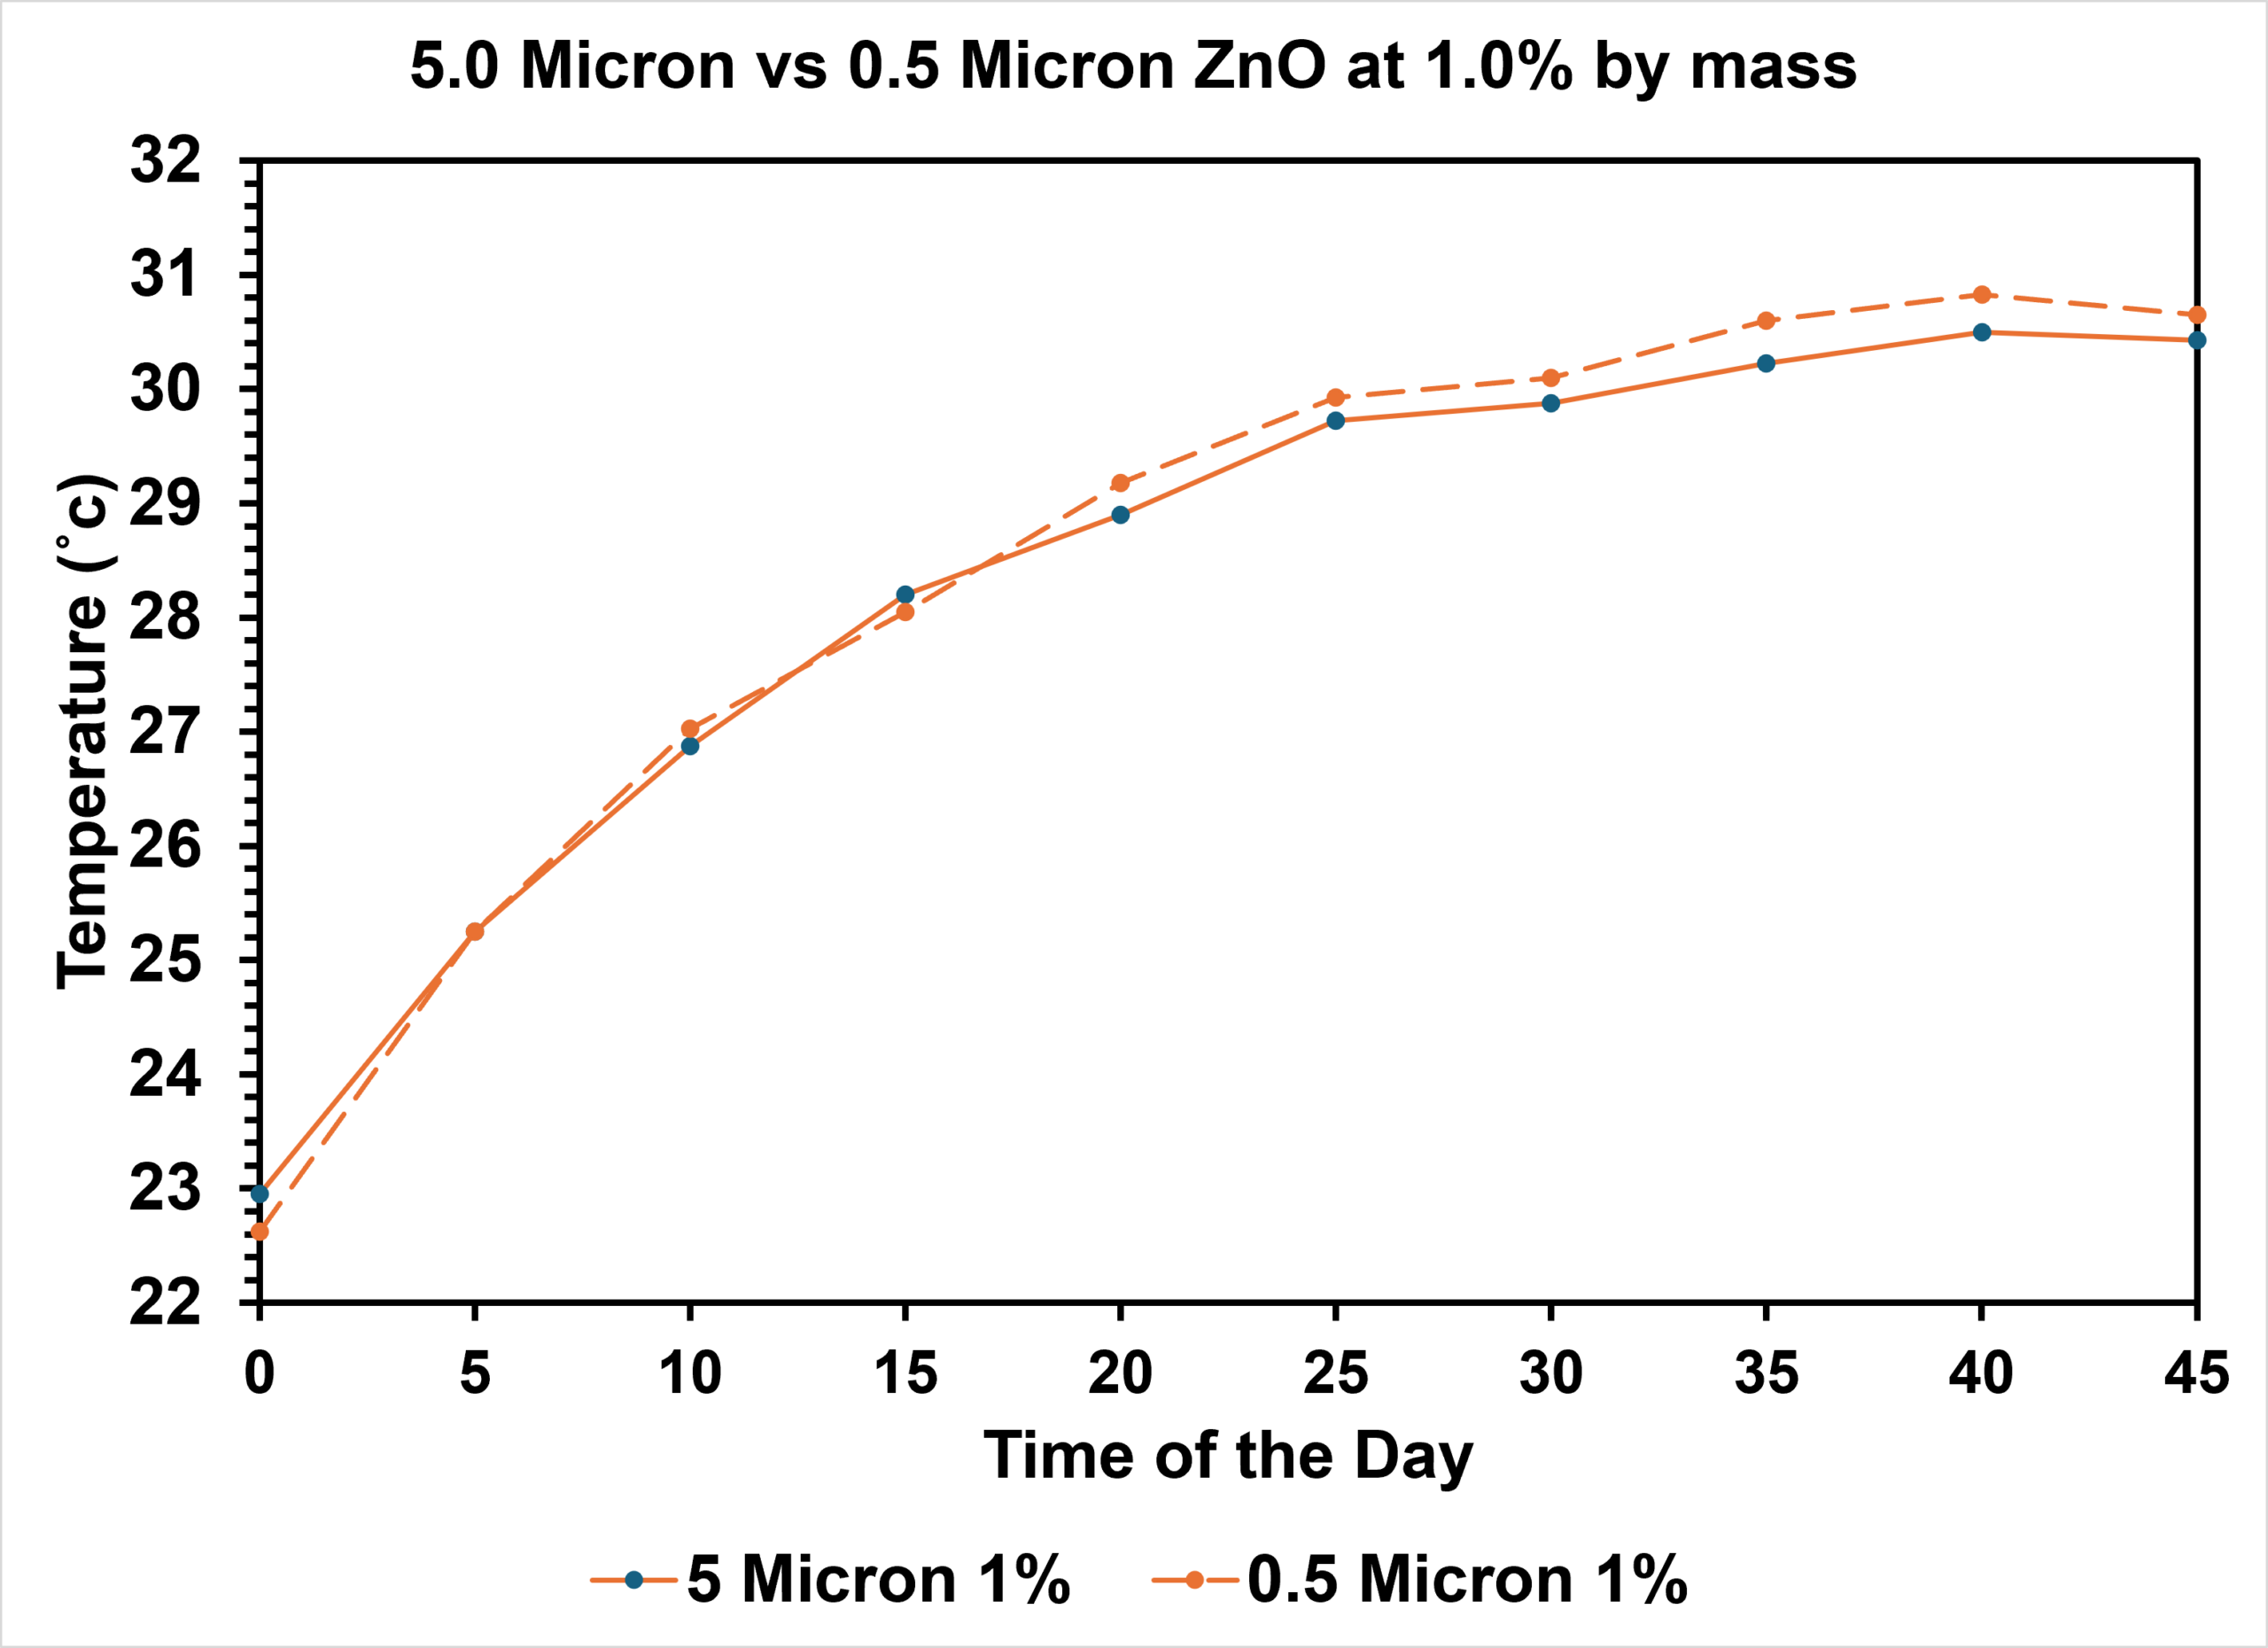
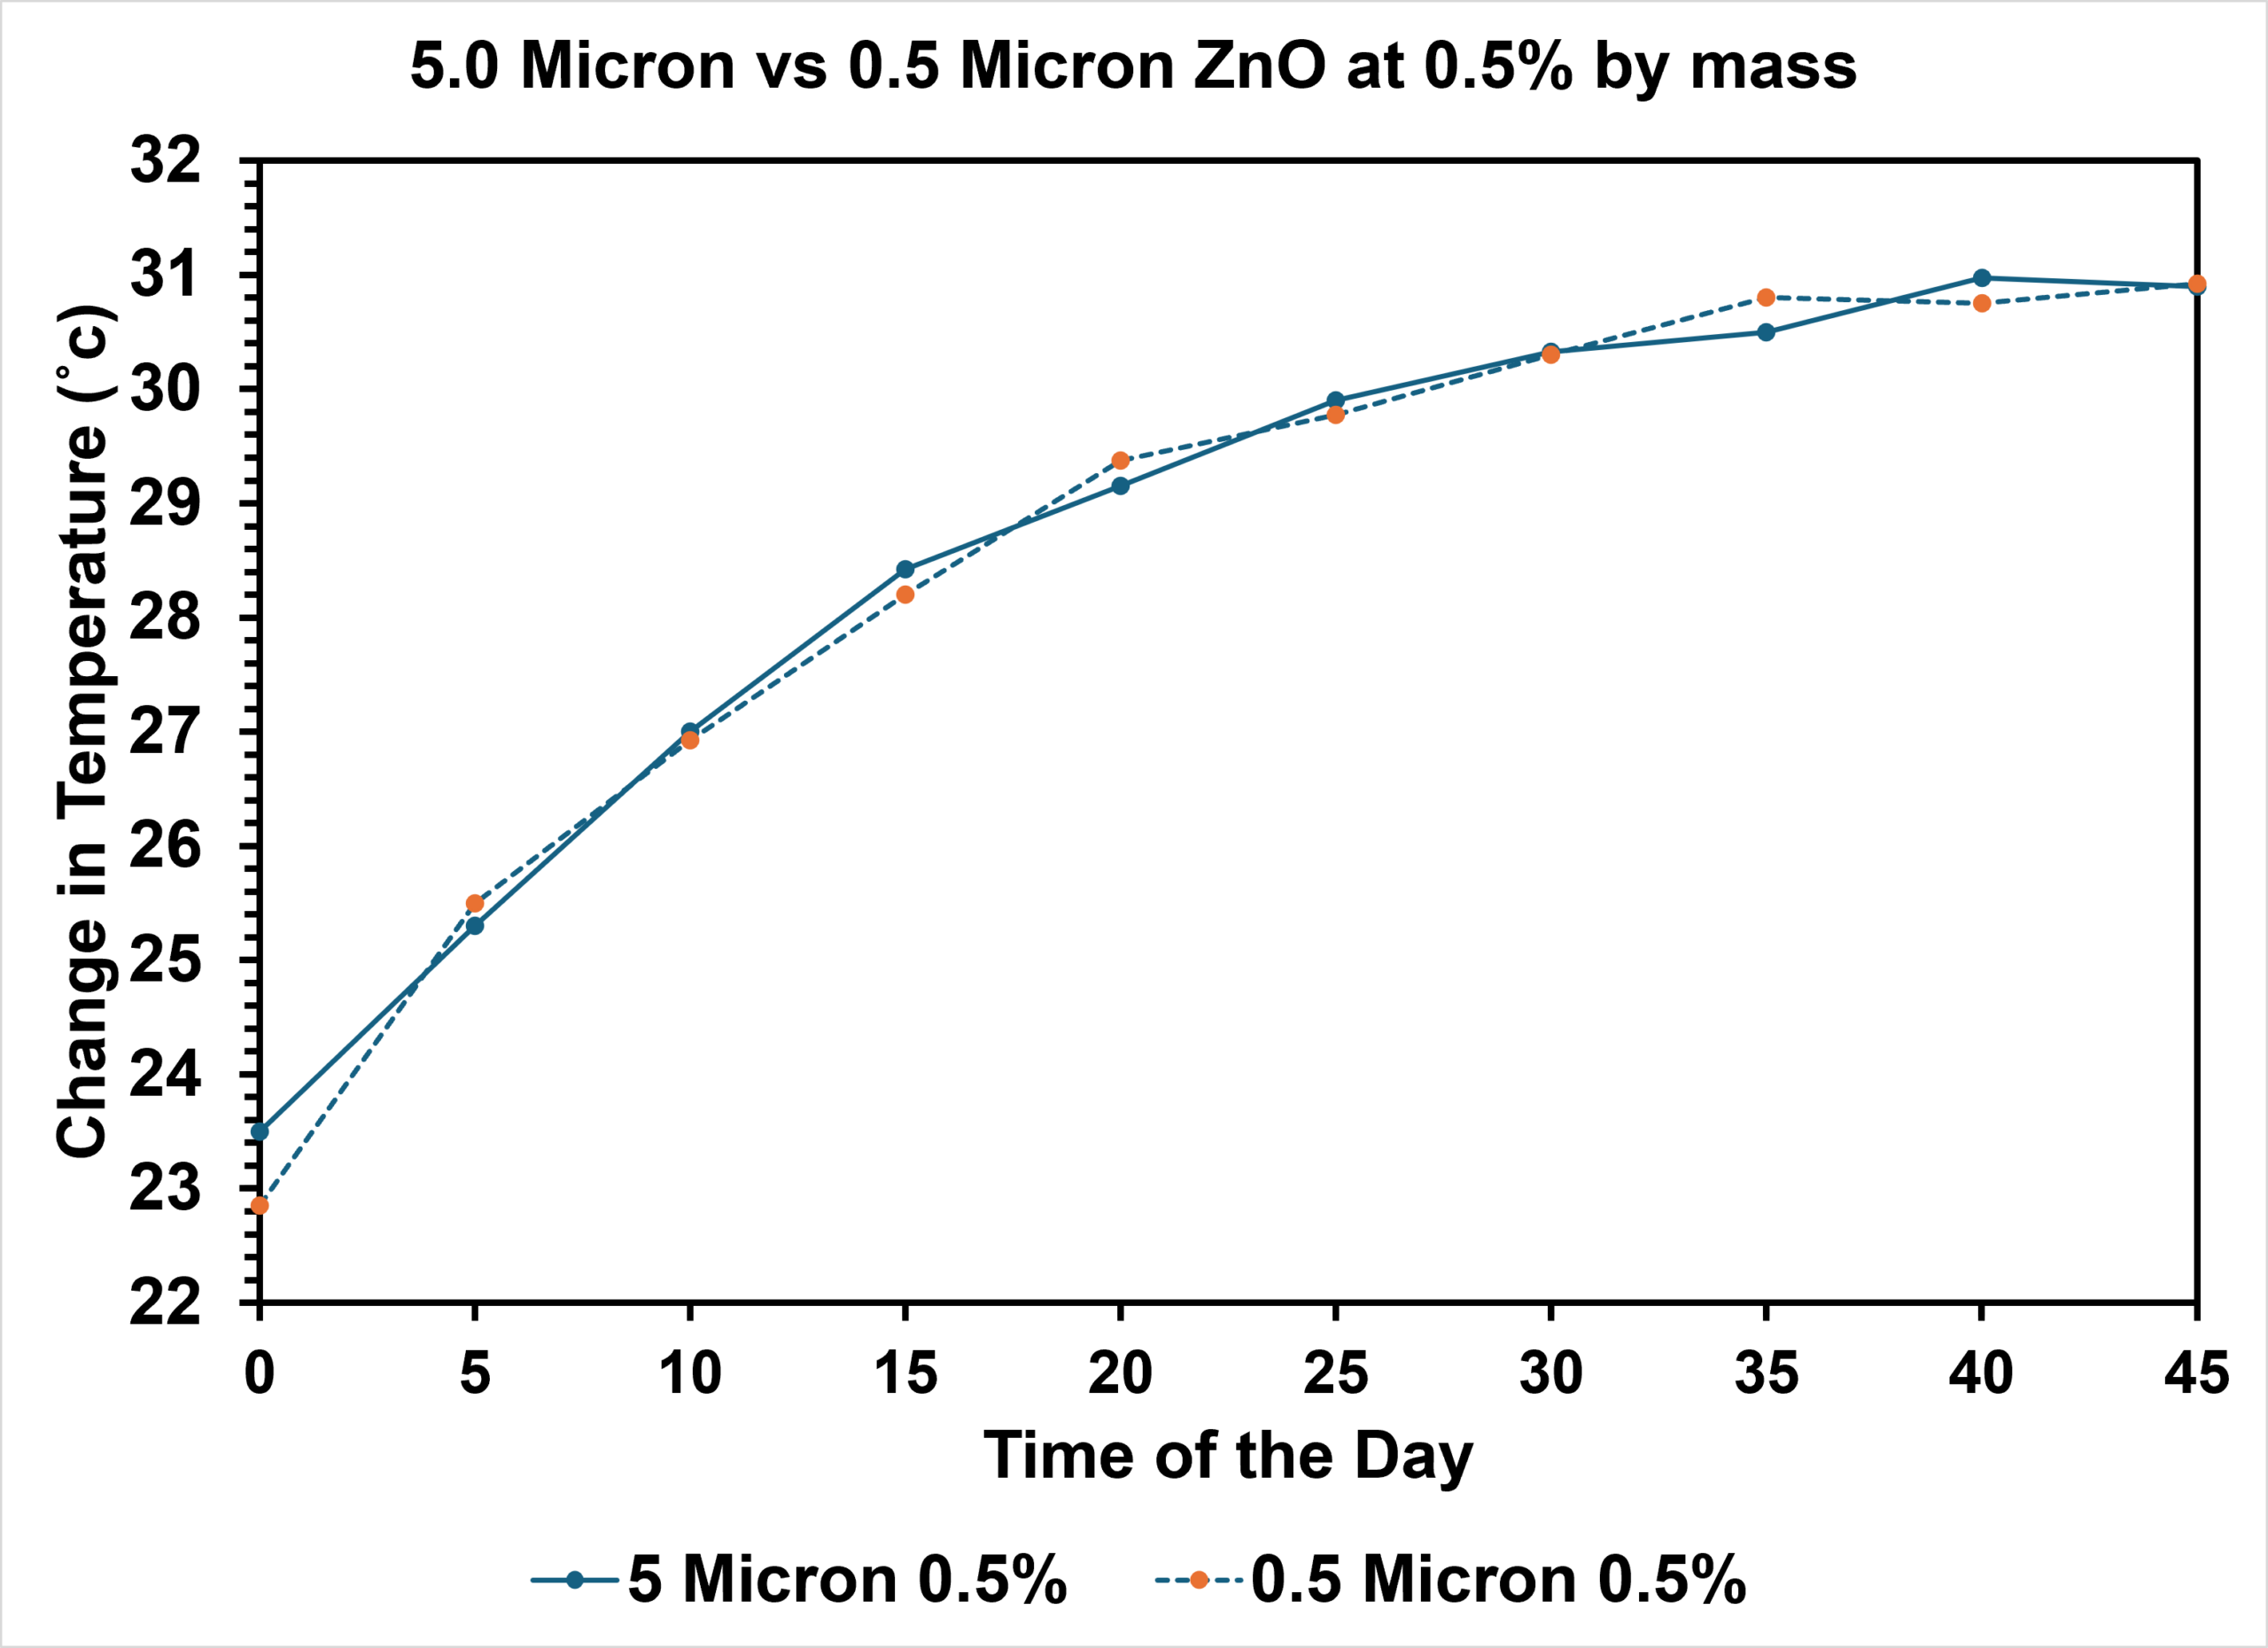
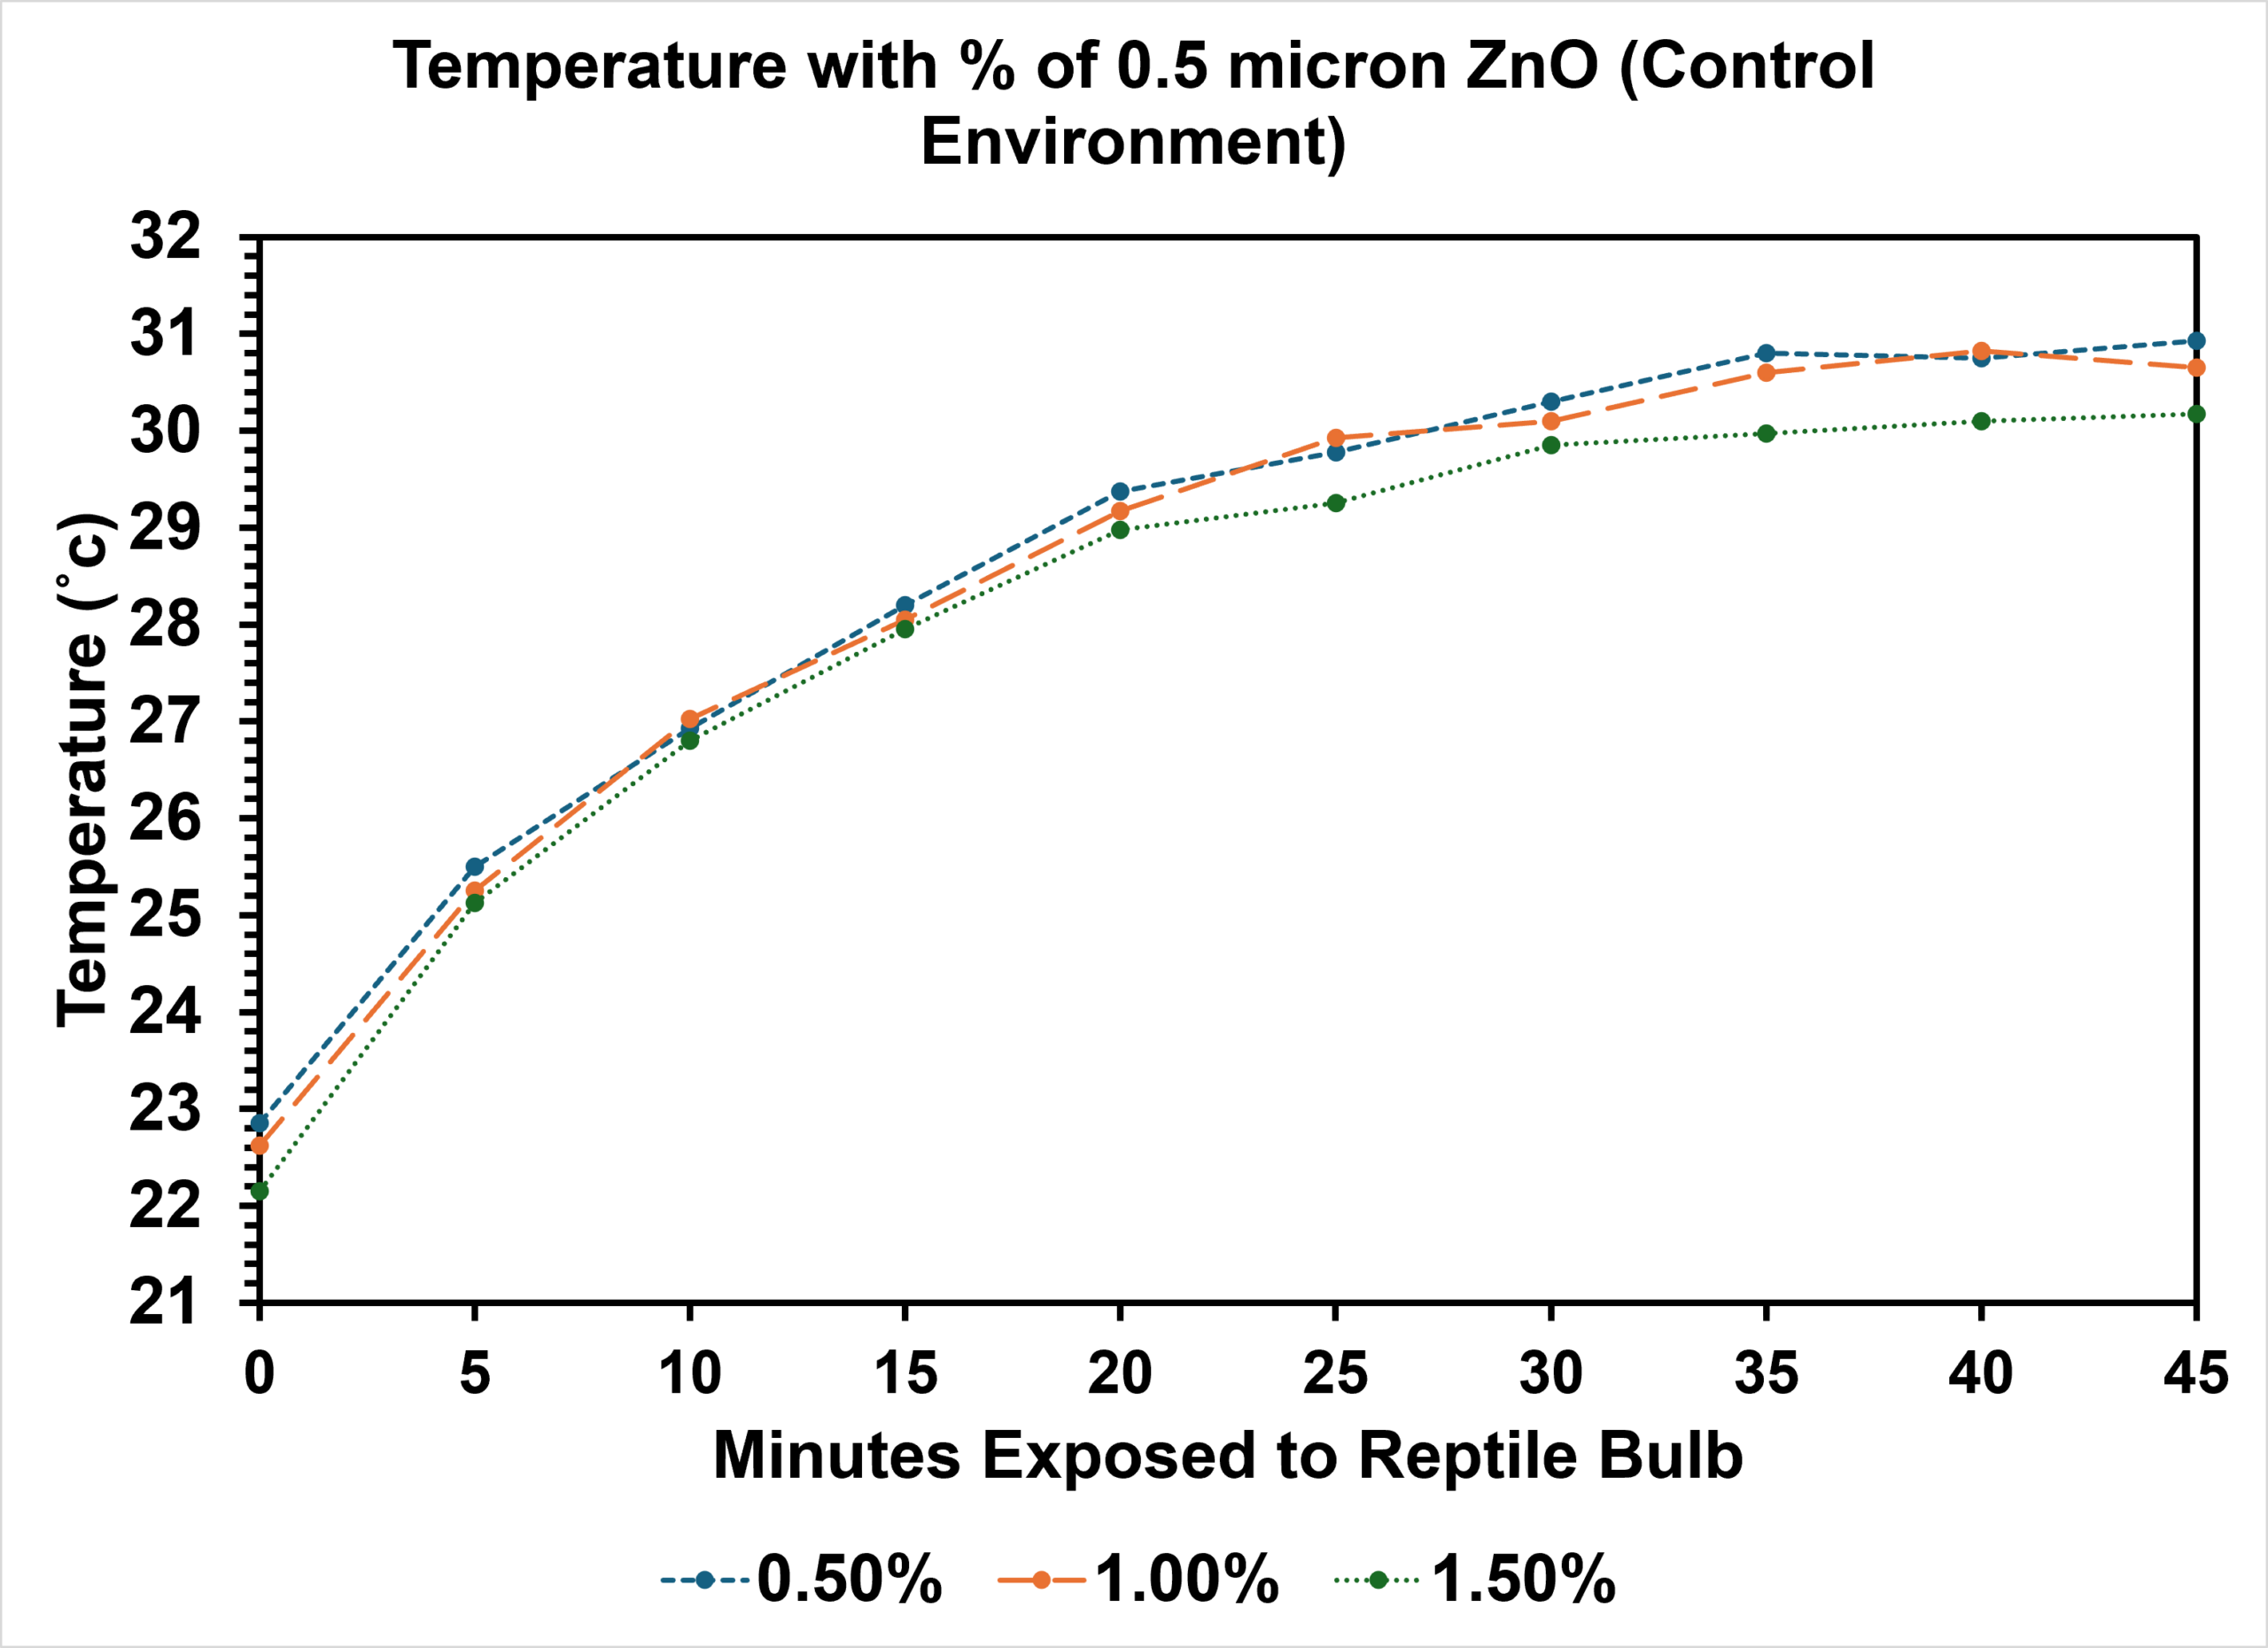
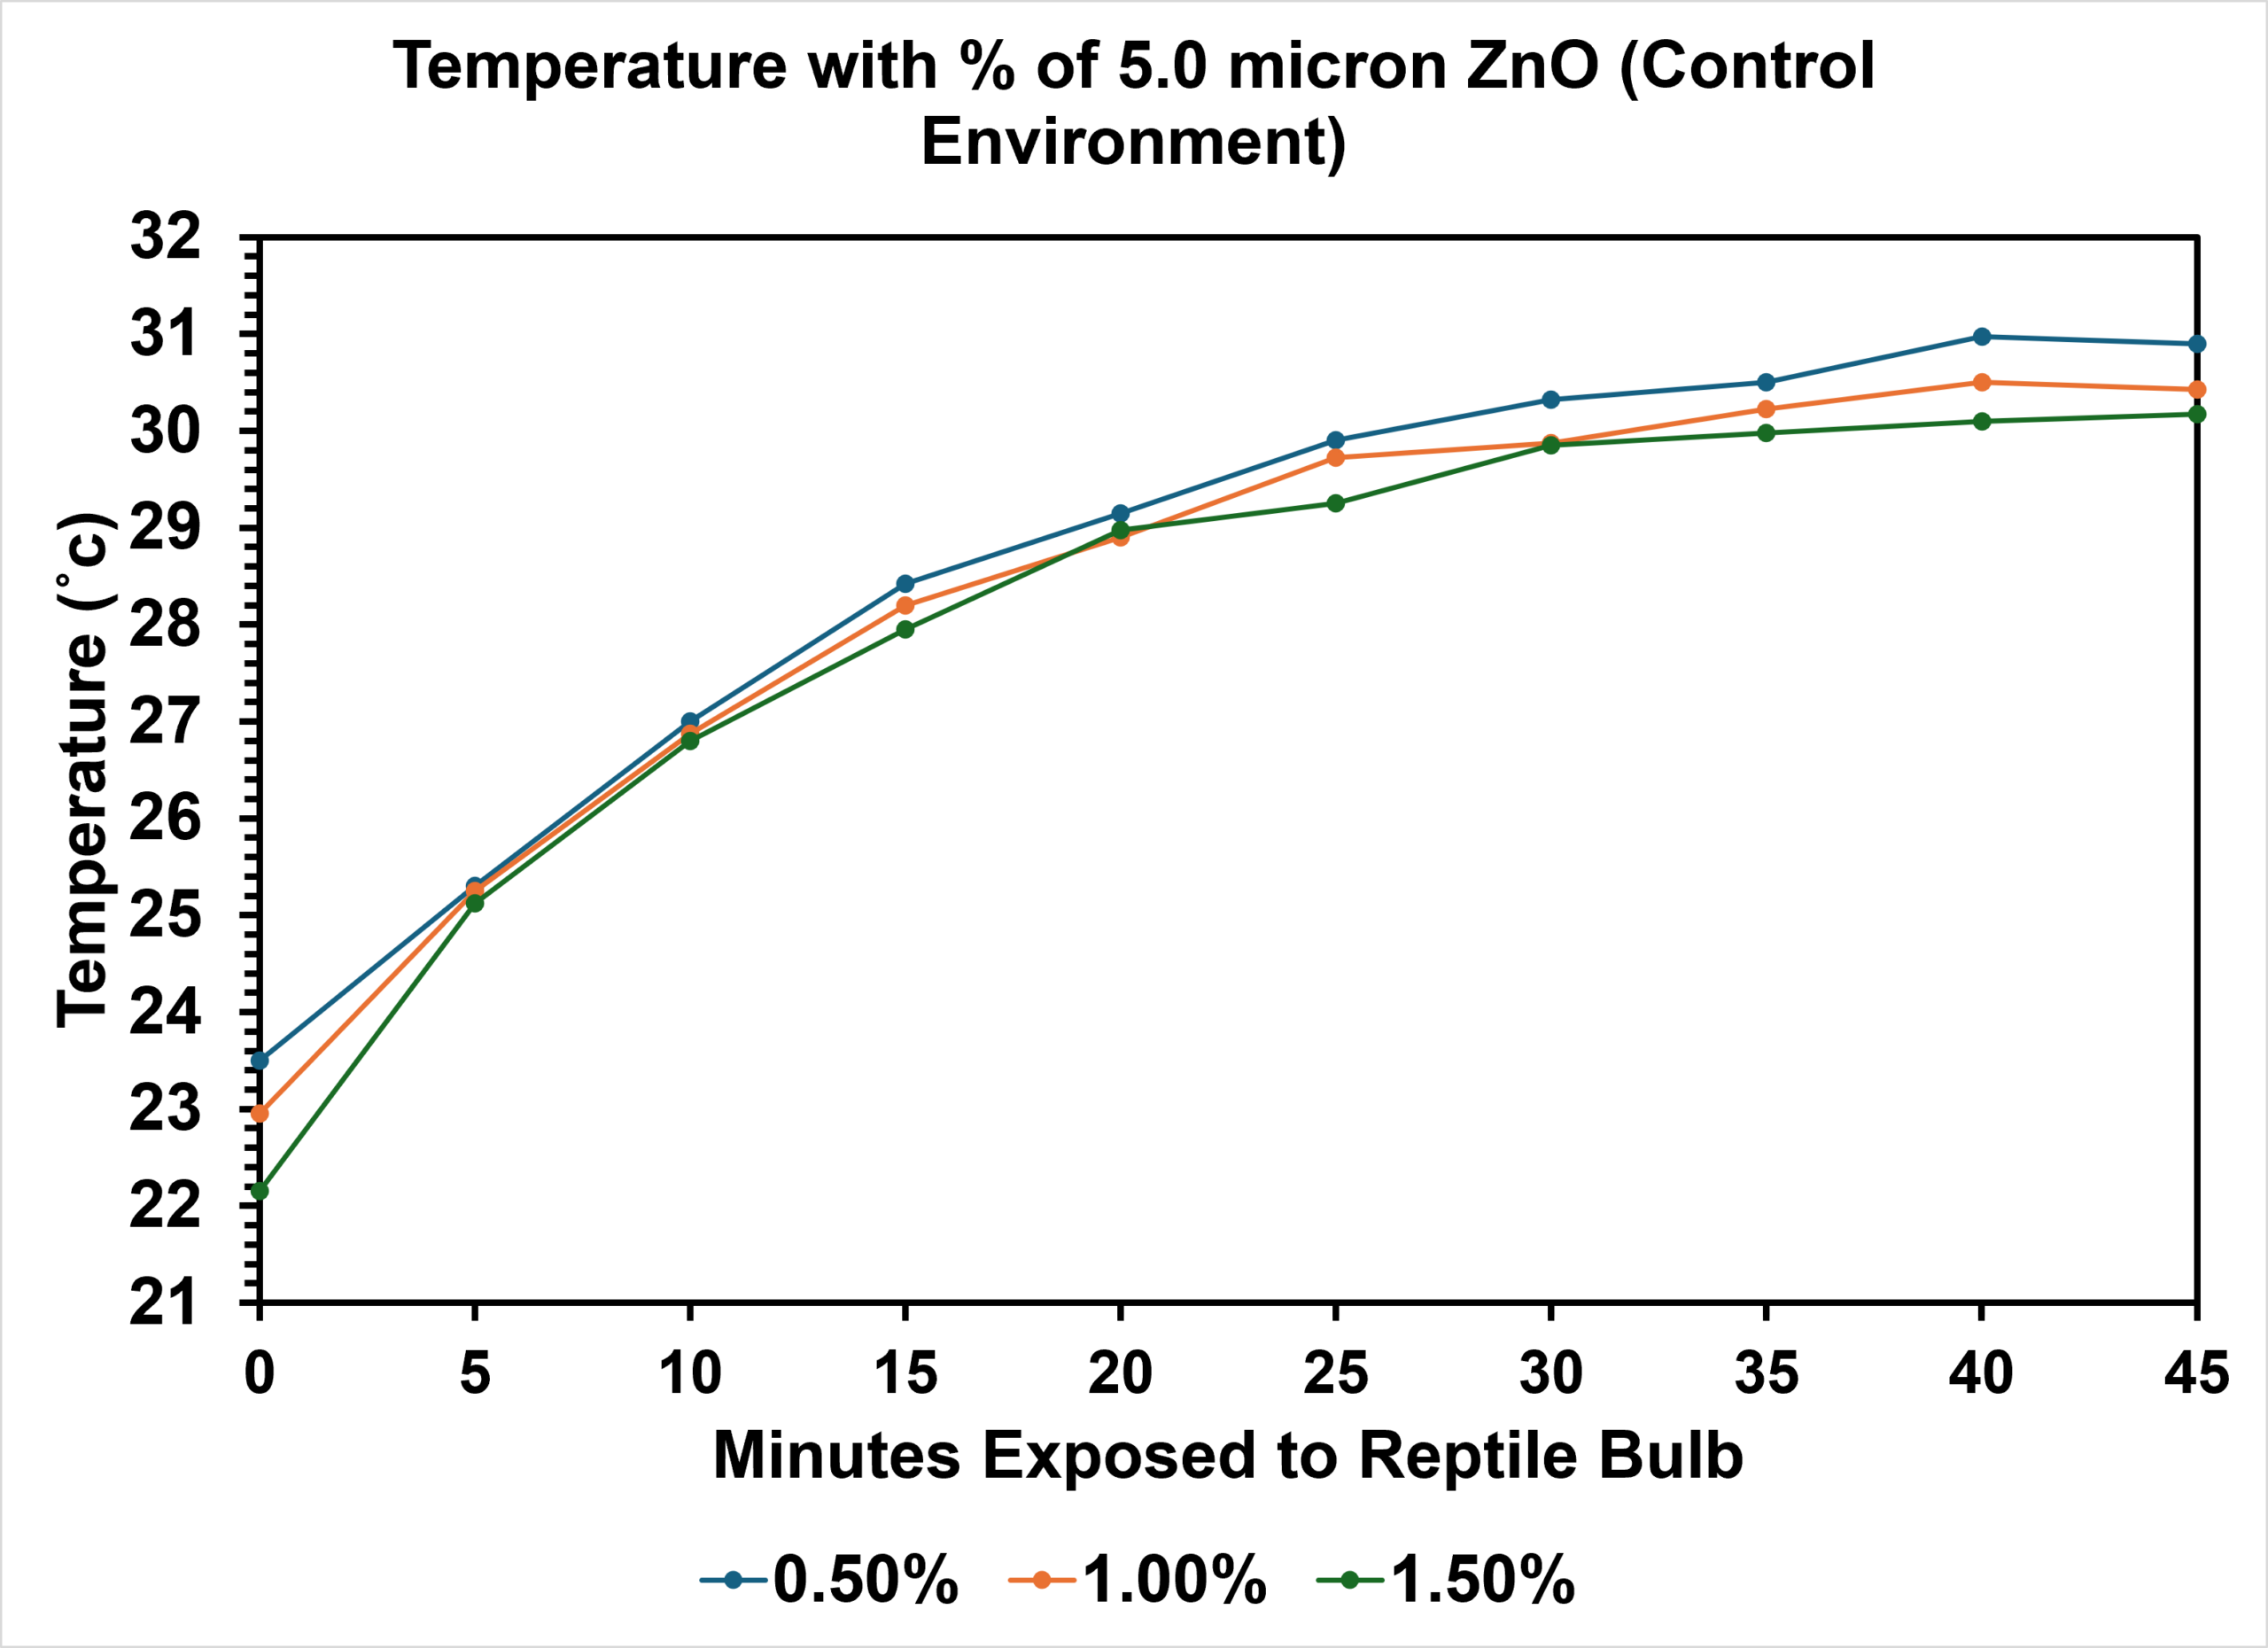
The results of the second lab-controlled experiment follow the same trend as the first experiment. The 5 µm coatings consistently performed better than the 0.5 µm coatings in solar heat reduction. However, the 1.5% 0.5 µm coating performed better than the 1.0% 0.5 µm coating contrary to the result in the first experiment (Fig. 11). Throughout the experiment, the 0.5% 0.5 µm coating actually performs better than the 1.0% 0.5 µm coating in some of the readings (10, 25 and 40 minute readings). This highlights the inconsistent performance of 0.5 µm coatings, suggesting the 0.5 µm nanoparticles act in complex concentration-dependent ways.
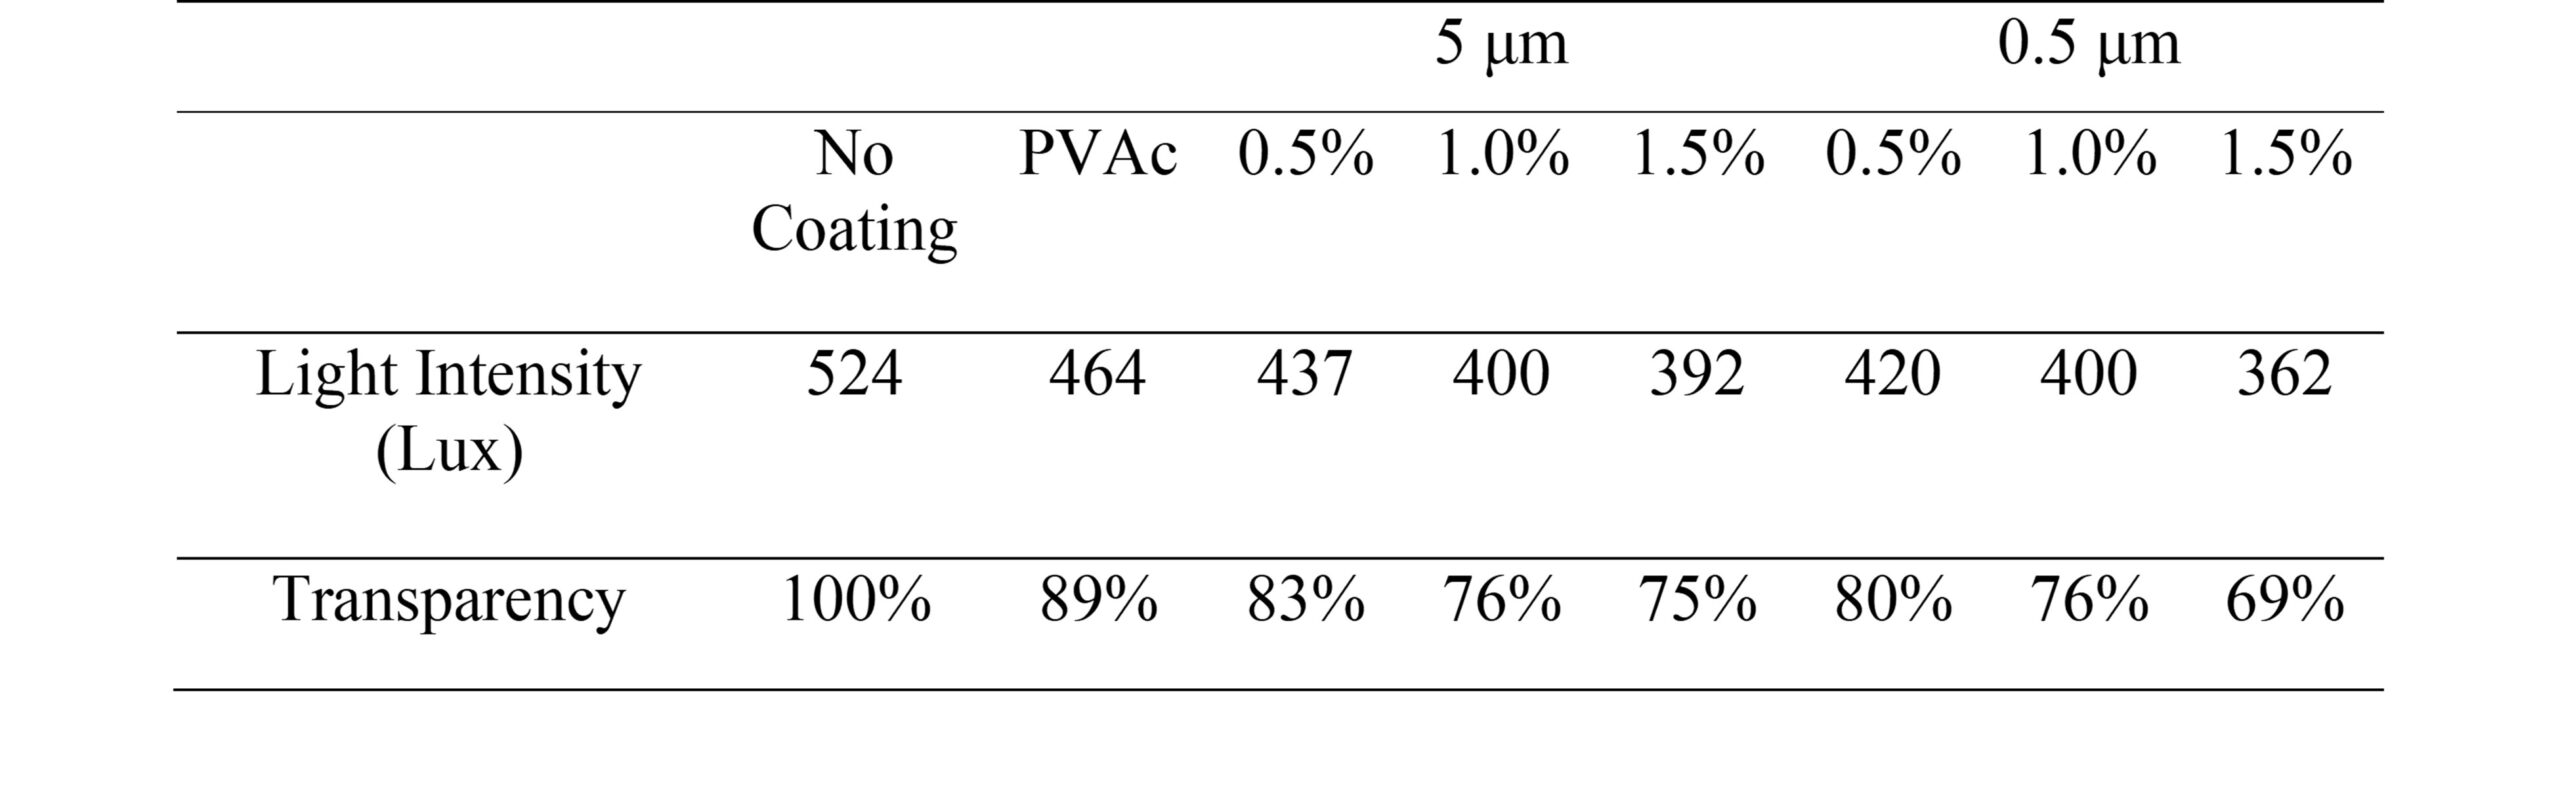
The reptile bulb was used as a light source and the smartphone app “Lux Light Meter Pro” was used to measure light intensity through the different panel coatings. Using the light intensity measured with no panels as a control, the light intensity transmitted through the coatings can calculate transparency using the equation:

In the equation, Lt is transmitted light (Lux) and Li is incident light (Lux). All of the coated samples showed reduced transparency when compared to the control. At the same ZnO concentrations, the 5 µm coatings transmitted more light than that of 0.5 µm coatings. The coating with the highest opacity was the 1.5% 0.5 µm ZnO coating, with a transparency of 69%. When a PVAc only coating measured, the transparency decreased by 11% compared to the control. A practical transparency threshold is ≥ 75%, showing that all of the coatings except the 1.5% 0.5 µm coating remain usable as a window glazing. It was noted the light intensity of the reptile bulb (524 Lux) was much lower than the estimated peak intensity of 41391 Lux that direct sunlight from the zenith position can produce23. Even so, the readings from the reptile bulb give a strong estimate for the transparency of the coatings under direct sunlight as the wavelengths transmitted by the bulb and the sun are similar.
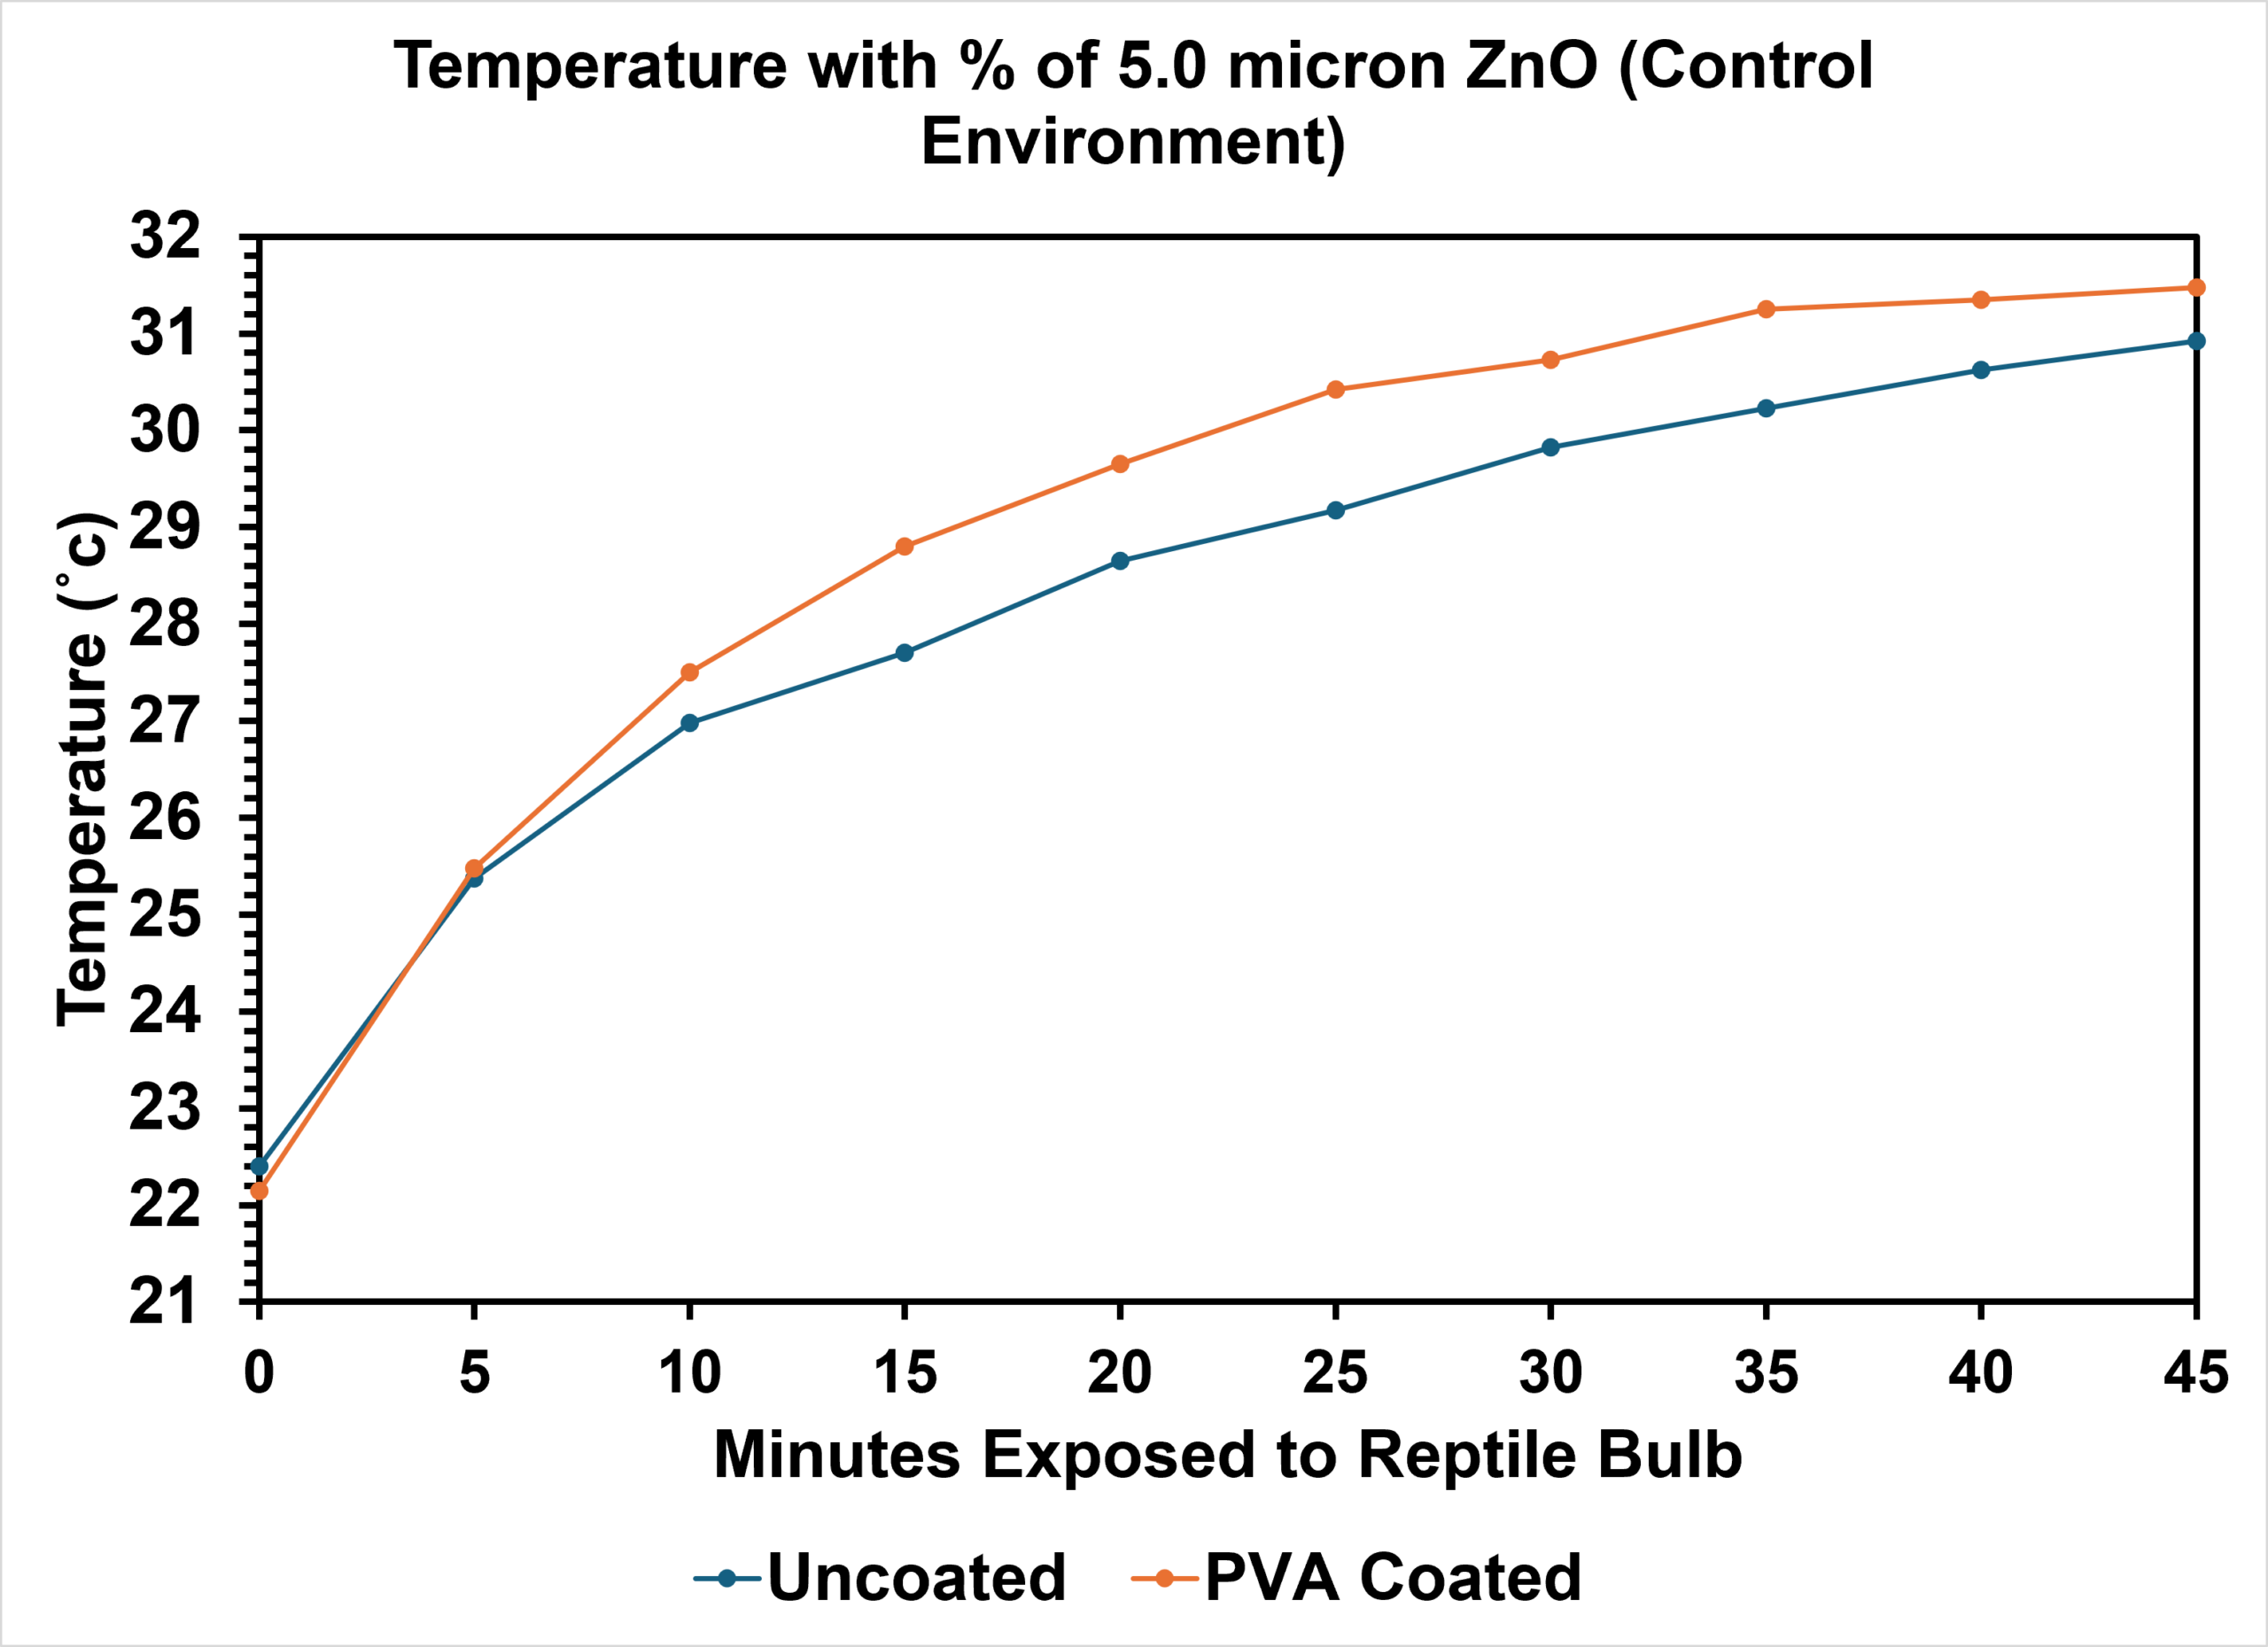
The average internal box temperature of the PVAc only coating sample was higher than the one of no coating showing that the solar heat reduction is directly attributable to the ZnO nanoparticles and not the PVAc.
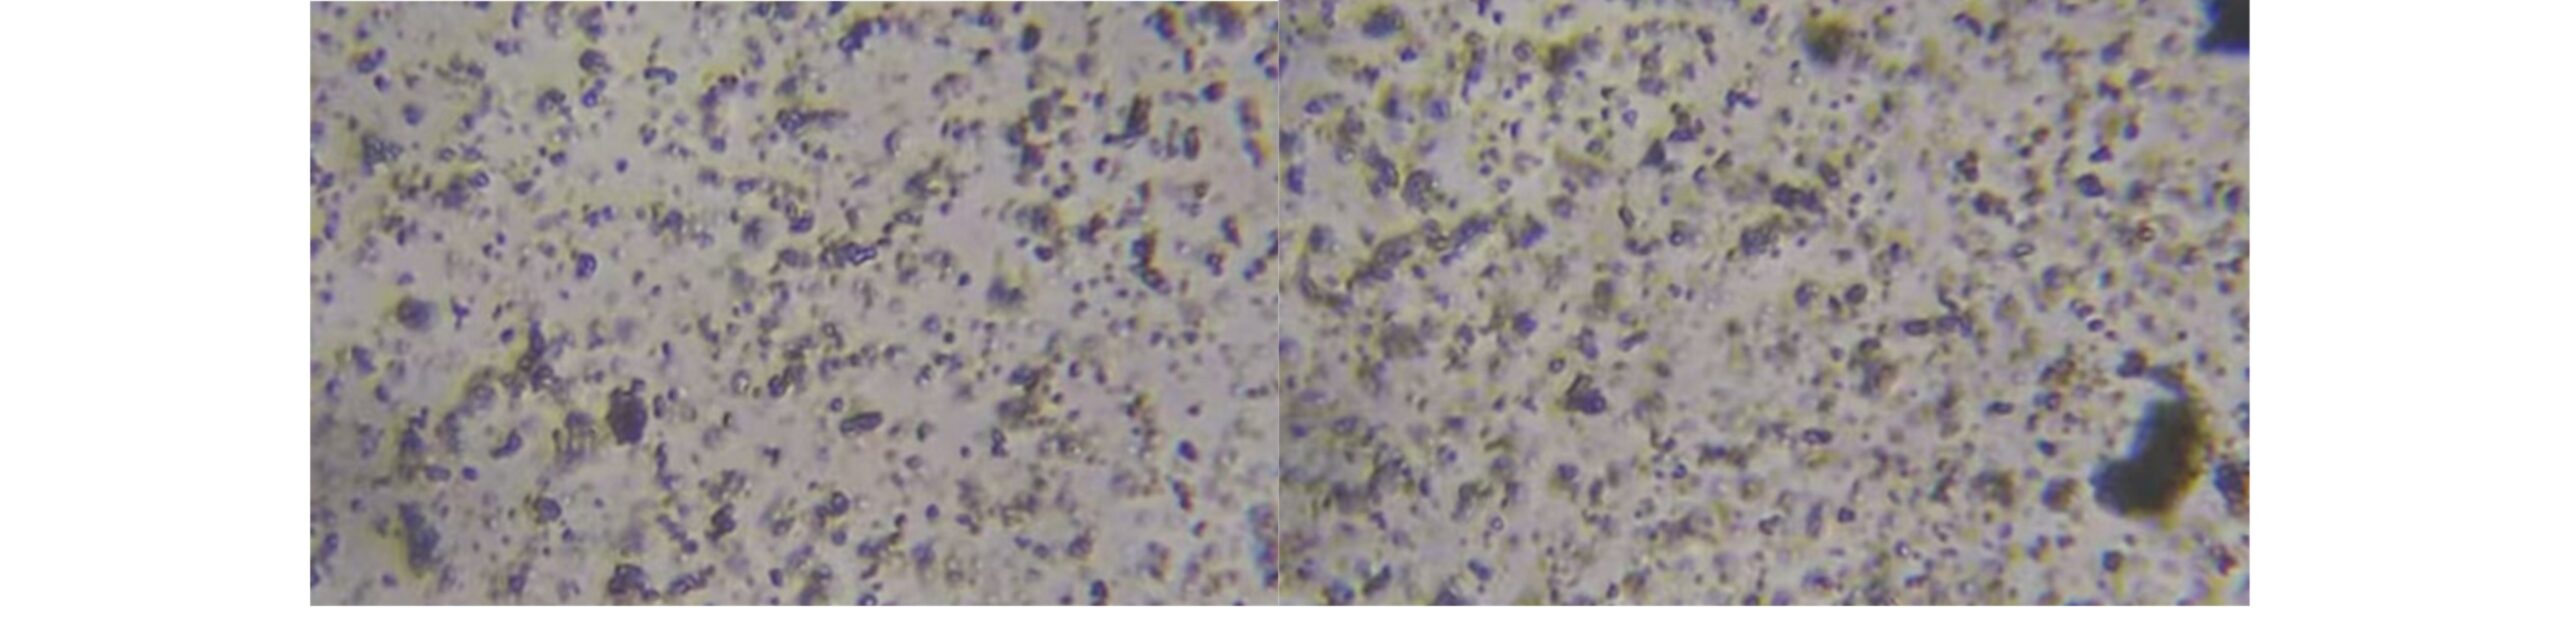
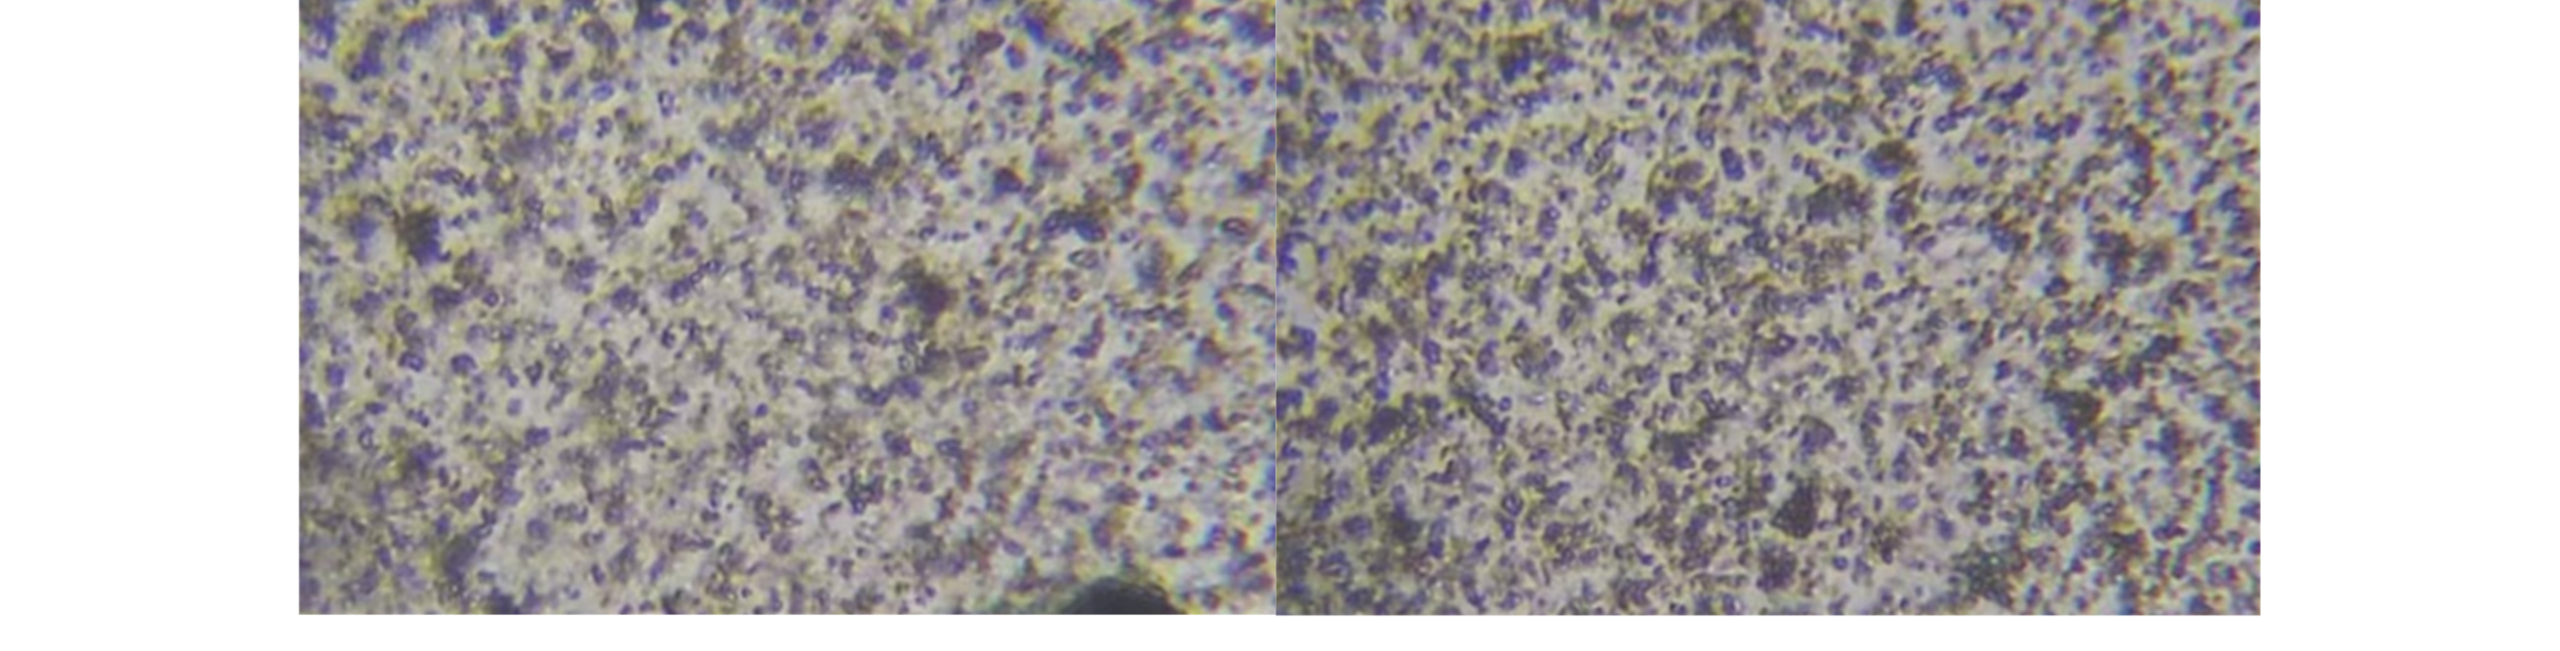
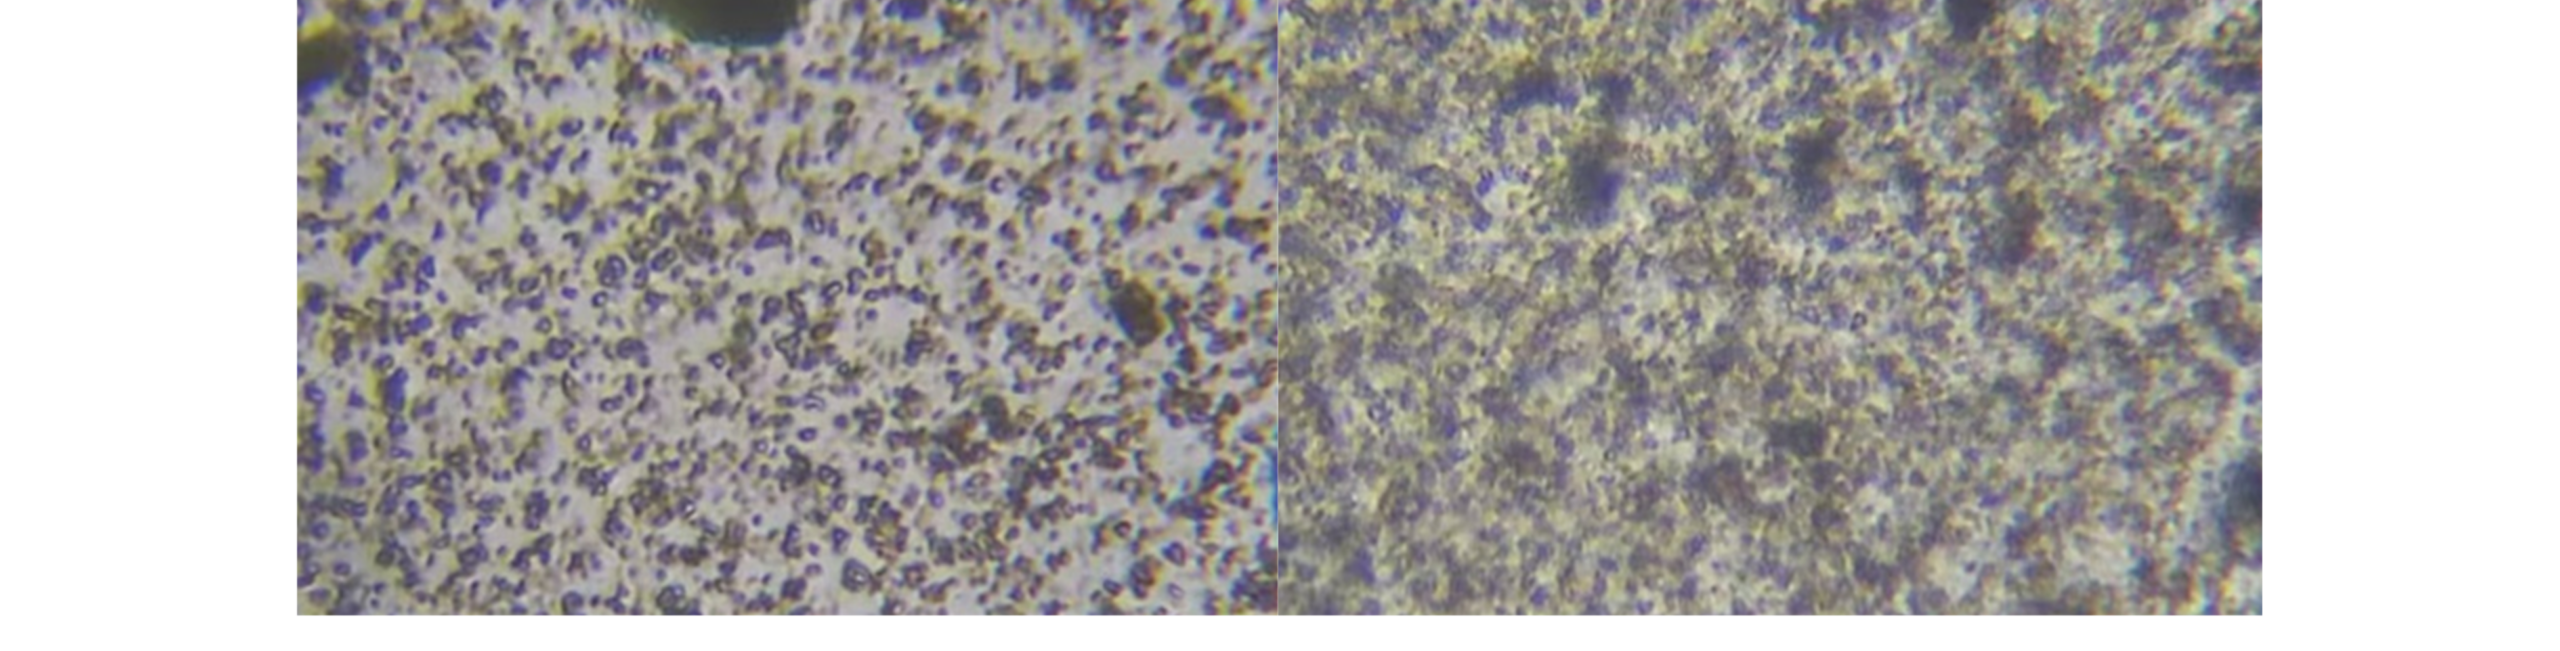
Microscopic imaging of the dried coating samples showed visible differences in particle distribution. A microscope with magnification of 400x was used. The 0.5 µm coating exhibited more pronounced clumping across all concentrations compared 5 µm coatings, with the most clumping at 1.5% concentration. For each of the 5 µm coatings at the same concentrations, the ZnO nanoparticles were spread more uniformly across the surface. The microscope imaging had auto-brightness correction and fails to provide comparisons in translucency or quantitative particle density.
Discussion
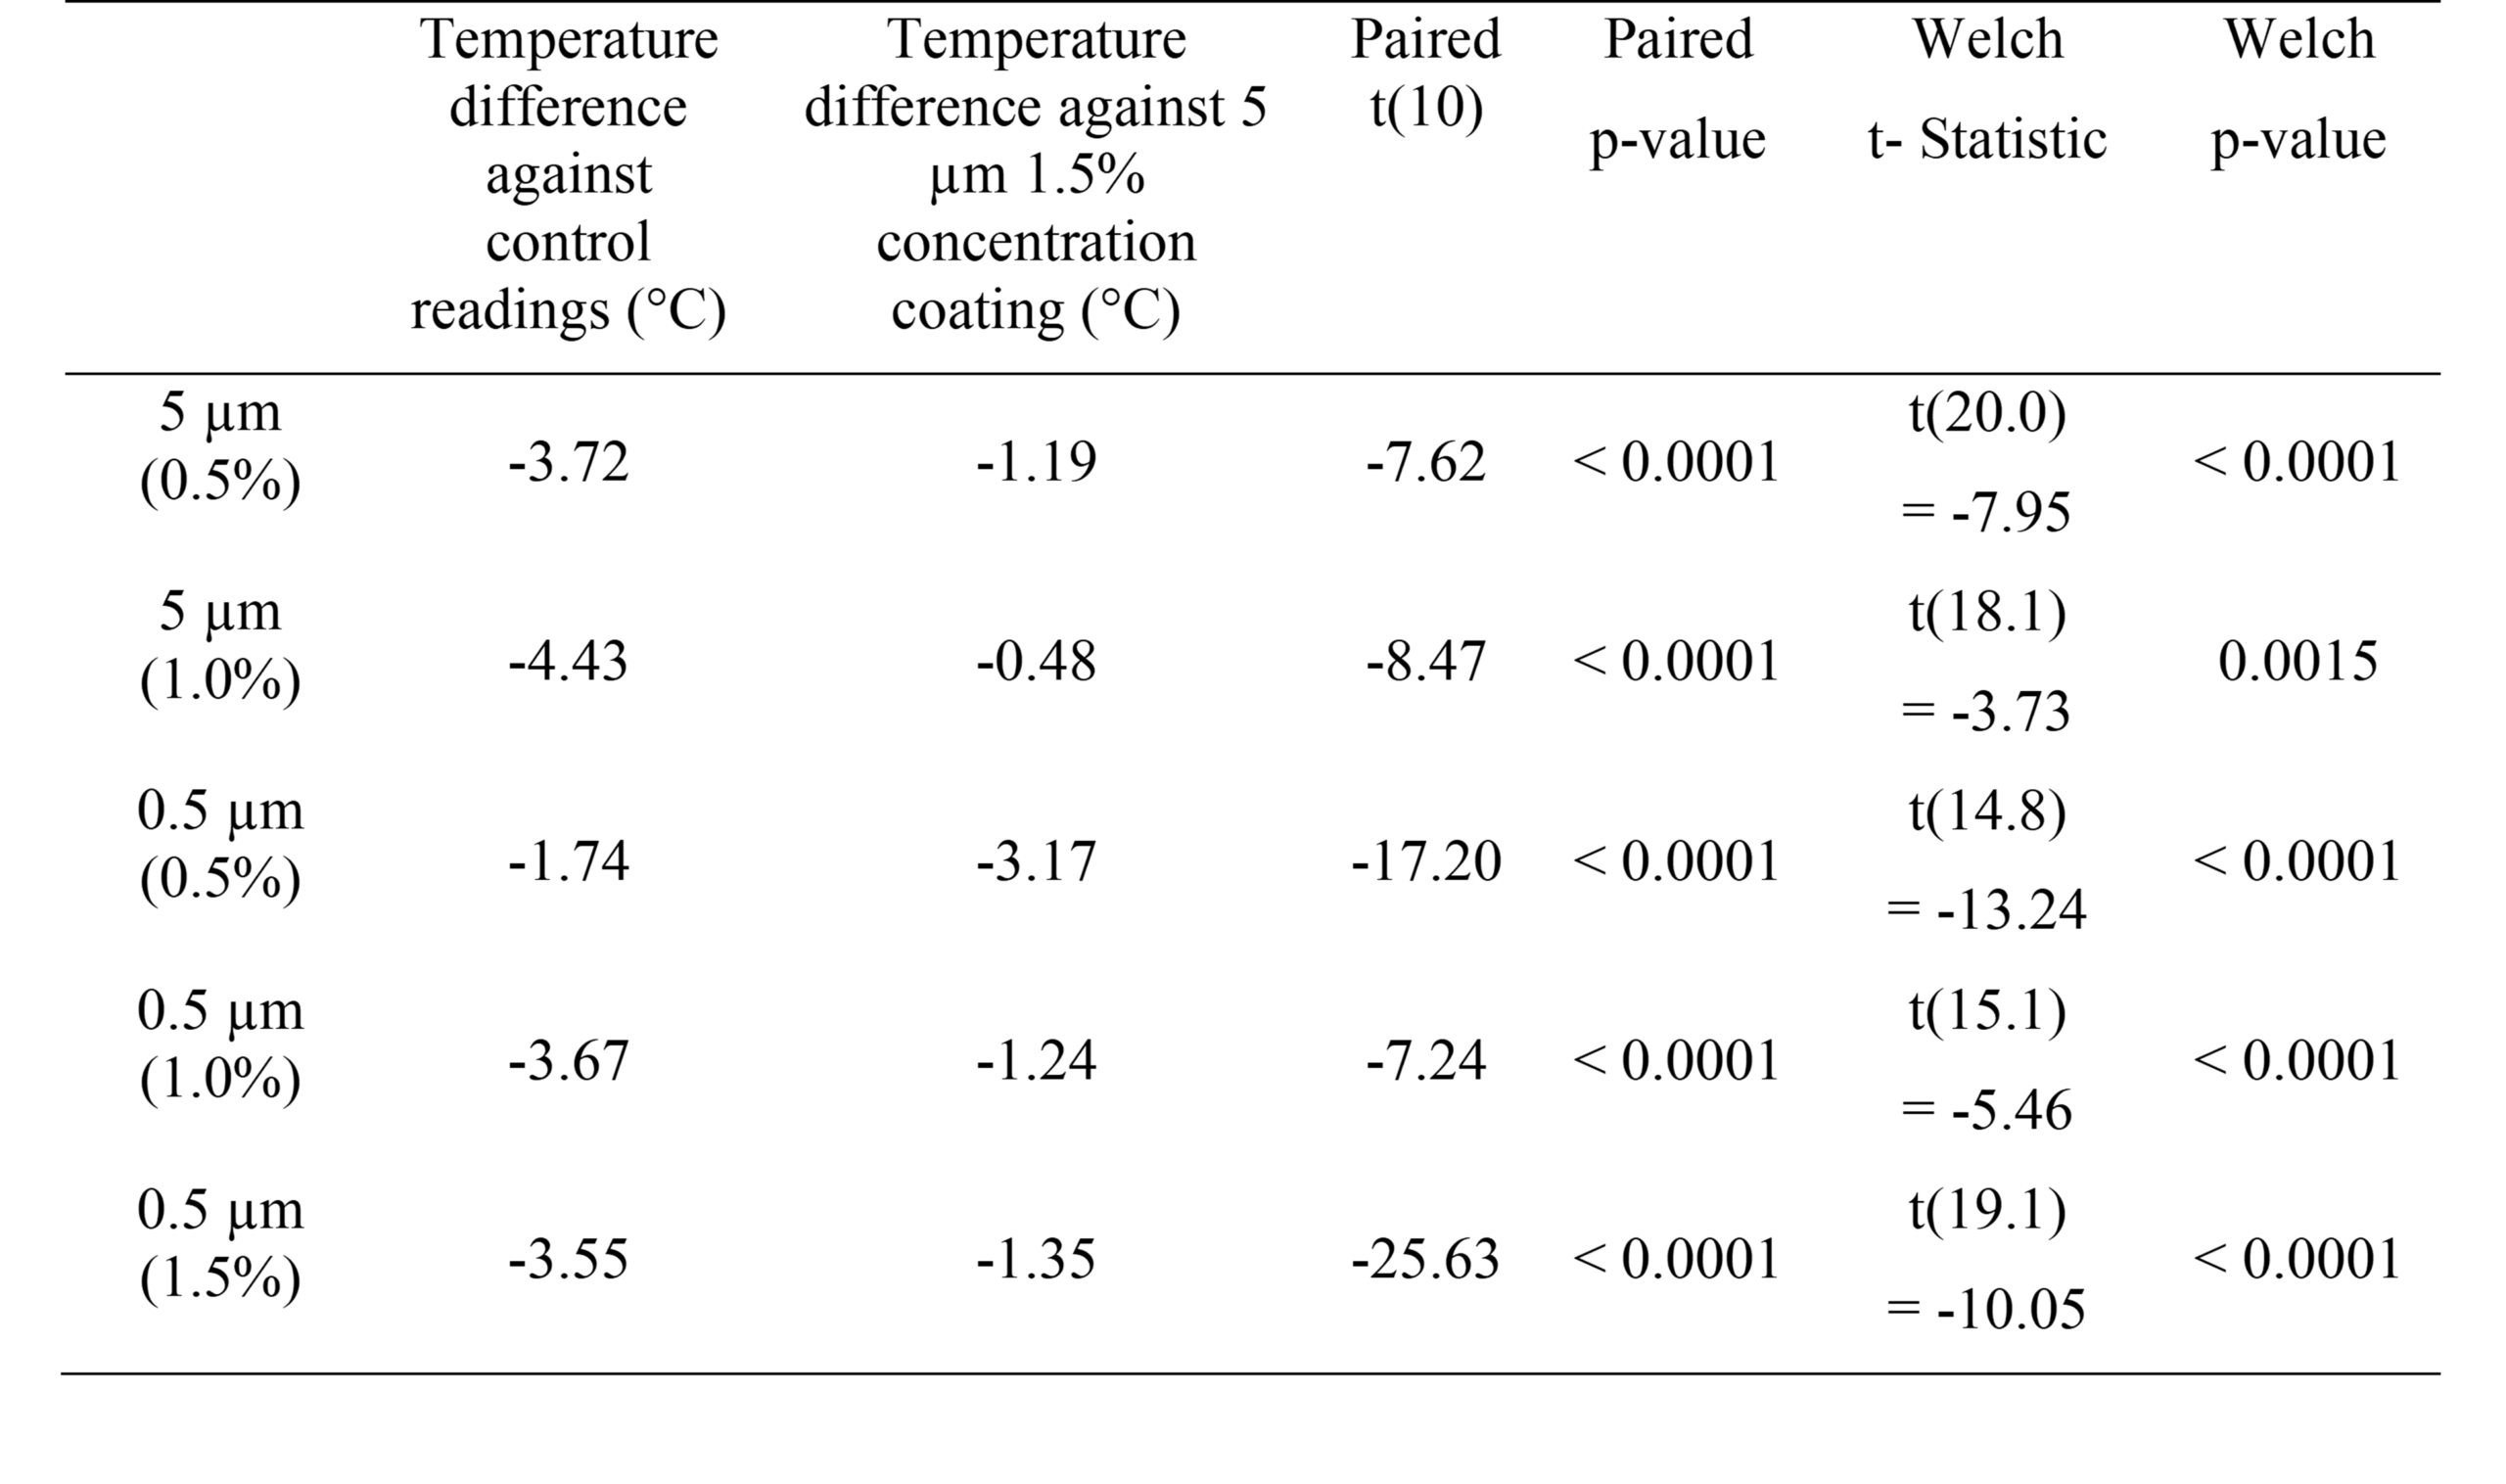
From the results, the first observation that deviates from the hypothesis is the decrease in solar heat reduction of the 0.5 μm film from 1% to 1.5% in the first experiment. For the 0.5 μm coatings, increasing the concentration from 0.5% to 1% shows an improvement in solar heat reduction but drops slightly when this concentration is increased to 1.5%. In the second experiment, this decrease in solar heat reduction was exhibited from 0.5% to 1.0%. The findings indicate that the sub-micron 0.5 µm nanoparticles have inconsistent performances in film coatings. The second trend that diverges from the hypothesis is the 5 μm coating being more effective than the 0.5 μm coating at all concentrations tested. The 5 µm 1.5% coating sample (mean heat reduction of -4.91 °C) produced statistically significantly superior cooling than to all other 5 conditions in the dataset of the first experiment (as shown in Table 3, p ≤ 0.0015 across both independent and paired t-tests). This is hypothesized to be a result of the high viscosity of PVAc and low IPA concentration, which may promote clumping of sub-micron, 0.5 μm ZnO nanoparticles at a higher incidence rate than that of the 5 μm coating ZnO nanoparticles. Additionally, the larger 5 μm nanoparticles, are postulated to individually engage in stronger Mie backscattering and IR absorption at the surface of the coating, resulting in greater solar heat reduction compared to the 0.5 μm nanoparticles.
The results of the second controlled experiment independently corroborate the findings from the first experiment. The 5 µm coatings consistently outperformed the 0.5 µm coatings in solar heat reduction at all three concentrations, with smaller absolute temperature differences compared to the initial experiment. The transparency of the 5 μm coatings also retained more transparency than that of the 0.5 μm coatings at equivalent concentrations. These findings prove the 5 μm coatings more effective for use in solar heat reduction glass coatings.
In a study done by Hoyt et al, raising the thermostat setpoint from 22.2 °C to 25.0 °C achieved a 29% reduction in cooling energy. The difference of 2.8 °C yields an average of 10.36% reduction per 1°C24. Subsequently, the temperature reduction of ~4°C in the outdoor 5 μm coatings suggest substantial potential for decreasing energy expenditure for cooling.
The tendency of <1 μm ZnO nanoparticles to undergo high agglomeration in polymer solutions is documented in other studies. Singh et al.25 demonstrated that ZnO nanoparticle Polyvinyl Alcohol slurries have low zeta potential values (closer to 0 results in more clumping), which, in his paper, documented a range from -2.52 mV to -11.4 mV. The nanoparticle sizes used in his study were from 0.24 to 1.02 μm, with 0.5 μm in the range. Marsalek R.26 establishes that low zeta potential (in the range of ± 30mV) is an indication of weak electrostatic repulsion between particles. In this case, the attractive van der Waals forces overcome the electrostatic repulsion, triggering particle aggregation. This supports the assumption that the 0.5 μm sample underwent particle clumping, lowering ZnO coverage and decreasing the effectiveness of the coating.
There are many different limitations that could influence the findings of the study. With a smaller number of individual test probes and coatings for each experiment, the sample size of the study is small, and needs more iterations for conclusive findings. The time frame and light exposure should also be varied to test the long-term solar heat reduction The temperature probes only measured to the nearest 0.1°С, and probe error may have affected the accuracy of the readings. The location of the temperature probes was standardized by taping the probes to the base of the Styrofoam test boxes; however, the tape could have interfered with the accuracy of the readings.
Even though all coatings exhibited solar heat reduction, the coatings tested were all newly applied, and the effect of long-term exposure was not tested. PVAc can degrade when in the presence of both moisture and UV light. Further testing will be needed to find the extent of UV degradation with the ZnO coating matrix. In the study, The 5 μm ZnO coating outperforming the 0.5 μm ZnO coating was hypothesized to be attributed to clumping, where IPA was used to break the surface tension of water and mix the ZnO nanoparticles. However, alternative compounds could be applied to the solution to reduce surface tension, possibly making a more effective 0.5 μm ZnO coating. For use in buildings, alternative mineral filters can be trialed to provide solar heat reduction while still maintaining vision through glass panels. The thickness of the coating could be decreased to increase transparency; however, the effect on solar heat reduction would have to be studied in subsequent experiments. Thermocouples could also have been used to measure temperature with greater accuracy.
The experiment did not include extensive coating durability testing which should include: adhesive strength testing, UV weathering and humidity testing. The UV and humidity-based deterioration of PVAc can be circumvented with the introduction of sealants, double glazing, or a specific mixture of ZnO. Further experimental testing will be needed to show the effectiveness of these methods.
The location of the testing of the first experiment could have been subjected to localized drafts and uneven tiles, even though there barely any wind. In addition, it was difficult to perfectly align the boxes, which may have changed the angle of sun exposure each coating was subject to. Further testing should also include customized Styrofoam boxes that allow for an airtight seal between the glass pane and the box, or the additional use of an adhesive. Additional limitations included variable ambient temperature, relative humidity, and solar irradiance, all were not monitored during the experiment. This gives a greater variability in the results of the first experiment which was taken outside. The first two readings of the outdoor experiment (12:05 and 12:10) were excluded from Table 2 as the temperature probes had not yet stabilized. The exclusion reduces the observation window of the first experiment to 50 minutes. However, the initial temperature of each box was still maintained at 42.3°C ±0.5°C. UV reflectance, infrared reflectance and thermal emissivity were not directly tested in the study.
As the global temperature continues to rise and modern cities grow, glass buildings become more and more prevalent, consuming excessive amounts of energy. The common practice of installing larger or more efficient air conditioners still contributes to high energy costs and the urban heat island effect. The findings from this study show that a pathway to cooler temperatures can be through mineral filters that reduce solar heat gain in buildings. This can still be done in a cost-effective manner, shaping the heat management of modern cities. For this to take place, more resources and interest should be invested in the field of solar heat management to make our cities greener and more energy efficient.
References
- Li, Z.; Zhang, H.; Chen, H.; Gao, D. Advances, challenges and perspectives of using transport membrane condenser to recover moisture and waste heat from flue gas. Sep. Purif. Technol. 2022, 285, 120331. https://doi.org/10.1016/j.seppur.2021.120331 [↩]
- Salilih, E. M.; Bamaga, O.; Almatrafi, E.; Abulkhair, H.; Alhumade, H.; Bamasag, A.; Ahmed, I.; Alsaiari, A.; Nurrohman; Albeirutty, M. Performance analysis of a novel absorption-refrigeration driven membrane condenser system for recovery of water and waste heat from flue gas. Int. J. Refrig. 2023. https://doi.org/10.1016/j.ijrefrig.2023.10.011 [↩]
- Hwang, R.-L.; Lin, T.-P.; Lin, F.-Y. Evaluation and mapping of building overheating risk and air conditioning use due to the urban heat island effect. J. Build. Eng. 2020, 32, 101726. https://doi.org/10.1016/j.jobe.2020.101726 [↩]
- Kamal, A.; Mahfouz, A.; Sezer, N.; Hassan, I. G.; Wang, L. L.; Rahman, M. A. Investigation of urban heat island and climate change and their combined impact on building cooling demand in the hot and humid climate of Qatar. Urban Clim. 2023, 52, 101704. https://doi.org/10.1016/j.uclim.2023.101704 [↩]
- Zou, Y.; Wu, Z.; Li, B.; Jia, Y. Cooling energy challenges in residential buildings during heat waves: urban heat island impacts in a hot-humid city. Buildings 2024, 14(12), 4030. https://doi.org/10.3390/buildings14124030 [↩]
- Kalwry, H.; Atakara, C. Exploring energy-efficient design strategies in high-rise building facades for sustainable development and energy consumption. Buildings 2025, 15(7), 1062. https://doi.org/10.3390/buildings15071062 [↩]
- Perumalla, A.; Thomas, T.; Kalpathy, S. K. Metal oxide-dispersed PDMS nanocomposite films with enhanced heat-shielding ability and optical transparency. Opt. Mater. 2024, 152, 115414. https://doi.org/10.1016/j.optmat.2024.115414. [↩]
- Bao, Y.; Guo, R.; Kang, Q.; Liu, C.; Zhang, W.; Zhu, Q. Transparent, thermal insulation and UV-shielding coating for energy efficient glass window. Ceram. Int. 2021, 47(17), 24203–24211. https://doi.org/10.1016/j.ceramint.2021.05.180 [↩]
- Nieradko-Iwanicka, B.; Wysoki´nska, K. Chemical and physical UV filters. Polish Journal of Public Health. Vol. 132, pg. 48–51, 2022, https://doi.org/10.2478/pjph-2022-0010. [↩]
- Schneider, S. L.; Lim, H. W. A review of inorganic UV filters zinc oxide and titanium dioxide. Photodermatology, Photoimmunology & Photomedicine. Vol. 35, pg. 442–446, 2018, https://doi.org/10.1111/phpp.12439. [↩]
- Kim, S. Y. Simultaneous determination of refractive index, extinction coefficient, and void distribution of titanium dioxide thin film by optical methods. Applied Optics. Vol. 35, pg. 6703–6707, 1996, https://doi.org/10.1364/AO.35.006703. [↩]
- Vidal-Vega, M.; Nunez-Decap, M.; Hernandez-Duran, J.; Catricura-Munoz, P.; Jara-Briones, C.; Moya-Rojas, B.; Opazo-Carlsson, C. Comparative Study of Carbon Nanotubes and Lignosulfonate as Polyvinyl Acetate (PVAc) Wood Adhesive-Reinforcing Agents. Appl. Sci. 2024, 14(1), 365. https://doi.org/10.3390/app14010365 [↩]
- Abd El-Wahab, H.; Alenezy, E. K.; Omer, N.; Abdelaziz, M. A.; Jame, R.; Alshareef, S. A.; Owda, M. E. Efficacy of zinc and copper oxide nanoparticles as heat and corrosion-resistant pigments in paint formulations. Scientific Reports. Vol. 14, pg. 24413, 2024, https://doi.org/10.1038/s41598-024-74345-0. [↩]
- Al-Wahaibi, Y. M.; Grattoni, C. A.; Muggeridge, A. H. Physical Properties (Density, Viscosity, Surface Tension, Interfacial Tension, and Contact Angle) of the System Isopropyl Alcohol + Cyclohexene + Water. Journal of Chemical & Engineering Data. Vol. 52, pg. 548–552, 2007, https://doi.org/10.1021/je060442b. [↩]
- Sui, X. M.; Shao, C. L.; Liu, Y. C. White-light emission of polyvinyl alcohol/ZnO hybrid nanofibers prepared by electrospinning. Applied Physics Letters. Vol. 87, pg. 113115, 2005, https://doi.org/10.1063/1.2048808. [↩]
- García, P. D.; Sapienza, R.; Bertolotti, J.; Martín, M. D.; Blanco, A.; Altube, A.; Viña, L.; Wiersma, D. S.; López, C. Resonant light transport through Mie modes in photonic glasses. Physical Review A. Vol. 78, pg. 023823, 2008, https://doi.org/10.1103/PhysRevA.78.023823. [↩]
- Pietruszka, R.; Witkowski, B. S.; Gieraltowska, S.; Caban, P.; Wachnicki, L.; Zielony, E.; Gwozdz, K.; Bieganski, P.; Placzek-Popko, E.; Godlewski, M. New efficient solar cell structures based on zinc oxide nanorods. Solar Energy Materials and Solar Cells. Vol. 143, pg. 99–104, 2015, https://doi.org/10.1016/j.solmat.2015.06.042. [↩]
- Chen, T.; Chang, I.; Tsai, M.; Chang, Y.; Yang, M.; Chen, P.; Chiu, H.; Lee, C. Lee. Size-controlled wurtzite zinc oxide spheres with the characteristics of visible absorption and Mie scattering. CrystEngComm. Vol. 16, pg. 3341–3347, 2014, https://doi.org/10.1039/c3ce42370k [↩]
- Hwang, R.-L.; Fang, P.-L.; Chen, W.-A. Impact of solar radiation on indoor thermal comfort near highly glazed facades in a hot-humid subtropical climate: an experimental evaluation. Build. Environ. 2023, 243, 110725. https://doi.org/10.1016/j.buildenv.2023.110725 [↩]
- Liu, L.; Schmid, S. Y.; Feng, Z.; Li, D.; Droubay, T. C.; Pauzauskie, P. J.; Schenter, G. K.; De Yoreo, J. J.; Chun, J.; Nakouzi, E. Effect of Solvent Composition on Non-DLVO Forces and Oriented Attachment of Zinc Oxide Nanoparticles. ACS Nano 2024, 18(26), 16743–16751. https://doi.org/10.1021/acsnano.4c01797 [↩]
- Zhelezny, V.; Geller, V.; Semenyuk, Y.; Nikulin, A.; Lukianov, N.; Lozovsky, T.; Shymchuk, M. Effect of Al2O3 Nanoparticles Additives on the Density, Saturated Vapor Pressure, Surface Tension and Viscosity of Isopropyl Alcohol. Int. J. Thermophys. 2018, 39, 38. https://doi.org/10.1007/s10765-018-2361-8 [↩]
- Bergeron, V. Forces and structure in thin liquid soap films. J. Phys.: Condens. Matter 1999, 11(19), R215. https://doi.org/10.1088/0953-8984/11/19/201 [↩]
- Septiyanto, A.; Prima, E. C. Light intensity analysis using an android-based lux meter application for educational purposes. AIP Conf. Proc. 2025, 3206, 080003. https://doi.org/10.1063/5.0259108 [↩]
- Hoyt, T.; Arens, E.; Zhang, H. Extending air temperature setpoints: Simulated energy savings and design considerations for new and retrofit buildings. Build. Environ. 2015, 88, 89–96. https://doi.org/10.1016/j.buildenv.2014.09.010 [↩]
- Singh, G.; Shanmugam, S.; Chawla, R.; Goel, N.; Talwar, G.; Mishra, S. K.; Chatli, M. K. Impact of Zinc Oxide Nano Particles, Poly Vinyl Alcohol, and Natural Polymers on Quality Characteristics of Nanocomposite Film. Coatings. Vol. 13, pg. 420, 2023, https://doi.org/10.3390/coatings13020420. [↩]
- Marsalek, R. Particle Size and Zeta Potential of ZnO. APCBEE Procedia. Vol. 9, pg. 13–17, 2014, https://doi.org/10.1016/j.apcbee.2014.01.003. [↩]