
Abstract
The January 2021 GameStop (GME) event was an event driven by coordinated trading of investors resulting in one of the most extreme events of market volatility in the stock markets. The event revealed the susceptibility of institutional short-selling towards systemic risk and drew significant attention. The goal of this study is to determine the extent to which changes in short-selling behavior and strategy are associated with structural shifts of the GME event or are more related to market characteristics. The analysis is conducted using the FINRA Equity Short Interest Files and spanning the time period from January 2020 – January 2022. This allows the dataset to cover adequate time before and after the event to identify if there is behavioral change. In the analysis, log and absolute change measures, as well as rolling volatility, extreme-build indicators, and persistence metrics were computed. To understand the differences across the periods of pre-GME and post-GME, fixed effects regression models are implemented, as well as various statistical tests. Based on the simple results of these various tests, the results indicate that there were decreases in the magnitude and volatility of short-interest changes. Additionally, there were less extreme spikes occurring after the GME event. However, once the tests were nuanced with other effects, such as firm fixed effects, time fixed effects, and various market controls, the post_GME indicator does not remain statistically significant. Accordingly, it does not explain the changes in volatility or the changes in short interest seen after the GME event. The results instead show that short-interest dynamics are more strongly associated with firm-level characteristics. Examples of these characteristics are liquidity and persistence from prior short positions. The evidence of the study suggests that, overall, the changes seen in short-selling behavior are driven primarily by firm-specific characteristics and time effects. The evidence does not indicate that there was a structural time break surrounding the GME event, which would reflect that the behavioral changes were a result of the event itself. This research increases the understanding of short-selling behavior and adaptations of it following the GME event in January 2021.
Keywords: GameStop, Short-interest, short selling, volatility, systemic risk, liquidity, persistence
Introduction
Short selling is a highly valued strategy in financial markets, generally tending to effect price discovery as well as market efficiency. Using this strategy, investors are able to respond in the event that they believe a stock is overpriced. However, at certain times, short selling can in fact increase systemic risk experience and in turn it can also create major shifts in price values. Studies done in the past have demonstrated the ways in which short selling activity can affect price efficiency. An example of such an effect would be when excessive short selling pressure could result in price changes even farther than basic value markers1.
A disrupting event occurs in the event that the total number of short positions exceeds the number of shares available to trade. In this case, there are extremely high short interest values, resulting in conditions for a short squeeze to develop. These specific conditions can force short sellers to cover their positions which also causes further price increases. Because of this, the stock prices are also significantly more sensitive to buying pressure. When this happens, even small changes in demand of a stock can create extreme price spikes. This situation can begin a feedback loop which creates higher and recurring volatility. This phenomenon occurred in January 2021, becoming a major and heavily analyzed financial event. This was a major example of the phenomenon, known as the GameStop (GME) short squeeze. During this time, the total shares of GME which were sold short exceeded the number available, which caused an accelerated growth in the company’s stock price. To address this effect, several retail investors coordinated buying efforts through the use of Reddit’s platform r/WallStreetBets. This compromised the shorting positions of the several prominent hedge funds which had already heavily shorted the stock prior to these efforts. The result of this was that when the hedge funds covered their short positions, the upward pressure on stocks became higher since the investors were purchasing the shares at higher prices. Ultimately, this event resulted in significant amounts of losses and position unwinding for several prominent hedge funds. This demonstrated the effect and restrictions of a trading environment which is significantly influenced by social media.
Many previous studies have been centered around the processes which drove the GME event, including but not limited to the behavioral influences and market or institutional constraints. Reddit and other social media platforms influenced more buyers to purchase the stock, establishing a higher association with trading increases and liquidity disruptions as a result, of which happened in the market2. In this event, also, herding of retail investors occurred where investors disregarded primary analysis and purchased stocks due to the increase of public attention. This caused further liquidity disruptions and increased volume of the stock3. Accordingly, from these studies it can be seen that elevated short interest can result from attention shocks coinciding with high trading activity. Moreover, in the event, pricing frictions were also formed in part due to divergences from put-call parity4. All these effects occurring simultaneously with other short-selling constraints, high borrowing costs, and low stock availability forming for the GME stock made trading the stock more difficult5. Finally, based on market data there is evidence that market makers purchased underlying shares which resulted in price discrepancies. This is also known as a gamma squeeze which occurred as a result of the methods which retail call option buyers used6.
Another major focus surrounding the GME event is the impact that regulations of the Equities Market have on buying strategies. Specifically, the restrictions may result in adaptations of how investors form their short positions. Because limitations could potentially affect market accessibilities, the limitations play an impact in short-selling behavior. Considering all the above, short-selling patterns are generally heavily influenced by market trends and characteristics, sometimes even more so than an event itself7. Because of the significant public attention through social media, investors were disregarding independent analysis at more frequent levels8. Hence, there are multiple ways in which perceived market trends could influence groups of the investors to adapt the short-selling strategies they use for a specific share. In this way, traditional forms of evaluating stocks and predicting prices may be unreliable, as these are not able to account for public attention and misleading interpretations which could have formed online9.
In addition, such behavioral shocks and involvement of the public attention can decrease the effect of market correction and then create pricing disruptions. This is known as a limit to arbitrage, which is where rational traders are not able to address mispricings of the stocks because of other barriers in the market. In the GME event, these involved severe capital limitations and margin risks which developed, preventing investors from being able to address the mispricing10 . When several of these factors intersected with each other, it created increased volatility in the market which also led to pricing disorders. This event is a prime example of the way in which several coinciding factors can impact a trading environment and how the market will behave following this impact of unprecedented circumstances11. It has not yet been understood how the interaction of such factors impacted the GME event collectively, as several previous studies observed each factor separately. As a result, it is not fully understood how institutions responded to the event to handle susceptibilities to risk and if the strategies they implemented lasted for a longer term. Comprehensively, this interaction of several characteristics of the market with behavioral collaboration of investors may be more strongly associated with the GME event instead of the event itself resulting in long-term changes.
Hence, instead of observing investor activity and market conditions as two separate constituents, previous studies suggest the GME event occurred due to the combination of the two. Specifically, the event may have resulted from a feedback loop of pre-existing conditions (short exposure) and online reactions and planning. Retail investors coordinated trading strategy using social media, which majorly influenced the GME event. Reddit in particular, as well as other platforms, collaborated and formed consensus on the platform before the event regarding the company’s shares which created a self-reinforcing mechanism having a major market effect12. Short sellers were forced to cover positions because of coordinated buying of shares, organized on Reddit’s r/WallStreetBets. This created an extreme increase in the stock price and also resulted in a recurring loop of high levels of volatility. The interaction of sentiment trading coordination and pre-existing exposure levels created this cycle. Past studies demonstrate how retail attention acted as a direct factor of trading volume increases by showing a clear statistical difference in general visibility online and targeted motives based on speculation of the stock price13. As there was a clear relation of positive social media sentiment and trading volume, it is seen how online behavior of investors influenced market activity. This pattern is representative of herding behavior. This is when retail investors bypass what data valuation strategies would suggest and make coordinated market strategies. Furthermore, social validation influenced trading behavior, which is a form of psychological propaganda , and contributed to feedback loops instead of valuation methods14. Because numerous investors responded to perceived opportunities by general communities, price movements became unnecessarily shifted.
Based on the findings of studies done in the past, it is unlikely that events as major as the GME event occur independently. In such events, the pre-existing market conditions may have a large role in determining how the price will react to the actions of investors. In the case of the GME event, behavioral shocks may have caused price distortions to increase and be sustained due to extreme short interest. The present liquidity conditions and many other market factors would also correspondingly affect pricing of the shares15. For instance, the condition of low liquidity can disrupt smooth settling or shifting of the prices. This can make extreme short interest even more disrupting and further increase the volatility in the market. Additionally, behavioral collaboration and shocks occurring together can also cause concentrated short positions to become unstable since there is a large presence of traders of the stock. This happens as a result of many potential limitations, including but not limited to decreased float availability and buying pressure on the stock. Stock loan data from the time of the GME event is in accordance with this as borrowing fees were at extremely high levels at the time. Because of this, short sellers were forced to close previously held positions due to the public float decreasing and borrowing costs being exorbitant. Hence, price movements can be significantly affected by the interaction of behavioral collaboration in trading and pre-existing market conditions before and during the event, as seen in the GME short-squeeze.
Furthermore, high-frequency communication being compared to immediate market order flow offers a testament to the established interaction of behavioral collaboration and pre-existing market conditions. Discussion activity online shows a strong link to irregular trading patterns during GME event16. To clarify, when increases in the number of posts on WallStreetBets on Reddit were seen, there was also a major increase in traded shares and volume of GME. This is supported by the high-frequency financial data and extensive past Reddit posts. Following bursts of social media activity, trading increases could be seen within 30 minute windows, demonstrating how significantly attention-based the trading of the GME shares was rather than based on statistical or traditional valuation methods. Furthermore, this is supported by the data in order-flow books, within each day, which show how the 30-min spikes of social media activity generally preceded order imbalances when trading was done on public exchanges17. When many traders began actively buying the GME shares, temporary disruptions were seen in how the stock was being traded. Yet, these were temporary changes, and were not seen to persist long term in the market structure18. Yet, based on the information about liquidity and concentration levels at the time of the GME event, behavioral shocks were not enough to fully cause the short squeeze at the level it occurred. Instead, the behavioral shock could have potentially had a role in amplifying the intensity of the squeeze, not causing it itself but instead due to the pre-existing structural limitations and forced-covering of the positions.
Self-reinforcing volatility can be a product of several intertwined factors such as concentrated short interest and investor behavior and coordination. In this case, hedge funds faced major losses as the short interest surpassed 100%, when the leverage and liquidity dynamic was disordered. Multiple prominent hedge funds which had been involved in the GME short squeeze faced capital drawdowns due to the concentrated short positions and there being unpredictable liquidity movements19. Since this caused a significant loss exposure, there was further pressure of the price to increase. Following this, the market’s instability was increasing. Rising prices tend to correlate to higher margin necessities and also may cause forced covering, resulting in a leveraged liquidity cascade. This event also exposed, moreover, that short positions are also susceptible to coordinated retail action and the systemic risk associated with that. The event exposed major limitations of the Value-at-Risk (VaR) framework, as the method is unable to determine how severe losses could potentially reach. This shifted the perspective of retail investors simply causing background noise towards potentially being sources of tail-risk exposure20. Thus, the event may have the effect of altering retail investor’s impact to crowded short positions on a long-term basis rather than just for a temporary event, as such forms of behavioral coordination could reoccur in the future. Recurring risk may alter hedge funds’s strategies in order to avoid exposure as they may adjust execution flows and positioning. This can be in regards to market awareness of concentrated positions or because of short-sale disclosure regulations21. Yet, based on studies of short squeezes in several countries, although hedge funds may face significant losses, the amount may not necessarily be the same for the market as a whole.The market may be able to recover without long-term changes persisting, and only facing temporary effects22.
Previous studies have largely been centered on the extreme volatility involved in the GME event, and the retail investors and mechanisms involved in it. This has included the explanations of the way in which social media behavior, severe short interest, and limitations of liquidity played a role in the GME stock’s price valuation and its fluctuation. Yet, not many studies have been centered on understanding how the market and its participants themselves responded to the event. Specifically, there have been limited studies on whether their high risk market behavior and strategies may have resulted in long-term shifts in the short selling strategies. Furthermore, limited assessments of the market-wide impact of the GME event have been done, as to how the event could have potentially changed market participants actions in terms of short exposure, leverage, and risk aversion strategies. The goal of this research is to understand the extent to which changes in short-selling activity and strategy in the post-GME period is associated with the GME event or the association with fundamental, pre-existing market characteristics. This research provides insight into how market participants reacted to major shocks of the market. The GME event shows how existing market conditions interacting with retail traders, when coordinated, can undermine traditional methods of trading done by institutions. Previous studies have focused more on how the squeeze occurred and functioned rather than the effects of the squeeze in terms of behavior.
The behavior of short-selling can be measured in terms of several numerical values, which include short interest ratios, volatility over time, and frequency of extreme short interest positions. It is hypothesized that, when accounting for liquidity, short-interest positioning, trading conditions, generally fundamental market characteristics, variation in short-selling activity after the GME event will more strongly be associated with market characteristics than the GME event itself. Based on previous studies, in the past retail investor transactions have not tended to cause persistent market structure changes, and instead are primarily based on market characteristics and liquidity conditions. Specifically, these conditions include factors including but not limited to liquidity, volatility, and stock-specific characteristics, such as trading colume or existing short interest. These continue to be critical drivers even in durations of high investor trading23. The methods used in this study are able to numerically assess whether or not institutional investors and market participants altered strategies of trading based on their short exposure and risk during the event. To carry out the study, bi-weekly, market-wide, short interest data is used to comprehend how short selling behavior compared before and after the GME event in the U.S equity market.
There are several limitations of this study in terms of what it can determine using the existing data. First, this study does not identify the specific trading strategies each or individual hedge funds used during the GME event since the trading is not being done in real time. Instead, the patterns are deduced using the observed trends in market wide short-interest activity and quantitative calculations defining this. Short-selling activity is quantified using market-level short interest. In addition, a limitation is faced since the used time-period in this sample covers only one year before and after the GME event. This is not necessarily enough to determine long-term effects and changes in strategy, which could develop progressively following the event. Although these limitations are present, the dataset remains able to provide further insight into market-wide shifts after the GME event in investor behavior.
This study provides an understanding of how market investors reacted to the GME event and how it may have resulted in long-term adaptations in the financial market by combining behavioral finance and market microstructure concepts. In general, behavioral finance can be categorized as the study of how sentiment, attention, and herding effects may potentially affect investor behavior. An example of this would be in an environment significantly affected by social media and how this could increase coordinated trading activity. For the GME event itself, the increased buying of GME shares wasn’t solely caused by fundamental financial data, but by increased attention to the stock from retail investors on Reddit. The investors then made synchronized efforts to purchase the stock based upon the increased attention. Additionally, for this event, market microstructure determines how persistent strategies can emerge from behavioral shocks after constraints such as borrowing costs, margin requirements, and low liquidity levels are faced. Because of these limitations being an influence, short sellers become forced to reactive positions in response to the event and the prices themselves become extremely volatile. This is specifically because of covering pressure when the share price increases dramatically. Based on these interacting perspectives, the GME event was a combination of the behavioral shocks and market restrictions based on pre-existing conditions of the market. This may also be due to short sellers being increasingly aware of the effect concentrated short positions could have, in terms of large potential losses when several investors short the same stock and this downside could have caused changes in short-selling behavior following the event’s occurrence.
This study utilizes bi-weekly files which are short-interest data of the FINRA Equity Short Interest Files, published by FINRA, or the Financial Industry Regulatory Authority. The data is used to observe U.S equities which are publicly traded and identify differences depending on the timing in relation to the GME short-squeeze. To do this analysis, statistical measures were calculated, including log changes, absolute changes in short interest, rolling volatility, and the frequency of extreme short positions. This was done to potentially define changes in short-selling behavior and strategy which could have formed in association to the GME event taking place. Furthermore, regression models and statistical comparisons compared how significant the effect of these factors would have been in terms of the event.
Methods
Data Source and Preprocessing
This study uses short-interest data from FINRA’s Equity Short Interest Files, published by the Financial Industry Regulatory Authority (FINRA). These files report short interest positions from FINRA member firms, twice a month. Archive files from this dataset were collected and the sample includes publicly traded U.S equities reported in FINRA short-interest files from January 2020 to January 2022 to build a comprehensive dataset including the period surrounding the January 2021 GameStop short squeeze. The January 2020 to January 2022 period was chosen to provide approximately one year of observations before and one year after the GameStop event, allowing for comparisons of aggregate market-level short-selling behavior before and after the January 2021 short squeeze. The pre-event period establishes the baseline market behavior, and the post-event period allows for the observation of potential changes in short-selling behavior after the event. Each observation correlates to a specific security, identified by its ticker symbol, and additional variables including but not limited to prior short positions, average daily trading volume, and days-to-cover ratios. This dataset allows for the longitudinal analysis of short interest dynamics across a panel of securities, allowing for temporal change analysis as well as cross-sectional variation analysis in market trends. The sample includes all publicly traded U.S equities reported in FINRA Equity Short Interest Files between January 2020 and January 2022 with valid ticker identifiers and two consecutive reporting dates to allow for the calculation of changes in short interest over time. Observations which had invalid or missing values were excluded, and securities which lacked sufficient observations for calculations of short-interest changes and volatility measures were omitted from the relevant analysis. The sample excludes ETFs, ADRs, preferred shares, and warrants. Observations with missing or non-positive values required for log transformations are removed during data preprocessing and regression sample construction. The dataset was imported, combined, and processed using R Studio, implementing the data.table and dplyr libraries. To ensure clarity, key variables were standardized including symbolCode being renamed to Symbol, and currentShortPositionQuantity being renamed to short_interest. In addition, accountingYearMonthNumber, the numeric year-month reporting identifier, was converted to date format to allow time-series analysis.
Variable Construction and Event Definition
Additional variables were computed. The change in short interest (dSI) is defined as:
Where SIᵢ,ₜ symbolizes short interest for security i and at time t. This log-difference calculation indicates proportional changes in short interest and limits heteroskedasticity in level data. The absolute change in short interest is defined as abs_dSIᵢ,ₜ = |dSIᵢ,ₜ|, measuring the magnitude of adjustment, irrelevant of the direction of change. Following this, Extreme Short Build indicators, defined as the top 5% of dSI values for the dataset. However, to avoid mechanical bias from only the post-GME sample distribution. Extreme short builds are calculated using a cross-sectional threshold method:
Where Q0.95 denotes the 95th percentile of the pre-GME distribution of dSI. This fixed threshold is subsequently applied to both the pre- and post-GME periods to evaluate whether extreme short builds became more or less frequent after the GameStop event while avoiding mechanical changes in the cutoff. A post_GME flag was included to differentiate periods before and after the January 2021 GameStop short squeeze. This binary variable separates observations occurring before and after the GME short squeeze. A post_GME indicator variable is defined as:
Econometric Model
To evaluate how short-selling behavior changed, a regression with fixed-effects and able to measure for multiple quantities with controlled factors was used. The regression formula can be seen as such:
In this equation Yᵢ,ₜ represents the output of the value, or the dependent value, of i, when at time t. Depending on the regression, this could be for the value of dSIᵢ,ₜ, |dSIᵢ,ₜ|, PersistentBuildᵢ,ₜ, or ExtremeBuildᵢ,ₜ. To add controlled effects to the regression, αᵢ is used in the equation to control for security-specific fixed effects, and additionally, τₜ controlled for fixed month effects. This is able to isolate the relationship of short-selling behavior and prevent month or firm fixed effects from affecting the outcome. This specifically is to control for heterogeneity which may be observed in stocks or macro-level shocks. The average conditional difference between post-GME and the pre-GME period outcomes is represented by the coefficient of β₁. It should be taken as representing an association, rather than a causal effect. Following this, the data sample is also then clustered into high- and low-liquidity divisions, which is calculated using each firm’s log trading volume and then interpreted. Using these clusters, the analysis allows for the interpretation of whether or not short-interest behavior changed between the microstructure environments. This contributed to an examination of cross-sectional differences.
Model Assumptions and Inference
The empirical specification is based on standard fixed-effects assumptions. This includes conditional exogeneity, where the error term is assumed as uncorrelated with regressors conditional on fixed effects and controls; no perfect multicollinearity in explanatory variables; and enough within-firm variation over time for identification. In the large sample conditions, the fixed-effects estimator is kept consistent. Standard errors are clustered at the firm (symbol) level to account for within firm heteroskedasticity and serial correlation. Given the skewness and heavy-tailed nature of short interest changes, non-parametric Wilcoxon rank-sum tests are used to validate distributional differences across liquidity groups. These tests provide robustness to potential deviations from normality and complement the regression-based inference. To provide a measure of sampling uncertainty, 95% confidence intervals were conducted to characterize distributional statistics and visual analyses were conducted to characterize distributional and temporal patterns in short-selling behavior. Mean and variability measures of key variables, including dSI, |dSI|, and Extreme Short Build indicators, were computed across pre- and post-GME periods as well as across liquidity-based subsamples.
Endogeneity and Identification
The empirical design does not state causal identification. The Post-GME indicator demonstrates a broad temporal shift instead of an exogenous shock. As a result, β1 may indicate effects related to other contemporaneous changes in the financial market, rather than just the GameStop event, including shifts in interest rates, volatility after the COVID-19 shock, and changes in retail trading participation. Although firm and time effects limit some omitted variable bias, unobserved time-varying cofounders may still influence results. Therefore, all results are interpreted as conditional associations instead of causal effects.
Empirical Strategy and Statistical Analysis
Analysis methods centered on identifying the variation in short-selling activity before and after the GameStop event. The empirical specification relies on standard fixed-effects assumptions, including conditional exogeneity of regressors given the included controls and fixed effects, absence of perfect multicollinearity, and sufficient within-firm variation over time. Statistical significance is evaluated using the estimated regression standard errors. In addition, robustness checks are conducted using alternative threshold definitions for Extreme Short Builds (90th, 95th, and 97.5th percentiles) to determine whether results are sensitive to the choice of cutoff. First, the average change in short interest (dSI) and the average absolute change (abs_dSI) were computed for pre- and post- GME periods and visualized using bar charts to observe the change. These methods specify the direction and magnitude of short interest adjustments surrounding the GME event. Following this, to represent disproportionately large increases in short interest, Extreme Short Builds were aggregated by pre- and post-GME periods to measure the prevalence of concentrated shorting activity. Additionally, monthly averages of Extreme Short Builds were calculated to produce a time-series perspective, in order to observe trends and volatility surrounding the event. Finally, Persistent Short Builds, repeated extreme short-interest increases in consecutive periods, were examined over time to determine whether trends of concentrated short selling were sustained throughout the sample time period. A persistent build is defined when a security demonstrates sustained short-selling activity instead of isolated activity, when a security experiences an Extreme Short Build in two consecutive reporting periods. Persistent short builds are defined as consecutive extreme increases in short interest:
Economic Significance
Examining the magnitude of estimated coefficients allowed for the evaluation of economic significance in addition to statistical significance. Regression coefficients were interpreted based on the expected change in short-interest outcomes associated with changes in liquidity, days-to-cover, and lagged short interest. This lets the analysis evaluate if statistically significant relationships correspond to economically meaningful changes in short-selling behavior instead of reflecting the large sample size of the dataset.
Data Visualization and Ethical Considerations
The analysis used is able to compare short selling activity over the period of time rather then separate events. In order to effectively visualize the trends in the data, several graphs were produced in RStudio using ggplot2. These graphs were constructed to show the pre vs. post GME changes and changes in behavior over time. Many bar charts were created to compare the values of average dSI, abs_dSI, and Extreme Short Build proportions between the pre and post GME time periods. A line chart was also used to display the differences in the monthly patterns and changes in short interest adjustments over time, since it is a continuous visualization. Another graph was the boxplot of changes in dSI, again compared between the pre and post GME periods. This displays distribution, central tendency, and variation of short interest adjustments between the two time periods. Lastly, the distribution of absolute short-interest changes between the two periods was examined using a density plot. With this combination of graphs, the analysis included both a time-based and comparative analysis of the GME event. It can be used to show any structural changes which were associated with the GME event. This study does not involve human participants and does not raise privacy or participant concerns. All data used is publicly available financial market data. Overall, the methodology is designed to observe any changes which happened in the short-selling behavior as a response to the GME short squeeze event. The analysis uses security-level short interest comparisons and observations of time-based changes of the market. By using several different metrics in the analysis, sustained changes to market behavior are able to be observed. This facilitates the study goal of identifying potential changes in short-selling behavior which are associated with the GME event.
Results
Overview of Hedge Fund Short Selling Changes
| Variables | m_base (dSI) | m_time (dSI) | m_full (dSI) | m_extreme | m_persist |
| liquidity | 0.1175*** (0.0011) | 0.1181*** (0.0011) | 0.1181*** (0.0011) | 0.4655*** (0.0050) | 0.1038*** (0.0198) |
| days_to_cover | 0.0009*** (9.72e-6) | 0.0009*** (9.73e-6) | 0.0009*** (9.73e-6) | 0.0021*** (4.72e-5) | — |
| lag_short | -0.2200*** (0.0007) | -0.2202*** (0.0007) | -0.2202*** (0.0007) | -0.4170*** (0.0024) | -0.4670*** (0.0099) |
This study examines the changes in short-selling activity before and following the GME short squeeze event. This is done to study whether or not the changes in activity are associated with the pre-existing market characteristics or the event itself, which could potentially represent a structural time break. The dependent variable in this analysis is the short-interest change (dSI). This is the logarithmic difference in the consecutive reporting periods and calculates the short-positions differences between the periods before and after the periods. The post_GME indicator, which is signified in Table 1, is not statistically significant with a value of β = −9.24e−5. Based on this, there was no significant shift in short-interest changes before and after the event. In comparison, liquidity remains positive and stays at a significant value using OLS models (β = 0.1175-0.1181, p < 0.001). These values remain almost identical in terms of magnitude across the variations of the model, other than when considering month fixed effects. Similarly, based on the analysis of days-to-cover, it also remains positive and is also statistically significant in relation to the short-interest change. Specifically, the coefficient value is β ≈ 0.0009, p < 0.001. Finally, lagged short interest was also calculated in relation to short-interest change and this produced a strongly negative value across the regression models. The value specifically was calculated as β ≈ −0.220, p < 0.001. This suggests the price of the share generally returns to normal for the observed short-interest changes.
In addition to the regression values, model fit calculations were also done to understand how well the models measure the data. These tended to remain stable across regressions. The coefficient of determination, which explains how much variance a dataset has, tended to be in the range of 0.1084 – 0.1087, indicating that the regression models maintained high levels of correspondence with the dataset with low variance. Moreover, pseudo R² values, generally calculated for non-linear models, resulted in a value of approximately 0.0349. These values generally remained consistent in terms of their magnitude throughout the models in extreme and persistent short-selling models. When calculating for liquidity, liquidity remains generally strongly positive for extreme and persistent builds, β = 0.4655, p < 0.001 and β = 0.1038, p < 0.001 respectively. In comparison, lagged short interest is negative across the calculated models for extreme and persistent builds, at β = −0.4170 and −0.4670, respectively. Based on the results of the regression analyses, short-selling changes are more highly associated with the liquidity conditions and pre-existing conditions of the event, as well as position modifications. The results do not signify there is an association with the post-GME period indicator. Furthermore, based on the separation into high and low-liquidity groups, there are cross-sectional differences in the two groups for their short-selling dynamics. Generally, based on the results, high-liquidity firms tend to have more stabilized and predictable adjustments to short-position changes. This can be seen through the consistent responses to trading activity and smooth adjustment patterns, instead of displaying volatility. In contrast, low-liquidity firms have more volatile and unpredictable changes and adjustments to their short-position changes. There is lower-market depth as well as a more highly sensitive response to idiosyncratic order-flow shocks in the measured low-liquidity firms. In general, the factors of the liquidity conditions is generally the same, yet the strength and magnitude of these tends to be different. This indicates that for short-selling behavior, the liquidity conditions are generally having an impact on the volatility and stability. To complement the regression results and provide a visual view, several descriptive plots of the various factors are created. All of these include 95% confidence intervals. The confidence intervals are created using standard error approximations in relation to the means and proportions, as well as bootstrap resampling for density estimates. This is done to guarantee that an appropriate measure of plausible error values is included across the graphs. Although these values are calculated, the primary interpretation is done based on point estimates instead of considering the interval overlap of the confidence intervals in the graph.
Robustness Analysis
To ensure the accuracy of the results calculated using the regression models is properly maintained, using the Extreme Short Builds and Persistent builds, additional models were calculated. This had threshold values of 90th, 95th, and 97.5th percentiles using the pre-GME distribution. The resulting values were compared between the three threshold values. Based on this, the 95th percentile was used. This model was chosen as the primary because it retained a sufficient number of observations for accuracy while also including the economically significant extreme short-positions. Based on this, it is more reliable for accurate analysis and interpretation of the results. The 90th percentile doesn’t include as much extreme behavior although it includes a broad range of observations. The 97.5th percentile does the opposite as it reduces the number of observations in the dataset significantly, also reducing the reliability of the data analysis. However, in both the additional model thresholds used, the key observations of the primary analysis do remain consistent. In specific, liquidity is statistically significant and positive when related to the values of the Extreme and Persistent Builds. Similarly, days-to-cover is positive and lagged short interest is negative, which corresponds to the results seen in the primary model used. All the resulting estimates in the alternate threshold based models are still statistically significant and only are varying slightly across the models. Based on this, although the 95th percentile is used as the primary model, the results are not very highly sensitive or dependent on as to which threshold is used in defining the extreme or persistent behavior.
Mean and Absolute Changes in Short Interest
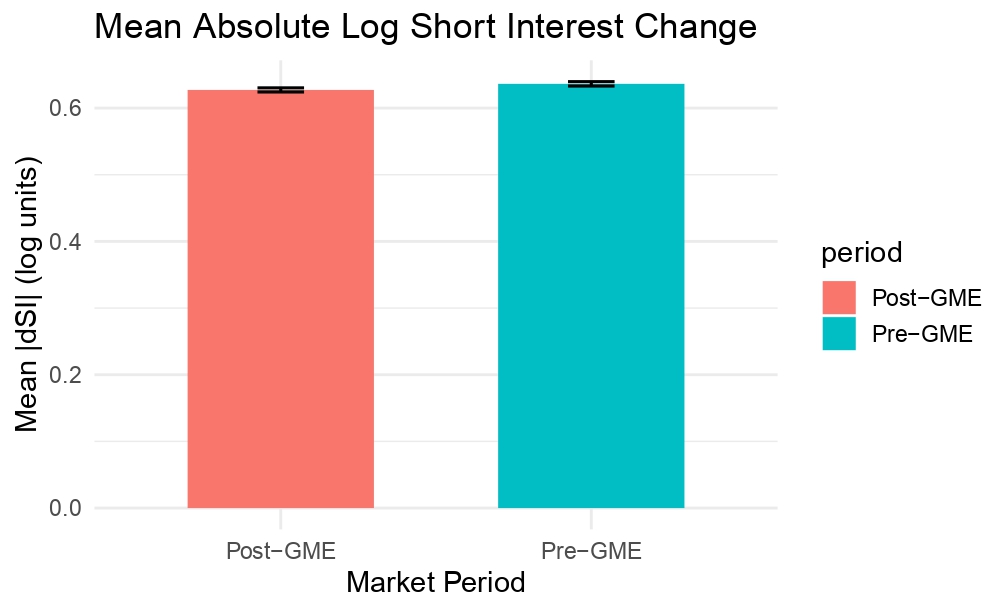
The mean daily change in short interest (dSI) across the pre- and post-GME periods. The average change in both periods is effectively zero, indicating that the short interest adjustments are symmetrically distributed around zero at the aggregate level. There is limited visible directional shift in net short-selling activity between periods, suggesting that changes in short positions tend to cancel out when averaged across firms. Figure 1 shows the mean absolute change in short interest (|dSI|), showing the magnitude of position adjustments independent of direction. Both periods show similar values, with post-GME at around 0.625 and pre-GME at 0.630, demonstrating that the overall intensity of short-position rebalancing stayed relatively stable before and after the GameStop event. This suggests that although individual positions fluctuate, the aggregate level of short-selling activity volume did not significantly change across the time periods.
Extreme and Persistent Short-Selling Activity
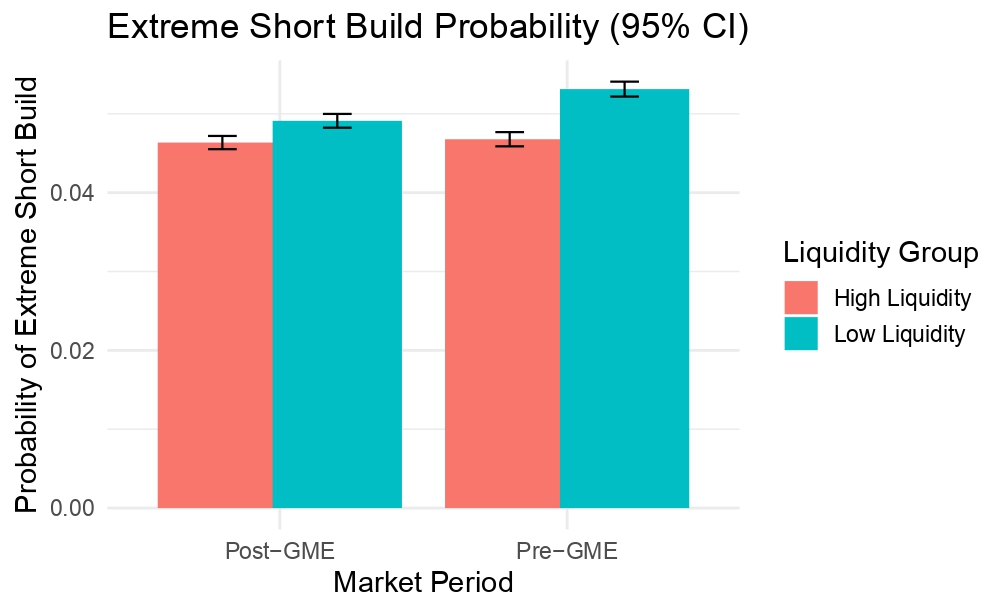
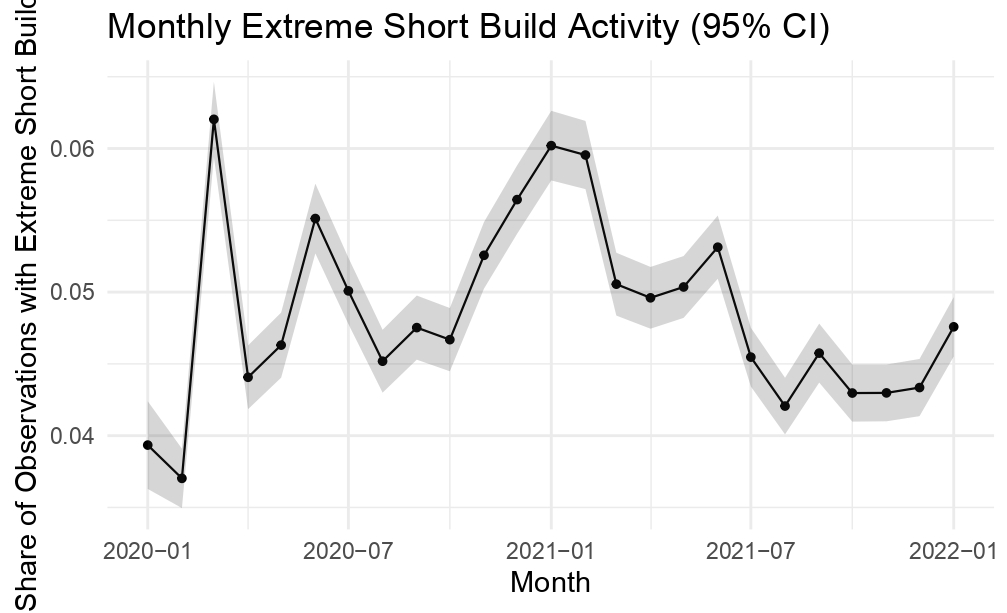
Extreme short-selling activity is constructed using a threshold defined by the 95th percentile of the pre-GME distribution. The share of extreme observations decreases slightly from around 5.2% in the pre-GME period to the post-GME period where it is about 4.8% (for high-liquidity stocks) and from 5.2% to 5.0% (for low-liquidity stocks). This slight reduction suggests a small decrease in high-intensity short-selling activity after the GME short squeeze and market disruption, although the magnitude is limited. At a higher frequency level, monthly extreme short builds demonstrate pronounced time variation over the sample period from Jan. 2020 to Jan. 2022. This shows pronounced spikes in the COVID-19 disruption in early 2020 and again during the January 2021 GameStop episode, followed by a gradual decline through 2021 and 2022. While short-selling intensity clearly varies over time, these fluctuations remain clearly aligned with broader volatility periods rather than an individual structural break.
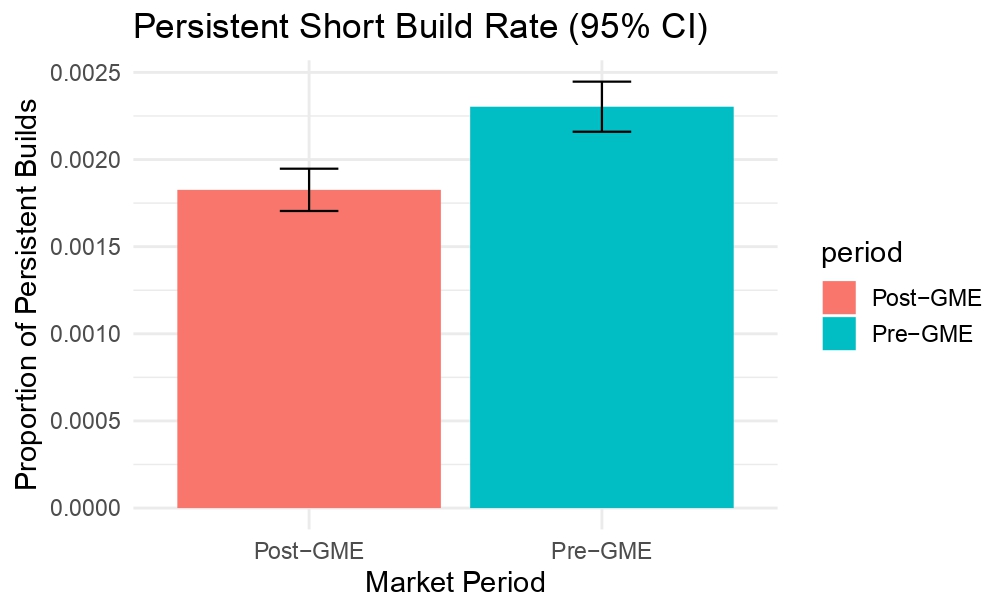
Persistent short-selling behavior exhibits a slight decline after the GME period. The proportion of persistent multi-day extreme short builds decreases from approximately 0.0022 (0.22%) in the pre-GME period to 0.0018 (18%) post-GME, demonstrating a small reduction in the frequency of consecutive days in which short-interest changes exceed the extreme threshold. The distribution stays highly concentrated through both time periods, with values close to zero. However, the post-GME period does show fewer occurrences of consecutive extreme observations. Through the sample, persistent events occur in under 1% of asset-days in both periods, making them extremely rare, although the relative frequency is lower in the period after 2021. Throughout the full time period, persistent short builds occur intermittently rather than continuously, with short clusters of extreme observations occurring in both time periods.
Distributional Characteristics of Short Interest Changes
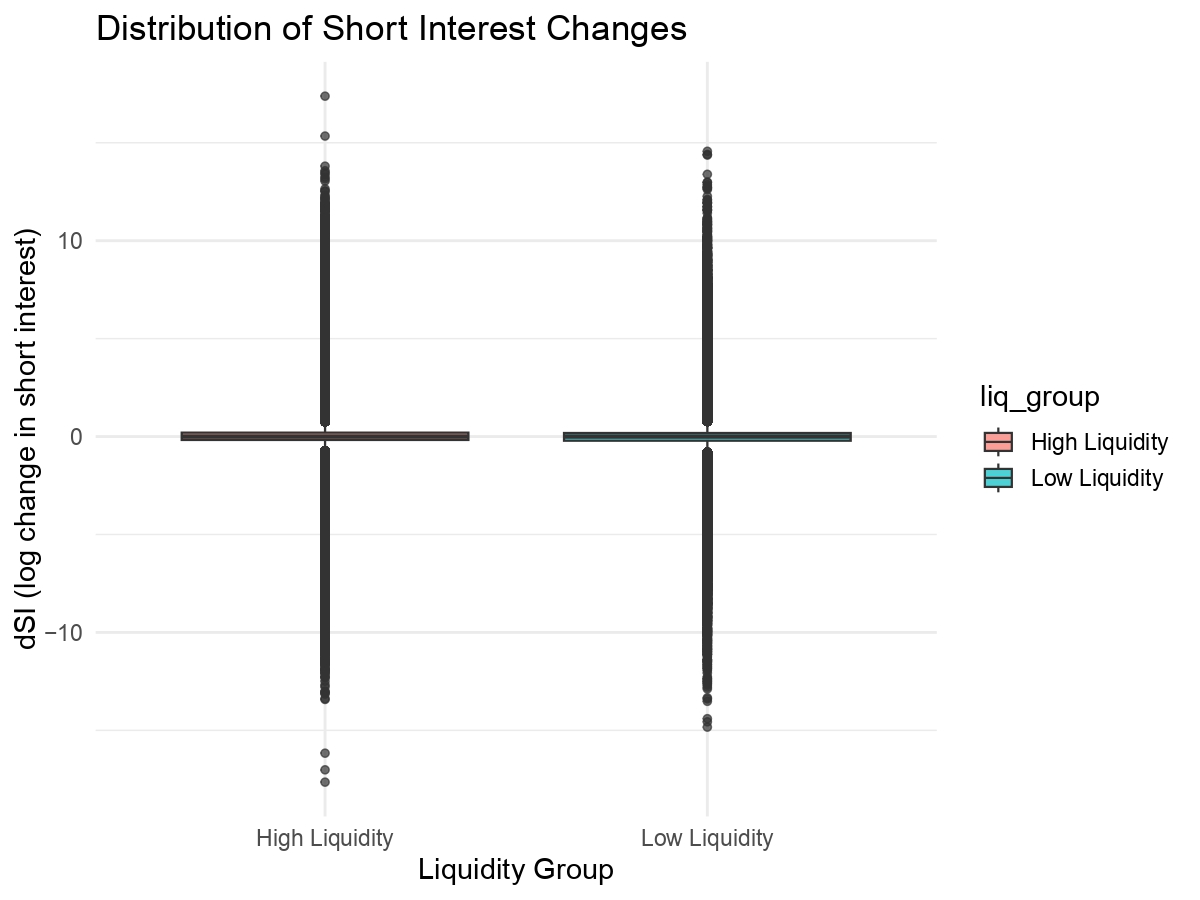
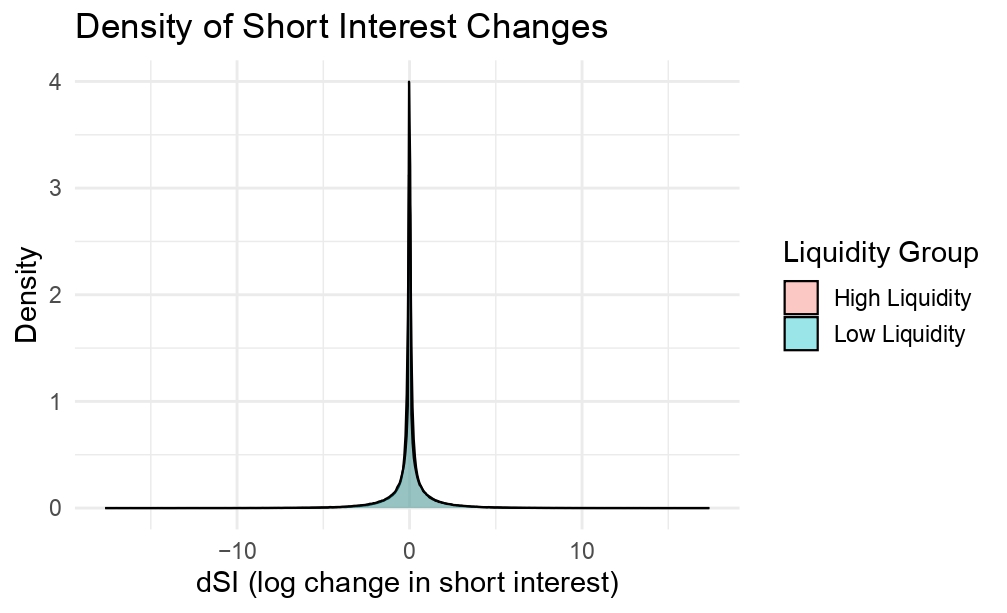
Boxplots present the distribution of daily short-interest changes for the pre- and post- GME periods. Both distributions are tightly centered around zero, and have very small interquartile ranges. However, both also show significant outliers going beyond +10 and lower than -14, indicating that the extreme short-interest adjustments occur irregularly although there are generally stable central tendencies. The distribution is therefore heavily influenced by tail events rather than daily variations. In kernel density estimates of dSI for both periods, the distribution peaks at zero and has long, thin tails on both sides suggesting pronounced leptokurtosis. Since there is substantial overlap between the pre- and post-GME density curves, they indicate that the overall distribution of short-interest changes remained significantly unchanged between the periods. To formally validate these distributional differences, non-parametric Wilcoxon rank-sum tests are conducted to compare high- and low-liquidity firms. The results strongly reject the null hypothesis of equal distributions for both dSI and |dSI| (p < 0.001), confirming statistically significant heterogeneity in short-selling behavior that is not visually apparent. Taken together, the descriptive results indicate that although short-selling activity demonstrates time variation in the frequency of extreme and persistent builds, overall distribution and intensity between the two periods stays highly consistent. The most notable difference occurs in the tails of the distribution rather than in the central tendencies, which suggests irregular changes in short-selling behavior rather than structural changes based on the GME event.
Discussion
This study has the aim of determining whether changes in market behavior occurred as an association of the January 2021 GameStop short squeeze event. Moreover, the study is focused on whether or not changes in the market after the GME event are more highly associated with pre-existing U.S. equity environments or the GME event itself. Based on the analysis, there is significant evidence that the changes after the GME event are associated with the underlying market characteristics and no significant evidence that there is relation to the post-GME indicator that the event itself is making the changes.
The observed sample indicates that market short-interest dynamics were generally stable when comparing the pre- and post-GME time periods. Hence, there is limited data showing adaptations of short-selling activity, and more so particularly not at the entire market level. As a result, the evidence does not show evidence that there was a direct market wide shift in the short selling strategies which were used by investors after the event, and fluctuations in short-interest were predominantly associated with position dynamics of investors and the prior market conditions.
These findings were developed based off of regression modeling results of the sample. Based on these results, there is a positive association of liquidity with the observed short-interest changes. Similarly, there is also a positive relation of days-to-cover and short interest across the model types. While these two are positive, lagged short interest and changes to short interest have a negative association, which indicates that there is mean reversion of short-position changes. Since the regression’s post-GME indicator is not statistically differentiable from being zero when controls of fixed effects are added, there is no evidence that the changes are associated with the GME event itself. Based on this, the differences found in between corresponding comparisons can majorly be attributed to cross-sectional market characteristics. Using the results of all the regression models, market liquidity, borrowing conditions, and existing short-position levels are the factors that are predominantly associated with short interest changes in specific. As the post-GME indicator is not statistically significant in the regression models observing this correlation, there are many other factors which could potentially explain observed associations and changes. One such rationale of this is that the way market participants respond to short positions after the GME could be related and in response to the liquidity conditions, securities-lending markets, and institutional risk-management. The shifts in short-selling activity could be due to external economic factors and conditions, including but not limited to changes of market volatility, borrowing costs, and margin requirements which were in place during the observed time period. Because this study utilized market-wide data rather than investor level data, this analysis is not able to differentiate between the specified mechanisms. Hence these hypotheses should not be considered as causal conclusions, but should instead be looked at as possible mechanisms.
A very limited evidence of the changes at the tails of short-selling activity can be gathered from the decline in extreme and persistent short builds. Additionally, since the magnitude of these changes is very small, they do not suggest that there was a broader-change at the market level in terms of behavior. Instead, the changes may have formed because the observed-GME effects could have been concentrated amongst a small subset of equities which were involved in higher volatility with visible clustering during these times. The clustering visibly formed during periods of overall market volatility, such as the COVID-19 shock which affected the market significantly. The shock appears to be closely corresponding to broader volatility patterns, rather than a structural shift as a result of the GME event.
An observable change after the GME event compared to the baseline effect is that persistent short builds happen at a lower frequency. Yet, the data should not be interpreted as a change in the overall market since the absolute and average changes are still stable at around the earlier values. It should instead be viewed as an adjustment in terms of the frequency of the most extreme observations. A possible rationale of this is that market participants may have shifted their approach to the management of severely concentrated short positions. However, this study cannot interpret whether the changes persisted beyond a subset of securities or was market-wide. Because the utilized dataset cannot observe this directly, taking into consideration the overall stability of the market, there is no evidence of a market-wide shift in the short-selling behavior.
The observations made from the regression results are further corroborated using distributional analysis. The distributions for short-interest changes for both pre- and post-GME stay centered around zero while having long tails and significant kurtosis. Furthermore, since there is a significant amount of overlap between the kernel density estimates from before and after the GME event, the distributions of short-interest changes were generally highly similar during the time periods. Hence, although certain individual stocks may have experienced disruptions following and associated with the GME event, these are not reflected at the market-wide level and generally the market changes are not associated with the GME event over the used observation period. Thus, although there were certain times of heightened volatility, at the generalized level short-selling activity was stable throughout the observed period. However, since the analyzed dataset only consisted of a two year period, with one year each before and after the event, these results should be considered as pertaining to the studied time period, not a long-term association with definitive proof.
The findings of several previous studies which have examined the impact of liquidity and other market frictions in terms of understanding short-selling behavior are in accordance with the results of this study. These identified borrowing constraints and liquidity as factors driving short-selling strategy and the decisions which are pursuant to the positive associations of liquidity and days-to-cover1. Furthermore, studies revealed that the stocks which were most significantly impacted and generally concentrated by the GME event were those which were already undergoing common liquidity shocks and escalated levels of volatility24. The interpretation of this study is supported by prior research in that the underlying market conditions are more highly responsible for the observed changes rather than a lasting market-wide change after the GME event.
However, some studies focusing on retail trading dynamics have found disparate results. When a specific type of market environment is established, amplifying feedback of securities-lending markets and short-selling demand can result in the effect of shocks intensifying25. A possible reason for this is that long-term short-selling activities could be driven by change in lending-market mechanisms. For instance, brokers may increase costs for investors to borrow shares and maintain short positions or require increased collateral for borrowing shares. However, when considering market level changes, this analysis doesn’t identify evidence of such persistent changes. Although the short-term and stock-specific patterns correspond, when market characteristics and controls are included, the post-GME indicator value does not remain statistically significant for a shift in market-wide short interest changes. Accordingly, retail-driven trading shocks or securities-lending feedback could potentially be concentrated in individual securities instead of a market-wide structural change.
Limitations of the Study and Future Research
When interpreting the results of this study, multiple limitations should also be recognized which could have had an effect towards the results and conclusions. One such limitation is that only the total short positions across reporting firms are included, not interest-specific holdings. Because of this characteristic of the data sample, the analysis is not able to differentiate between hedge funds, market makers, broker-dealters, and in general which specific institutional participant is contributing to the behavior. So, the analysis must be applied as a market-level characteristic of short-selling behavior rather than to specific participants or a specific group. Another limitation of the study is that the observations are reported at a bi-weekly basis, not continuously. Due to this, there could be reporting lags in the analysis since temporary position changes may not be recorded in the analysis. This would reduce the value and impact that short-term changes would have when observing the short-selling behavior. Additionally, minor factors which could define how short-selling behavior is characterized are not seen in the data. This could include borrowing costs, individual risk-management decisions, or securities-lending exchanges. Finally, a very short time period is used to observe the changes, only one year before and after the event. This may not be sufficient to observe long term changes and potentially would not be able to differentiate from short-term changes. The analysis is also not able to differentiate from general market event effects, such as the COVID-19 recovery, general changes in policy, and market volatility. Finally, there are several time-varying factors other than those used in this study which could define short-selling behavior and the activity. For example, this could be borrowing costs, securities-lending availability, margin requirements changes, shifts in retail trading participation, or institutional leverage limitations. These all may potentially be factors which were not observed in the study but could have had an impact on the short-selling behavior and activity.
Future studies could expand on this study by analyzing short-selling behavior depending on industry, hedge-fund specific data, or studies comparing different market types rather than only U.S. Equities Market. Using a more specific dataset would allow for the understanding of whether differences were limited to a few extreme stocks or the U.S. Equities Market as a whole. Finally, further research could also explain if the trends observed after the GME event are also generally observed during other times of market volatility and disruption.
Conclusion
Based on the results of this study, short-selling behavior in the U.S. Equity Markets did not change significantly following the January 2021 GameStop event. The behavior generally remained at consistent values between both the periods. The results do not indicate a structural shift following the GME event in terms of the short-interest changes once the time-fixed effects and firm characteristics are controlled for. Rather than the post-GME indicator, the short-selling behavior changes are associated with liquidity conditions, lagged short-interest, and short-selling constraints including the days-to-cover value. The observed changes are relatively small in terms of strength and are generally contained to observed time periods of increased market volatility. Generally, the extreme changes are only seen in certain extreme values of the dataset, not general changes associated with the market wide activity. Overall, based on the results, short-selling behavior after the GME event is associated with underlying and pre-existing market characteristics and position adjustments. This is broadly consistent other than for short-term variations during elevated volatility periods. In future studies, analyses could use more granular data with a higher frequency or investor group data to further differentiate the changes in institutional strategy and decision-making or if it is predominantly associated with the underlying market characteristics.
Acknowledgements
I would like to express my sincere gratitude towards Dr. Vivek Nandur for his vital guidance throughout this study. His thoughtful feedback played a crucial role in shaping the analytical framework and interpretation of results. Dr. Nandur consistently challenged me to deepen my methodology, strengthen research aims, and approach the question with greater precision.
References
- Saffi, P. A., & Sigurdsson, K. (2011). Price efficiency and short-selling constraints: Evidence from the loan market. Review of Financial Studies, 24(8), 2700–2742. https://doi.org/10.1093/rfs/hhr041. [↩] [↩]
- Andreev, B., Sermpinis, G., & Stasinakis, C. (2022). Modelling financial markets during times of extreme volatility: Evidence from the GameStop short squeeze. Forecasting, 4(3), 35. https://doi.org/10.3390/forecast4030035. [↩]
- Barber, B. M., Huang, X., Odean, T., & Schwarz, C. (2021). Attention-induced trading surges and liquidity disruptions by retail investors. Journal of Finance, 76(6), 2821–2865. https://doi.org/10.1111/jofi.13074. [↩]
- Hilliard, J. E., & Hilliard, J. (2023). The GameStop short squeeze: Put–call parity and the effect of frictions before, during and after the squeeze. Journal of Futures Markets, 43(5), 635–661. https://doi.org/10.1002/fut.22405. [↩]
- Jones, C. M., Reed, A. V., & Waller, W. (2021). Short-sale constraints, stock borrowing costs, and the 2021 meme stock squeeze. Review of Asset Pricing Studies, 11(4), 812–845. https://doi.org/10.1093/raps/raab014. [↩]
- Battalio, R., & Li, O. (2021). Options market microstructure during the GameStop squeeze: Gamma trading and retail flows. Journal of Financial Markets, 55, 100683. https://doi.org/10.1016/j.finmar.2021.100683. [↩]
- Barardehi, Y., Bird, A., Karolyi, S. A., & Ruchti, T. (2024). Are short-selling restrictions effective? Management Science, 71(5), 3829–3851. https://doi.org/10.1287/mnsc.2024.4987. [↩]
- Duterme, T. (2023). Bloomberg and the GameStop saga: The fear of stock market democracy. Economy and Society, 52(3), 373–398. https://doi.org/10.1080/03085147.2023.2189819. [↩]
- Damodaran, A. (2021). Valuation in the face of narratives: The case of GameStop and corporate life cycles. Journal of Applied Corporate Finance, 33(2), 42–55. https://doi.org/10.1111/jacf.12453. [↩]
- Valenzuela, M., & Zer, I. (2022). When limits to arbitrage bind: Capital constraints and margin risks in volatile markets. Journal of Banking & Finance, 142, 106540. https://doi.org/10.1016/j.jbankfin.2022.106540. [↩]
- Chodraou, J., & Crotty, K. (2023). Market infrastructure under stress: Clearinghouse margin requirements during the meme stock episode. Journal of Financial Stability, 67, Article 101142. https://doi.org/10.1016/j.jfs.2023.101142. [↩]
- Mancini, A., Desiderio, A., Di Clemente, R., & Cimini, G. (2022). Self-induced consensus of Reddit users to characterise the GameStop short squeeze. Scientific Reports, 12(1), 13780. https://doi.org/10.1038/s41598-022-17925-2. [↩]
- Costola, M., Iacopini, M., & Santagiustina, C. R. (2021). On the relationship between online visibility, social media sentiment, and meme stock trading volumes. Economics Letters, 208, 110066. https://doi.org/10.1016/j.econlet.2021.110066. [↩]
- Pedersen, L. H. (2022). Game on: Social networks, meme stocks, and predatory herding. Journal of Financial Economics, 146(3), 883–905. https://doi.org/10.1016/j.jfineco.2022.08.007. [↩]
- Kim, K., Lee, S. T., & Kauffman, R. J. (2023). Social informedness and investor sentiment in the GameStop short squeeze. Electronic Markets, 33(1), 23. https://doi.org/10.1007/s12525-023-00632-9. [↩]
- Betzer, A., & Harries, J. P. (2022). How online discussion board activity affects stock trading: The case of GameStop. Financial Markets and Portfolio Management, 36(4), 443–472. https://doi.org/10.1007/s11408-022-00407-w. [↩]
- Lyócsa, Š., Baumöhl, E., & Výrost, T. (2021). Yoloing GameStop: Stock market anomalies, high-frequency order-flow imbalances, and Reddit activity. Finance Research Letters, 43, 102021. https://doi.org/10.1016/j.frl.2021.102021. [↩]
- Eaton, G. W., Green, T. C., Roseman, B. S., & Wu, Y. (2022). Retail trader sophistication and stock market quality: Evidence from brokerage outages. Journal of Financial Economics, 146(2), 502-528. https://doi.org/10.1016/j.jfineco.2022.07.019. [↩]
- Shkilko, A. (2022). Crowded shorts and institutional vulnerabilities: Evidence from the drawdowns of early 2021. Journal of Financial and Quantitative Analysis, 57(7), 2541–2569. https://doi.org/10.1017/S002210902200084X. [↩]
- Semenova, V., & Winkler, J. (2021). Limits to arbitrage and tail-risk exposure during coordinated retail short squeezes. Journal of Portfolio Management, 48(2), 115–132. https://doi.org/10.3905/jpm.2021.1.309. [↩]
- Jank, S., Roling, C., & Smajlbegovic, E. (2021). Flying under the radar: The effects of short-sale disclosure rules on investor behavior and stock prices. Journal of Financial Economics, 139(1), 209-233. https://doi.org/10.1016/j.jfineco.2020.07.019. [↩]
- Allen, F., Haas, M., Pirovano, M., & Tengulov, A. (2025). How prevalent are short squeezes? Evidence from the US and Europe. Journal of Banking & Finance, 176, 107300. https://doi.org/10.1016/j.jbankfin.2024.107300. [↩]
- Boehmer, E., Jones, C. M., Zhang, J., & Zhang, X. (2021). Tracking retail investor activity. The Journal of Finance, 76(5), 2249-2305. https://doi.org/10.1111/jofi.13033. [↩]
- Umar, Z., Gubareva, M., & Teplova, T. (2021). The GameStop episode and its market-wide common liquidity shocks. International Review of Financial Analysis, 78, 101918. https://doi.org/10.1016/j.irfa.2021.101918. [↩]
- Gârleanu, N., Panageas, S., & Zheng, J. (2026). Securities-lending feedback loops and structural changes in short-selling demand. Review of Financial Studies, 39(2), 412–448. https://doi.org/10.1093/rfs/hhae089. [↩]