Abstract
Background: Modern diagnosis of psychiatric disorders often includes subjective techniques across clinicians, such as interviews and the self-reporting of symptoms, which yield inconsistent results. However, Electroencephalography (EEG) can complement these current methods, offering a non-invasive and standardized measurement of biological signals. This study evaluates the accuracy of deep learning models in classification of psychiatric conditions when applied to short, resting state EEG. Additionally, it examines how age differences in subjects can affect the performance of these models.
Methods: The data used for this study is from the TDBRAIN dataset. Four subject groups are used: OCD, MDD, ADHD, and healthy controls, with up to 75 subjects per group. Eyes-closed resting-state EEG (26 channels at 250 hz) was bandpass filtered at 0.5-45 hz, before being cut into 2-second windows and normalized. The deep learning models were trained and evaluated on four tasks. They were also evaluated using 5-fold cross-validation and leave-one-subject-out (LOSO) testing.
Findings: Accuracy was measured using mean ROC-AUC values and was above chance for all five models, with means of 0.610 for Task 1 (OCD vs. Healthy), 0.647 for Task 2 (MDD vs. Healthy), 0.679 for Task 3(ADHD vs. Healthy), and 0.635 for Task 4 (OCD vs. MDD, age-matched). The best single-model AUCs were found to be 0.635 for Task 1 (EEGNet), 0.687 for Task 2 (EEG-Conformer), 0.718 for Task 3 (EEG-Conformer), and 0.657 for Task 4 (Deep4Net). The LOSO ensemble balanced accuracy ranged from 76.7% to 87.2%.
Conclusions: The study finds that deep learning applied to resting-state EEG can classify psychiatric diagnoses above chance. The asymmetric error pattern for Task 4 suggests a more consistent EEG signature for MDD than OCD, and illustrates the value of age-matched comparison when recruitment cohorts differ demographically.
Keywords: EEG, deep learning, psychiatric classification, OCD, MDD, ADHD, TDBRAIN, biomarkers
Introduction
Background and Context: Mental disorders are a large problem in our society. In terms of disability, they account for around 15% of global years lived1. Specifically, Attention-Deficit/Hyperactivity disorder (ADHD) affects about 7-10% of minors and 2-5% of adults2. Major Depressive Disorder (MDD) annually impacts over 8% of the population3. Obsessive-Compulsive Disorder (OCD) impacts around 2-3% of the population4, and can negatively impact executive function, cognitive flexibility, and response inhibition5. Since the diagnosis of mental disorders is dependent on observation, interviews, and self-reporting surveys6, it is vulnerable to subjectivity and inconsistency between different clinicians. A large DSM-5 reliability study7 found that out of twenty-three diagnoses, only five were categorized as “very good”, nine were “good”, six were “questionable”, and three were “unacceptable”. Evidently, modern diagnoses of psychiatric disorders are variable and subjective.
Problem Statement and Rationale: EEG is a noninvasive method of recording brain waves. It captures neural electrical activity with millisecond precision, revealing measurable biological signals. EEG signal patterns have been identified for a number of mental disorders. For example, asymmetry in frontal alpha brainwaves is characteristic of depression8; an elevated theta wave coherence is typical of OCD9; and reduced beta wave power is associated with ADHD10. Many prior studies, however, manually choose frequency features, and use single-disorder designs. This limits their generalizability across multiple mental conditions. Alternatively, deep learning automatically learns patterns from the raw EEG data.
Literature review: Deep learning is more and more often being applied to resting-state EEG data in order to psychiatrically categorize data. Table 1b describes the methodologies, subject counts, and frameworks for multiple previous studies. Wu et al. (2021) reports an AUC of 0.75, using a deep network across a multi-site cohort (N=400)11. Jan et al. (2022) used sparse electrode configurations on resting-state samples, validating about chance accuracies12. ADHD research has additionally yielded accuracy of near 0.75 within clinical EEG repositories. Comprehensive multi-disorder assessments remain relatively scarce; notably, Gour et al. (2023) utilized transformer architectures on the TDBRAIN archive13 for multi-class discrimination14.
However, their framework prioritized a single multi-label task over discrete binary comparisons and lacked systematic demographic adjustment. In contrast, this study rigorously evaluates five modern architectures—EEGNet, ShallowConvNet, Deep4Net, EEG-Conformer, and EEGTCNet—across four binary tasks on the TDBRAIN dataset13. By employing grouped cross-validation and LOSO ensembles, with age-matching applied where recruitment cohorts differ demographically, this work seeks to isolate disorder-specific neural signatures from participant-level demographic artifacts where possible.
Significance and Purpose: This study addresses two key gaps: (i) the reliance on manually selected signal features that may miss disorder-specific network dynamics; and (ii) the predominance of single-disorder paradigms that prevent cross-diagnostic generalizability assessments. Within this multi-disorder framework, age-matched comparisons are used where cohort overlap permits, to reduce the risk that demographic differences between recruitment cohorts inflate apparent classification performance. An accurate, objective, and timely psychiatric diagnosis is essential to reduce the individual and societal burden of these conditions.
Objectives: The objective of this study is to apply a standardized, reproducible preprocessing pipeline to the large, publicly available TDBRAIN clinical EEG dataset13. This study tests five EEG-specific deep learning architectures on four binary classification tasks of mental disorders: OCD vs. Healthy (Task 1), MDD vs. Healthy (Task 2), ADHD vs. Healthy (Task 3), and OCD vs. MDD (Task 4). Using both 5-fold grouped cross-validation and a Leave-One-Subject-Out (LOSO) ensemble approach, it evaluates the generalizability of each model. Finally, this study evaluates whether classification between two disorders, particularly OCD and MDD, is affected by demographic differences rather than disorder-specific biomarkers.
Unique Contribution: To our knowledge, this is the first cross-disorder deep learning classification study on the TDBRAIN dataset which benchmarks five architectures across four binary psychiatric tasks. Age-based demographic confound control was applied to the OCD vs. MDD comparison while age differences were quantified and reported for all four tasks. By doing so, this work provides a methodological framework for ensuring identified brainwave patterns are disorder-specific rather than artifacts of participant characteristics.
Methodology
Research Design: This study applies a supervised binary classification framework to resting-state EEG data, examining four tasks: (Task 1) OCD vs. Healthy, (Task 2) MDD vs. Healthy, (Task 3) ADHD vs. Healthy, and (Task 4) OCD vs. MDD. For Task 4, both unmatched and age-matched cohorts were analyzed to quantify the demographic confound. The overall preprocessing procedure is described as follows: raw EEG data → bandpass filtering + resampling → 2-second windowing and normalization → artifact rejection → model training (5-fold grouped cross-validation) → LOSO ensemble evaluation.
Participants and Data Source: This study used the Two Decades Brainclinics Research Archive for Insights in Neurophysiology (TDBRAIN), a public, standardized dataset of resting-state EEG recordings from 1,274 clinical outpatients collected between 2001 and 2021. For each binary classification task, participants were drawn from TDBRAIN diagnostic categories and capped at 75 per class. Following preprocessing with TDBRAIN’s official pipeline, the final cohorts included 38 participants with OCD (Tasks 1 and 4), 75 with MDD (Task 2), 75 with ADHD (Task 3), and 47 healthy controls (Tasks 1–3). The resulting total sample sizes were N=85 for Task 1, N=122 for Task 2, N=122 for Task 3, and N=72 for Task 4. Age distributions were compared across clinical and control cohorts, and the results and demographic procedures are summarized in Table 1a. Although Task 1 showed no meaningful age difference between the OCD and control cohorts, Tasks 2 and 3 showed substantial age imbalances. Accordingly, performance in Tasks 2 and 3 should be interpreted as group separability that may include an age-related component rather than disorder-specific classification alone. In contrast, Task 4 used propensity-score matching to reduce the substantial age disparity between the OCD and MDD cohorts, yielding an age-overlapping, class-balanced sample of 36 OCD and 36 MDD participants after automated signal-quality assessment.
| Task | Comparison | Cohort Age Information | Age Difference | Interpretation | Procedure |
| 1 | OCD vs. Healthy | OCD: 32.5 ± 9.9; Healthy: 32.2 ± 13.7 | d = 0.028 p = 0.90 | No significant age difference observed. | No age-matching performed |
| 2 | MDD vs. Healthy | MDD: 43.4 ± 13.2; Healthy: 32.2 ± 13.7 | d = 0.846 p < 0.001 | MDD cohort significantly older than Healthy cohort | No age-matching performed |
| 3 | ADHD vs. Healthy | ADHD: 22.8 ± 13.4; Healthy: 32.2 ± 13.7 | d = 0.697 p < 0.001 | ADHD cohort significantly younger than Healthy cohort | No age-matching performed |
| 4 | OCD vs. MDD | Shared retained age range: 17.4–58.3 years. | d = 0.678 p < 0.001 | OCD cohort was significantly younger than MDD cohort | Propensity-score age matching was applied. Only participants within 17.4–58.3 years were retained |
| Task | Group 1 | N | Group 2 | N |
| Task 1: OCD vs. Healthy | OCD | 38 | Healthy | 47 |
| Task 2: MDD vs. Healthy | MDD | 75 | Healthy | 47 |
| Task 3: ADHD vs. Healthy | ADHD | 75 | Healthy | 47 |
| Task 4: OCD vs. MDD (age-matched) | OCD | 36 | MDD | 36 |
Preprocessing: Raw EEG data were processed using MNE-Python15. Recordings were bandpass-filtered (0.5–45 Hz) to remove high-frequency noise and slow drifts, and segmented into non-overlapping 2-second windows, with 500 samples per window. This is consistent with prior work showing 2-second windows yield reliable EEG connectivity metrics16. All 26 channels were retained. Each of the two second windows were z-score normalized (μ = 0, σ = 1) and treated as a single sample. Artifacts with an amplitude above 200 µV were excluded. This is consistent with previous practice to reject blinking, muscle bursts, or electrode movement as artifacts17. ICA was not applied, as the goal of these classification tasks is to exclude grossly contaminated segments rather than isolate specific artifact components. Across tasks, this step reduced available windows by approximately 5–15% per subject.
Model Architectures: Five architectures were evaluated and are summarized in Table 2.
EEGNet: A compact convolutional network that detects short electrode-level activity bursts, designed for cross-task EEG generalization.
ShallowConvNet: A two-layer network (~35,362 parameters) that extracts spectral band power features (alpha, theta, beta) by filtering over time then pooling across electrodes.
Deep4Net: A four-layer hierarchical network (~276,427 parameters) that builds from simple waveforms to complex multi-electrode patterns, well-suited to broad spectral shifts across the brain.
EEG-Conformer: A hybrid network (~447,746 parameters) combining a local CNN encoder with multi-head self-attention to capture both short-burst and long-range temporal dependencies within each 2-second window.
EEGTCNet: A compact network (~4,138 parameters) extending EEGNet with a stacked temporal convolution module to capture longer within-window patterns while remaining suitable for wearable deployment.
| Architecture | Reference | Parameters (approx.) | Key Features |
| EEGNet | Lawhern et al., 201818 | ~1,938 | Compact, cross-task generalization |
| ShallowConvNet | Schirrmeister et al., 201719 | ~35,362 | Interpretable spectral filtering |
| Deep4Net | Schirrmeister et al., 201719 | ~276,427 | Hierarchical feature learning |
| EEG-Conformer | Song et al., 202320 | ~447,746 | CNN + multi-head self-attention; integrates long-range temporal dependencies; attention weights interpretable as temporal relevance maps |
| EEGTCNet | Ingolfsson et al., 202021 | ~4,138 | Extended temporal context, efficient |
Training: All models were trained using binary cross-entropy loss with the Adam optimiser22 — a standard algorithm that adjusts model settings step-by-step during training — (learning rate = 1 × 10⁻³, weight decay = 1 × 10⁻⁴), with a gradually decreasing learning rate schedule preceded by a 5-step warm-up. For Task 1, Deep4Net used a task-specific learning rate of 5 × 10⁻⁴ and weight decay of 1 × 10⁻³. A minimum of 10 training epochs were implemented, using a batch size of 64. Based on validation performance, early stopping was implemented, retaining the best-epoch checkpoint. To account for uneven representation in 2-second windows, greater importance was given to rarer classes using inverse-frequency class weights applied to the loss function ( , so rarer classes receive proportionally more influence on learning). Task 2 and Task 3 required the largest correction (weight ratio ~1.6:1, Healthy being the minority class), while Task 1 was near-balanced (weight ratio ~1.24:1). Parameters were derived from original source literature and used consistently across all evaluations. To preserve benchmark integrity, systematic hyperparameter optimization wasn’t performed.
The one exception was Deep4Net during Task 1, which needed specialized adjustment of the learning rate (5×10⁻⁴) and weight decay (1×10⁻³) to account for training volatility identified via loss curve inspection across a limited number of manually selected configurations. Optimization across all architectures included an early stopping protocol (patience = 10 epochs), which retained the highest-performing validation checkpoint per fold. The comprehensive suite of final settings is detailed in Table 2b.
| Hyperparameter | Value |
| Optimizer | Adam |
| Learning rate | 1×10⁻³ (5×10⁻⁴ for Deep4Net, Task 1 only) |
| Weight decay | 1×10⁻⁴ (1×10⁻³ for Deep4Net, Task 1 only) |
| Batch size | 64 |
| LR schedule | Cosine decay + 5-step warmup |
| Early stopping patience | 10 epochs |
| Min epochs | 10 |
| Loss function | Binary cross-entropy |
| Class weighting | Inverse frequency |
Evaluation Protocol: 5-fold grouped cross-validation, or GroupKFold, was used to split the 2-second windows of data such that windows from one subject appear only in one fold. This prevents data leakage which might lead to inaccurate results. The metric of cross-validation was primarily the mean ROC-AUC across folds. For the LOSO ensemble, models trained on all remaining subjects generated a probability estimate for each held-out subject, with the final prediction using a soft-vote between EEGTCNet and EEG-Conformer. Balanced accuracy (mean recall across classes) is the primary LOSO metric, as it is robust to class-size differences and prevents inflated scores when one class dominates — particularly relevant for Task 1 where the Healthy-to-OCD window ratio is 1.69:1 even after loss reweighting.
Demographic Confound Analysis and Age Matching: There is a statistically significant age difference (d = 0.678, p < 0.001) between subjects in the OCD cohort (mean age 34.2 ± 12.1) and the MDD cohort (mean age 42.9 ± 13.1). Since age influences resting-state EEG spectra, models trained on unmatched cohorts could learn age-related features rather than disorder-specific features. Using propensity-score matching, only those individuals in the common age range (17.4-58.3 years) are selected from both cohorts with downsampling of the larger cohort. In total, N = 36 OCD and N = 36 MDD are selected for Task 4.
Reproducibility: Python 3.10 on Google Colaboratory (Ubuntu, NVIDIA L4 GPU with 24 GB VRAM) performed the computational analysis. Automatic mixed precision (AMP) was enabled during training. Software versions: PyTorch 2.11.0 (CUDA 12.8), BrainDecode 1.8.1, MNE-Python 1.12.1, scikit-learn 1.6.1, NumPy 2.1.3, and SciPy 1.16.3. To support reproducibility, a fixed random seed (42) was set across NumPy, PyTorch, and Python’s random module; cuDNN deterministic mode was enabled (torch.backends.cudnn.deterministic = True). GroupKFold splitting is deterministic by construction and does not depend on the seed. Total training time on the NVIDIA L4 across all four tasks was: EEGNet 6.1 min, ShallowConvNet 3.6 min, Deep4Net 5.7 min, EEG-Conformer 14.6 min, and EEGTCNet 7.0 min, for 37.1 min of cross-validation compute in total. The complete pipeline code and configuration files are publicly available at [https://github.com/aashnikatari/eeg_classification]. The TDBRAIN dataset is available at [https://brainclinics.com/resources/tdbrain-dataset].
Ethical Considerations: This study used exclusively anonymized, publicly available data from the TDBRAIN archive13. No new participants were recruited, and no additional ethical consent was required beyond standard academic use of the dataset. All subject identifiers were handled in accordance with the BIDS-format data standards.
Results
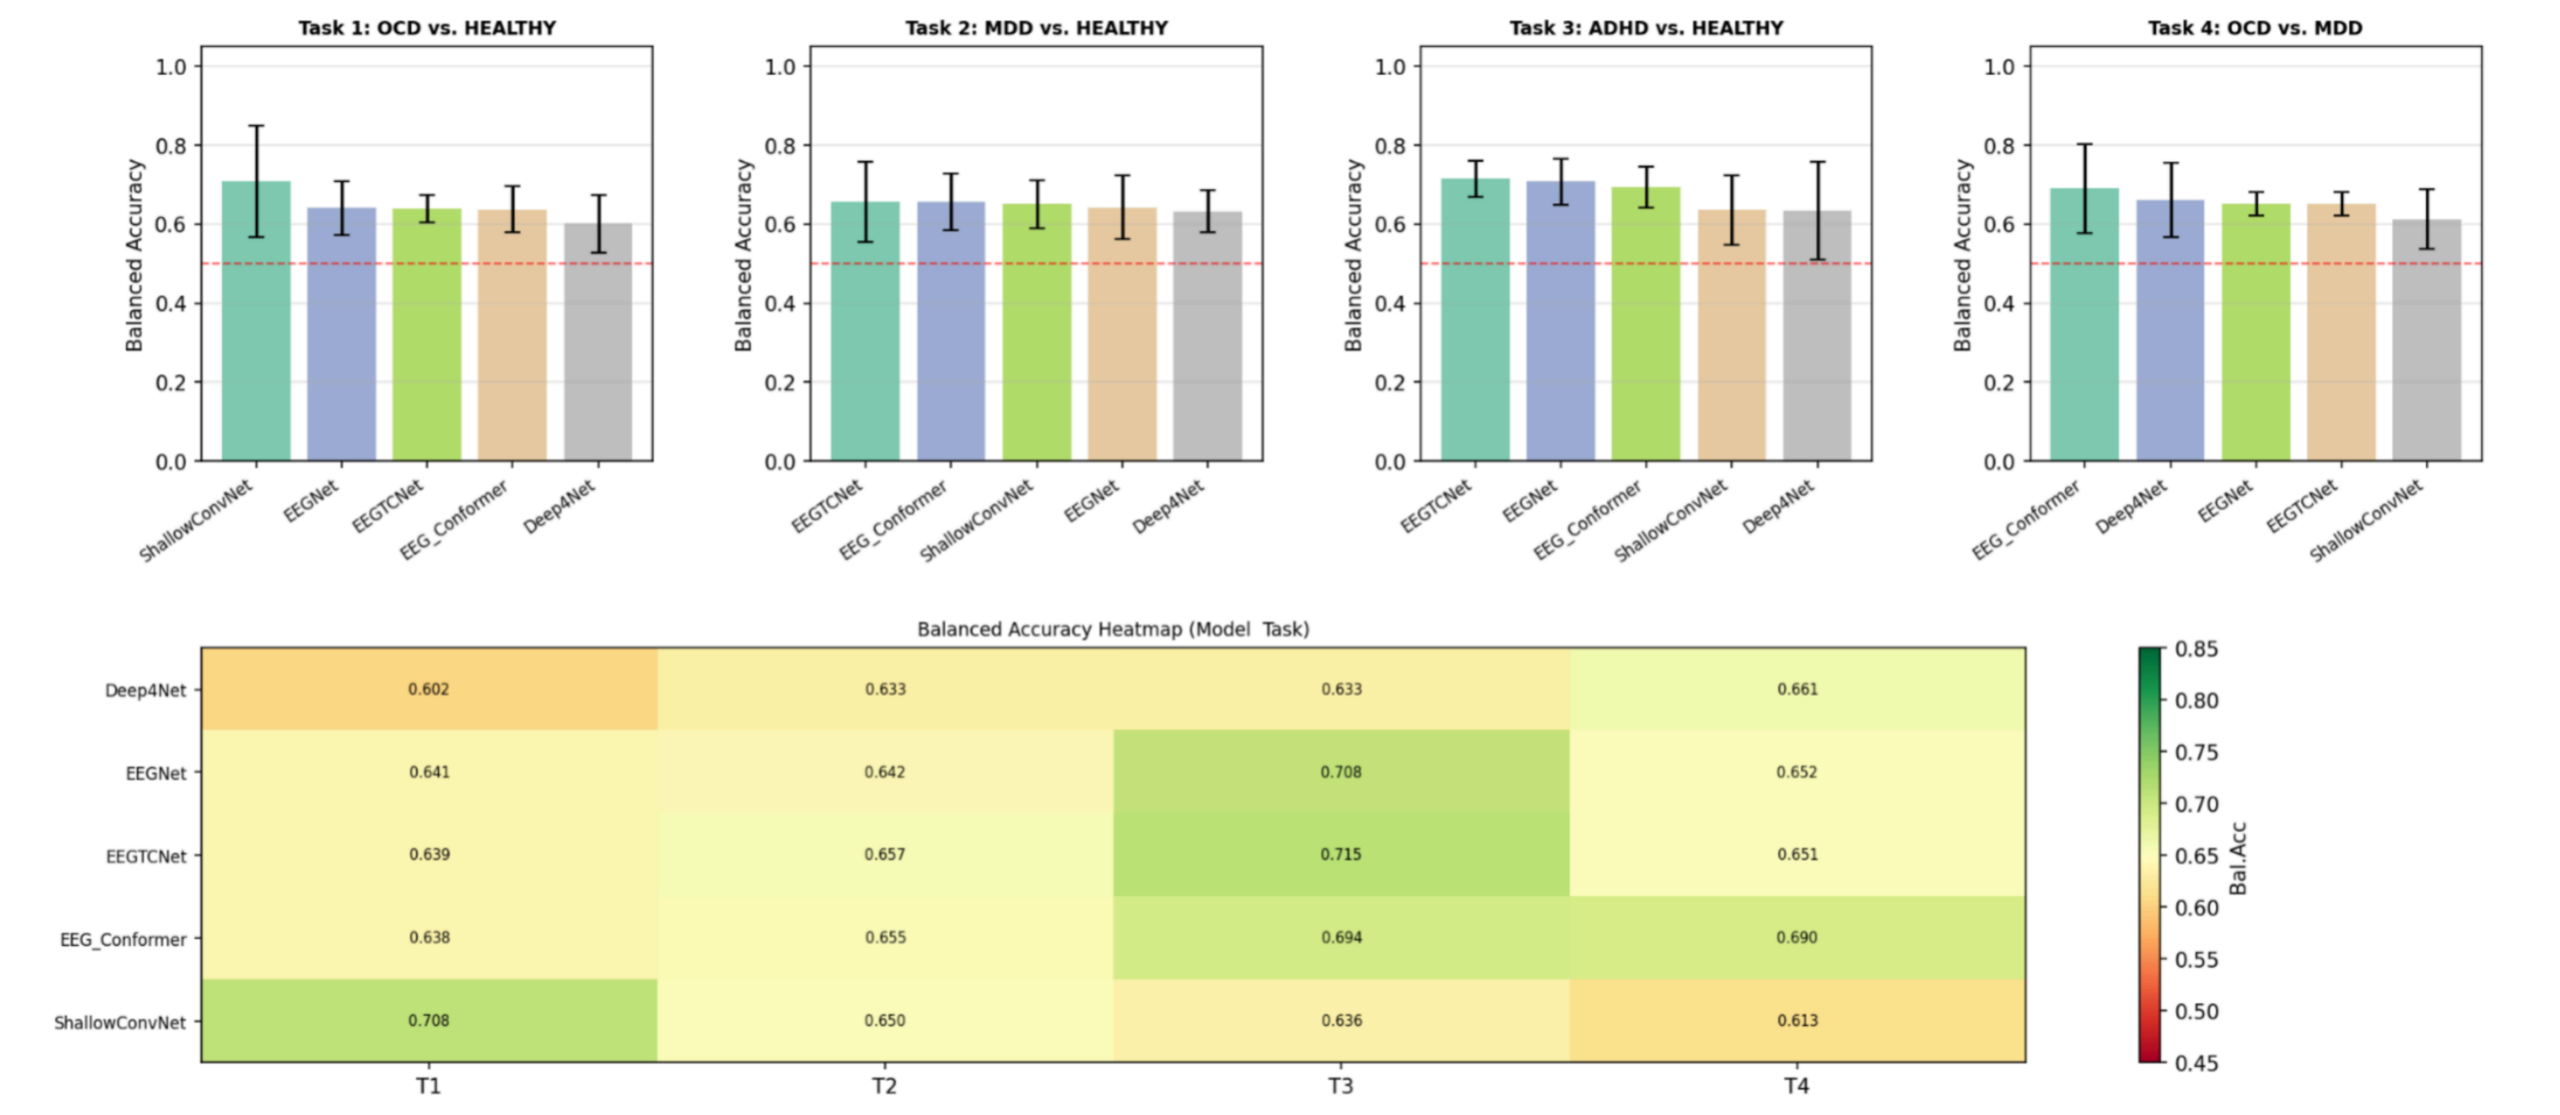
Cross Validation Results: The four binary classification tasks performed significantly above chance level (mean balanced accuracy > 0.50) in all models (Table 3), showing that the full-frequency Eye-Closed resting-state EEG carry relevant diagnostic features. The highest performance was attained for ADHD vs Healthy (Task 3, mean balanced accuracy 0.677 ± 0.040), followed by OCD vs MDD task (Task 4, mean 0.653 ± 0.028), MDD vs Healthy (Task 2, mean 0.647 ± 0.010) and OCD vs Healthy (Task 1, mean 0.646 ± 0.038). Despite having a smaller dataset (N=36 OCD / 36 MDD after quality control of pre-processing), the age-matched condition performed above chance, with EEG-Conformer performing best on Task 4 (0.690; 95% CI: 0.474 — 0.759).
| Model | Task 1 OCD vs. Healthy (N=38/47) | Task 2 MDD vs. Healthy (N=75/47) | Task 3 ADHD vs. Healthy (N=75/47) | Task 4 OCD vs. MDD (age-matched, N=36/36) |
| Bal. Acc (95% CI)/ AUC | Bal. Acc (95% CI)/ AUC | Bal. Acc (95% CI)/ AUC | Bal. Acc (95% CI)/ AUC | |
| EEGNet | 0.641 (0.548–0.722)/0.635 | 0.642 (0.519–0.689)/0.604 | 0.708 (0.578–0.818)/0.698 | 0.652 (0.450–0.826)/0.638 |
| ShallowConvNet | 0.708 (0.465–0.785)/0.625 | 0.650 (0.535–0.751)/0.643 | 0.636 (0.441–0.761)/0.601 | 0.613(0.397–0.834)/0.616 |
| Deep4Net | 0.602 (0.485-0.677)/0.581 | 0.633(0.528–0.772) /0.650 | 0.633 (0.610–0.792) /0.701 | 0.661(0.483–0.831) / 0.657 |
| EEG-Conformer | 0.638 (0.519–0.691) / 0.605 | 0.655 (0.528-0.772) / 0.687 | 0.694 (0.605-0.831)/0.718 | 0.690 (0.474-0.759)/0.616 |
| EEGTCNet | 0.639 (0.519-0.689)/0.604 | 0.657 (0.528-0.728)/0.650 | 0.715 (0.592-0.766)/0.679 | 0.651 (0.528-0.767)/0.647 |
| Mean Bal. Acc (SD) | 0.646 (±0.038) | 0.647 (±0.010) | 0.677 (±0.040) | 0.653 (±0.028) |
| Mean AUC (SD) | 0.610 (±0.019) | 0.647 (±0.026) | 0.679 (±0.041) | 0.635 (±0.016) |
Note: For Task 4, samples were age-matched (OCD = 36, MDD = 36 after preprocessing quality control). The 95% CIs were calculated using a 9,999-iteration bootstrap procedure for per-fold balanced accuracy. The mean row gives the mean per metric across models; SD is the standard deviation across the five models.
Learning Curves and Sample-Size Adequacy
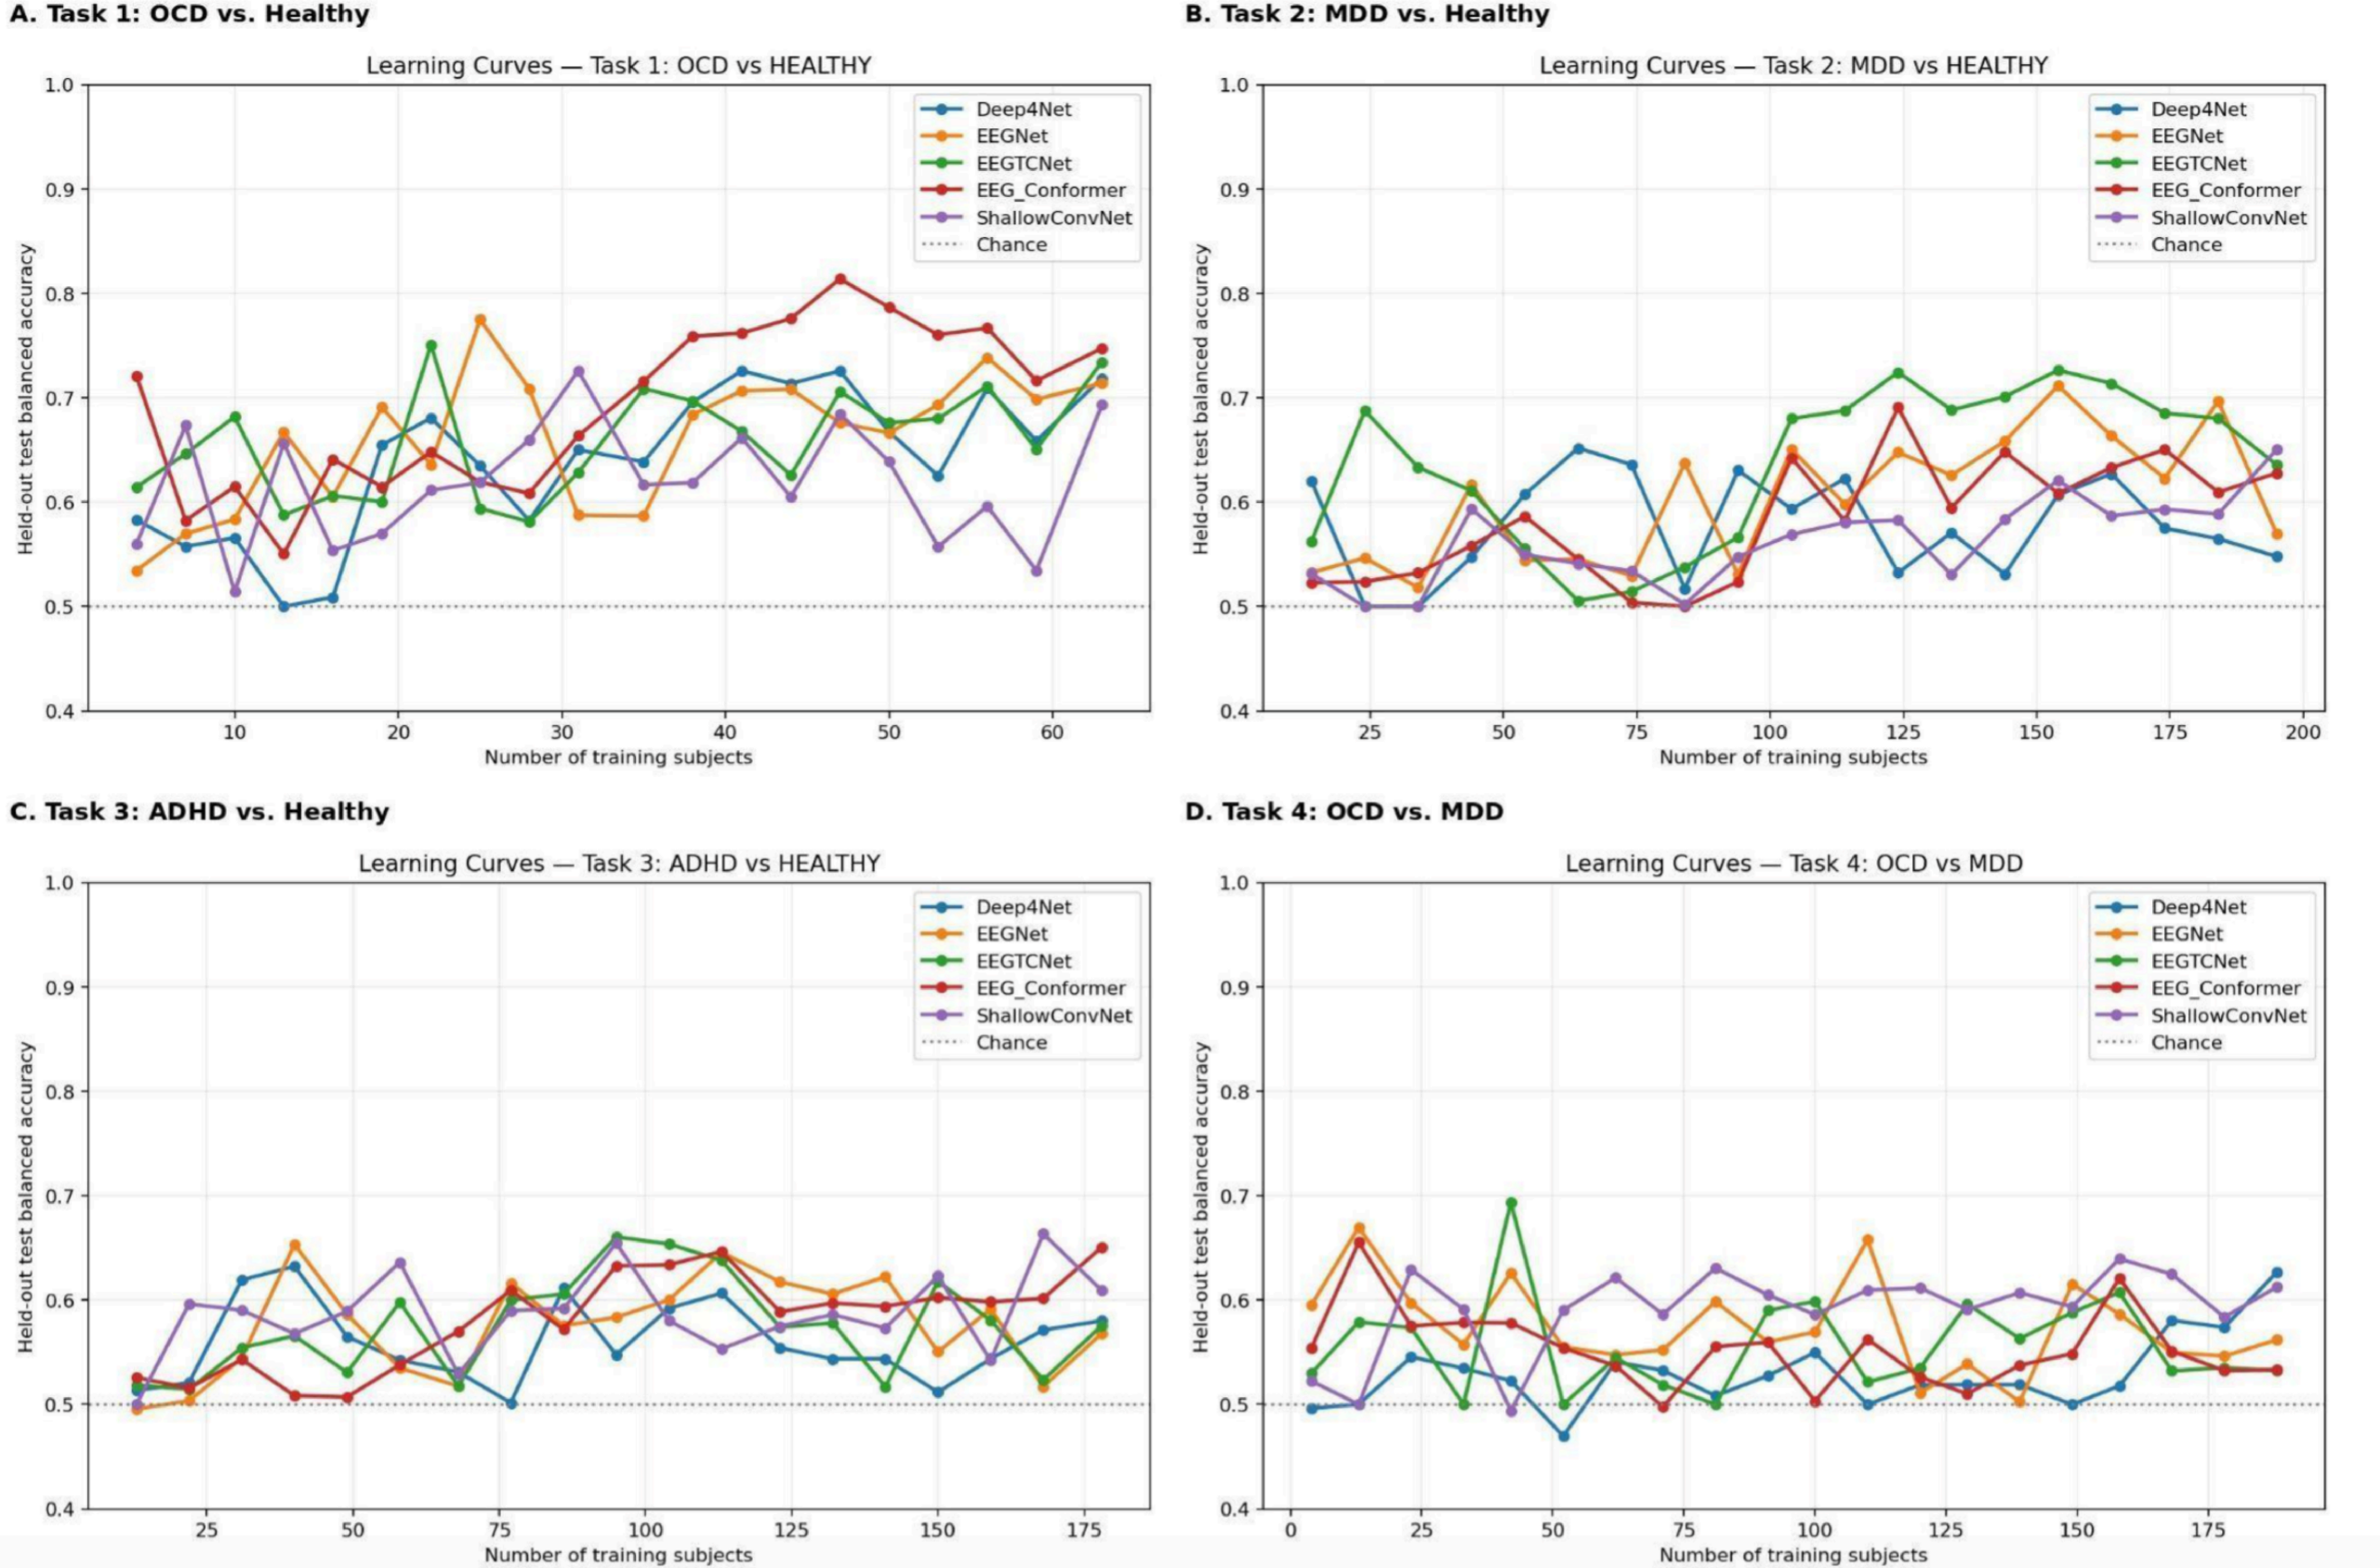
To evaluate whether the modest per-group sample sizes (38 OCD, 75 MDD, 75 ADHD, 47 comparison-group subjects) were sufficient to train the five architectures, held-out balanced accuracy was plotted against the number of training subjects for each task, incrementally expanding the training pool while holding out a fixed test partition (Figure 2).
Overall: No task shows an unambiguous plateau across all five architectures, but Tasks 2 and 3 — the two largest cohorts — come closest to stabilizing for their top-performing models, while Task 1 (smallest OCD cohort) shows the most room for improvement with additional data. This pattern is consistent with, and lends empirical support to, the Limitations section’s point that modest sample size — particularly for OCD — constrains model performance.
Pairwise Statistical Comparison of Architectures (DeLong Tests)
To determine whether the AUC differences among architectures in Table 3 reflect genuine performance gaps rather than sampling variability, pairwise DeLong tests were run on the pooled out-of-fold (OOF) prediction windows for each task, with Holm-Bonferroni correction applied across the 10 pairwise comparisons per task (α = .05). Pooled-window AUCs differ modestly from Table 3’s fold-averaged values (they are complementary, not identical, measures) and are reported in Table 3b below.
| Task | Sig. pairs | Statistically best | Statistically worst / tied-lowest |
| Task 1 (n=10,164) | 8/10 | EEGNet ≈ ShallowConvNet (tied top; AUC 0.669/0.681) | Deep4Net (AUC 0.542; sig. below all four) |
| Task 2 (n=14,616) | 7/10 | EEG-Conformer (AUC 0.670; sig. above all four) | No single sig.-worst model — Deep4Net (0.637) ties with both EEGNet (0.632) and ShallowConvNet (0.651) |
| Task 3 (n=14,609) | 7/10 | EEGNet (AUC 0.701; sig. above all four) | ShallowConvNet (AUC 0.589; sig. below all four) |
| Task 4 (n=8,612) | 8/10 | EEG-Conformer (AUC 0.692; sig. above all four) | Deep4Net ≈ EEGNet tied lowest (0.606/0.597) |
Interpretation: For all four tasks, the majority of the pairwise comparisons (7-8 of 10) are statistically valid after correction. The fold-averaged AUC ranking (Table 3) and the pooled window statistical ranking (Table 3b) differ for two of four tasks (Task 2 (EEGNet) and Task 4 (Deep4Net)) where a model that appears to be mid to high ranked based on the mean fold AUC is actually statistically indistinguishable from the worst model when all of the out-of-fold predictions are pooled. Task 1 and Task 3 are more consistent in their rankings.
Sensitivity, Specificity and F1-Score by Task: In addition to AUC and balanced accuracy, clinically meaningful error metrics of sensitivity (recall on class 0), specificity (recall on class 1), precision, and F1-score were calculated for all five network architectures in all four tasks (Table 3c).
| Model | Task 1 OCD vs. Healthy (Sens/Spec/F1) | Task 2 MDD vs. Healthy (Sens/Spec/F1) | Task 3 ADHD vs. Healthy (Sens/Spec/F1) | Task 4 OCD vs. MDD (Sens/Spec/F1) |
| EEGNet | 0.585 / 0.696 / 0.625 | 0.666 / 0.619 / 0.629 | 0.723 / 0.693 / 0.693 | 0.749 / 0.555 / 0.624 |
| ShallowConvNet | 0.742 / 0.675 / 0.684 | 0.522 / 0.779 / 0.649 | 0.484 / 0.787 / 0.639 | 0.571 / 0.655 / 0.609 |
| Deep4Net | 0.504 / 0.699 / 0.519 | 0.809 / 0.456 / 0.584 | 0.941 / 0.326 / 0.526 | 0.943 / 0.379 / 0.612 |
| EEG-Conformer | 0.625 / 0.650 / 0.614 | 0.487 / 0.823 / 0.658 | 0.607 / 0.781 / 0.692 | 0.702 / 0.677 / 0.640 |
| EEGTCNet | 0.649 / 0.628 / 0.615 | 0.637 / 0.677 / 0.649 | 0.704 / 0.725 / 0.698 | 0.680 / 0.621 / 0.632 |
Sensitivity = recall for the disorder class; specificity = recall for the healthy/control class.
F1 is the macro-averaged F1 across both classes. Precision is not reported, as per-class precision was not retained in the per-fold logs.
The clearest architecture-level pattern is Deep4Net’s consistent bias toward the first class. On Tasks 2, 3 and 4 it reaches sensitivities of 0.809, 0.941 and 0.943 while specificity falls to 0.456, 0.326 and 0.379 — a model that flags most subjects as belonging to the clinical class and achieves balanced accuracy close to its peers by a very different route. ShallowConvNet and EEG-Conformer show the opposite tendency on Tasks 2 and 3, favouring specificity over sensitivity (0.522/0.779 and 0.487/0.823 on Task 2). EEGNet and EEGTCNet are comparatively balanced across all four tasks, with sensitivity and specificity within 0.10 of each other in seven of eight cases. These differences matter clinically: two models with the same balanced accuracy can behave very differently as screening instruments, and the balanced-accuracy column alone does not reveal this.
LOSO Ensemble Performance (True Leave-One-Subject-Out)
Leave-one-subject out evaluation was performed on all eligible subjects for each task’s cohort, using the EEGTCNet + EEG-Conformer soft-vote ensemble (training seed = 42; inclusion frequency per subject = 1.0; confidence intervals calculated based on normal approximation). The number of LOSO iterations is equal to the number of eligible subjects for each task, thus each subject is left out exactly once.
| Task | Comparison | N (Class 0 + Class 1) | LOSO Repetitions | Sensitivity (Class 0) | Specificity (Class 1) | Balanced Accuracy (95% CI) |
| Task 1 | OCD vs. Healthy | 85 (38 + 47) | 85 | 0.789 (30/38) | 0.745 (35/47) | 0.767 [0.677–0.857] |
| Task 2 | MDD vs. Healthy | 122 (75 + 47) | 122 | 0.893 (67/75) | 0.851 (40/47) | 0.872 [0.809–0.930] |
| Task 3 | ADHD vs. Healthy | 122 (75 + 47) | 122 | 0.853 (64/75) | 0.766 (36/47) | 0.810 [0.737–0.882] |
| Task 4★ | OCD vs. MDD | 72 (36 + 36) | 72 | 0.750 (27/36) | 0.972 (35/36) | 0.861 [0.785–0.937] |
★ Task 4 uses balanced 36/36 subject counts.
The best LOSO ensemble balance accuracy was found in MDD vs. Healthy (Task 2), at 87.2% [95% CI: 0.810-0.934], next was OCD vs. MDD (Task 4) with 86.1% [0.785-0.937], then ADHD vs. Healthy (Task 3) with 81.0% [0.737-0.882], and finally OCD vs. Healthy (Task 1) with 76.7% [0.677-0.857] which was the lowest accuracy of the four tasks. These observations are consistent with OCD’s smaller cohort size and the greater sensitivity imbalance already observed for OCD-related tasks in Table 3c. Task 4 shows a more exaggerated sensitivity asymmetry under the true LOSO analysis: 97.2% specificity for MDD versus 75.0% sensitivity for OCD, meaning the ensemble very rarely mislabels an MDD subject as OCD but misses roughly one in four true OCD cases. This is the same directional bias (favoring MDD identification) previously described in the sampled version of this analysis, now confirmed on the full cohort.
Task 4 LOSO Confusion Matrix: Sensitivity and specificity in Table 4 fully determine the underlying confusion matrix; a full 5-model × 4-task set would mostly restate numbers already reported. Task 4’s LOSO result is shown visually here because its asymmetric, direction-specific error is the clearest case in the study and is directly discussed in the interpretation below.
| Predicted OCD | Predicted MDD | Row total | Recall | |
| Actual OCD | 27 (TP) | 9 (FN) | 36 | 0.750 |
| Actual MDD | 1 (FP) | 35 (TN) | 36 | 0.972 |
| Precision | 0.964 (27/28) | 0.795 (35/44) |
The matrix makes the study’s key Task 4 finding immediately visible: the ensemble almost never mistakes an MDD subject for OCD (1 of 36, 2.8% false-positive rate for OCD), and when it does flag a subject as OCD, that flag is highly reliable (96.4% precision). The weaker side of the same result is that 9 of 36 true OCD subjects (25.0%) are misclassified as MDD, giving OCD detection a comparatively lower precision from the MDD side (79.5% precision on MDD predictions, since 9 of the 44 MDD-predicted subjects are actually OCD). This directional asymmetry — MDD signals dominating when the two conditions are confused — is consistent with the manuscript’s discussion that MDD has a more stereotyped, consistent resting-state EEG signature (frontal alpha asymmetry) than OCD, making the model default toward an MDD prediction whenever the OCD-specific signal is weak or ambiguous in a given subject.
Saliency Analysis
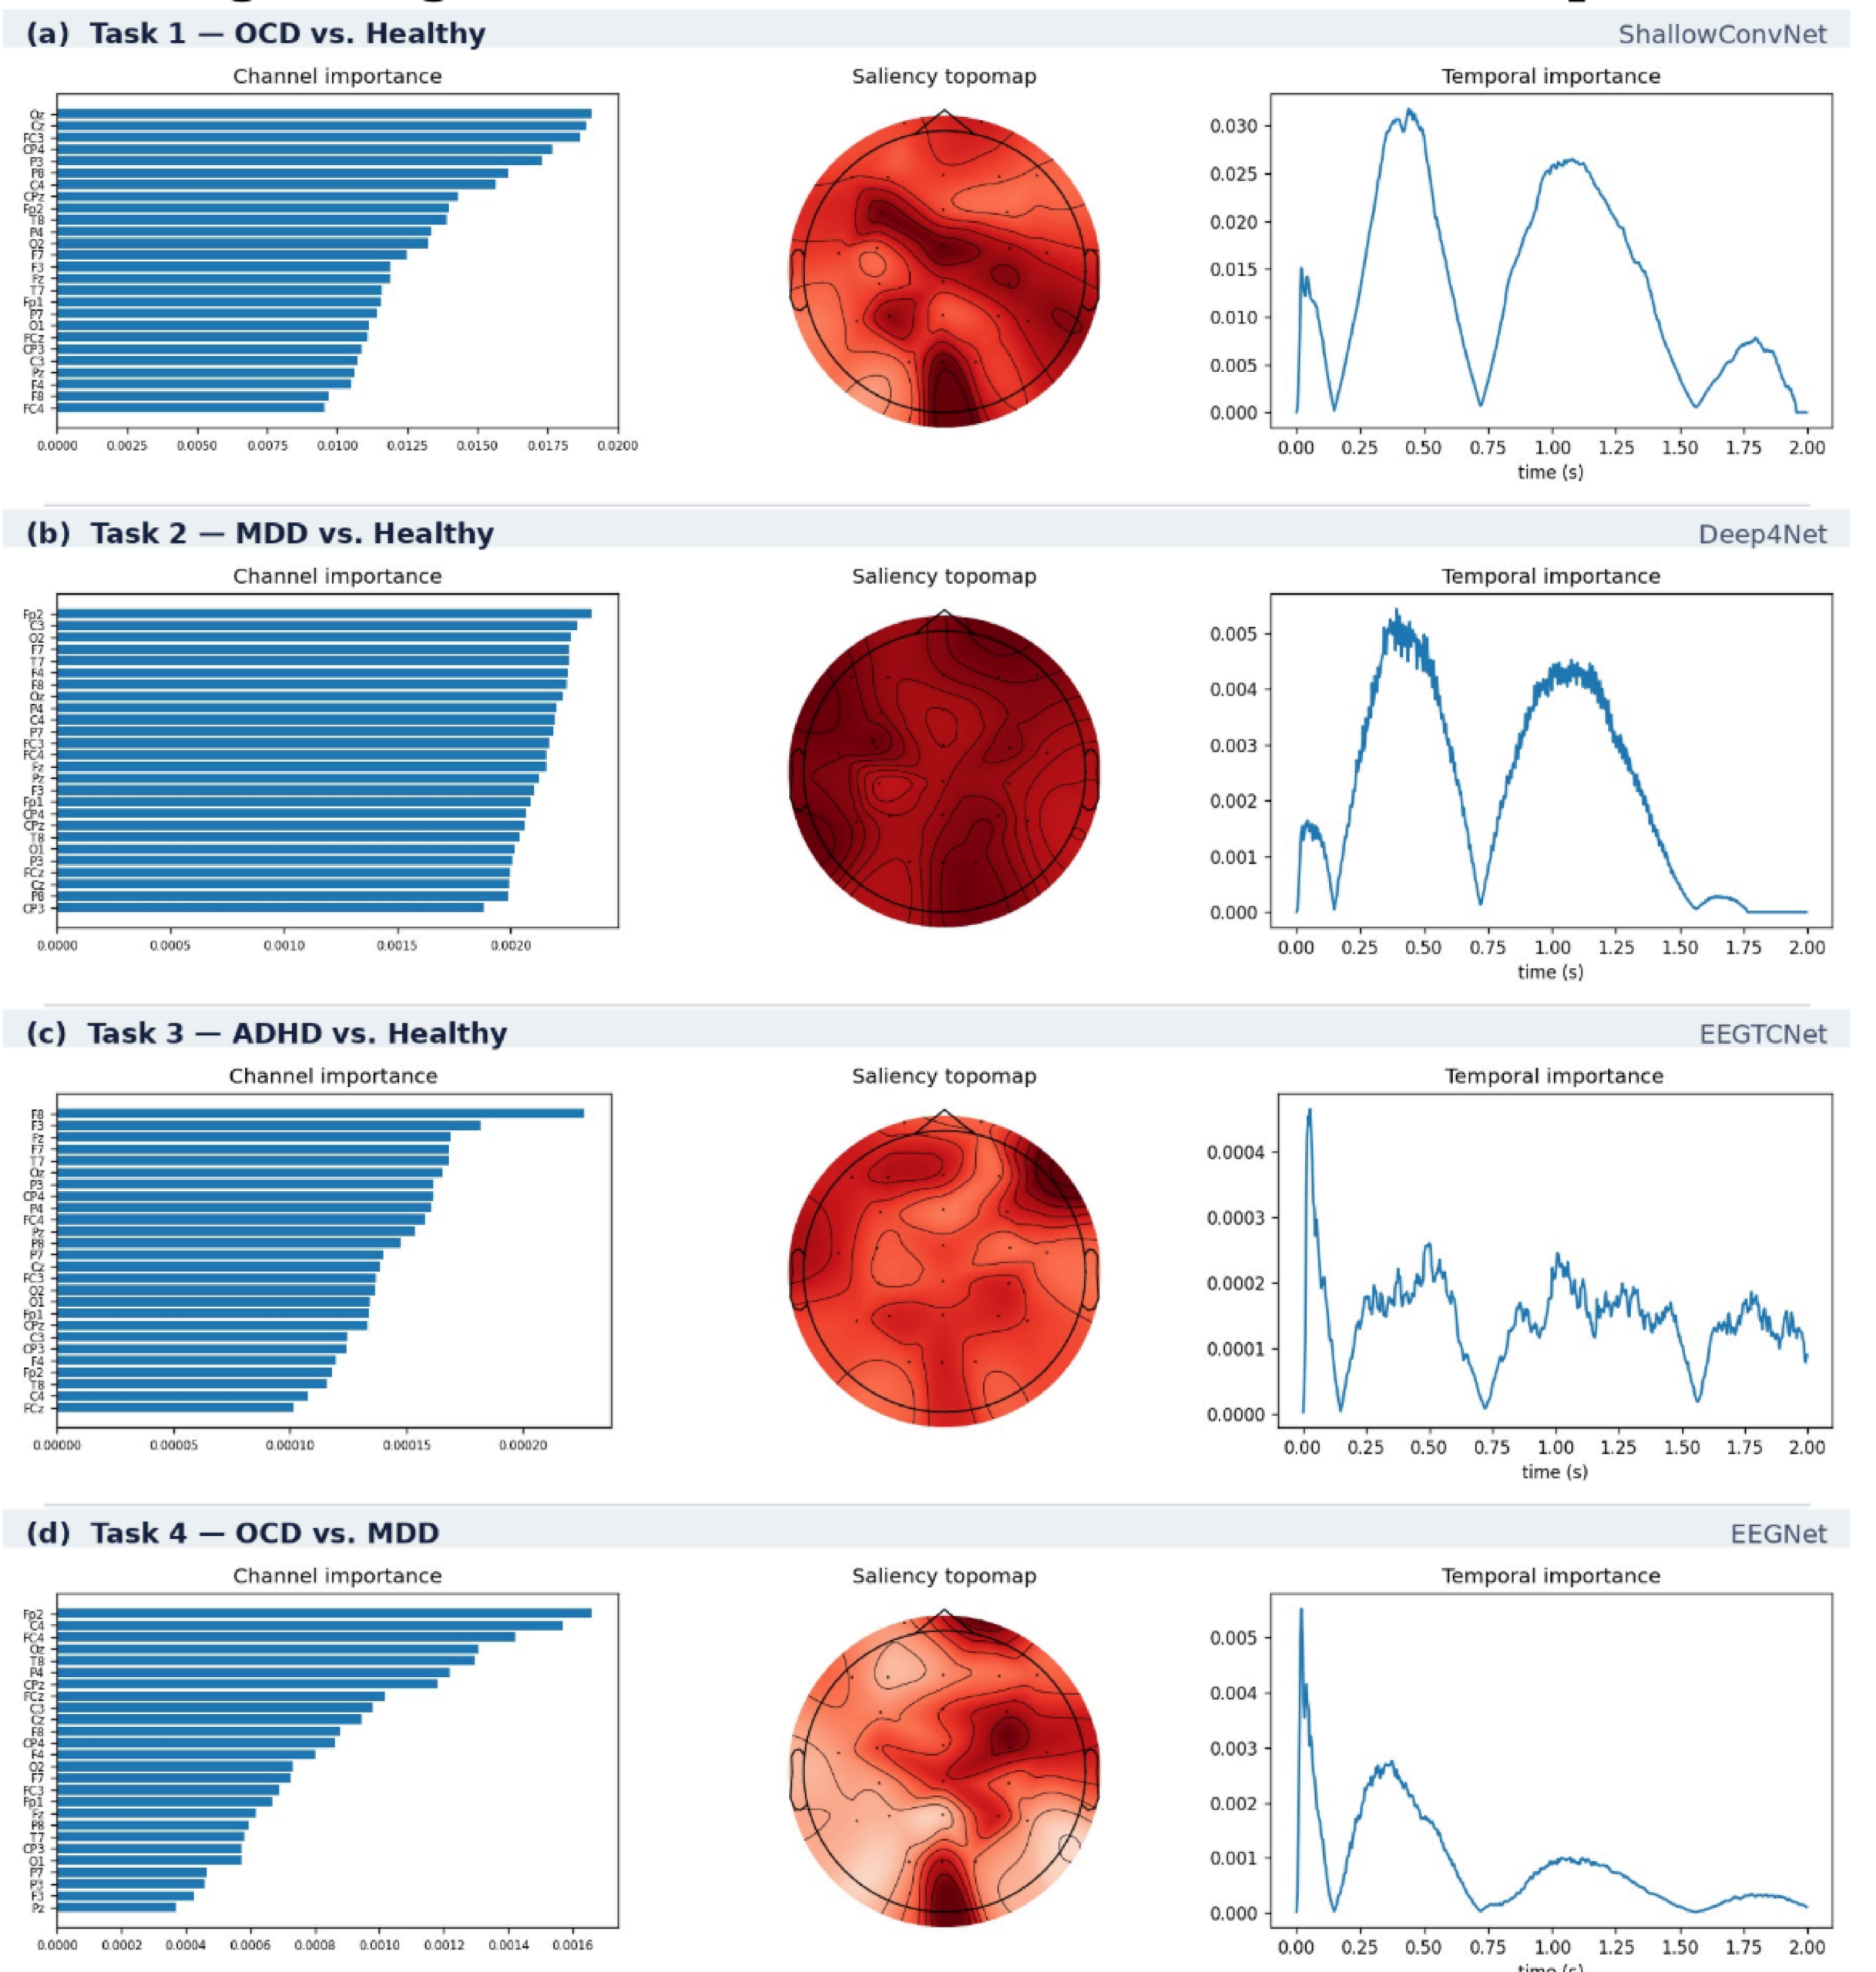
Across tasks, spatial attributions differed noticeably. Additionally, the degree of localization seemed to correlate with classification accuracy. The most structured maps were produced by EEGTCNet on Task 3 and ShallowConvNet on Task 1. EEGTCNet was highly localized in F8 for Task 3, which had more weight than any other electrode. ShallowConvNet heavily weighted medline occipital and central electrodes on Task 1 (Oz, Cz, FC3). On Task 4, EEGNet highlighted right central and frontal sites (Fp2, C4, FC). The weakest of the four at 0.633 was Deep4Net on Task 2, which showed little to no spatial differentiation, with attribution ranging from 0.0019 to 0.0024 over all 26 electrodes, as can be seen in the topomap (corresponds to diffuse evidence distribution by a classifier rather than a localized generator)
Temporal attribution was closely similar across all four tasks despite differing architectures and diagnostic contrasts. Every task showed attribution falling to near zero at approximately 0.72s and again near 1.57s within the 2-second window. Because this structure is shared by four different architectures trained on four different diagnostic contrasts, it more plausibly reflects a property of the epoching or normalization pipeline than a disorder-related neurophysiological rhythm, and it is therefore not interpreted substantively here.
These attributions indicate which inputs each model weighted, not which neural processes are causally involved in the disorders. They also describe a single trained model per task rather than a consensus across the five architectures, and the models shown are not uniformly the best performers on their respective tasks.
Discussion
Restatement of Key Findings: This study demonstrates that five deep learning architectures applied to full-frequency resting-state EEG can distinguish psychiatric diagnostic categories from healthy controls above chance, using only 2-second windows with no manual feature selection. ROC-AUC ranged from 0.581 (Deep4Net, Task 1) to 0.718 (EEG-Conformer, Task 3), with LOSO ensemble balanced accuracy of 0.767–0.872 across all four tasks. ADHD classification (Task 3) was most reliable (mean AUC 0.679, LOSO 0.810), consistent with the established literature on ADHD-related theta/beta power asymmetries. MDD discrimination (Task 2) showed the greatest inter-model consistency, with Deep4Net and EEGTCNet both achieving 0.650 — the highest result for that task — suggesting that hierarchical and attention-based architectures capture disorder-specific EEG dynamics not accessible to shallower models.
Implications and Significance: The most notable finding was the asymmetric Task 4 LOSO error pattern: MDD classification was near-perfect (35/36), while all remaining errors involved OCD subjects misclassified as MDD. Because age-matching was applied, this cannot be attributed to demographic confounding. One hypothesis is that MDD in TDBRAIN presents with a consistent spectral signature—likely frontal alpha brainwave asymmetry and elevated theta—that is highly separable from OCD, whereas a minority of OCD patients exhibit depressive-spectrum EEG features. These results are consistent with clinical evidence that OCD and MDD frequently co-occur: lifetime comorbidity rates of approximately 30–40% have been reported in large epidemiological studies23, suggesting a subset of OCD patients may have genuine neurophysiological overlap with MDD.
The age-confound analysis (ΔAUC = −0.075 after matching) confirms that demographic mismatch between recruitment cohorts is a substantial source of inflated inter-disorder differences in group discrimination. Broadband deep learning classifiers have access to all frequencies without limitations and can take advantage of the increase in low-frequency power linked with the process of aging. Researchers conducting analyses using the TDBRAIN database or similar data collected from multiple cohorts need to present demographic characteristics for each group and correct their analyses for age prior to presenting results of inter-disorder classification. Validation through external testing on an autonomous psychiatric EEG sample from a distinct medical facility remains a prerequisite for establishing the real-world clinical utility of these patterns beyond the current cohort; this constraint is a fundamental priority for future research.
Connection to Objectives and Architecture Comparison: Deep4Net performed best in Tasks 2 and 4 with AUC values of 0.650 and 0.657 respectively. This indicates that the hierarchical convolution layers can identify broad spectral changes common in MDD. EEG-Conformer produced the highest single-model score overall (0.718, Task 3) due to self-attention’s ability to capture long-term temporal dependencies that local filters cannot capture. The lowest accuracy was ShallowConvNet (mean AUC 0.621). This can be attributed to its motor-imagery spectral filters missing the multi-band patterns in psychiatric EEG.
Subject-Level Data Integrity: To ensure subject-level data integrity, this study addresses the risk of within-subject leakage, which occurs if multiple 2-second segments from one person are split between training and validation sets. Such leakage can cause models to identify idiosyncratic brainwave signatures rather than genuine disorder-specific signals. We utilize GroupKFold cross-validation to maintain a strict separation; all EEG windows from a single participant are assigned exclusively to a single fold, ensuring that no individual’s data is present in both sets simultaneously. This method provides a more rigorous benchmark than standard cross-validation, forcing the models to generalize to previously unseen neural profiles. The LOSO ensemble further validates this robustness, as each individual is entirely excluded from the training process24. The resulting above-chance LOSO balanced accuracy (ranging from 0.767 to 0.872) demonstrates that the identified patterns reflect diagnostic characteristics rather than subject-level memorization. Because each subject contributes 100–237 non-overlapping windows, the effective statistical sample size reflects the number of subjects (N = 38–75 per class), not the number of windows; window-level metrics therefore overstate the precision of performance estimates, and subject-level evaluation via GroupKFold and LOSO is essential to obtain unbiased generalization estimates25.
Interpretability and Explainable AI: This study used integrated gradients to show which electrodes and time points each model relied on (Figure 3), addressing part of the “black box” problem that limits clinical use of deep learning. Three limitations remain.
The attributions are spatial and temporal, not spectral. Because the models read broadband 0.5–45 Hz signals, the maps cannot show which frequency bands drive classification — the measure most comparable to the psychiatric EEG literature, where results are usually reported as band-specific power or coherence. Frequency-resolved attribution is the clearest next step.
Attribution was also computed for only one architecture per task, so it is unclear whether these patterns reflect the EEG signal itself or the particular model. Finally, all four tasks produced nearly identical temporal profiles, with attribution near zero around 0.72 s and 1.57 s. Because this pattern recurs across different architectures and diagnostic contrasts, it may arise from preprocessing rather than neurophysiology, and should be checked before the spatial findings are interpreted as biologically meaningful.
Limitations: Regarding sample size, subject counts per task (N = 38–75 per class) are modest, yet in line with published EEG deep learning studies for these disorders. To compensate, window-level training provides 9,700–11,994 EEG segments per fold. However, the OCD cohort (N = 38) represents the full extent of available TDBRAIN data for this diagnosis, making replication with an independent OCD sample a priority.
Since all outcomes come from one dataset, it is necessary to validate the method externally using an independent psychiatric EEG dataset in order to generalize claims to real world clinical utility; however, that was not done here, since there was no publicly available dataset that matched the recording parameters, diagnostic categories, and sample size used. All outcomes thus represent performance in the TDBRAIN dataset only.
Medication status presents another constraint, as TDBRAIN lacks standardized medication records for all subjects. Considering that psychotropic medications change the resting-state EEG spectral features, it becomes unclear which brainwave differences in classification are caused by underlying diseases and what are attributed to medications. This can be viewed as a substantial confound and should be accounted for in future studies through stratified analysis.
As mentioned above, the feature importance validation (Grad-CAM, Layer-wise Relevance Propagation) against existing EEG biomarkers is outstanding for preliminary saliency maps depicted in Figure 3.
While pairwise DeLong tests (Table 3b) conclude that most differences in the area under the curve between various architectures for the same task are genuine after the Holm-Bonferroni correction, this type of analysis compares performance of models between themselves and not to random chance. Moreover, it was based on cross-validation AUC instead of LOSO balanced accuracy measure. Formal permutation (shuffle-and-retest) testing against randomized labels, and bootstrap confidence intervals on LOSO balanced accuracy specifically, were not conducted and should be added in future versions to confirm that above-chance performance is not attributable to chance alone.
Finally, an EEGTCNet Task 4 training collapse occurred when one fold failed to train (balanced accuracy = 0.343, well below the 0.5 chance level), increasing result variability for that model on Task 4. This is a small-dataset artifact caused by the limited age-matched cohort size (N ≈ 36/class), not a fundamental model flaw.
Conclusion
Summary: This current study demonstrates that five deep learning models have the capability to distinguish between different psychiatric diagnostic classes from controls using full-frequency resting-state EEG based on only 2-second time windows. The evaluation results showed the average ROC-AUC measures in the range of 0.610 ± 0.019 (Task 1: OCD vs. Healthy) to 0.679 ± 0.041 (Task 3: ADHD vs. Healthy), whereas the LOSO ensembling attained balanced accuracy at 81.0% (ADHD vs. Healthy) and 86.1% (Age-Matched OCD vs. MDD). Notably, the EEG-Conformer produced the most robust individual performance (0.718, Task 3), whereas Deep4Net excelled in MDD-specific and cross-diagnostic discrimination. These findings reinforce the premise that EEG-based deep learning serves as a viable, nonsurgical measurable brain signal tool, though the results remain preliminary due to cohort size constraints and single-site data. Crucially, the maintenance of above-chance LOSO performance confirms the models’ capacity for subject-level generalization within the TDBRAIN framework.
Future Directions: The following directions address the limitations identified above: (i) scaling to the complete TDBRAIN repository (N = 1,274) through the cached preprocessing pipeline, paired with external validation on independent psychiatric samples; (ii) retraining all tasks on prospectively age and sex-matched cohorts, extending the matching applied here to Task 4, so that performance can be attributed to disorder-related rather than demographic variation; (iii) extending the interpretability analysis reported here from channel and time-resolved attribution to frequency-resolved attribution, and comparing attributions across all five architectures to separate properties of the signal from architecture-specific bias; (iv) establishing significance against chance through permutation testing with shuffled labels; (v) evolving the current binary framework into multi-class classification to better reflect clinical complexity; and (vi) validating findings on datasets beyond TDBRAIN to establish generalizability
Acknowledgments
The author thanks the Brainclinics Foundation and Research Institute Brainclinics (Nijmegen, the Netherlands) for making the TDBRAIN dataset publicly available. The author also thanks Joe Xiao (Veritas AI Research) for mentorship and guidance throughout the research process. Computational analysis was conducted using Google Colaboratory. Deep learning implementations used the BrainDecode library.
Reference
- GBD 2019 Mental Disorders Collaborators. Global, regional, and national burden of 12 mental disorders in 204 countries and territories, 1990–2019: a systematic analysis for the Global Burden of Disease Study 2019. Lancet Psychiatry. Vol. 9, pg. 137–150, 2022, https://doi.org/10.1016/S2215-0366(21)00395-3. [↩]
- S. Prasad, R. Kumminimana. Attention-deficit/hyperactivity disorder: insights, advances and challenges in research and practice. Postępy Psychiatrii i Neurologii. Vol. 34, pg. 196–206, 2025, https://doi.org/10.5114/ppn.2025.153717. [↩]
- D. S. Hasin, A. L. Sarvet, J. L. Meyers, T. D. Saha, W. J. Ruan, M. Stohl, B. F. Grant. Epidemiology of adult DSM-5 major depressive disorder and its specifiers in the United States. JAMA Psychiatry. Vol. 75, pg. 336–346, 2018, https://doi.org/10.1001/jamapsychiatry.2017.4602. [↩]
- A. M. Ruscio, D. J. Stein, W. T. Chiu, R. C. Kessler. The epidemiology of obsessive-compulsive disorder in the National Comorbidity Survey Replication. Molecular Psychiatry. Vol. 15, pg. 53–63, 2010, https://doi.org/10.1038/mp.2008.94. [↩]
- A. Abramovitch, J. S. Abramowitz, A. Mittelman. The neuropsychology of adult obsessive-compulsive disorder: a meta-analysis. Clinical Psychology Review. Vol. 33, pg. 1163–1171, 2013, https://doi.org/10.1016/j.cpr.2013.09.004. [↩]
- American Psychiatric Association. Diagnostic and statistical manual of mental disorders (5th ed.). 2013, https://doi.org/10.1176/appi.books.9780890425596. [↩]
- D. A. Regier, W. E. Narrow, D. E. Clarke, H. C. Kraemer, S. J. Kuramoto, E. A. Kuhl, D. J. Kupfer. DSM-5 field trials in the United States and Canada, part II: test-retest reliability of selected categorical diagnoses. American Journal of Psychiatry. Vol. 170, pg. 59–70, 2013, https://doi.org/10.1176/appi.ajp.2012.12070999. [↩]
- J. A. Coan, J. J. B. Allen. Frontal EEG asymmetry as a moderator and mediator of emotion. Biological Psychology. Vol. 67, pg. 7–49, 2004, https://doi.org/10.1016/j.biopsycho.2004.03.002. [↩]
- J. J. Newson, T. C. Thiagarajan. EEG frequency bands in psychiatric disorders: a review of resting state studies. Frontiers in Human Neuroscience. Vol. 12, pg. 521, 2019, https://doi.org/10.3389/fnhum.2018.00521. [↩]
- M. Arns, C. K. Conners, H. C. Kraemer. A decade of EEG theta/beta ratio research in ADHD: a meta-analysis. Journal of Attention Disorders. Vol. 17, pg. 374–383, 2013, https://doi.org/10.1177/1087054712460087. [↩]
- C.-T. Wu, H.-C. Huang, S. Huang, I.-M. Chen, S.-C. Liao, C.-K. Chen, C. Lin, S.-H. Lee, M.-H. Chen, C.-F. Tsai, C.-H. Weng, L.-W. Ko, T.-P. Jung, Y.-H. Liu. Resting-state EEG signal for major depressive disorder detection: a systematic validation on a large and diverse dataset. Biosensors. Vol. 11, pg. 499, 2021, https://doi.org/10.3390/bios11120499. [↩]
- D. Jan, M. de Vega, J. López-Pigüi, I. Padrón. Applying deep learning on a few EEG electrodes during resting state reveals depressive states: a data driven study. Brain Sciences. Vol. 12, pg. 1506, 2022, https://doi.org/10.3390/brainsci12111506. [↩]
- H. van Dijk, G. van Wingen, D. Denys, S. Olbrich, R. van Ruth, M. Arns. The two decades brainclinics research archive for insights in neurophysiology (TDBRAIN) database. Scientific Data. Vol. 9, pg. 333, 2022, https://doi.org/10.1038/s41597-022-01409-z. [↩] [↩] [↩] [↩]
- N. Gour, T. Hassan, M. Owais, I. I. Ganapathi, P. Khanna, M. L. Seghier, N. Werghi. Transformers for autonomous recognition of psychiatric dysfunction via raw and imbalanced EEG signals. Brain Informatics. Vol. 10, pg. 25, 2023, https://doi.org/10.1186/s40708-023-00201-y. [↩]
- A. Gramfort, M. Luessi, E. Larson, D. A. Engemann, D. Strohmeier, C. Brodbeck, R. Goj, M. Jas, T. Brooks, L. Parkkonen, M. Hämäläinen. MEG and EEG data analysis with MNE-Python. Frontiers in Neuroscience. Vol. 7, pg. 267, 2013, https://doi.org/10.3389/fnins.2013.00267. [↩]
- R. Haartsen, B. van der Velde, E. J. H. Jones, M. H. Johnson, C. Kemner. Using multiple short epochs optimises the stability of infant EEG connectivity parameters. Scientific Reports. Vol. 10, pg. 12703, 2020, https://doi.org/10.1038/s41598-020-68981-5. [↩]
- G. Zhang, D. R. Garrett, A. M. Simmons, J. E. Kiat, S. J. Luck. Evaluating the effectiveness of artifact correction and rejection in event-related potential research. Psychophysiology. Vol. 61, pg. e14511, 2024, https://doi.org/10.1111/psyp.14511. [↩]
- V. J. Lawhern, A. J. Solon, N. R. Waytowich, S. M. Gordon, C. P. Hung, B. J. Lance. EEGNet: a compact convolutional neural network for EEG-based brain-computer interfaces. Journal of Neural Engineering. Vol. 15, pg. 056013, 2018, https://doi.org/10.1088/1741-2552/aace8c. [↩]
- R. T. Schirrmeister, J. T. Springenberg, L. D. J. Fiederer, M. Glasstetter, K. Eggensperger, M. Tangermann, F. Hutter, W. Burgard, T. Ball. Deep learning with convolutional neural networks for EEG decoding and visualization. Human Brain Mapping. Vol. 38, pg. 5391–5420, 2017, https://doi.org/10.1002/hbm.23730. [↩] [↩]
- Y. Song, Q. Zheng, B. Liu, X. Gao. EEG conformer: convolutional transformer for EEG decoding and visualization. IEEE Transactions on Neural Systems and Rehabilitation Engineering. Vol. 31, pg. 710–719, 2023, https://doi.org/10.1109/TNSRE.2022.3230250. [↩]
- T. M. Ingolfsson, M. Hersche, X. Wang, N. Kobayashi, L. Cavigelli, L. Benini. EEG-TCNet: an accurate temporal convolutional network for embedded motor-imagery brain-machine interfaces. Proceedings of the IEEE International Conference on Systems, Man, and Cybernetics. Pg. 2958–2965, 2020, https://doi.org/10.1109/SMC42975.2020.9283028. [↩]
- D. P. Kingma, J. Ba. Adam: a method for stochastic optimization. ArXiv. 2014, https://arxiv.org/abs/1412.6980. [↩]
- E. Sharma, L. P. Sharma, S. Balachander, B. Lin, H. Manohar, P. Khanna, C. Lu, K. Garg, T. L. Thomas, A. C. L. Au, R. R. Selles, D. R. M. A. Højgaard, G. Skarphedinsson, S. E. Stewart. Comorbidities in obsessive-compulsive disorder across the lifespan: a systematic review and meta-analysis. Frontiers in Psychiatry. Vol. 12, pg. 703701, 2021, https://doi.org/10.3389/fpsyt.2021.703701. [↩]
- S. Kunjan, T. S. Grummett, K. J. Pope, D. M. W. Powers, S. P. Fitzgibbon, T. Bastiampillai, M. Battersby, T. W. Lewis. The necessity of leave one subject out (LOSO) cross validation for EEG disease diagnosis. Brain Informatics. Pg. 558–567, 2021, https://doi.org/10.1007/978-3-030-86993-9_50. [↩]
- J. White, S. D. Power. K-fold cross-validation can significantly over-estimate true classification accuracy in common EEG-based passive BCI experimental designs: an empirical investigation. Sensors. Vol. 23, pg. 6077, 2023, https://doi.org/10.3390/s23136077. [↩]