Abstract
Exoplanets in the Optimistic Habitable Zone (OHZ) are often treated as candidates for life, but their atmospheric evolutionary history and possibilities are rarely considered. This study investigates the susceptibility of terrestrial exoplanets to the “Venusian Divergence”, a transition into a self-sustaining runaway greenhouse state. Using the Venus Similarity Index (VSI) framework, we applied a greenhouse scaling factor of 3.18 (derived from the Venusian  ratio) to a sample of 21 terrestrial exoplanets (
 ) identified via the NASA Planetary Systems Composite Data archive, of which 17 remained after applying Recent Venus/Early Mars limits. Our results indicate that 64.71% of candidates achieved VSI
 0.8, with TOI-700 e emerging as the closest Venus analog (VSI
 0.9637). Among candidates classified as Venus analogs, all clustered within a narrow bulk density range of 4.90–5.56 g/cm
 , reinforcing that density is a necessary but not sufficient condition for high Venusian similarity in this sample. Interestingly, a number of planets clustered near the Earth’s VSI of 0.76, including LP 890-9 c and Kepler-62 f, showing that they are dissimilar to Venus even under greenhouse amplification. These findings suggest that orbital position alone is insufficient to assess habitability, as when greenhouse amplification is accounted for, more than 60% of our sample resembles Venus more than Earth.
Keywords: Habitable Zone; Optimistic Habitable Zone; Venusian Divergence; Venus Similarity Index; Runaway Greenhouse Effect; Greenhouse Scaling Factor.
Introduction
The Habitable Zone (HZ) is defined as a circumstellar region around a star in which liquid water could exist on a planet’s surface1,2. This is crucial to note, as liquid water is essential for biological processes that allow life to form and be sustained3. The location of the boundaries of the HZ of a star are dependent on the stellar host type, which is classified by O, B, A, F, G, K, and M. To comprehend habitability, we must understand the crucial difference between the Conservative and Optimistic Habitable Zones (OHZ). The Conservative Habitable Zone is in between the inner and outer Optimistic HZ and permits terrestrial planets to stably hold liquid water on them, as well as balance heat through exchanges between the surface and atmosphere through the Carbon-Silicate Cycle3, similar to Earth. The inner Optimistic HZ is defined by the “Recent Venus” limit, a boundary based on the observation that Venus may have possessed surface liquid water as recently as one billion years ago2,4.
Evolutionary Divergence of Venus
The second planet of our Solar System, Venus, is located in the Optimistic Habitable Zone of the Sun. Today, Venus sits at approximately 737 K (464  C or 867 F), covered in thick, concentrated sulfuric acid clouds and contains most of its carbon dioxide in the atmosphere4. Nevertheless, as little as one billion years ago, we believe that it was capable of allowing the existence of liquid water5,6,7, which may have allowed the chemical conditions necessary for life to emerge because Venus was located in the Conservative Habitable Zone of our Sun7. However, as solar luminosity increased, Venus surpassed that limit, triggering a runaway greenhouse effect. Under these conditions, the positive feedback loop between surface temperature and atmospheric water vapor becomes unstoppable8. Unlike Earth, where the Carbon-Silicate Cycle is constant in regulating CO2 levels9, the loss of liquid oceans on Venus terminated this process. This resulted in a massive accumulation of volcanic CO2, causing extreme pressures in the atmosphere, reaching 92-bar today10.
Context
For exoplanets that sit similarly in their host star’s Optimistic Habitable Zone, the risk of a Venus-like divergence may be significant and could substantially reduce habitability. Their placement actually makes them much more exposed to catastrophic solar events, such as flares and winds11. In R. Luger11, they discuss how type-M stars emit significant amounts of their luminosity through high-energy radiation, particularly extreme ultraviolet (XUV) and X-ray radiation. This radiation triggers the photolysis of water molecules in the upper atmosphere; as a result, the atmosphere is broken down, and the resulting hydrogen escapes into space. For a planet to remain habitable, it would have to possess an unusually robust magnetic field or a massive initial water inventory to survive to the star’s extended pre-main-sequence phase11 where the star emits even greater amounts of heat and radiation. As an example, recent JWST observations of the TRAPPIST-1 system12, famously thought to host planets capable of habitability, confirm the absence of dense atmospheres on the inner-system terrestrial planets, from which we can estimate that these planets are biologically hazardous, especially without protection from extreme radiation and solar events. This provides empirical support for the atmospheric stripping models that underpin the Venus Similarity Index. Furthermore, the close proximity of the HZ to M-type host stars subjects these planets to intense tidal forces, often resulting in tidal locking13,14. This synchronous rotation creates a permanent day-side, which can accelerate water loss through intensified convection15, or the permanent night-side can prevent a runaway greenhouse effect entirely. Because most of the exoplanets in this study are hosted by an M-type star, it is important to keep in mind the limitations of this study and that current technologies do not allow us to accurately predict the fate of these planets. This study investigates whether exoplanets located in the Optimistic Habitable Zone may actually resemble Venus-like runaway greenhouse worlds when a Venusian greenhouse scaling factor is applied.
Methods
In research, we use a similarity index to see how closely an object matches a reference point. For this project, the use of the Venus Similarity Index16, or VSI, compared exoplanets to Venus, assuming that they have a dense atmosphere dominated by greenhouse gases and underwent the runaway greenhouse effect. We define the runaway greenhouse effect as the driving thermodynamic feedback mechanism and the resulting runaway greenhouse state, which defines the final stable climate configuration of the planet4. The mathematical formulation of the Venus Similarity Index used in this study is based on the Similarity Index framework established by Schulze-Makuch et al. (2011)17. This model was specifically adapted to identify Venusian-type exoplanets16. The Index is as follows:
where  = Radius in Venus Units (VU),
 = Density in Venus Units (VU),
 = Escape Velocity in Venus Units (VU),
and  = Surface Temperature in Venus Units (VU).
The individual components are calculated as follows:
where  (Radius)
 ,
 (Density)
 ,
 (Escape Velocity)
 ,
and  (Surface Temperature)
 .
Similarly to the Earth Similarity Index, the values range from 0, not at all similar, to 1, identical. We will define that: if the VSI value for an exoplanet comes out as  , it will be considered to be on the same divergence path as Venus. The 0.8 threshold follows the convention established in Raviprakash et al. (2026)16 and traces back to Schulze-Makuch et al. (2011)17, where a similarity score of 0.8 marks the boundary for high similarity between two bodies. However, if it comes near 0.76, it is more like Earth and has a higher chance of being able to successfully maintain liquid water. Any VSI score
 is likely to have a flux too low, too small a radius, or too low of density to be a Venusian twin. The goal is to see how the selected exoplanets compare to Venus if they were to undergo a similar runaway greenhouse effect, and apply the idea of the Optimistic HZ to reassess the habitability of exoplanets that have similar properties to Venus.
To do this, NASA’s Planetary Systems Composite Data in the Exoplanet Archive were utilized. The VSI requires the radius, density, escape velocity and surface temperature of an exoplanet16. The archive provides information on the radius, density, and escape velocity, but not surface temperature. Accurate calculations of the surface temperature of exoplanets are extremely hard to do, as it requires knowledge about the composition of the atmosphere, the planetary albedo, and the current greenhouse effect of the planet. Because current resources do not allow for the information yet, we will use the ratio of the measured surface temperature to the calculated equilibrium temperature of Venus. Venus is a perfect example of a planet that, as we believe, had the potential to host life but was overcome by greenhouse gases and high temperatures, which are hostile to life formation. To account for the intense runaway greenhouse effect characteristic of Venusian analogs, the surface temperature ( ) was estimated by applying a greenhouse scaling factor to the equilibrium temperature (
 ) provided by the NASA Exoplanet Archive. A of 232 K was derived using Venus’s bond albedo of 0.75 using the planetary equilibrium temperature equation (Eq. S1). Following the ratio observed on Venus (
 ), this study assumed a thick,
 -dominated atmosphere for all candidates, consistent with the 737 K reference points utilized in18. This factor,
 , of 3.18 represents the amplification between the equilibrium temperature and surface temperature of Venus, the planet being used for comparison in this study, caused by a dense greenhouse atmosphere.
It is important to note that this derivation involves a mathematical circularity. Because the scaling factor of 3.18 is itself defined as  , Venus’s own reference surface temperature is
 . When each planet’s scaled surface temperature (
 ) is compared back to
 in the
 sub-index, the shared factor cancels algebraically:
This is true for any positive value of , meaning the temperature sub-index is, in practice, a direct comparison of each candidate’s equilibrium temperature to Venus’s own equilibrium temperature (232 K, implied by 737 K / 3.18), regardless of the scaling factor chosen. We confirmed this numerically by recomputing VSI values using raw equilibrium temperatures, reproducing the original VSI values for all candidates. Because of this, we treat the VSI results in this study as an answer to a conditional question of how similar would the planet be to Venus if it were assumed to carry a Venus-like atmosphere, rather than as an independent prediction of atmospheric divergence. The Results section reports an unscaled control calculation of VSI values alongside the scaled result to make this dependence explicit.
This study did not verify the albedo assumption underlying each equilibrium temperature reported by the NASA Planetary Systems Composite Data Archive. values are drawn from heterogeneous published sources, which may not share a consistent albedo or redistribution convention with the 0.75 albedo used to derive Venus’s equilibrium temperature (232 K).
Archive Parameters
Parameters for filtering planets were applied to the archive. Radius is presented as a value relative to Earth.
- Radius:
 —

- Equilibrium Temperature: 107 K — 285 K
These parameters yielded a sample of 21 planets. The escape velocity was calculated using the standard equation:
Although Kane et al. (2026)18 utilized the parameters of  to restrict the calculations to more Venus-sized planets, this study utilized
 , in order to account for exoplanets that can be considered Super-Earths and sub-Earths. The equilibrium temperature range of 107 K — 285 K was chosen to approximate the temperature zone for planets orbiting cool stars, broadly advised by similar temperature filtering approaches in prior exoplanet habitability studies (e.g., studies using
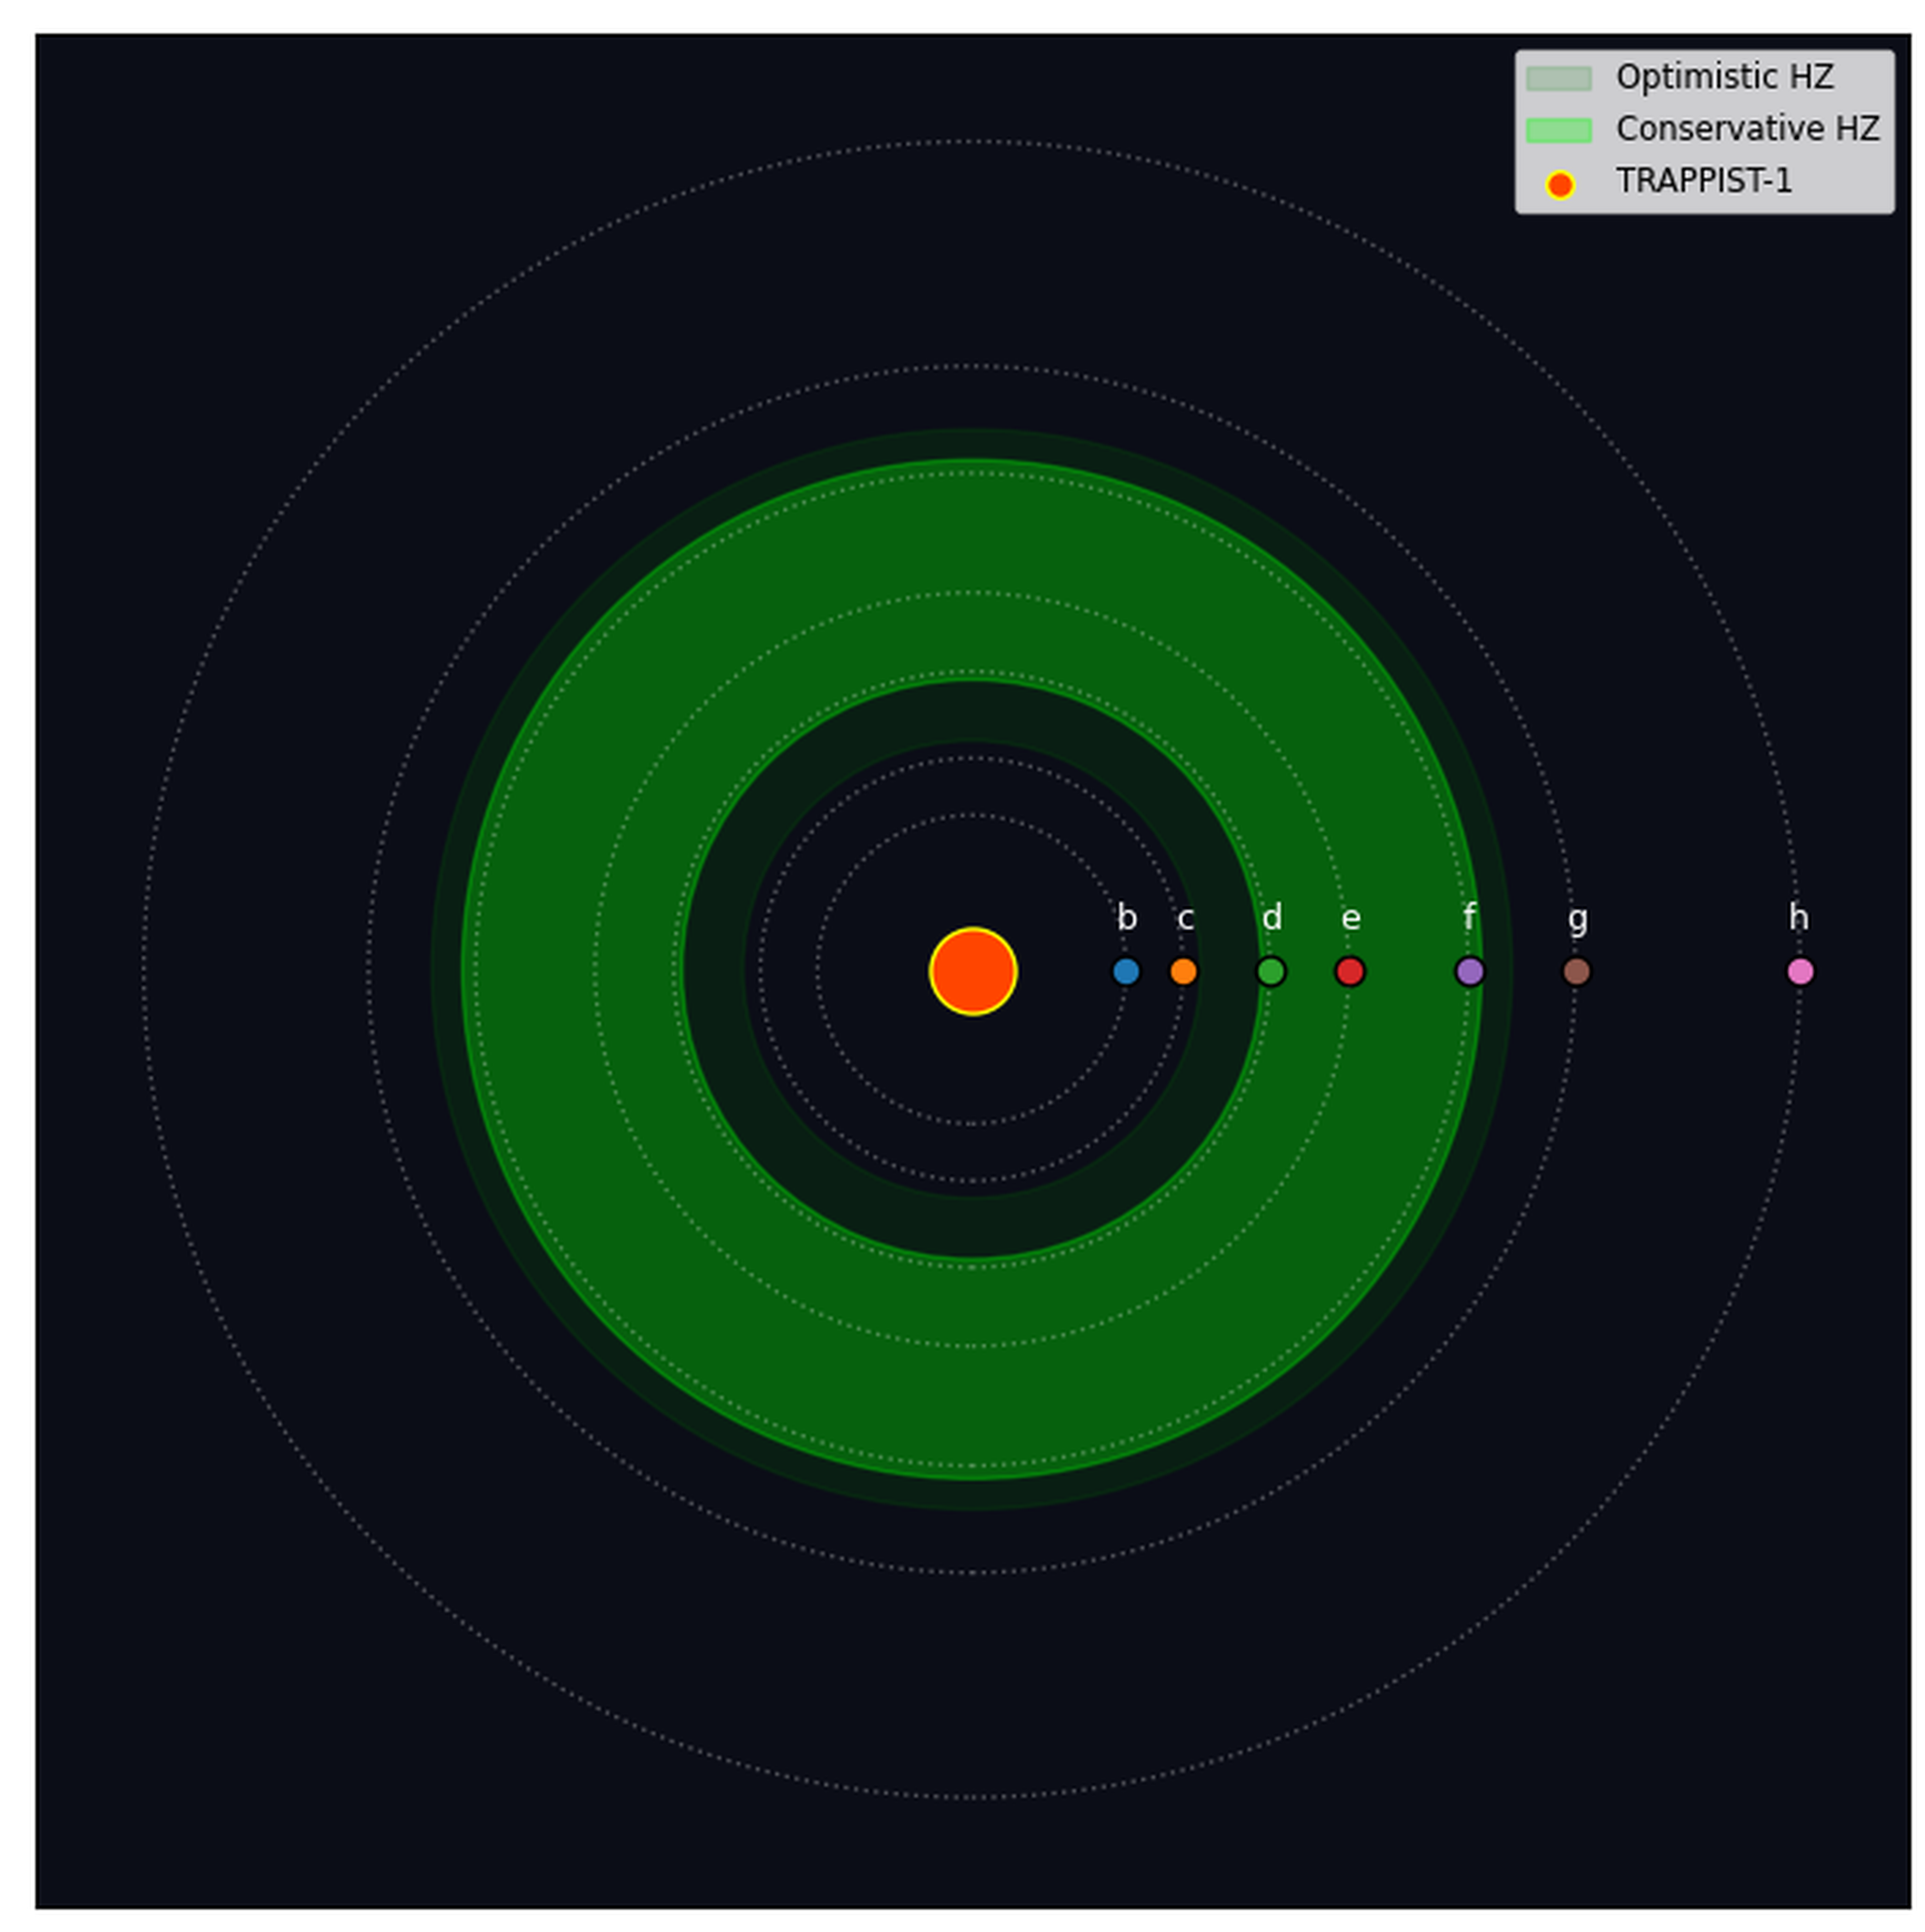
 270 K runaway-greenhouse cutoffs for M-dwarf samples). To note, this range was not derived from a specific habitable-zone model. However, the sample was then further checked with per-star Kopparapu Recent Venus and Early Mars limits1, and the remaining sample is used in this study. Figure S1 illustrates this OHZ/CHZ placement for the TRAPPIST-1 system, selected as an example because it hosts more sampled planets than any other single system in this study. Mass and density were then used to ensure the sample consisted of terrestrial planets, and were not used as filtering criteria to the archive. The mass range was evaluated to not include planets exceeding
 . This was done to prevent the sample from including high-mass gaseous planets, such as Neptune, that do not possess a solid surface to classify as terrestrial planets19. The density was assessed to fall within
 to ensure that only terrestrial rocky planets were analyzed. To compare, the gaseous planets in the Solar System have a mean density of 0.7–1.7
 and are composed primarily of hydrogen and helium, as well as H/He envelopes. Planets exceeding a density of 8 are typically classified as “Super-Mercuries”, metallic core remnants that have undergone mantle stripping and have an iron-rich composition, implying that there may be a lack of volatile materials needed to sustain life.
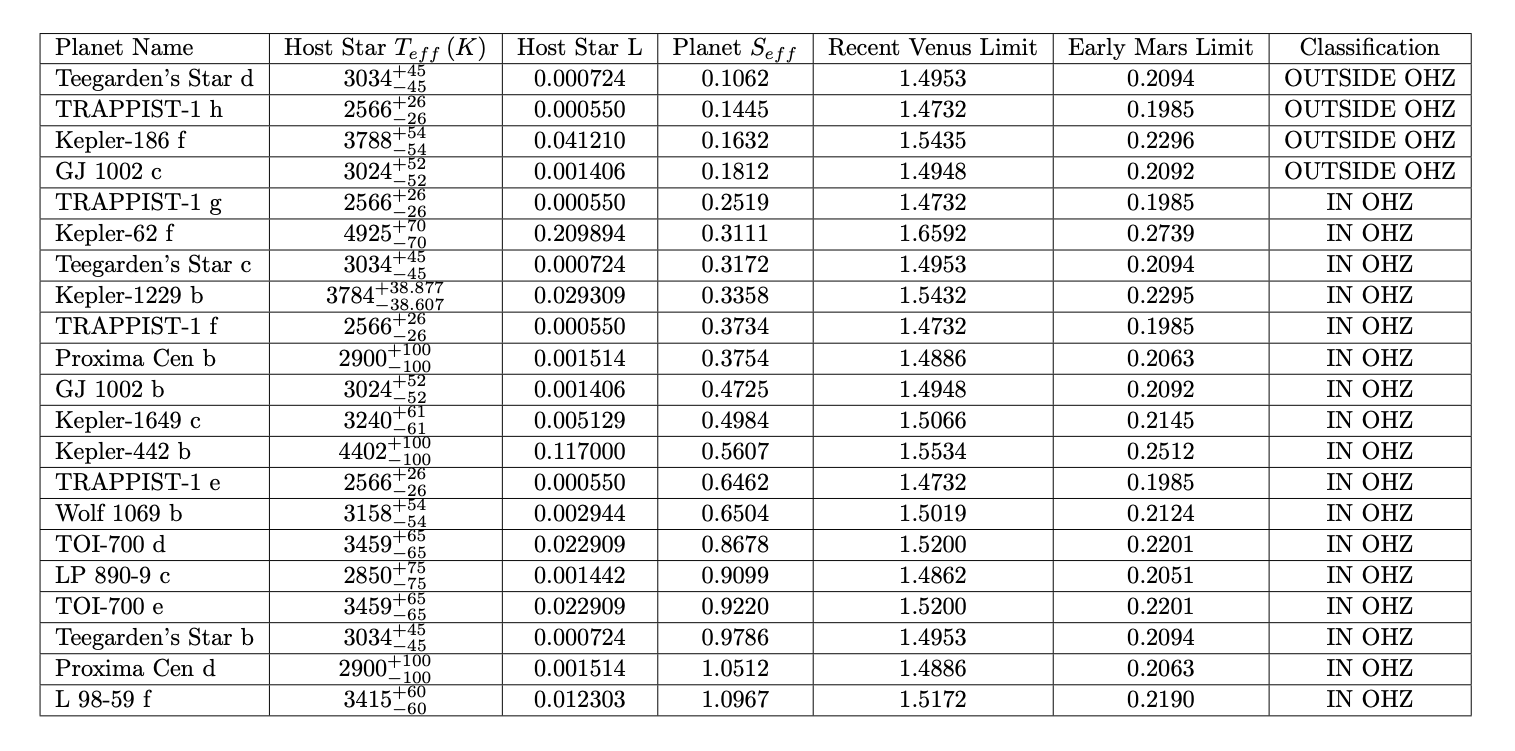
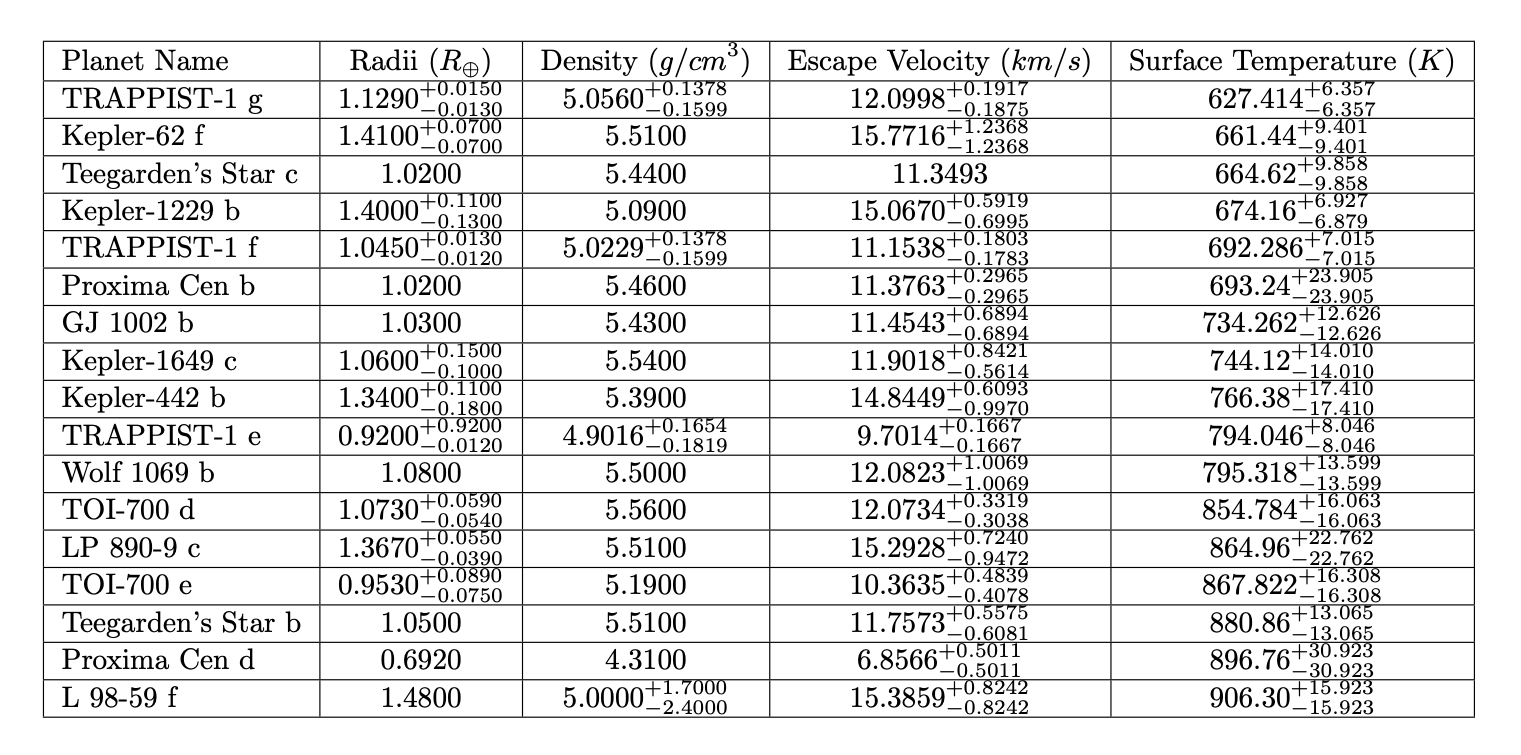
21 exoplanet candidates met the radius/ filters, as well as density and mass checks. However, 4 candidates were excluded upon applying per-star OHZ limits introduced in Kopparapu et al. (2013)1 (See Supplementary Table 1). This left 17 planets for VSI analysis, and their raw measurements used for this study can be found in Supplementary Table 2.
Results
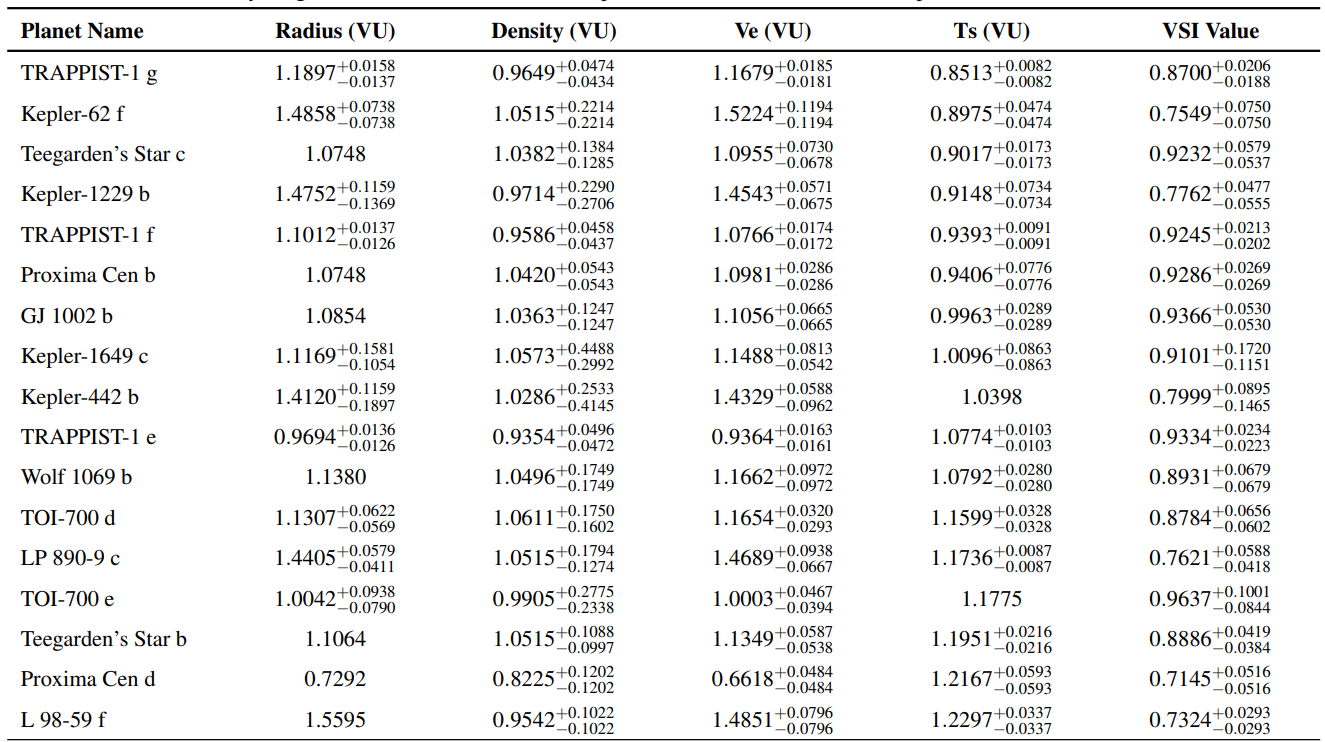
Table 1 shows the 17 exoplanets that fall under the specified parameters. The surface temperatures range from  K to
 K. 11/17 of them were calculated to have a VSI 0.8. This high frequency of high-scoring analogs shows that when equilibrium temperatures are scaled by the Venusian greenhouse factor (
 ), many planets within the “Optimistic Habitable Zone” mathematically align more closely with a runaway greenhouse state than a temperate one. Additionally, 4/11 planets with VSI values above 0.8 fall between the stricter radius range , illustrating the inclusion of larger mass terrestrial planets in our sample.
Holding the greenhouse scaling factor fixed at 3.18, we then tested how the classification count responds to varying the 0.8 threshold (Table 2).
| Threshold | Count |
| 0.7 | 17 |
| 0.75 | 15 |
| 0.8 | 11 |
| 0.85 | 11 |
| 0.9 | 7 |
Varying the threshold from 0.7 to 0.9 shifts the classified count from 17 planets (100.0%) down to 7 planets (41.18%). The study’s stated result of 11 planets (64.71%) at the 0.8 threshold falls roughly in the middle of this range, meaning the count is sensitive to the specific threshold. As seen in Table 2, a shift of 0.05 in either direction changes the count by 2 to 4 planets. We retain 0.8 for consistency with prior VSI and ESI studies, but report this table to demonstrate the threshold’s sensitivity.
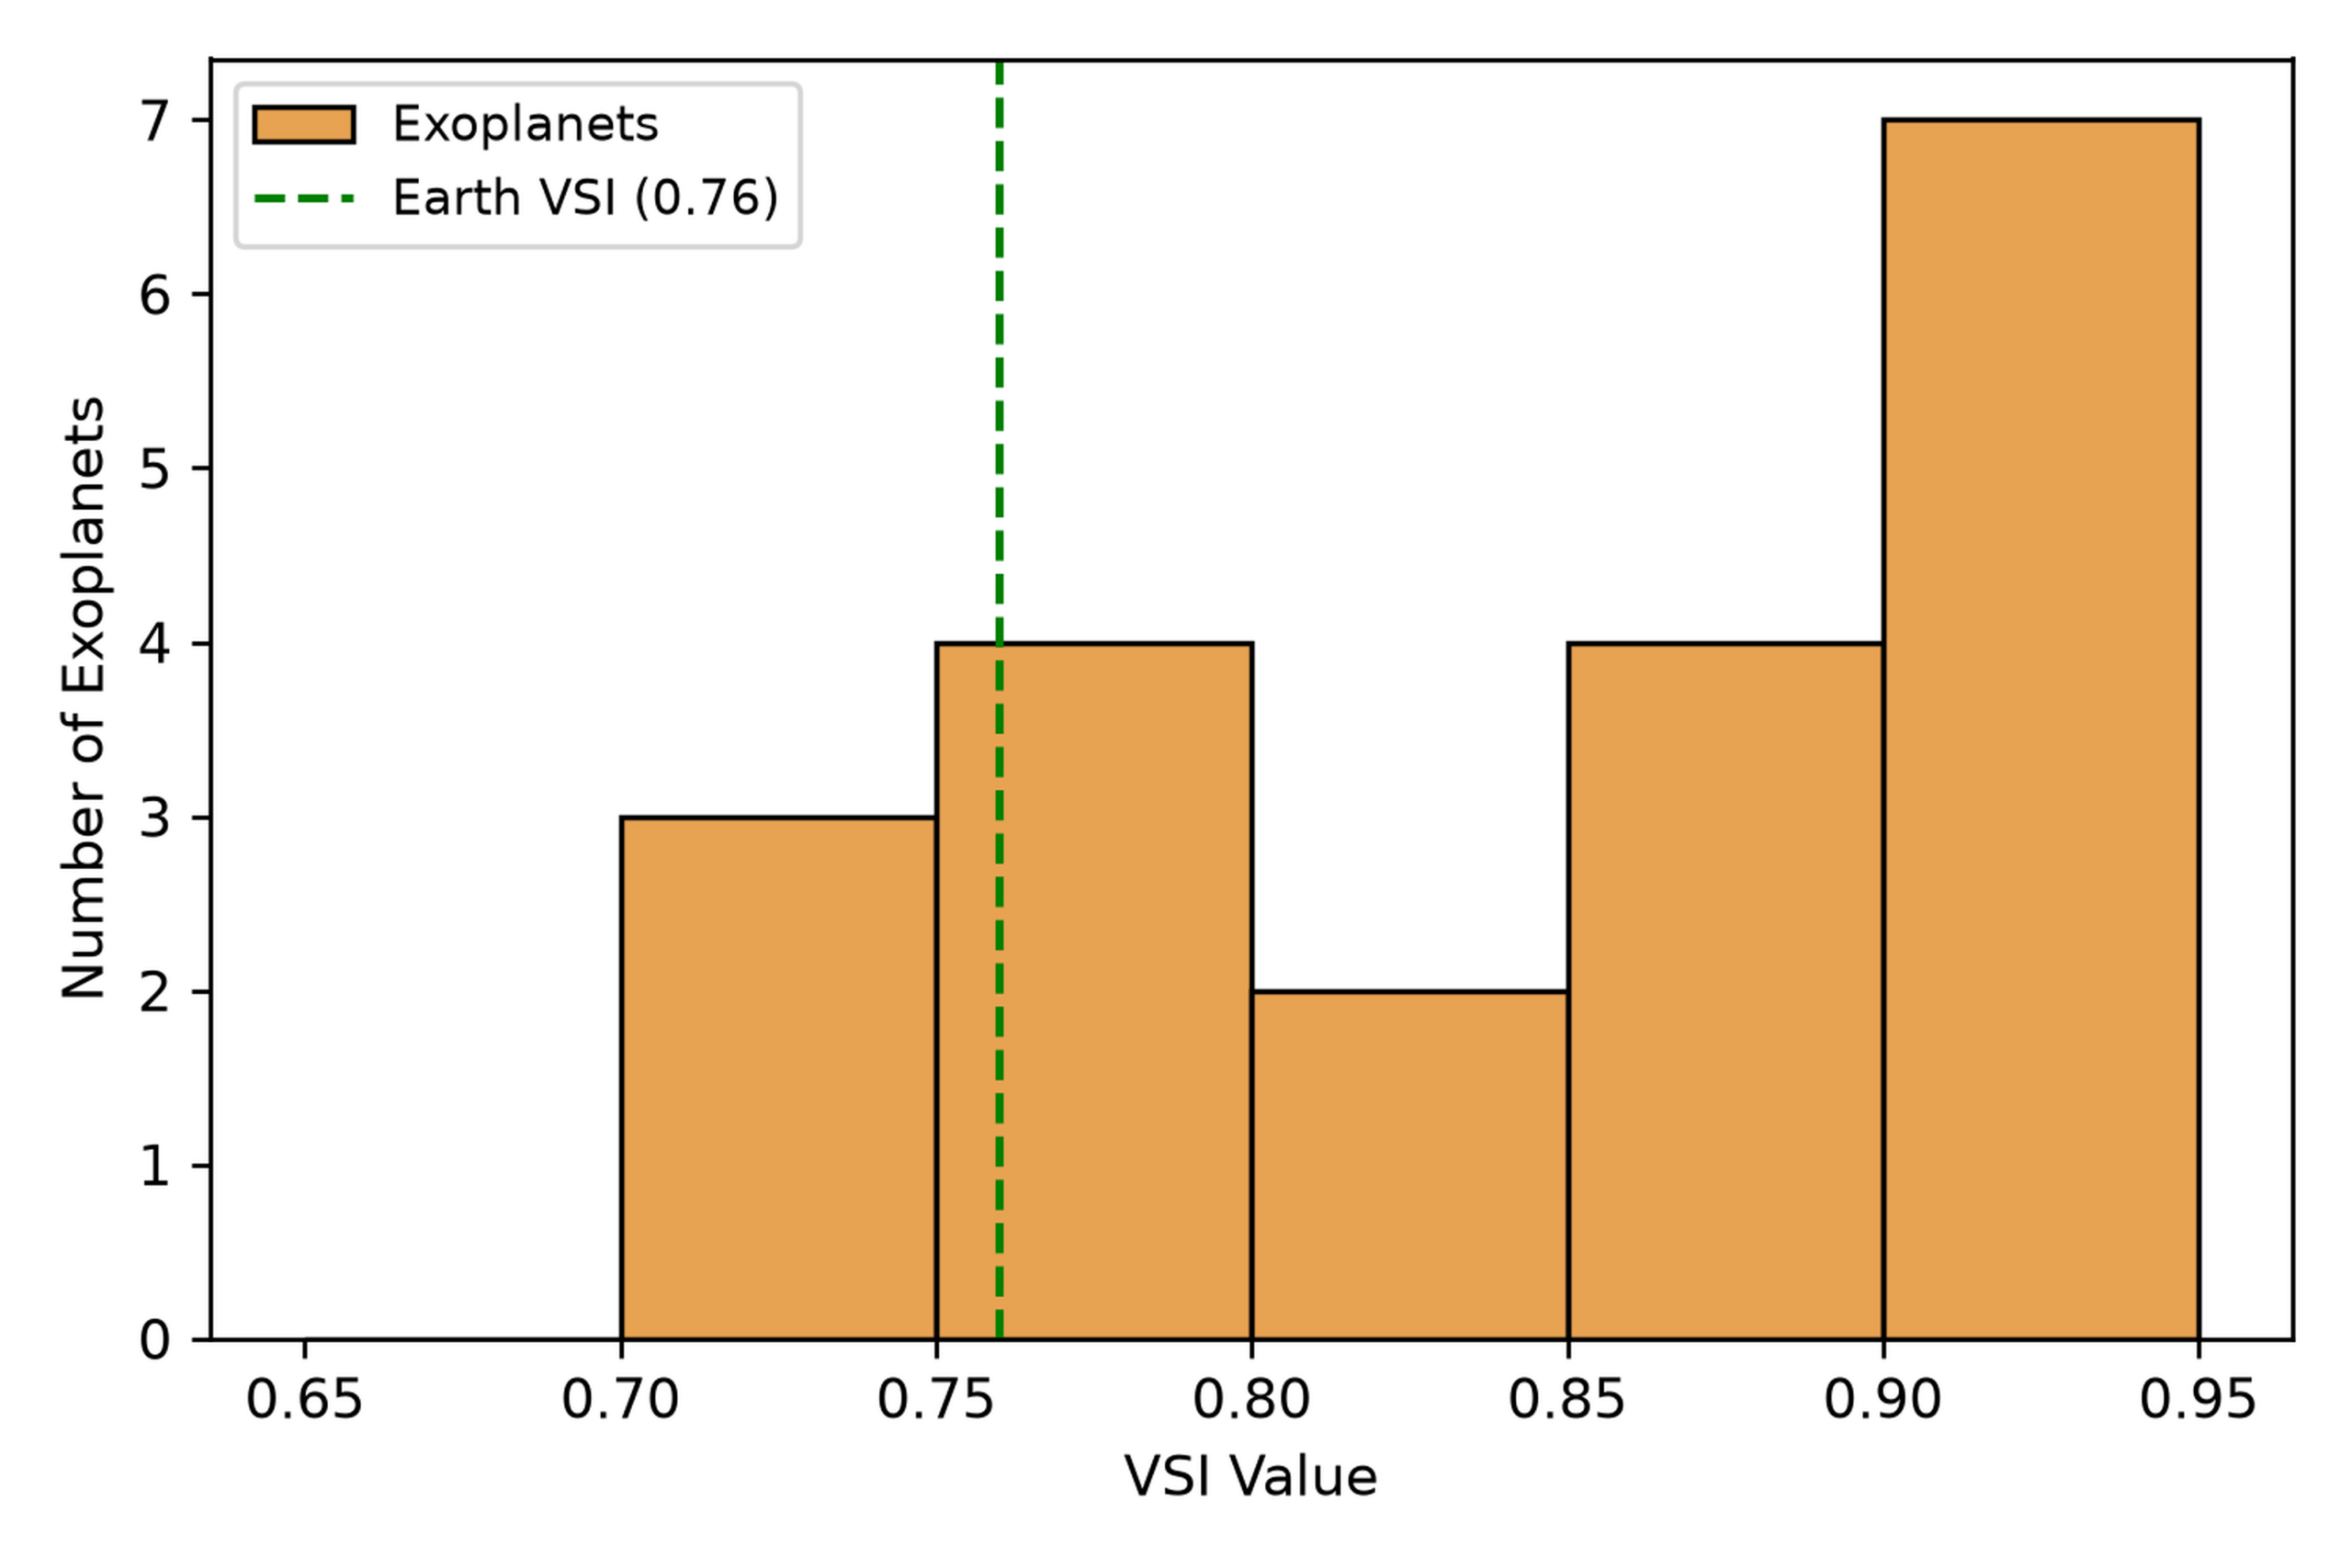
TOI-700 e has the highest VSI score of 0.9637, mirroring the physical and thermal parameters of Venus by 96.37% (Table 3). The eight planets with VSI < 0.8 are highlighted in Table 1. Figure 1 shows how most exoplanets in this sample have a VSI value higher than Earth.
| Name | VSI Value |
|---|---|
| TOI-700 e | 0.9637 |
| GJ 1002 b | 0.9366 |
| TRAPPIST-1 e | 0.9334 |
| Proxima Cen b | 0.9286 |
| TRAPPIST-1 f | 0.9245 |
0.8 Venusian Threshold)| Name | VSI Value |
|---|---|
| LP 890-9 c | 0.7621 |
| Kepler-62 f | 0.7549 |
| Kepler-1229 b | 0.7762 |
| L 98-59 f | 0.7324 |
| Proxima Cen d | 0.7145 |
To test how much the VSI result depends on the greenhouse scaling factor, we reassessed VSI using each planet’s equilibrium temperature (Ts = Teq) compared directly to Venus’s surface temperature of 737 K. Table 5 depicts the resulting scores.
| Planet Name | Radius (VU) | Density (VU) | Ve (VU) | Ts (VU) | VSI Value |
| TRAPPIST-1 g | 1.1897 | 0.9649 | 1.1679 | 0.2677 | 0.6535 |
| Kepler-62 f | 1.4858 | 1.0515 | 1.5224 | 0.2822 | 0.5699 |
| Teegarden’s Star c | 1.0748 | 1.0382 | 1.0955 | 0.2836 | 0.6973 |
| Kepler-1229 b | 1.4752 | 0.9714 | 1.4543 | 0.2876 | 0.5870 |
| TRAPPIST-1 f | 1.1012 | 0.9586 | 1.0766 | 0.2954 | 0.7009 |
| Proxima Cen b | 1.0748 | 1.0420 | 1.0981 | 0.2957 | 0.7041 |
| GJ 1002 b | 1.0854 | 1.0363 | 1.1056 | 0.3133 | 0.7140 |
| Kepler-1649 c | 1.1169 | 1.0573 | 1.1488 | 0.3175 | 0.6972 |
| Kepler-442 b | 1.4120 | 1.0286 | 1.4329 | 0.3270 | 0.6212 |
| TRAPPIST-1 e | 0.9694 | 0.9354 | 0.9364 | 0.3388 | 0.7370 |
| Wolf 1069 b | 1.1380 | 1.0496 | 1.1662 | 0.3393 | 0.7057 |
| TOI-700 d | 1.1307 | 1.0611 | 1.1654 | 0.3647 | 0.7177 |
| LP 890-9 c | 1.4405 | 1.0515 | 1.4689 | 0.3691 | 0.6269 |
| TOI-700 e | 1.0042 | 0.9905 | 1.0003 | 0.3703 | 0.7930 |
| Teegarden’s Star b | 1.1064 | 1.0515 | 1.1349 | 0.3758 | 0.7363 |
| Proxima Cen d | 0.7292 | 0.8225 | 0.6618 | 0.3826 | 0.5971 |
| L 98-59 f | 1.5595 | 0.9542 | 1.4851 | 0.3867 | 0.6150 |
Under this unscaled control, zero of the 17 candidates reach VSI  0.8, with TOI-700 e, this study’s closest Venus analog, reaching only 0.7930, below the established Venusian threshold. This shows that the classification in Table 1 depends on the assumption that these candidates have a CO2-dominated atmosphere, an assumption made by this study rather than tested against any individual planet’s actual atmosphere. The VSI values in Table 1 are therefore treated as answers to the conditional question mentioned in the Methods.
Relationship between VSI Parameters and VSI Score
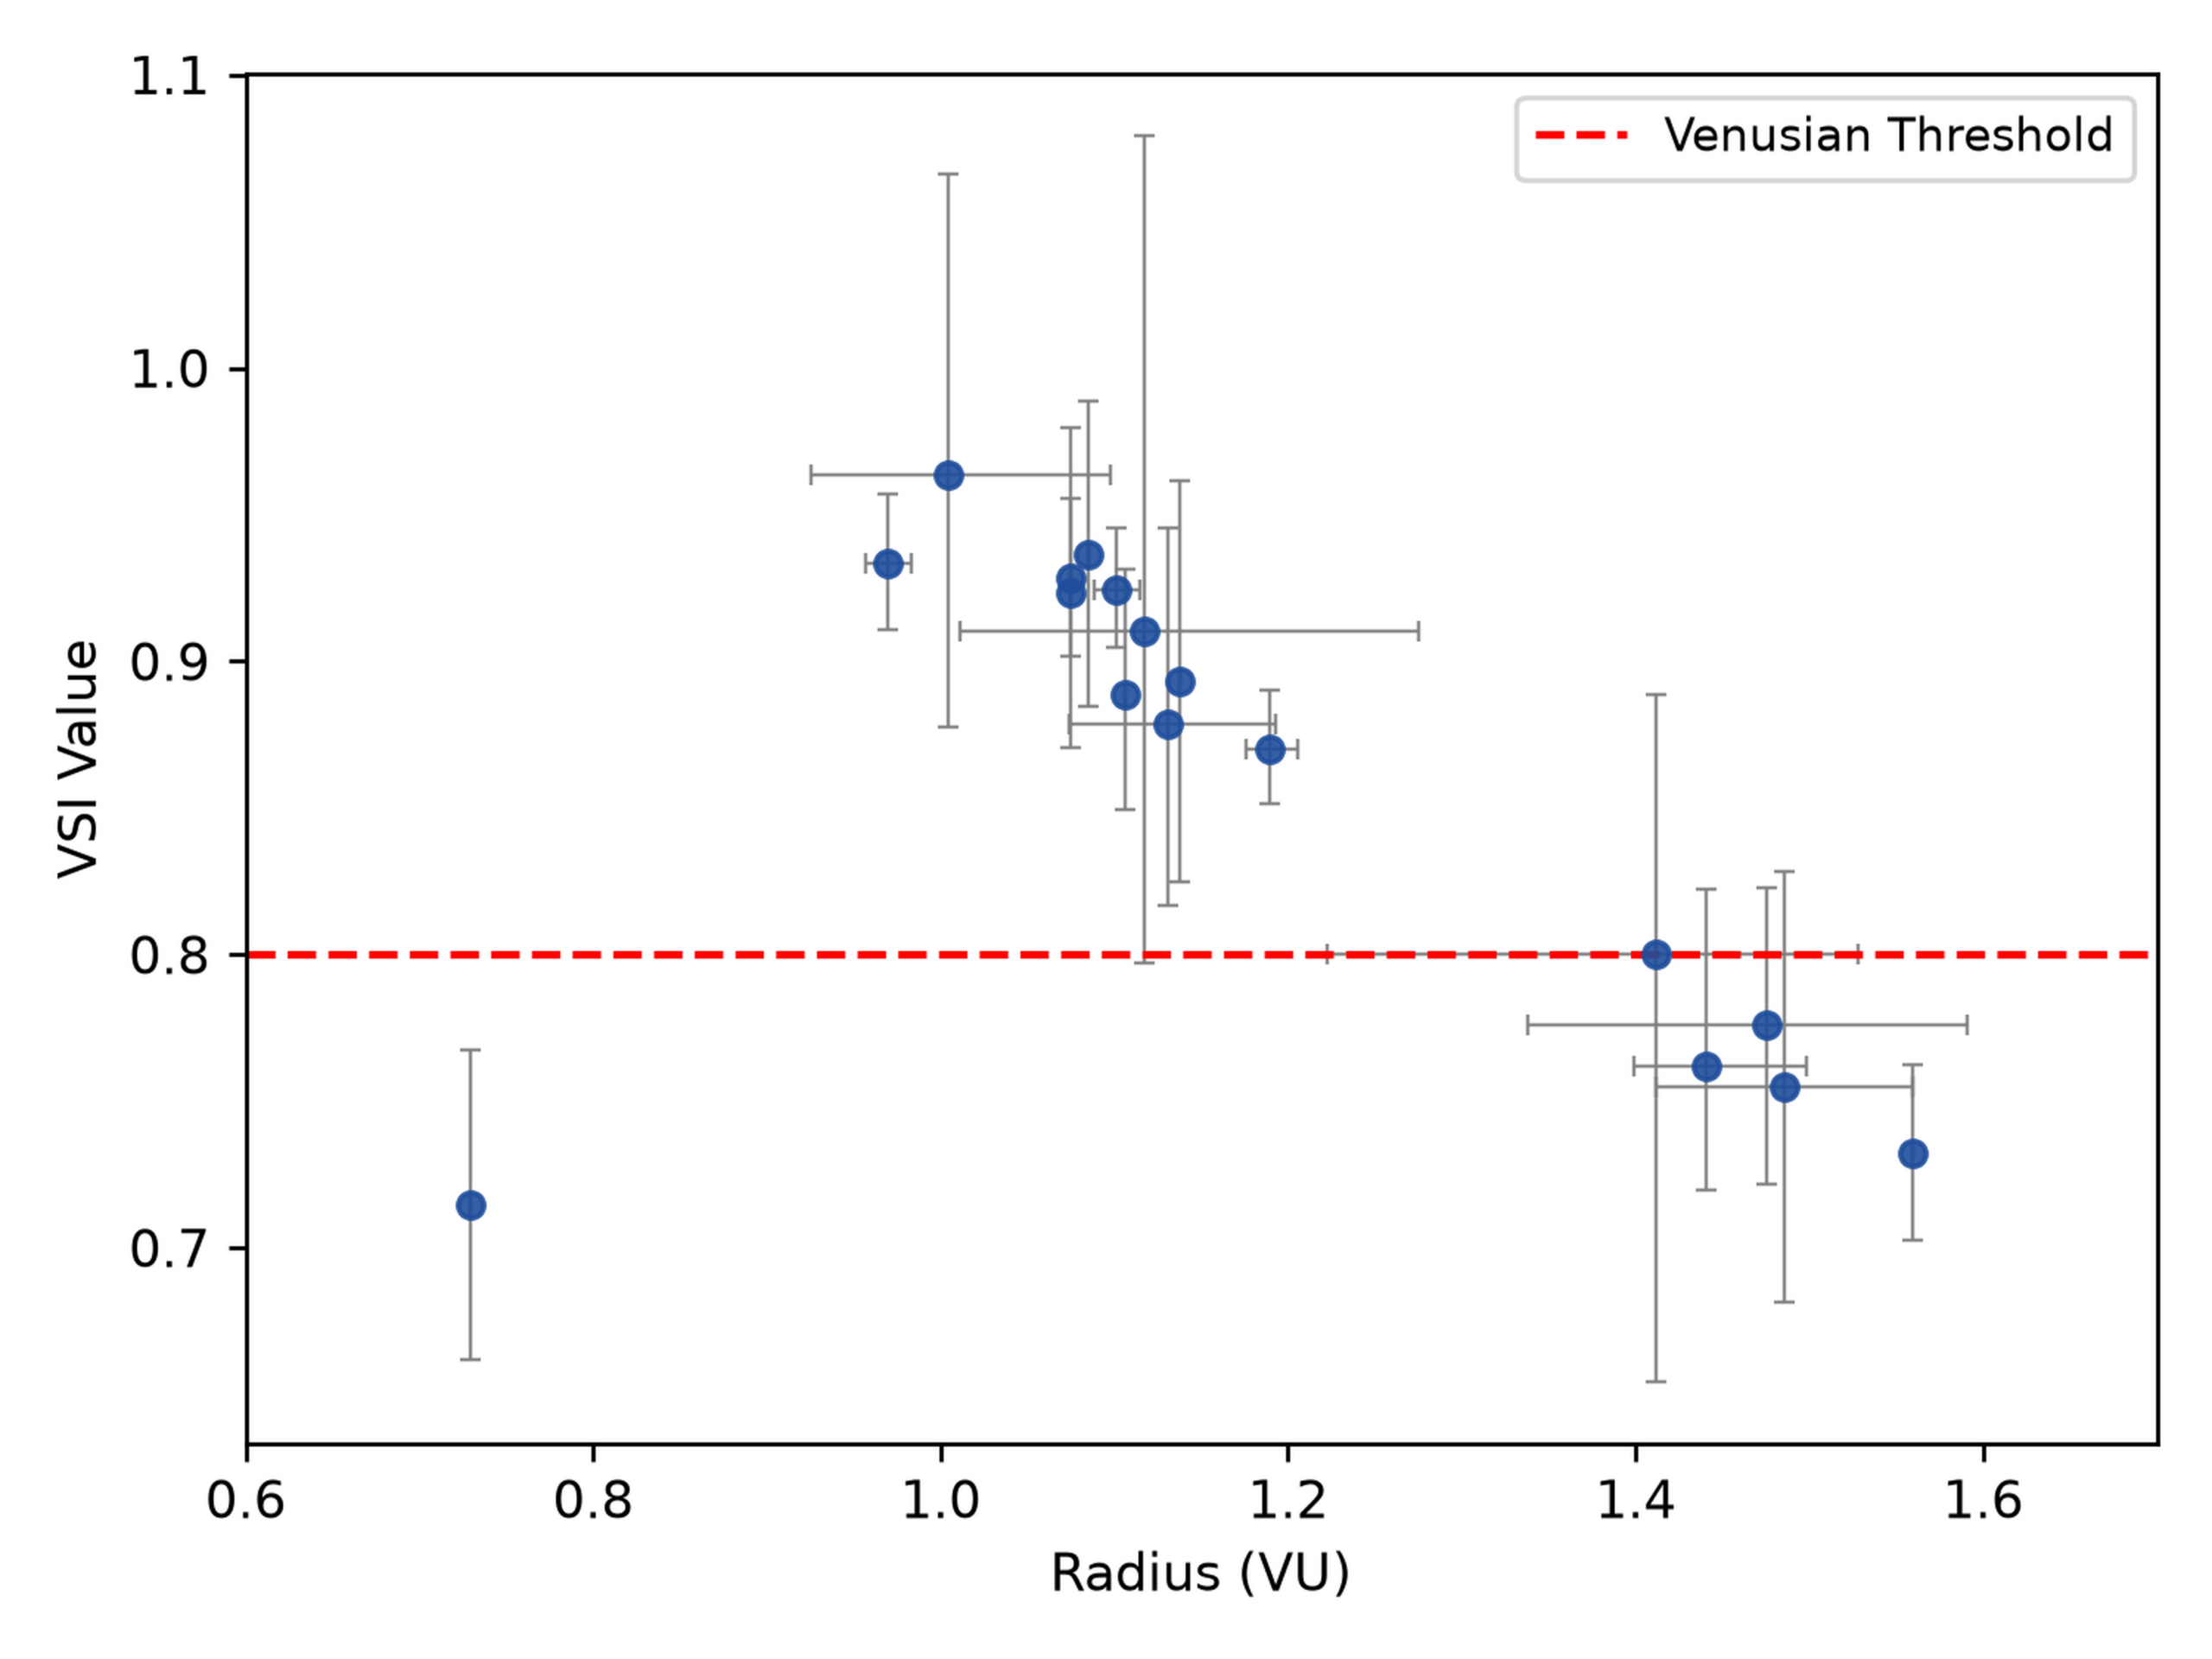
Figure 2 shows the relationship between planetary radius and VSI. Testing this relationship statistically, the radius shows a Pearson correlation of r = −0.505 (p = 0.039, significant) and a Spearman correlation of ρ = −0.625 (p = 0.007, significant) with VSI, suggesting planets with larger radii tend to rank lower in VSI.
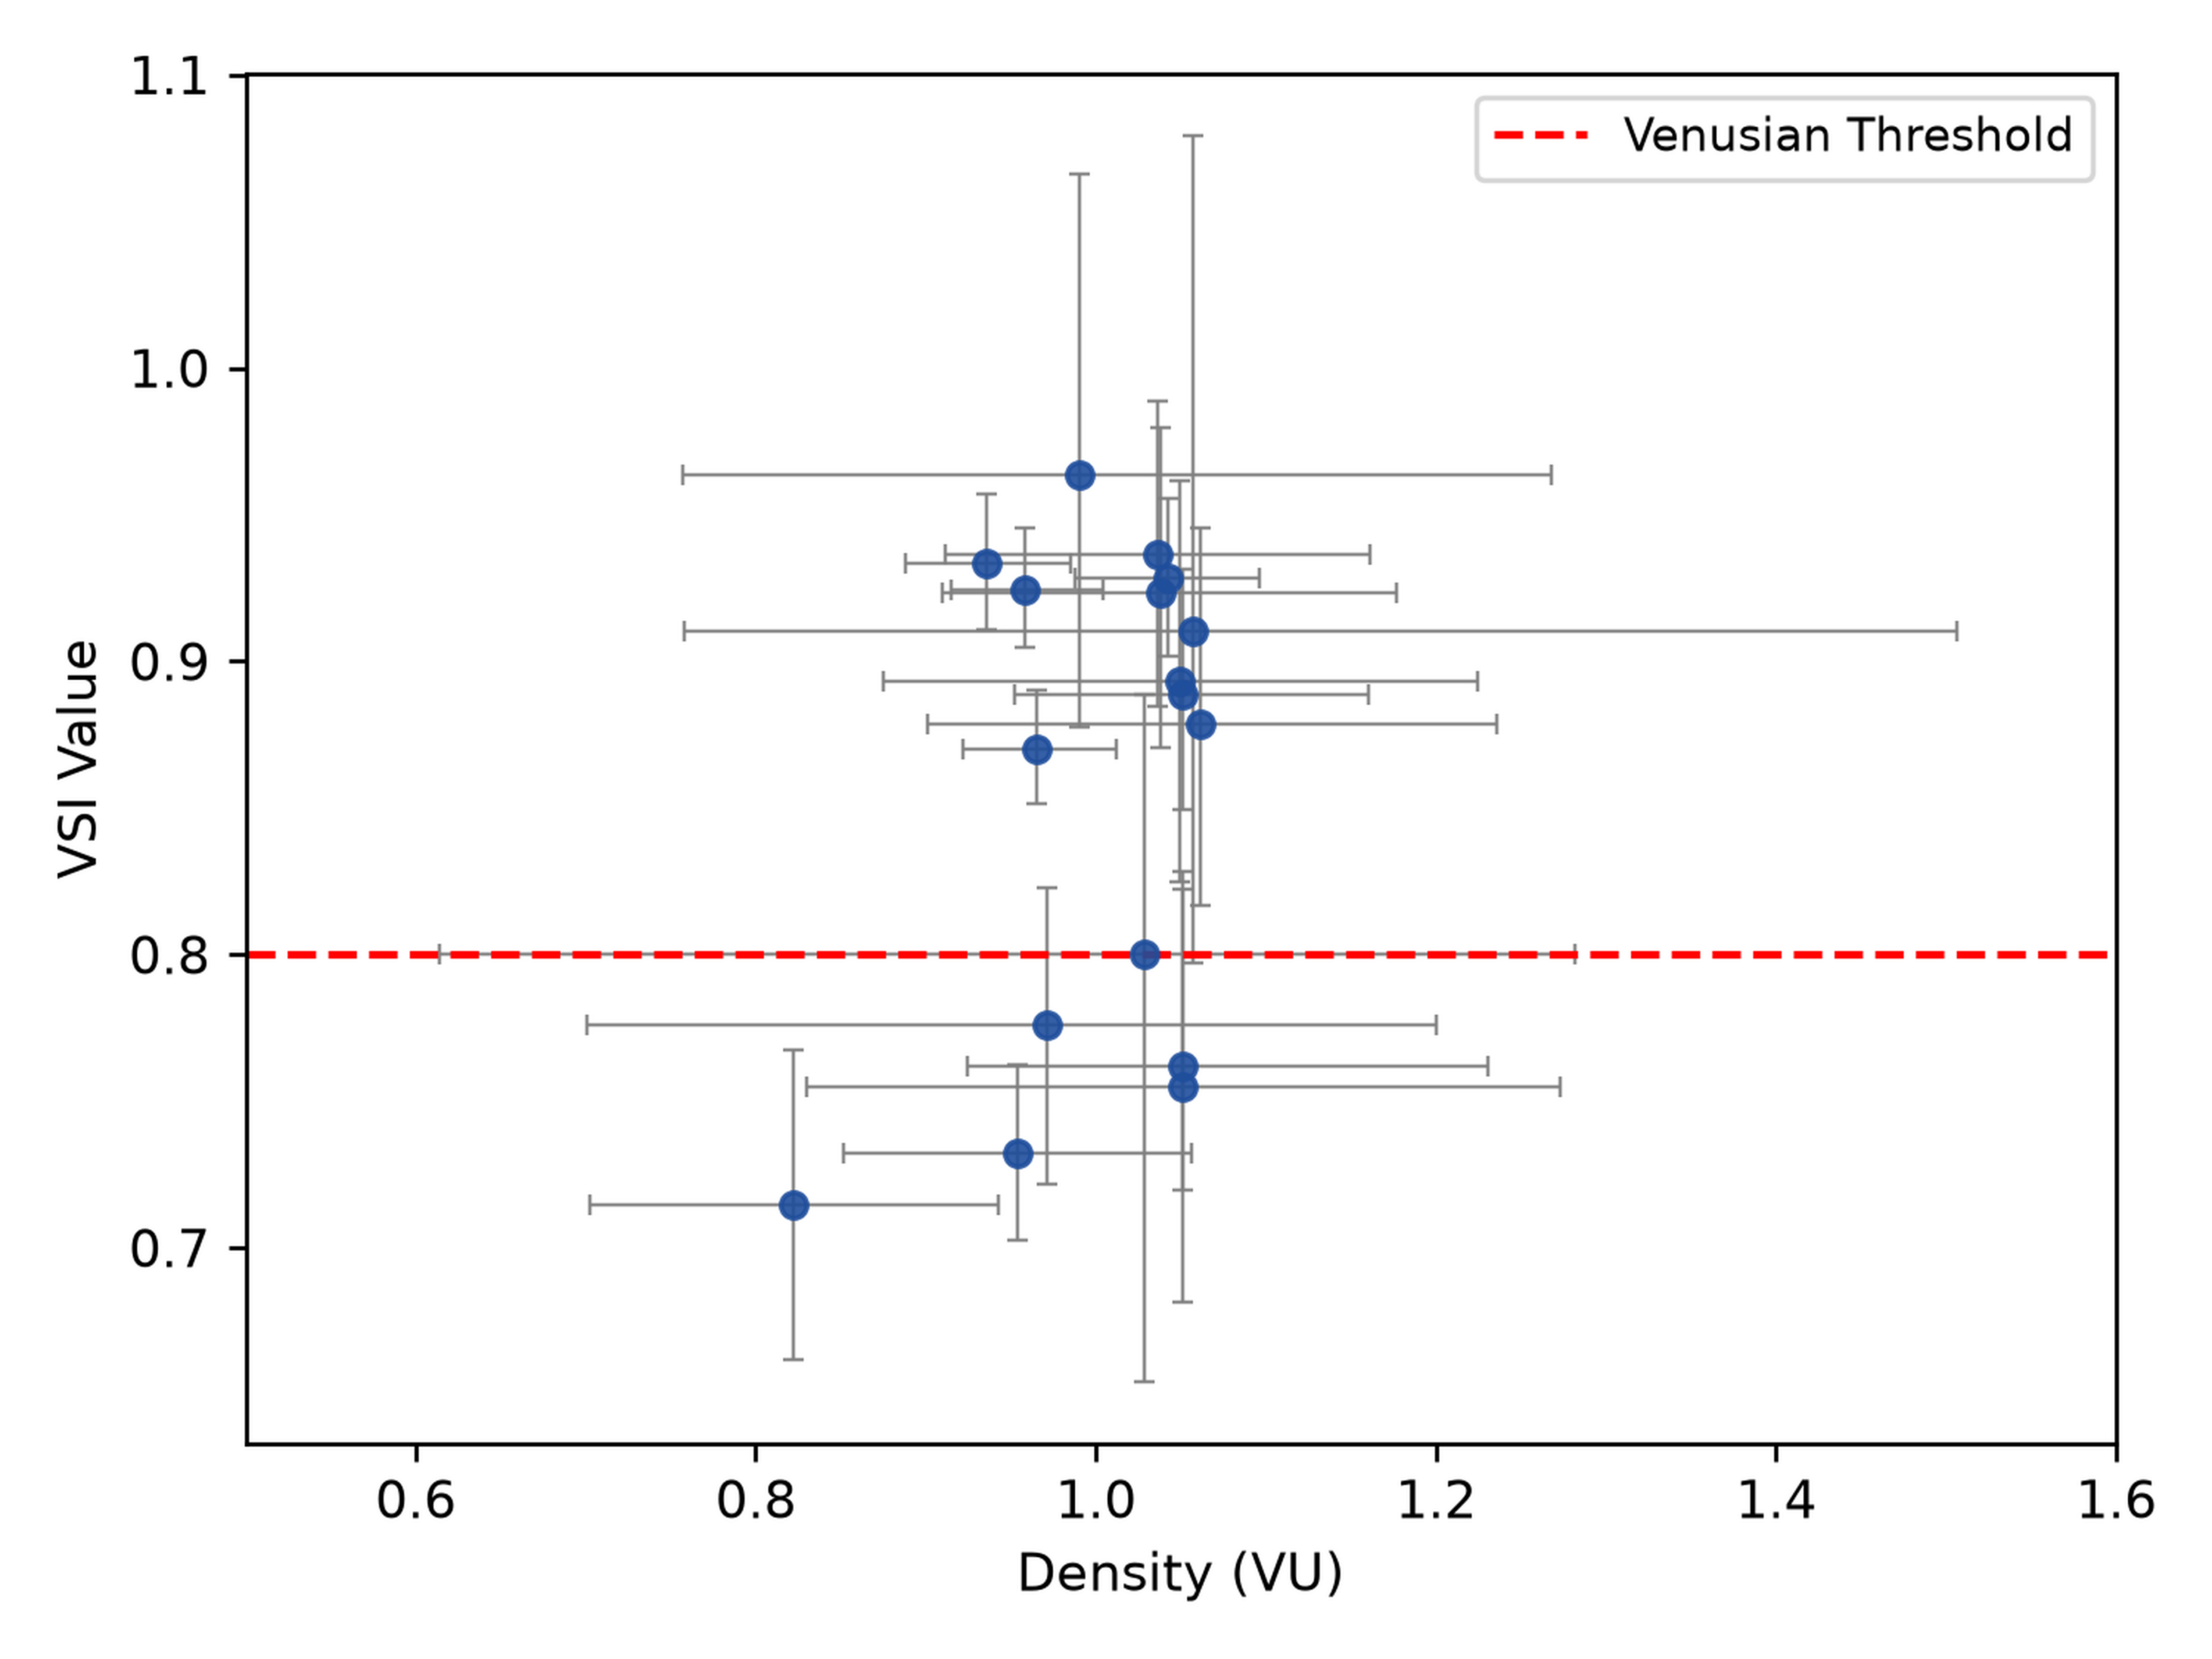
Figure 3 shows the relationship between the bulk density of the planet and the calculated VSI and reveals a domain for the Venusian analogs. As illustrated in Figure 3, while there is no graphical correlation between density and VSI across the entire sample, a high density clustering is seen. All 11 of the planets with VSI 0.8 falls within a narrow density range of 4.90 g/cm3 to 5.56 g/cm3. This aligns with established models suggesting that a specific density threshold is required to maintain the proportions of silicate-metal mantle necessary for sustained volcanic outgassing and the eventual onset of a runaway greenhouse effect20. Density shows no statistically significant correlation with VSI (Pearson r = 0.341, p = 0.180; Spearman ρ = 0.044, p = 0.866), consistent with the absence of a clear visual trend.
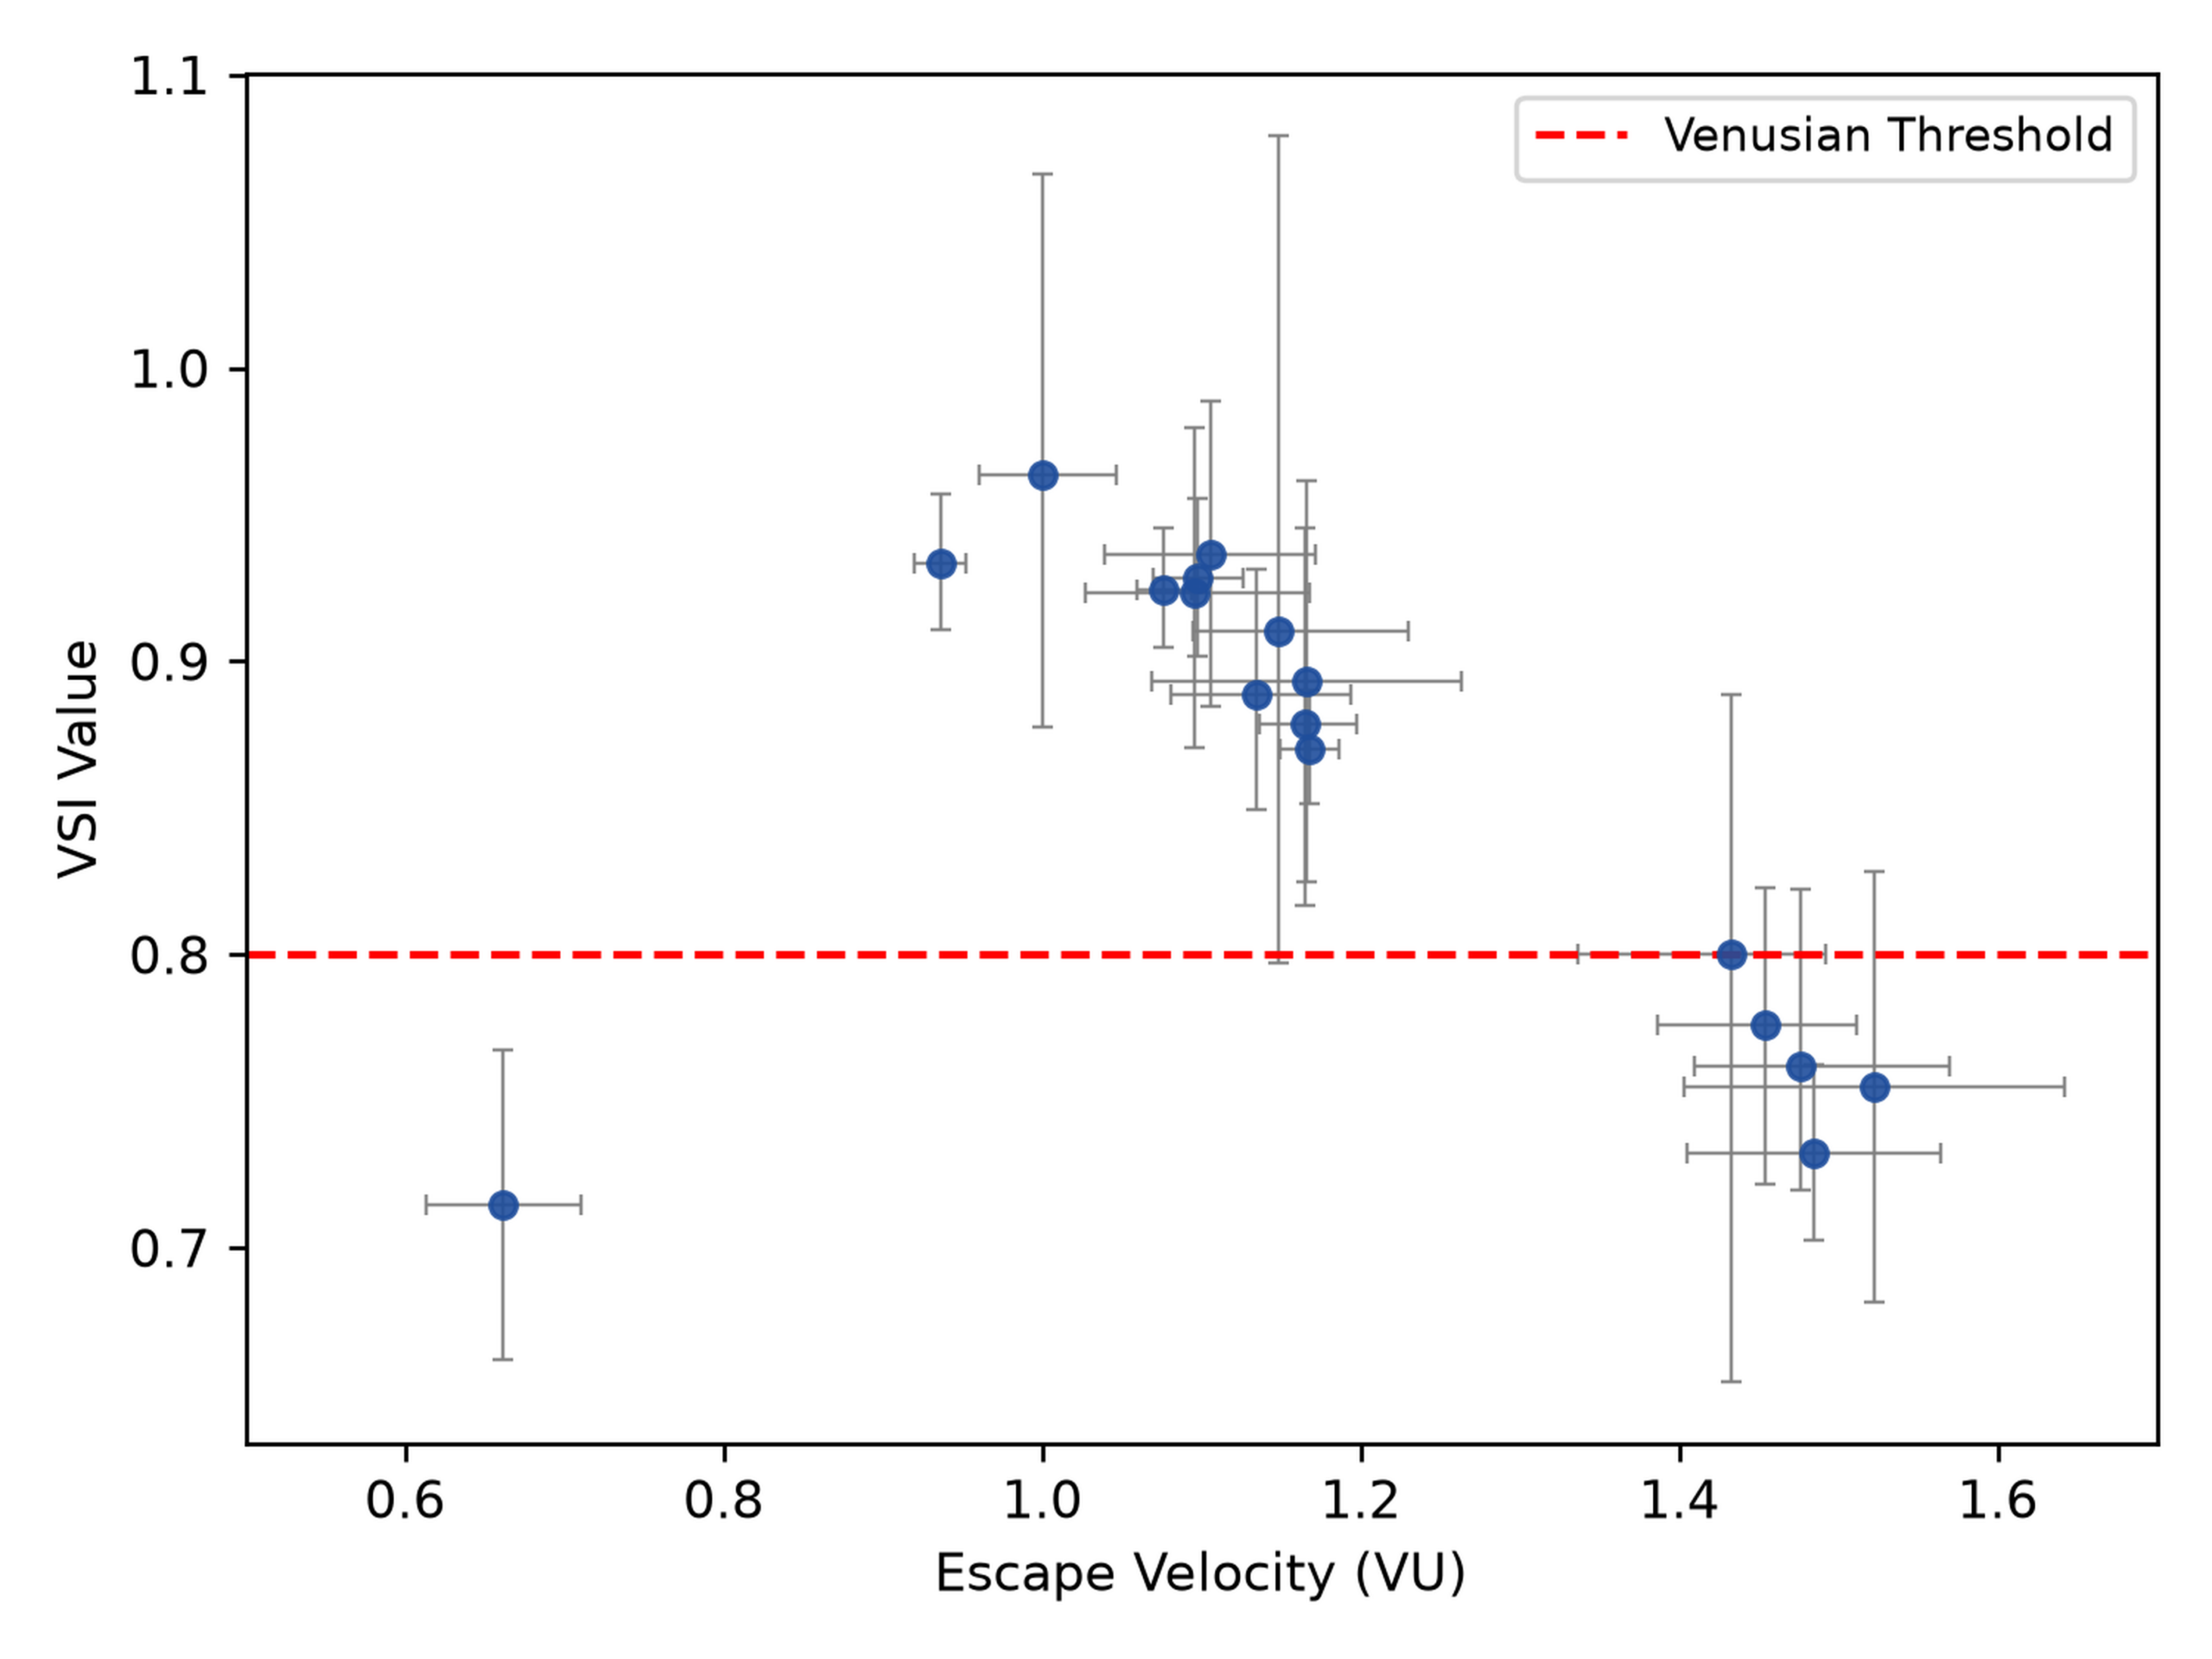
Planets that exceed the Venusian threshold have escape velocities between 10 km/s ≤ v ≤ 20 km/s, as seen in Figure 4. This is important to note, as escape velocity can help us determine whether the planet has a thick enough atmosphere to maintain gases, and therefore potentially the proper gases needed for life like oxygen, carbon dioxide, and nitrogen21. Low escape velocities directly correlate with an inability to retain an atmosphere, which would not allow for a runaway greenhouse effect to occur21. Showing a Pearson correlation of r = −0.432 (p = 0.083, not significant) and a Spearman correlation of ρ = −0.615 (p = 0.009, significant) with VSI, suggesting planets with higher escape velocities tend to rank lower, which is not fully captured by a linear model.
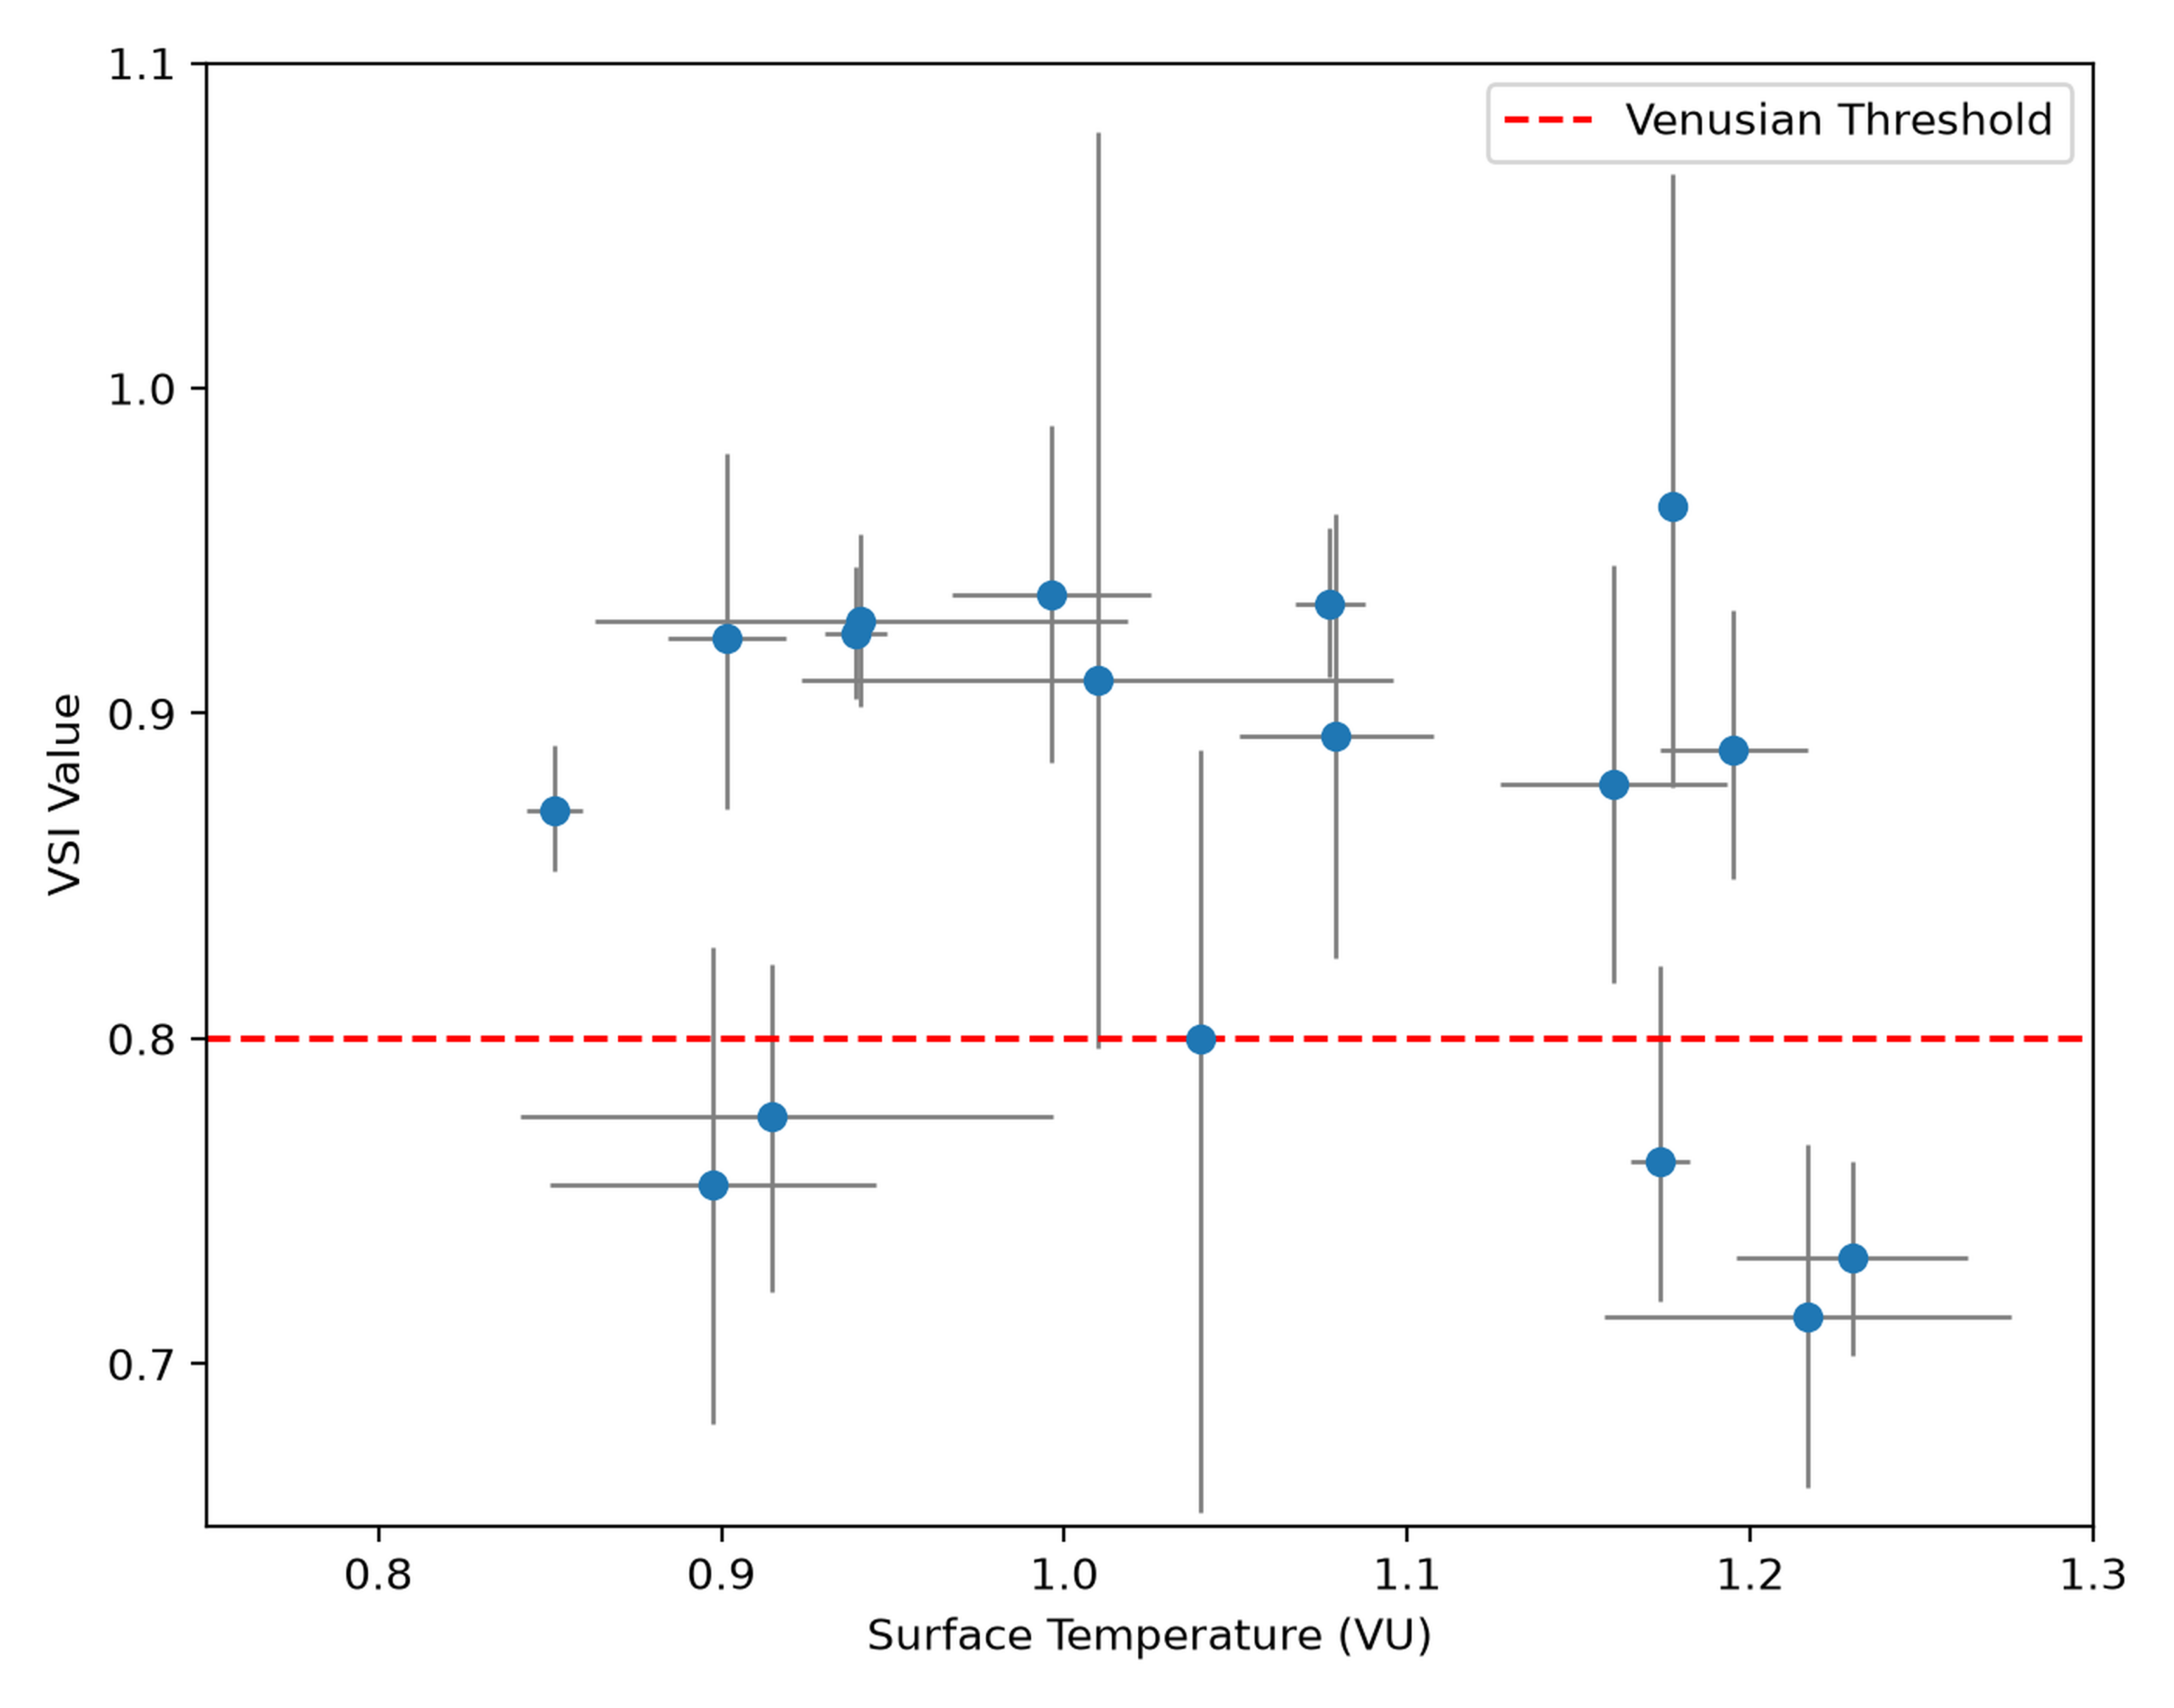
Figure 5 shows the relationship between surface temperature and VSI. This parameter shows no statistically significant correlation with VSI by either measure (Pearson r = −0.246, p = 0.341; Spearman ρ = −0.181, p = 0.486), consistent with the absence of a clear trend in the figure. However, most high VSI candidates cluster in the 600 K – 900 K range. Consequently, these high temperatures exceed the known limits for biological life. Studies demonstrate that hyperthermophilic extremophiles can only survive and reproduce at temperatures up to approximately 394 K or 121℃22, a threshold nearly 300 K lower than the greenhouse scaled temperatures projected in this study. While liquid water can exist at higher temperatures under sufficient atmospheric pressure, organic macromolecules and cellular structures degrade rapidly under such conditions23. Furthermore, at these scales, the kinetic energy of water molecules exceeds the intermolecular forces required for the liquid phase of water, leading to total oceanic evaporation and the loss of hydrogen via photodissociation24. However, Venus did not have enough water vapor in its atmosphere for the runaway greenhouse to cause huge amounts of photodissociation, but only experienced more water vapor in its lower atmosphere and increased surface temperature25.
Geologically, a surface temperature between 600 K and 900 K dictates a state of extreme environmental hostility, similar to Venus’s active volcanism and highly acidic clouds26. Under extreme runaway greenhouse gas conditions, massive volcanic outgassing on Venus builds a thick CO2 atmosphere with trace amounts of other gases, resulting in surface pressures up to ~ 92-93 times that of Earth, as observed on present day Venus27,10. Biologically, these conditions provide no refuge for existing life, although the idea of sulfur based life has been introduced in Schulze-Makuch et al., 200417,26.
Discussion
S. Raviprakash et al., 202616 provided the foundation for this study and also applied the VSI Formula to exoplanets, but included stricter parameters on the planets that were selected. This study included planets that may be classified as Super-Earths, making the sample more inclusive of larger terrestrial planets found within the HZ of a star.
The classification of exoplanets within the “Optimistic Habitable Zone” (OHZ) often provides a false sense of biological potential by prioritizing orbital distance over atmospheric evolution. Although the OHZ identifies regions where liquid water could exist under ideal conditions, it frequently fails to account for the “Venusian Divergence”: the process by which a terrestrial planet’s atmosphere enters a self-sustaining loop of heat retention. By applying the 3.18 greenhouse scaling factor to this sample, it becomes evident that many candidates previously hailed as Earth-like would be thermal analogs to Venus. This suggests that the OHZ boundaries are overly generous, as they do not factor in the “Venus Zone”18, where high insolation flux triggers a runaway greenhouse effect that permanently desiccates the surface. As argued by Jakosky and Byrne (2025)28, the divergent paths of Earth and Venus demonstrate that initial location is a poor predictor of final habitability. Consequently, planets such as TOI-700 e, despite their OHZ status, demonstrate how the sheer magnitude of greenhouse forcing could override any potential for a temperate climate1. Overall, TOI-700 e has almost identical parameters as Venus, which causes it to suffer from extreme conditions if the necessary gases are present.
The threshold for a planet to be similar to Earth using the Venus Similarity Index is 0.76, but this does not by itself establish that a planet is an Earth analog. A low VSI score means that a planet is dissimilar to Venus; a planet with a VSI value near 0.76 could be tidally locked, a cryoplanet, or a sub-Neptune with a small, rocky core, and still appear numerically close to Earth’s reference value for reasons unrelated to habitability. A more genuine Earth-similarity claim would require comparison with the Earth Similarity Index17. Taking that into account, the presence of several planets with VSI near 0.76 even after applying the greenhouse scaling factor suggests that some planets may remain comparatively resistant to Venus-like divergence under this study’s assumptions. These findings reinforce the importance of incorporating atmospheric evolution into future habitability assessments rather than relying primarily on orbital position.
Limitations
This study assumed that all planets have a Venus-like atmosphere and lack magnetic field shielding, with a thick CO2 composition, allowing the greenhouse scaling factor of 3.18 to be applicable. This approach of using the VSI does not predict actual atmospheric conditions, cannot model albedo variations, and does not account for variability in atmospheric conditions, but instead models a hypothetical Venus-like evolutionary pathway. In reality, some of these planets may not have or may never have a dense, CO2-rich atmosphere. Nevertheless, there are other greenhouse gases that absorb strongly in the infrared spectrum such as water vapor, nitrous oxides, and methane29. To test how sensitive our results are to the assumption, we recalculated the fraction of Venus analogs across greenhouse scaling factors ranging from f = 1.0 to f = 3.5 (Figure 6). The analysis indicates that our findings depend heavily on whether substantial greenhouse amplification occurs, but are comparatively insensitive to the specific magnitude of that amplification once assumed.
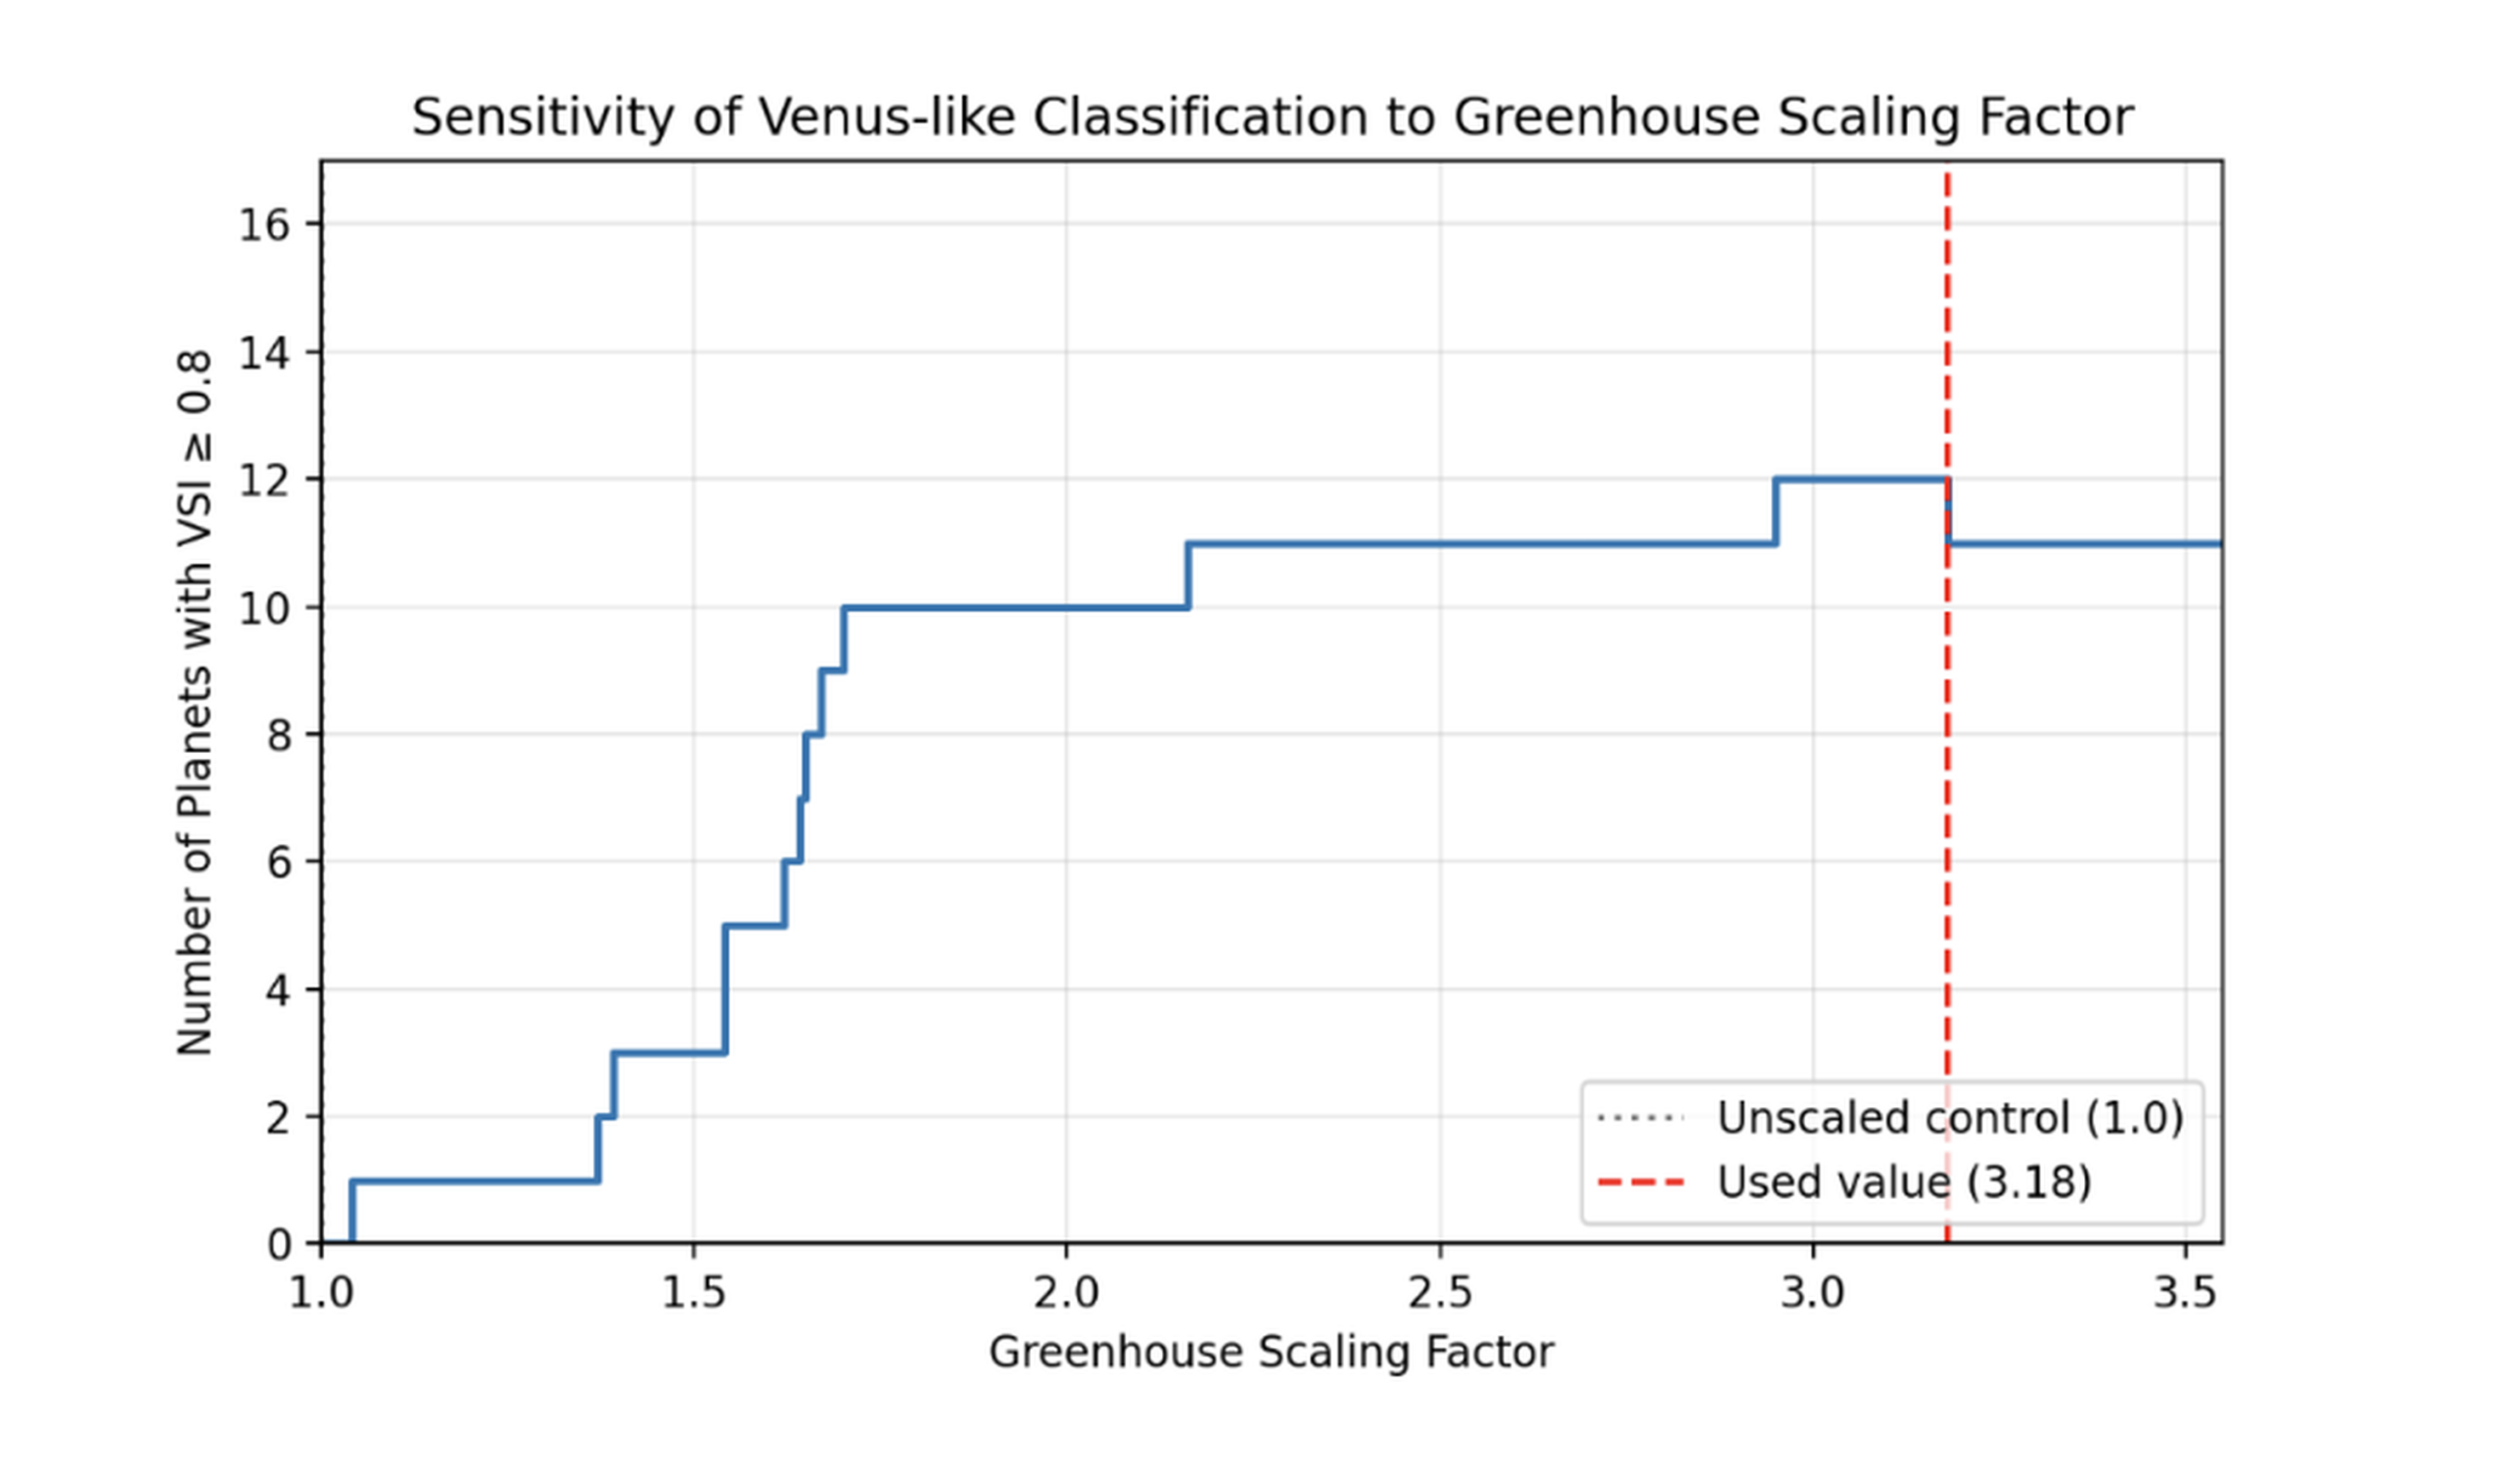 0.8) is shown as a function of the assumed greenhouse scaling factor, f.
Additionally, many of these planets orbit M-type stars and may be tidally locked13,14. If this is true, the planet would most likely experience weather and temperature instability, which can either radically trigger runaway greenhouse or shift to more freezing states. Altogether, this study models a hypothetical Venusian evolutionary pathway rather than claiming that these planets definitely possess Venus-like atmospheres. Future studies could test a range of scaling factors to see how sensitive these classifications are to atmospheric assumptions.
Conclusion
This study applied a Greenhouse Scaling factor of 3.18, found from the ratio of TS, Venus/Teq, Venus, to exoplanets with similar parameters to Earth and utilized the VSI formula proposed in S. Raviprakash et al., 202616, to investigate how similar those exoplanets would be to Venus if they were to undergo a runaway greenhouse effect under Venus-like conditions. We found that of the sample, after Kopparapu OHZ limits were applied, of 17 exoplanets 11 have a VSI score > 0.8. Some popular exoplanets believed to be able to host life, such as TOI-700 e (VSI = 0.9637), TRAPPIST-1 e (VSI = 0.9334), TRAPPIST-1 f (VSI = 0.9245), and TRAPPIST-1 g (VSI = 0.8700), have high VSI values, demonstrating how greenhouse gases can dramatically alter the habitability of terrestrial planets within the HZ. This leads us to conclude that atmospheric evolution of exoplanets is a critical factor in determining long-term habitability, as many within the HZ of their host star could evolve towards Venus-like conditions if greenhouse gases dominate the atmosphere.
Acknowledgments
The author thanks Harshil Soni for his detailed review, constructive feedback, and scientific revisions throughout the development of this paper. His insights on exoplanet habitability and the manuscript structure greatly contributed to improving the clarity and overall quality of this work. This research has made use of the NASA Exoplanet Archive, which is operated by the California Institute of Technology, under contract with the National Aeronautics and Space Administration under the Exoplanet Exploration Program.
Supplementary Figures
Equation S1 | Planetary Equilibrium Temperature Equation
References
- Kopparapu, Ravi Kumar, Ramses Ramirez, James F. Kasting, et al. 2013. “HABITABLE ZONES AROUND MAIN-SEQUENCE STARS: NEW ESTIMATES.” The Astrophysical Journal 765 (2): 131. https://doi.org/10.1088/0004-637x/765/2/131. [↩] [↩] [↩] [↩]
- Schwieterman, Edward W., Christopher T. Reinhard, Stephanie L. Olson, Chester E. Harman, and Timothy W. Lyons. 2019. “A Limited Habitable Zone for Complex Life.” The Astrophysical Journal 878 (1): 19. https://doi.org/10.3847/1538-4357/ab1d52. [↩] [↩]
- Wandel, Amri. 2025. Exoplanets Beyond the Conservative Habitable Zone: I. Habitability. https://arxiv.org/abs/2510.00736. [↩] [↩]
- Way, M. J., A. D. Del Genio, M. Kelley, I. Aleinov, and T. Clune. 2016. Exploring the Inner Edge of the Habitable Zone with Fully Coupled Oceans. https://arxiv.org/abs/1511.07283. [↩] [↩] [↩]
- Salvador, A., G. Avice, D. Breuer, et al. 2023. “Magma Ocean, Water, and the Early Atmosphere of Venus.” Space Science Reviews 219 (6): 51. https://doi.org/10.1007/s11214-023-00995-7. [↩]
- Westall, Frances, Dennis Höning, Guillaume Avice, et al. 2022. “The Habitability of Venus and a Comparison to Early Earth.” ESS Open Archive, ahead of print. https://doi.org/10.1002/essoar.10512790.1. [↩]
- Chassefière, Eric, Rainer Wieler, Bernard Marty, and François Leblanc. 2012. “The Evolution of Venus: Present State of Knowledge and Future Exploration.” Planetary and Space Science 63–64: 15–23. https://doi.org/10.1016/j.pss.2011.04.007. [↩] [↩]
- Goldblatt, Colin, and Andrew J. Watson. 2012. “The Runaway Greenhouse: Implications for Future Climate Change, Geoengineering and Planetary Atmospheres.” Philosophical Transactions of the Royal Society A: Mathematical, Physical and Engineering Sciences 370 (1974): 4197–216. https://doi.org/10.1098/rsta.2012.0004. [↩]
- Walker, James C. G., P. B. Hays, and J. F. Kasting. 1981. “A Negative Feedback Mechanism for the Long-Term Stabilization of Earth’s Surface Temperature.” Journal of Geophysical Research: Oceans 86 (C10): 9776–82. https://doi.org/10.1029/JC086iC10p09776. [↩]
- LoPresto, James C., and David G. Fisher. 2023. “Venus’s Atmosphere.” Astronomy and Astrophysics Research Starters. [↩] [↩]
- Luger, R., R. Barnes, E. Lopez, J. Fortney, B. Jackson, and V. Meadows. 2015. “Habitable Evaporated Cores: Transforming Mini-Neptunes into Super-Earths in the Habitable Zones of M Dwarfs.” Astrobiology 15 (1): 57–88. https://doi.org/10.1089/ast.2014.1215. [↩] [↩] [↩]
- Gillon, Michaël. 2024. TRAPPIST-1 and Its Compact System of Temperate Rocky Planets.https://arxiv.org/abs/2401.11815. [↩]
- Grießmeier, J.-M., A. Stadelmann, J. L. Grenfell, H. Lammer, and U. Motschmann. 2009. “On the Protection of Extrasolar Earth-Like Planets Around K/M Stars Against Galactic Cosmic Rays.” Icarus 199 (2): 526–35. https://doi.org/10.1016/j.icarus.2008.09.015. [↩] [↩]
- Vinson, Alec M., and Brad M. S. Hansen. 2017. “On the Spin States of Habitable Zone Exoplanets Around M Dwarfs: The Effect of a Near-Resonant Companion.” Monthly Notices of the Royal Astronomical Society 472 (3): 3217–29. https://doi.org/10.1093/mnras/stx2100. [↩] [↩]
- Yang, Huanzhou, Eric T. Wolf, Cheng-Cheng Liu, Yunqian Zhu, Owen B. Toon, and Dorian S. Abbot. 2026. “The Effect of Planetary Rotation Period on Clouds in a Global Climate Model with a Bin Microphysics Scheme.” The Astrophysical Journal 999 (2): 184. https://doi.org/10.3847/1538-4357/ae40b5. [↩]
- Raviprakash, Swathi, Madhu Kashyap Jagadeesh, Margarita Safonova, and Oleg Kotsyurbenko. 2026. Habitability Study of Terrestrial Planets: Application to Venus-Like Worlds. https://arxiv.org/abs/2604.06792. [↩] [↩] [↩] [↩] [↩] [↩]
- Schulze-Makuch, Dirk, Abel Méndez, Alberto G. Fairén, et al. 2011. “A Two-Tiered Approach to Assessing the Habitability of Exoplanets.” Astrobiology 11 (10): 1041–52. https://doi.org/10.1089/ast.2010.0592. [↩] [↩] [↩] [↩]
- Kane, Stephen R., Kimberly M. Bott, Kenneth E. Goodis Gordon, et al. 2026. “Imaging Venus-Like Worlds: Spectral, Polarimetric, and UV Diagnostics for the Habitable Worlds Observatory.” arXiv Preprint arXiv:2602.02728, February. https://arxiv.org/abs/2602.02728. [↩] [↩] [↩]
- Weiss, Lauren M., and Geoffrey W. Marcy. 2014. “THE MASS-RADIUS RELATION FOR 65 EXOPLANETS SMALLER THAN 4 EARTH RADII.” The Astrophysical Journal 783 (1): L6. https://doi.org/10.1088/2041-8205/783/1/l6. [↩]
- Noack, L., A. Rivoldini, and T. Van Hoolst. 2017. “Volcanism and Outgassing of Stagnant-Lid Planets: Implications for the Habitable Zone.” Physics of the Earth and Planetary Interiors 269: 40–57. https://doi.org/10.1016/j.pepi.2017.05.010. [↩]
- Zahnle, Kevin J., and David C. Catling. 2017. “The Cosmic Shoreline: The Evidence That Escape Determines Which Planets Have Atmospheres, and What This May Mean for Proxima Centauri B.” The Astrophysical Journal 843 (2): 122. https://doi.org/10.3847/1538-4357/aa7846. [↩] [↩]
- Kashefi, Kazem, and Derek R. Lovley. 2003. “Extending the Upper Temperature Limit for Life.” Science 301 (5635): 934. https://doi.org/10.1126/science.1086823. [↩]
- McKay, Christopher P. 2014. “Requirements and Limits for Life in the Context of Exoplanets.” Proceedings of the National Academy of Sciences 111 (35): 12628–33. https://doi.org/10.1073/pnas.1304212111. [↩]
- Kasting, James F., O. B. Toon, and J. B. Pollack. 1988. “How Climate Evolved on the Terrestrial Planets.” Scientific American 258 (2): 90–97. https://doi.org/10.1038/scientificamerican0288-90. [↩]
- Ingersoll, Andrew P. 1969. “The Runaway Greenhouse: A History of Water on Venus.” Journal of the Atmospheric Sciences 26 (6): 1191–98. https://doi.org/10.1175/1520-0469(1969)026<1191:TRGAHO>2.0.CO;2. [↩]
- Grinspoon, David H., and Mark A. Bullock. 2007. “Astrobiology and Venus Exploration.” Geophysical Monograph Series 176: 191–206. https://doi.org/10.1029/176GM12. [↩] [↩]
- Weller, Matthew B., and Walter S. Kiefer. 2025. “The Punctuated Evolution of the Venusian Atmosphere from a Transition in Mantle Convective Style and Volcanic Outgassing.” Science Advances 11: eadn9861. https://doi.org/10.1126/sciadv.adn9861. [↩]
- Jakosky, Bruce M., and Paul K. Byrne. 2025. “Using Venus, Earth, and Mars to Understand Exoplanet Volatile and Climate Evolution.” Journal of Geophysical Research: Planets 130 (10): e2024JE008882. https://doi.org/10.1029/2024JE008882. [↩]
- Cassia, Raúl, Macarena Nocioni, Natalia Correa-Aragunde, and Lorenzo Lamattina. 2018. “Climate Change and the Impact of Greenhouse Gasses: CO2 and NO, Friends and Foes of Plant Oxidative Stress.” Frontiers in Plant Science 9 (March): 273. https://doi.org/10.3389/fpls.2018.00273. [↩]