
Abstract
The Smolensk Oblast faces persistent demographic decline, with birth rates falling from 10.6‰ in 2015 to 5.8‰ in 2023 and sustained youth out-migration to more developed regions. Despite federal and regional family support programs, these trends continue. This pilot study explores whether economic barriers (income and housing) are perceived as more significant obstacles to family formation than lack of awareness about government support among young people in the region. We analyzed Rosstat data (2000-2024) using descriptive Pearson correlations and conducted a survey of 100 high-school students in Smolensk (50 boys, 50 girls). The correlation analysis showed that population aging strongly correlated with fixed capital investment (r = 0.86, r2 = 0.74, n = 24, CI [0.67; 0.94], p < 0.001) and consolidated budget revenues (r = 0.45, r2 = 0.2, n = 8, CI [-0.37; 0.88], p = 0.26), but not with GRP (r = -0.13, r2 = 0.017, n = 8, CI [-0.765; 0.633] p = 0.767) or unemployment (r = -0.02, r2 < 0.001, n = 12, CI [-0.559; 0.527], p = 0.95). These associations are descriptive and do not imply causation. The survey revealed that 54% of respondents were aware of demographic policies, yet 58% did not wish to live, study, or work in the region after graduation. Moreover, 94% reported low income as a barrier to starting a family, and 84% reported lack of housing as a barrier. These findings suggest that, in this pilot sample, perceived economic constraints outweigh awareness deficits as barriers to family formation. However, given the exploratory nature of survey (one school, 100 students), results are not generalizable to all youth in Smolensk Oblast. Future research with a larger, representative sample is needed to confirm these patterns.
Introduction
According to United Nations data, the global crude death rate (CDR) stands at 8.6‰1 The Russian Federation, however, figures among those nations characterized by elevated mortality, recording a CDR of 12.1‰ in 20232 Within the Smolensk Region, death rates have followed a trajectory of sustained decline, receding from 20.0‰ in 2000 to 15.2‰ in 20233; the average across this range is 18.3‰3. Nevertheless, in comparison to other federative subjects of the Central Federal District (CFD), these indicators remain unduly elevated: as of 2023, the regional CDR of 14.0‰ exceeded the CFD average of 13.2‰, thereby placing the region within demographic risk brackets4. Lower mortality does not compensate for low birth rates and migration loss. Combined with declining fertility, such dynamics cause aging of the population. The share of residents above working age increased from 23.5% in 2001 to 27.3% by 2024 (Figure 1)5.
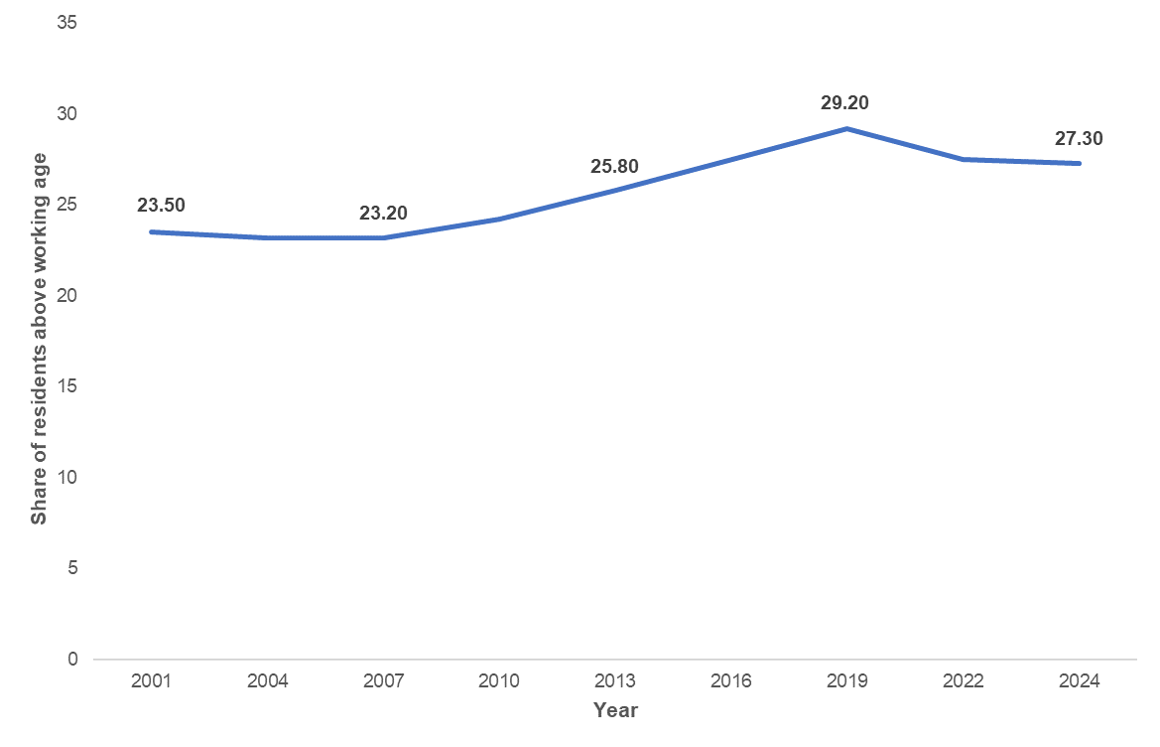
Line graph showing the percentage of residents above working age (retirement age) from 2001 to 2024. Data source: Rosstat (4). N = 24 years.
This trend aggravates the load on the regional economy through the progressive contraction of the labor force.
Russia is classified as a country with a very low birth rate, with its crude birth rate (CBR) falling below 10‰. In the Smolensk Region, we observe a steady decline from 10.6‰ in 2015 to 5.8‰ in 2023 (Figure 2)3.
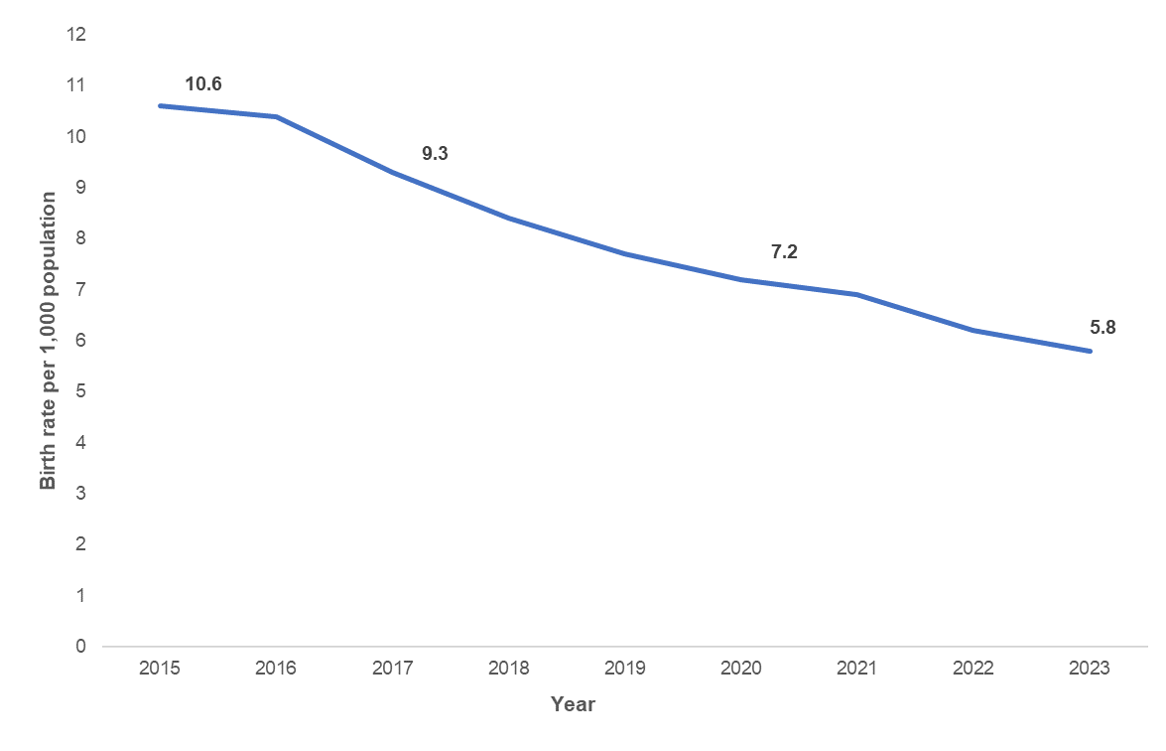
Line graph showing the birth rate per 1,000 population from 2015 to 2023. Data source: Rosstat (3). N = 9 years.
In 2023, this figure was the lowest among all CFD regions: 5.8‰ versus the district average of 7.2‰6. Should the birth rate continue to decline, the labor force will shrink, pension and healthcare systems will face increased strain, and long-term economic growth will decelerate.
In 2023, Russia’s migration gain amounted to 95,483 people7. The Smolensk Region, however, presents a different pattern, having experienced sustained migration loss. From 2005 to 2023, arrivals averaged 27,794 per year, while departures averaged 28,0428. Taken together, population outflow – particularly among young people of working age – coupled with high mortality and low birth rates, is contributing to population decline. Over ten-year period from 2014 to 2024, the regional population decreased by 97,400 people5.
Demographic challenges in the regions of the Central Federal District (CFD) have attracted considerable scholarly attention. Katrovsky characterised the demographic development of Central Russia as a “fracture” — a sustained population decline driven by low birth rates, high mortality, and migration outflows. The author emphasises that the CFD exhibits multi‑directional population dynamics, and the Smolensk Oblast ranks among the regions with the most severe demographic situation, belonging to the third group — regions that lost more than 1% of their population during 2012–2014. Katrovsky also notes that in 2015, Smolensk Oblast experienced its first decline in absolute and relative birth rates in a decade, and the total fertility rate in the region correlates with economic dynamics9.
Prokhorov, Reger, and Eliseenkov conducted a multidimensional correlation analysis of demographic processes in Smolensk Oblast for 2005–2022 and found that wages and gross regional product per capita are the most influential factors10. Miloserdov et al. demonstrated that economic deprivation in Smolensk Oblast (income deficit, inequality, low quality of life) correlates with deteriorating population health11. Zubanova analysed the formation of the labour force in the CFD regions, revealing a direct relationship between demographic processes and the state of the regional labour market12.
Yakovenko et al. identified Smolensk Oblast among the CFD regions with the most pronounced intraregional disparities in population dynamics13. In a later study, Yakovenko, Gurchenko, Ten, and Safonova, based on an analysis of absolute and relative population changes for 2000–2023, distinguished three stable clusters: the “Growth Pole” (Moscow and Moscow Oblast), the “Stagnation Zone”, and the “Systemic Depopulation Zone” — the latter comprising 14 out of 18 CFD subjects, including Smolensk Oblast14 . Mokrensky also classified Smolensk Oblast among the nine depressed regions of the CFD where the demographic situation requires immediate action; he showed that the total fertility rate of the rural population in Smolensk Oblast declined from 1.67 in 2010 to 1.19 in 202015.
However, most existing studies focus on the macro level — the analysis of statistical indicators. Less attention is paid to the micro level: the perception of demographic barriers by the youth themselves. Ryazantsev and Miryazov proposed a theoretical model of demographic well‑being at the micro level, defining it as the ability to realise reproductive intentions16.
The government is actively pursuing demographic policies, ranging from maternity capital and subsidized mortgages to information campaigns. Yet we have observed worsening trends across all indicators: births, deaths, and migration17. This raises the question of whether current measures effectively address the barriers perceived by young people. This pilot study therefore explores whether economic factors are perceived as a greater obstacle to family formation for young people in the Smolensk Region than lack of awareness regarding government support. To explore this question, we conducted a descriptive correlation analysis between demographic and economic indicators and a pilot survey of 100 high school students in the city of Smolensk.
Methodology
Demographic Data
To analyze the demographic situation, data were obtained from the official website of the Federal State Statistics Service (Rosstat). These included the share of the population above working age (2001-2024), birth rates (2015-2023), death rates (2000-2023), and migration outflows (2005-2023). All indicators were recorded at annual intervals.
Economic Data
For the analysis of economic indicators, data were likewise taken from the official Rosstat website. These included gross regional product (GRP – the total value of all goods and services produced in the region) (2016-2023), GRP per capita (gross regional product divided by the population, a measure of average economic output per person) (2016-2023), consolidated budget revenues (the total revenues of the regional budget combined with municipal budgets) (2005-2023), fixed capital investment (spending on the creation, expansion, or modernization of fixed assets such as machinery, equipment, and buildings) (2000-2024), unemployment rate (2013-2024), average wages (2023-2024), small business turnover (January-September 2022 and January-September 2025), and the number of small business employees (January-September 2022 and January-September 2025). The indicators for GRP, GRP per capita, consolidated budget revenues, and fixed capital investment were converted to real terms to account for inflation. GRP and GRP per capita were expressed in constant 2016 prices using regional physical volume indices for GRP (Smolenskstat 2024). Consolidated budget revenues were expressed in constant 2005 prices using the national GDP deflator (Rosstat, 2024). Fixed capital investment was expressed in constant 2000 prices using regional physical volume indices for investment (Smolenskstat, 2024).
Average wages were expressed in constant 2023 prices using the consumer price index (CPI) for 2024 (Smolenskstat, 2024).
Correlation Analysis
To examine the relationship between economic indicators (GRP, consolidated budget revenues, fixed capital investment, unemployment rate) and demographic indicators (share of the population above working age, migration losses), the Pearson correlation coefficient was employed. The data were sourced from the official website of the Federal State Statistics Service (Rosstat) covering the period from 2000 to 2024. Calculations were performed using Excel and an online calculator18. For each coefficient, 95% confidence intervals (CI) were calculated using Fisher’s z-transformation, along with corresponding p-values. The significance level was set at α = 0.05. The coefficient of determination (r2) was calculated as the square of the Pearson correlation coefficient. All correlations were interpreted as descriptive associations and do not imply causation.
Survey
The survey was conducted from March 18 to March 24, 2026, at MBOU “School No. 39” in the city of Smolensk. Prior to the survey, ethical approval for this study was obtained from the Scientific Review Committee (SRC) of MBOU “School No. 39” on March 17, 2026. A total of 100 respondents (50 boys and 50 girls) from grades 9-11, aged 15 to 18, were included in the survey. The survey was administered anonymously (no personal identifiers, IP addresses, or email addresses were collected), voluntary, and participants were informed of their right to withdraw at any time. Before participation, written informed consent was obtained from both the students themselves and their parents. Consent forms were distributed through homeroom teachers as well as class chat groups.
The questionnaire was created using Google Forms and consisted of 13 questions, which were divided into three blocks: general awareness, migration attitudes, and knowledge of support measures along with barriers to family formation. Completion time ranged from 5 to 10 minutes.
The data were automatically processed in Google Forms, providing percentage distributions of responses. The results were stored on a computer accessible only to the research team and subsequently transferred to Excel for chart creation. Data will be retained for one year after publication and then permanently deleted. 95% confidence intervals for survey proportions were calculated using the Wald method (p ± 1.96 × √(p(1-p)/n)), where n = 100. The full questionnaire is provided in Appendix.
Conclusion
Demographic and Economic Context
To contextualize the situation in Smolensk Oblast, we compared key demographic and economic indicators with other regions of the Central Federal District (Table 1).
| Region | Birth rate (per 1000) | Death rate (per 1000) | Net migration (persons) | GRP (billion RUB) | Fixed capital investment (billion RUB) | Consolidated budget revenues (billion RUB) |
| Smolensk Oblast | 5.8 | 15.2 | -833 | 556.6 | 128.4 | 114.3 |
| Belgorod Oblast | 6.6 | 14.8 | -2410 | 1,341.4 | 212.4 | 168.3 |
| Bryansk Oblast | 6.9 | 14.8 | -848 | 489.2 | 87.3 | 114.3 |
| Vladimir Oblast | 6.4 | 15.8 | -3034 | 316.0 | 70.2 | 125.9 |
| Voronezh Oblast | 7.2 | 13.5 | -742 | 1,494.0 | 344.0 | 182.4 |
| Ivanovo Oblast | 7.2 | 16.0 | -753 | 435.0 | 70.2 | 81.3 |
| Kaluga Oblast | 7.7 | 13.5 | 4 | 798.1 | 156.2 | 113.1 |
| Kostroma Oblast | 7.8 | 15.9 | 640 | 316.0 | 47.9 | 54.8 |
| Kursk Oblast | 7.1 | 15.5 | 873 | 632.4 | 203.0 | 122.9 |
| Lipetsk Oblast | 7.1 | 14.2 | -3131 | 1,149.2 | 166.0 | 136.1 |
| Moscow Oblast | 8.5 | 13.2 | 23340 | 8,750.0 | 1,800.0 | 1,248.0 |
| Oryol Oblast | 6.6 | 14.2 | -1629 | 399.0 | 61.0 | 65.5 |
| Ryazan Oblast | 6.0 | 15.5 | -528 | 632.4 | 118.5 | 115.6 |
| Tambov Oblast | 6.6 | 15.9 | -258 | 523.0 | 99.0 | 80.2 |
| Tver Oblast | 7.0 | 15.9 | -1618 | 632.4 | 118.5 | 114.5 |
| Tula Oblast | 6.4 | 14.2 | -265 | 1,149.2 | 135.8 | 153.4 |
| Yaroslavl Oblast | 7.6 | 13.5 | -1023 | 632.4 | 135.8 | 107.4 |
| Moscow City | 9.2 | 8.6 | 39847 | 28,579.0 | 8,100.0 | 4,210.9 |
GRP and investment data are in current prices. Consolidated budget revenues are based on Federal Treasury for 2023.
The table shows that Smolensk Oblast has one of the lowest birth rates in the district (5.8‰) and one of the highest mortality rates (15.2‰), while its GRP and investment levels are among the lowest. In terms of consolidated budget revenues, Smolensk ranks near the bottom of the district, ahead of only Kostroma, Oryol, Ivanovo, and Tambov oblasts. Only five regions – Kaluga Oblast, Kostroma Oblast, Kursk Oblast, Moscow City, Moscow Oblast – recorded positive net migration in 2023.
In real terms (constant 2016 prices), the gross regional product (GRP) of the Smolensk increased from 283.7 billion rubles in 2016 to 474.9 billion rubles in 2023, representing real growth of 67.4%19. Nominal growth over the same period was 96.2%. Nevertheless, compared to other federative subjects of the Central Federal District (CFD), it remained relatively low. In 2023, only four regions registered lower GRP values: Tambov (414 billion rubles), Oryol (304.8), Kostroma (236.2), and Ivanovo (340.8)20.
Consolidated budget revenues (in real terms (constant 2005 prices)) grew from 11.3 billion rubles in 2005 to approximately 16.1 billion rubles in 2023, representing a real increase of 43%. Nominal growth over the same period was 770% (from 11.3 to 114.3 billion rubles), underscoring the substantial effect of inflation on budgetary indicators21. Fixed capital investment in the Smolensk Region (in real terms (constant 2000 prices)) increased from 6.7 billion rubles in 2000 to approximately 82.7 billion rubles in 2024, representing a real growth of 1,134% (12.3 times). Nominal growth over the same period was 1,527% (16.3 times) from 6.7 to 109 billion rubles22. Even so, the 2024 investment level was among the lowest in the CFD, exceeding only Tambov (99 billion rubles), Oryol (65.4), Kostroma (44.4), and Ivanovo (70.2)23.
Labor Market and Small Business
The number of employed persons decreased by approximately 75,000 between 2013 and 2024, from 510,500 to 435,80024. The unemployment rate, however, fell from 5.2% to 2.6% over the same period14. In real terms (constant 2023 prices, adjusted for inflation using the CPI), average wages in the Smolensk Region rose by 13.2% from 2023 to 2024, increasing from 49,185 to 55,682 rubles25.
Regarding small business activity: from January to September 2022, total turnover amounted to 167,163.2 million rubles. For the corresponding period in 2025, it reached 203,092.6 million rubles. Employment in the small business sector grew by only 7%, from 31,222 to 33,257 persons26,27.
Descriptive Associations
We performed a Pearson correlation analysis to examine the relationship between demographic and economic indicators. The results are presented in Table 2.
| No. | Demographic indicator | Economic indicator | r | r2 | n | 95% CI | p-value |
| 1 | Share of population above working age | GRP per capita | -0.13 | 0.017 | 8 | [-0.765; 0.633] | 0.767 |
| 2 | Consolidated budget revenues | 0.45 | 0.2 | 8 | [-0.37; 0.88] | 0.26 | |
| 3 | Fixed capital investment | 0.86 | 0.74 | 24 | [0.67; 0.94] | <0.001 | |
| 4 | Unemployment rate | -0.02 | < 0.001 | 12 | [-0.559; 0.527] | 0.95 | |
| 5 | Migration decline | -0.65 | 0.42 | 7 | [-0.934; 0.216] | 0.116 |
For each pair, the Pearson correlation coefficient (r), number of observations (n), 95% confidence interval (CI) using Fisher’s z-transformation, and p-value are shown. GRP per capita – gross regional product per capita.
No significant correlation was found between GRP per capita and the share of the population above working age (r = -0.13, r2 = 0.017, n = 8, CI [-0.765; 0.633], p = 0.767). The correlation between consolidated budget revenues and the share above working age was moderate but not statistically significant (r = 0.45, r2 = 0.2, n = 8, CI [-0.37; 0.88], p = 0.26). A strong and statistically significant correlation was found between fixed capital investment and the share above working age (r = 0.86, r2 = 0.74, n = 24, CI [0.67; 0.94], p < 0.001).
No significant correlation was detected between the unemployment rate and the share above working age (r = -0.02, r2 < 0.001 n = 12, CI [-0.559; 0.527], p = 0.95). Finally, we found no statistically significant correlation between the unemployment rate and migration outflow (r = -0.65, r2 = 0.42, n = 7, CI [-0.934; 0.216], p = 0.116).
These associations are descriptive and do not imply causation. The limited number of observations for some correlations (n=7-8) reduces statistical power and requires cautious interpretation.
Survey
The results are presented in Table 3.
| Question | Response | % | 95% CI |
| Awareness of demographic issues among respondents | Fully or rather aware | 54 | 44-64 |
| Fully or rather unaware | 26 | 18-35 | |
| Unsure | 20 | 13-29 | |
| Migration intentions of high school students in Smolensk | Not wish to remain (or rather not) | 58 | 48-68 |
| Wish to stay (or rather wish) | 29 | 20-39 | |
| Undecided | 13 | 7-21 | |
| Awareness of government family support measures | Maternity capital | 94 | 87-97 |
| Benefits for large families | 79 | 70-86 | |
| Family mortgages | 69 | 59-77 | |
| Monthly child benefits | 54 | 44-64 | |
| Regional maternity capital | 33 | 24-43 | |
| Perceived barriers to family formation | Low income | 94 | 87-97 |
| Lack of housing | 84 | 75-90 | |
| Desire to build a career | 49 | 39-59 | |
| Lack of information about government support | 17 | 10-26 | |
| Other | 13 | 7-21 | |
| Factors influencing the decision to have a child | Income and housing | 55 | 45-65 |
| Government support | 4 | 1-10 | |
| Both equally | 38 | 28-48 | |
| Difficult to answer | 3 | 1-8 |
CI calculated using the Wald method (p ± 1.96 × √(p(1-p)/n)), where n = 100.
Note: Multiple-choice questions (awareness of support measures, barriers to family formation) allowed respondents to select more than one option, therefore, percentages for these questions may sum to more than 100%. For single-choice questions, percentages sum to 100%.
We surveyed 100 high school students (50 boys, 50 girls). The results indicated that 54% (CI: 44-64%) of respondents considered themselves fully or rather aware about demographic issues, while 26% (CI: 18-35%) reported being fully or rather unaware, and for 20% (CI: 13-29%) were unsure (Figure 3).
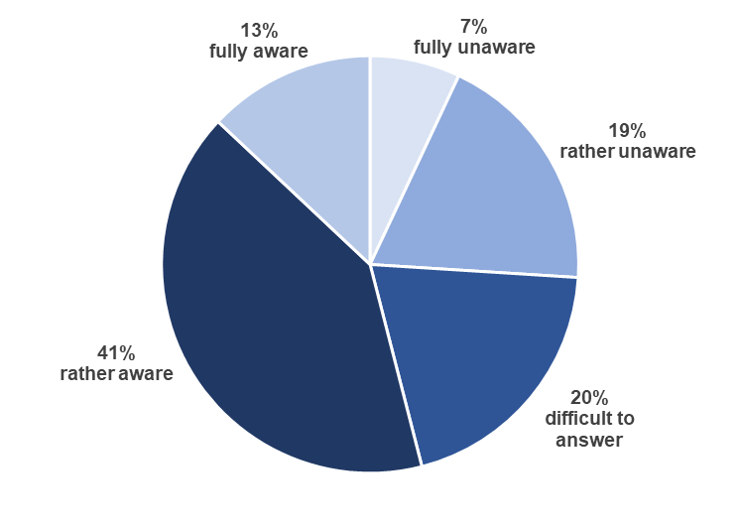
Pie chart showing the distribution of self-assessed awareness among high school students: fully unaware – 7%, rather unaware – 19%, difficult to answer – 20%, rather aware – 41%, fully aware – 13%. Single choice question. Source: authors’ survey. N = 100. Sum = 100%.
Regarding post-graduation plans: 58% (CI: 48-68%) stated that they did not wish to remain in the Smolensk Region (or rather not), 29% (CI: 20-39%) expressed a desire to stay (or rather yes), and 13% (CI: 7-21%) were uncertain (Figure 4).
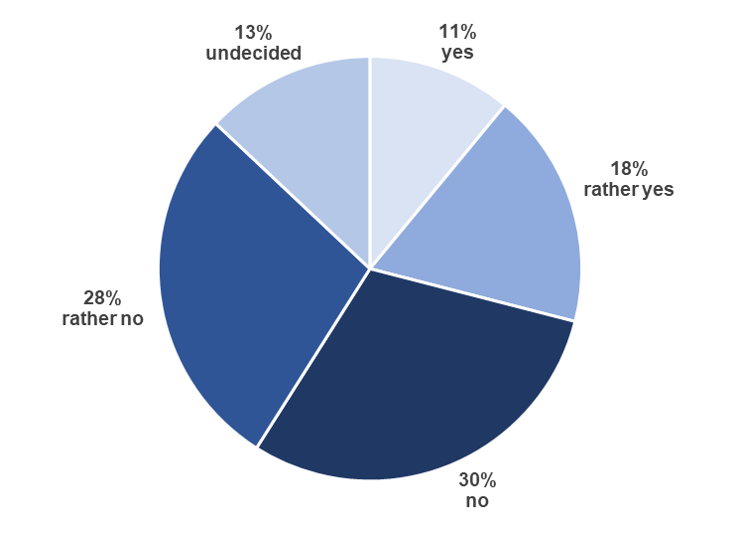
Pie chart showing the percentage of respondents who want to stay in Smolensk Oblast after graduation (“yes” – 11%, “rather yes” – 18%), those who do not want to stay (“rather no” – 30%, “no” – 28%), and those undecided (13%). Single choice question. Source: authors’ survey. N = 100. Sum = 100%.
Students demonstrated high awareness of existing support measures: 94% (CI: 87-97%) knew about maternity capital, 79% (CI: 70-86%) about benefits for large families, 69% (CI: 59-77%) about family mortgages, 54% (CI: 44-64%) about monthly child benefits, and 33% (CI: 24-43%) about regional maternity capital (Figure 5).
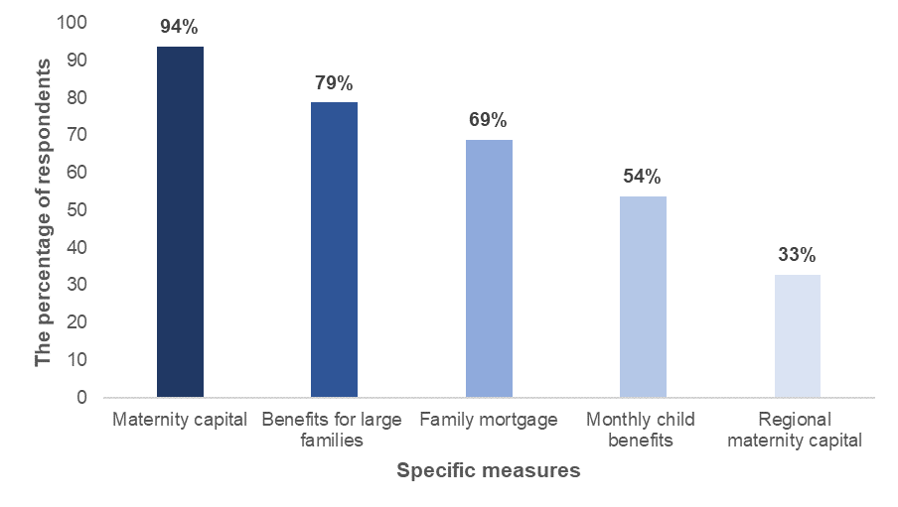
Bar chart showing the percentage of respondents who know about specific measures. Maternity capital – 94%, benefits for large families – 79%, family mortgage – 69%, monthly child benefits – 54%, regional maternity capital – 33%. Multiple choices were allowed. Source: authors’ survey. N = 100.
When asked about barriers to family formation, students cited low income (94% (CI: 87-97%)), lack of housing (84% (CI: 75-90%)), and desire to build a career (49% (CI: 39-59%)). Only 17% (CI: 10-26%) identified lack of information about government support as a major barrier, and 13% (CI: 7-21%) selected “other” (Figure 6).
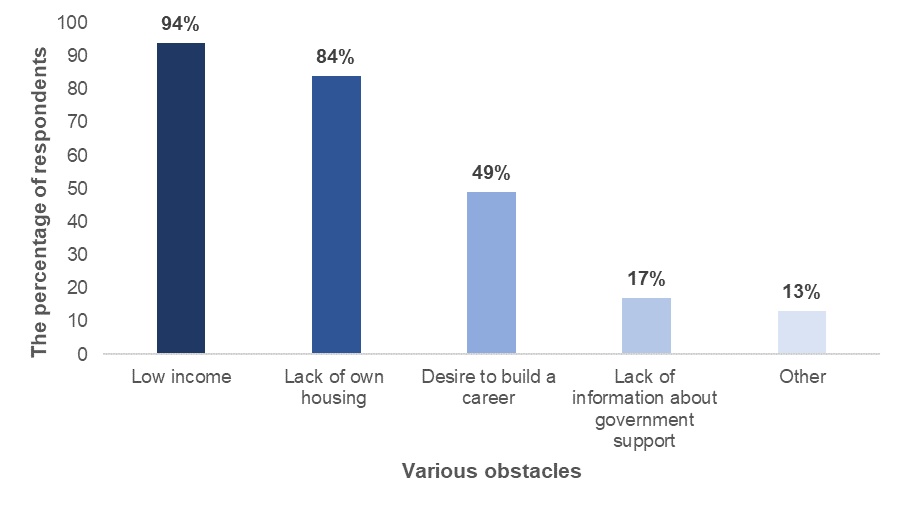
Bar chart showing the percentage of respondents citing various obstacles. Low income – 94%, lack of own housing – 84%, desire to build a career – 49%, lack of information about government support – 17% and other – 13%. Multiple choices were allowed. Source: authors’ survey. N = 100.
Finally, 55% (CI: 45-65%) of respondents indicated that stable income and homeownership would influence a young family’s decision to have a child. Only 4% (CI: 1-10%) stated that government support measures would. For 38% (CI: 28-48%), both factors mattered equally. Three percent were unsure (CI: 1-8%) (Figure 7).
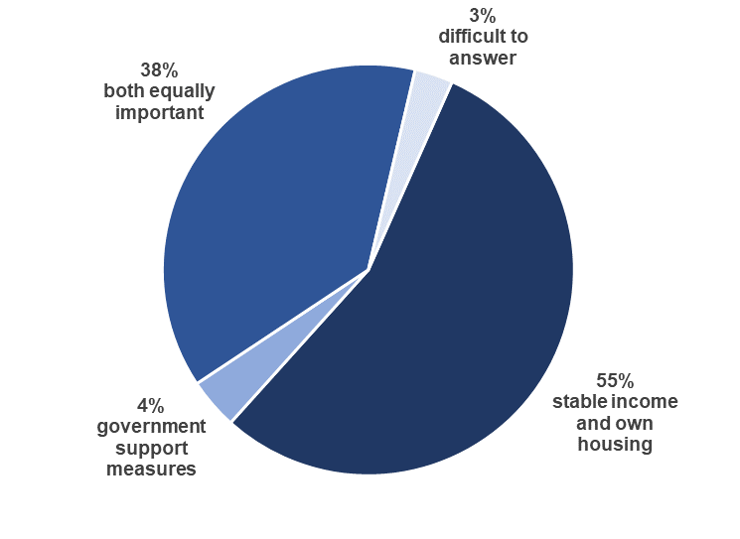
Pie chart showing the percentage of respondents who consider stable income and own housing (55%), government support measures (4%), both are equally important (38%) and those who found it difficult to answer (3%). Single choice question. Source: authors’ survey. N = 100. Sum = 100.
Discussion
Our descriptive analysis shows that indicators such as gross regional product (GRP), consolidated budget revenues, and fixed capital investment have grown alongside population aging. The correlation between GRP per capita and population aging was not statistically significant (r = -0,13, p = 0.767). The correlation between consolidated budget revenues and population aging was moderate (r = 0.45) but not significant (p = 0.26). A strong positive correlation was found between fixed capital investment and population aging (r = 0.86, p < 0.001); however, this association may reflect joint long-term trends rather than a causal effect of demography on investment.
Taken together, these associations do not provide evidence that population aging directly affects economic growth in the short term. The Smolensk Region continues to show positive economic trends regardless of its demographic challenges. However, this does not eliminate future risks. A shrinking working-age population could eventually reduce the region’s investment appeal, and GRP together with consolidated budget revenues may also decline.
Furthermore, our analysis revealed a decline in the number of employed people alongside a falling unemployment rate. This trend does not indicate an improvement in the region’s labor market. Instead, it points to a severe labor shortage driven by population aging and migration outflows. Correlations between unemployment and demographic indicators were not statistically significant, suggesting that short-term unemployment dynamics are influenced by other factors. A reduced outflow of working age people means more people remain in the region while unemployment continues to fall. This is possible if the regional economy maintains demand for labor and creates jobs. The labor shortage – confirmed by low unemployment and declining migration outflows – may be one factor associated with rising wages.
It should be noted that our correlation analyses were performed on small sample sizes due to limited data availability from Rosstat. This reduces statistical power and requires cautious interpretation, especially for correlations with n < 10.
At first glance, a 22% increase in small business turnover appears positive. However, average wages in the region rose by 13.2%. This suggests that a significant portion of businesses’ additional income may be going toward retaining staff. It is also important to note that turnover grew over three years, while wages rose in just one year. These conditions may indicate that small businesses have fewer resources left for their own development. Meanwhile, the number of employees increased by only 7%. Compared to the 22% growth in small business turnover, this could mean that the workload per employee has increased.
Our survey revealed that most respondents are aware of the existing demographic problem. The majority of respondents intend to leave the region after graduation, which may signal a potential risk of future youth out-migration. If these intentions translate into actual behavior, labor shortages could intensify. Young people in the region are also familiar with existing support measures for young families, which suggests that lack of awareness may not be the primary barrier to starting a family.
Students identified economic factors as a significantly more important barrier to starting a family than a lack of knowledge about government support. When asked what would most influence a young family’s decision to have a child, more than half of respondents selected stable income and homeownership, whereas only 4% indicated government support measures. For 38% of respondents, both factors mattered equally, and 3% were unsure.
The data collected through our survey demonstrate that, despite growth in GRP, improvements in the region’s investment attractiveness, and an increase in consolidated budget revenues, the demographic situation in the Smolensk Region continues to deteriorate. Strain on the labor market and small business sector is already observable. Our results suggest that economic growth per se – unaccompanied by increases in household incomes and improvements in housing affordability – may be insufficient to ameliorate the current demographic trajectory.
The survey is not without limitations. It covered only 100 high school students from a single school in the city of Smolensk; therefore, its findings cannot be considered fully representative of the views of young people across the entire Smolensk Region. Future research should expand the sample to include different educational institutions – schools, universities, and colleges – located in various cities and towns of the region.
Additionally, our survey respondents were aged 15-18 and are not yet making family-formation decisions. Their reported intensions and perceptions are hypothetical and may not correspond to their actual future behavior. Future research should target young adults of family-formation age (20-35 years) to capture real decision-making. Furthermore, as this was a pilot study with a relatively small sample (n = 100), we did not conduct formal reliability or validity testing (e.g. Cronbach’s alpha) of the questionnaire. The survey was developed based on a rewiev of similar studies and pilot-tested for clarity, but future research with a larger sample should validate the instrument to ensure its consistency and accuracy in measuring the intended constructs. Furthermore, this study did not account for other potential factors influencing demographic outcomes, such as federal policies, economic shocks, access to healthcare, education, and migration patterns. Future research should incorporate these variables to provide a more comprehensive understanding of demographic dynamics in the region.
Overall, this pilot study suggests that young people in the Smolensk Region perceive economic barriers (income and housing) as more significant obstacles to family formation than lack of awareness about government support. These findings align with our initial expectation. However, given the pilot nature of this study (one school, 100 students), these results are exploratory and should not be used as a basis for policy changes without further research. A larger, representative study including young adults of family-formation age is needed to confirm these patterns and to investigate whether perceived barriers translate into actual behavior. Such research would provide a stronger empirical basis for policy design at the regional level.
Acknowledgments
We are grateful to the following members of the Scientific Review Committee (SRC) for their ethical review and approval of our study protocol: Olga Kiseleva (educational psychologist), Lyudmila Chachillo (English teacher), and Yuliya Tikhonova (deputy head). We also thank the administration and teachers of MBOU “School No. 39”, in particular Pavel Ryabkov, for facilitating the survey, and all the students who participated.
Supplementary Information
Appendix
Survey on: “Demography of Russia and Smolensk Oblast”
1. How do you assess your awareness of demographic issues: birth rates, death rates, migration?
a) Fully unaware
b) Rather unaware
c) Difficult to answer
d) Rather aware
e) Fully aware
2. Do you know the current population of Russia?
a) Yes
b) I have a general idea (e.g., “tens of millions”)
c) Difficult to answer
3. Do you consider the demographic issue important for Russia’s future?
a) Yes, very important
b) Rather important
c) Not particularly important
d) Not at all important
e) Difficult to answer
4. What sources do you use to obtain information on demographic issues? (Multiple choice is allowed)
a) Social media, internet
b) Literature, scientific research
c) Educational institutions
d) Family and friends
e) Difficult to answer
5. Do you know the population of Smolensk Oblast?
a) Yes
b) I have a general idea
c) No
6. In your opinion, how does migration affect our country and region?
a) Rather positively
b) Rather negatively
c) Difficult to answer
7. Do you consider Smolensk Oblast a promising region to live in?
a) Yes
b) Rather yes
c) Rather no
d) No
e) Difficult to answer
8. Do you wish to remain in Smolensk Oblast (Smolensk) to live, study, and work after graduation?
a) Yes
b) Rather yes
c) Rather no
d) No
e) Undecided
9. What government support measures for families with children are you aware of? (Multiple choice is allowed)
a) Maternity capital
b) Benefits for large families
c) Regional maternity capital
d) Family mortgage
e) Monthly child benefits
10. Which factors, in your opinion, most strongly influence the demographic situation in Russia? (Multiple choice is allowed)
a) Government policy
b) Traditional values
c) Education level
d) Environmental conditions
e) Economic situation
f) Other factors
11. Which measures, in your opinion, could improve the demographic situation in Smolensk Oblast? (Multiple choice is allowed)
a) Support for young families
b) Infrastructure development
c) Improvement of living standards
d) Healthcare development
e) Quality of education
f) Other measures
12. In your opinion, what reasons most often prevent young people in our region from starting a family and having several children? (Multiple choice is allowed)
a) Low income
b) Lack of own housing
c) Lack of information about government support
d) Desire to build a career
e) Other
13. What, in your opinion, would most influence a young family’s decision to have a child?
a) Stable income and own housing
b) Government support measures
c) Both are equally important
e) Difficult to answer
References
- United Nations. World population prospects: the 2024 revision. UN Data. 2024, https://data.un.org/Data.aspx?d=PopDiv&f=variableID%3A65. [↩]
- Rosstat. Mortality of the population (excluding mortality from external causes) (table 1.12). Regions of Russia. Socio-economic indicators. 2025, https://rosstat.gov.ru/folder/210/document/47652. [↩]
- Rosstat (Smolenskstat). Birth rate, mortality and natural population decline in Smolensk oblast. Territorial Body of the Federal State Statistics Service for the Smolensk Region. 2025, https://67.rosstat.gov.ru/folder/32741 [↩] [↩] [↩]
- Rosstat. Mortality of the population (excluding mortality from external causes) (table 1.12). Regions of Russia. Socio-economic indicators. 2025, https://rosstat.gov.ru/folder/210/document/47652 [↩]
- Rosstat (Smolenskstat). Distribution of the population of Smolensk oblast by age group. Territorial Body of the Federal State Statistics Service for the Smolensk Region. 2025, https://67.rosstat.gov.ru/folder/32741 [↩] [↩]
- Federal State Statistics Service (Rosstat). General birth rates by region (table 1.9). Regions of Russia. Socio-economic indicators. 2025: Statistical Collection. Rosstat. 2025, https://rosstat.gov.ru/folder/210/document/47652 [↩]
- Federal State Statistics Service (Rosstat). Migration increase (decrease) by sex, age and migration flows. Showdata.rosstat.gov.ru. 2025, https://showdata.rosstat.gov.ru/report/278004/ [↩]
- Rosstat (Smolenskstat). Migration of the population of Smolensk oblast. Territorial Body of the Federal State Statistics Service for the Smolensk Region. 21 June 2024, https://67.rosstat.gov.ru/folder/32741 [↩]
- Katrovsky A.P. Demographic development of Central Russia has entered a stage of fracture? // On the demographic situation in Russia: analysis, problems and prospects of development. 2018. URL: https://cyberleninka.ru/article/n/demograficheskoe-razvitie-tsentralnoy-rossii-vstupilo-v-stadiyu-nadloma [↩]
- Prokhorov P.A., Reger T.V., Eliseenkov A.S. Socio-economic development of Smolensk Oblast: trends, challenges and prospects // Regional Economics and Management. 2024. No. 2. URL: https://cyberleninka.ru/article/n/sotsialno-ekonomicheskoe-razvitie-smolenskoy-oblasti-tendentsii-vyzovy-i-perspektivy [↩]
- Miloserdov M.A., Maslov N.E., Erechina A.S., Khamtsova E.I. Prevalence of acute disorders of cerebral circulation in the Smolensk region in terms of the role of socio-economic factors and the state of the health care system // Health Care of the Russian Federation. 2022. Vol. 66. No. 4. P. 275–281. DOI: 10.47470/0044-197X-2022-66-4-275-281. URL: https://cyberleninka.ru/article/n/zabolevaemost-naseleniya-smolenskoy-oblasti-ostrymi-narusheniyami-mozgovogo-krovoobrascheniya-rol-sotsialno-ekonomicheskih-faktorov [↩]
- Zubanova S.G. Features of labour force formation in the regions of the Central Federal District. 2024. URL: https://cyberleninka.ru/article/n/osobennosti-formirovaniya-rabochey-sily-v-regionah-tsfo [↩]
- Yakovenko N.V., Komov I.V., Safonova I.V., Derevyagina M.V., Gosteeva Yu.A. Demographic ageing of the population in the regions of the Central Federal District // Belgorod State University Scientific Bulletin. Natural Sciences Series. 2019. Vol. 43. No. 2. P. 154–164. DOI: 10.18413/2075-4671-2019-43-2-154-164. URL: https://cyberleninka.ru/article/n/demograficheskoe-starenie-naseleniya-v-oblastyah-tsentralnogo-federalnogo-okruga [↩]
- Yakovenko N.V., Gurchenko V.I., Ten R.V., Safonova I.V. Dynamics and regional differentiation of the main demographic indicators in the subjects of the Central Federal District // Economic, Social, Political and Recreational Geography. 2025. No. 6. P. 51–57. DOI: 10.24412/1728-323X-2025-6-51-57. URL: https://cyberleninka.ru/article/n/dinamika-i-regionalnaya-differentsiatsiya-osnovnyh-demograficheskih-pokazateley-v-subektah-tsentralnogo-federalnogo-okruga [↩]
- Mokrensky D.N. Trends in the rural population demographic development of the Central Federal District regions over the 2010–2020 inter-census period // Population. 2025. Vol. 28. No. 4. P. 80–92. DOI: 10.24412/1561-7785-2025-4-80-92. URL: https://cyberleninka.ru/article/n/tendentsii-demograficheskogo-razvitiya-selskogo-naseleniya-regionov-tsfo-za-mezhperepisnoy-period-2010-2020-godov [↩]
- Ryazantsev S.V., Miryazov T.R. Demographic well-being: theoretical approaches to definition and assessment methodology // DEMIS. Demographic Studies. 2021. Vol. 1. No. 4. URL: https://cyberleninka.ru/article/n/demograficheskoe-blagopoluchie-teoreticheskie-podhody-k-opredeleniyu-i-metodika-otsenki [↩]
- Government of the Russian Federation. National project ‘family’. Government.ru. 2025, http://government.ru/rugovclassifier/915/about/ [↩]
- J. Stangroom. Pearson correlation coefficient calculator. Social Science Statistics. 2025, https://www.socscistatistics.com/tests/pearson/ [↩]
- Rosstat (Smolenskstat). Gross regional product of Smolensk oblast. Territorial Body of the Federal State Statistics Service for the Smolensk Region. 11 Mar. 2026, https://67.rosstat.gov.ru/grp [↩]
- Federal State Statistics Service (Rosstat). Gross regional product since 1988. Rosstat.gov.ru. 5 Mar. 2026, https://www.rosstat.gov.ru/statistics/accounts [↩]
- Smolenskstat. Statistical yearbook of Smolensk oblast. 2024: Statistical Collection. Smolenskstat. 2024, p. 424, https://67.rosstat.gov.ru/storage/mediabank/ESMC2024.pdf [↩]
- Smolenskstat (Territorial Body of the Federal State Statistics Service for the Smolensk Region). Fixed capital investment in Smolensk oblast (in actual prices). Smolenskstat. 2025, https://67.rosstat.gov.ru/folder/32836 [↩]
- Federal State Statistics Service (Rosstat). Appendix to the statistical collection ‘regions of Russia. Socio-economic indicators’ (table 10.1). Rosstat.gov.ru. 30 Dec. 2025, https://rosstat.gov.ru/folder/210/document/47652 [↩]
- Smolenskstat (Territorial Body of the Federal State Statistics Service for the Smolensk Region). Dynamics of the labor force in Smolensk oblast (table 2). Smolenskstat. 31 Oct. 2023, https://67.rosstat.gov.ru/folder/53378 [↩]
- Federal State Statistics Service (Rosstat). Average monthly nominal accrued salary per employee for the full range of organizations since 2017 (indicator 58701). Fedstat.ru. 2025, https://fedstat.ru/indicator/58701 [↩]
- Smolenskstat (Territorial Body of the Federal State Statistics Service for the Smolensk Region). Key performance indicators of small enterprises for January-September 2022. Smolenskstat. 12 Dec. 2022, https://67.rosstat.gov.ru/folder/32824 [↩]
- Smolenskstat (Territorial Body of the Federal State Statistics Service for the Smolensk Region). Key performance indicators of small enterprises for January-September 2025. Smolenskstat. 11 Dec. 2025, https://67.rosstat.gov.ru/folder/32824 [↩]