Abstract
Glycerol, a biodiesel by-product, is often discarded due to limited high-value utilization, resulting in resource waste and increased environmental burden. Catalytic oxidation provides a potential route for converting glycerol into value-added chemicals such as glyceric acid. Previous studies have demonstrated that Pt-Fe interactions can influence glycerol oxidation, motivating further investigation of how Pt:Fe composition affects the structural and catalytic characteristics of CeO₂-supported catalysts. Here, we prepared Pt–Fe/CeO₂ catalysts with varied Pt:Fe ratios, characterized them using transmission electron microscopy (TEM), X-ray diffraction (XRD), and X-ray photoelectron spectroscopy (XPS), and evaluated their glycerol oxidation performance using proton nuclear magnetic resonance (¹H NMR) analysis. We hypothesized that varying the Pt:Fe ratio would influence catalyst structure and glycerol oxidation performance. Characterization results showed that the CeO₂ support retained a cubic fluorite structure, while the tested compositions exhibited differences in metal dispersion, Pt electronic environment, and surface XPS spectral features. Among the three bimetallic Pt:Fe compositions evaluated, the 1:1 sample showed the highest measured glycerol conversion of 85.6% and a relative glyceric acid contribution of 56.3% among the three quantified products. These results indicate clear composition-dependent differences in both catalyst structure and endpoint catalytic performance. This study provides an experimental basis for further investigation of composition–structure–performance relationships in Pt–Fe/CeO₂ catalysts and may help guide future optimization of glycerol oxidation systems.
Keywords: Pt-Fe, CeO₂, glycerol oxidation, catalysis, bimetallic catalyst
Introduction
Renewable resource valorization has become an important area of catalysis because it can contribute to more efficient resource utilization and reduced environmental impact. The structural and compositional regulation of catalytic materials is widely used to improve catalytic performance, and noble metal-based catalysts have been extensively studied for oxidation reactions.
Biodiesel production generates glycerol as a major by-product, accounting for approximately 10% of the output by mass. Because crude glycerol has limited direct high-value applications, its efficient valorization has attracted increasing attention1,2,3,4. Catalytic oxidation can convert glycerol into high-value chemicals such as glyceric acid, which has potential applications in fields such as medicine and biodegradable materials3,5,6,7,8. Its efficient conversion is therefore of interest in catalysis, as it can reduce reliance on non-renewable chemical raw materials while reducing the environmental burden associated with biodiesel production.
Pt-based catalysts have been widely studied as active components in glycerol oxidation6,7,9,10,11. Fe incorporation can modify the catalytic behavior and electronic environment of Pt-based systems12,13,14, while CeO₂ is widely used as a support or promoter because its redox properties and metal-support interactions can influence the structural and catalytic behavior of supported Pt species5,6,15,16,17. Choi et al. (2022) reported enhanced oxygen-storage-related properties in a Pt catalyst supported on a mixed CeO₂–ZrO₂–Fe₂O₃ oxide system5. Previous studies have reported composition-dependent electronic and catalytic changes in Pt-Fe-containing systems12,13,14,16.
However, further investigation is still needed to better understand how Pt-Fe composition influences the structure and catalytic performance of CeO₂-supported catalysts. Xiao et al. (2017) focused on the Pt-Bi bimetallic system18,19,20. Jin et al. (2016) investigated CeO₂-supported Pt, Fe, and Pt-Fe catalysts for liquid-phase glycerol oxidation12. Related studies of PtFex/CeO₂ in other catalytic reactions have also reported composition-dependent changes in electronic structure and surface characteristics16. Therefore, further systematic comparison of different Pt:Fe ratios may help clarify these composition-performance relationships.
Based on this, we prepared Pt–Fe/CeO₂ catalysts with different Pt:Fe ratios. The structures were characterized by TEM, XRD, and XPS, and the influence of the ratio was explored in combination with catalytic experiments. Specifically, we hypothesized that varying the Pt:Fe ratio would influence the structure of the CeO₂-supported catalysts and their glycerol oxidation performance.
This study compared Pt–Fe/CeO₂ catalysts with Pt:Fe atomic ratios of 0.5:1, 1:1, and 2:1 under a fixed glycerol-oxidation condition. The catalysts were characterized by TEM, XRD, and XPS, and their catalytic performance was evaluated by ¹H NMR analysis. The objective was to examine how Pt:Fe composition influences catalyst structure and glycerol oxidation performance, thereby providing a basis for further investigation of composition–structure–performance relationships in Pt–Fe/CeO₂ catalysts.
Methods
Preparation of CeO₂ Support and Pt–Fe/CeO₂ Catalysts
The CeO₂ support was prepared by the hydrothermal method: 0.868 g Ce(NO₃)₃·6H₂O (analytical grade, Zesheng Biochemical Technology (Shanghai) Co., Ltd.) was precisely weighed and dissolved in 5 mL of deionized water, and then mixed with 8.419 g of NaOH (analytical grade, Beijing Tongguang Fine Chemical Co., Ltd.) dissolved in 35 mL of deionized water. After stirring for 5 minutes, it was transferred to the autoclave and reacted at 100 °C for 24 h. The product was centrifuged and washed four times at 8000 rpm, dried at 70 °C for 24 h, and then ground to obtain a nanoscale CeO₂ support.
The Pt–Fe/CeO₂ catalysts were prepared by the equal-volume impregnation method. A platinum precursor (Aladdin Reagent Co., Ltd.; the exact chemical form could not be independently verified from the retained records) and Fe(NO₃)₃·9H₂O (analytical grade, Aladdin Reagent Co., Ltd.) were used as the Pt and Fe precursors, respectively. The Pt and Fe precursor solutions were prepared separately in deionized water and then mixed to target nominal Pt:Fe atomic ratios of 0.5:1, 1:1, and 2:1. The mixed precursor solution was added dropwise to 10 mL of a CeO₂ suspension containing 0.1 g of the support, and the mixture was stirred at 900 rpm for 2 h at room temperature. A 2 mL aqueous tetrabutylammonium borohydride solution containing 0.1287 g of tetrabutylammonium borohydride was then added as the reducing agent. After stirring for an additional 30 min, the product was washed with ethanol, centrifuged three times at 9000 rpm, dried at 70 °C for 12 h, and ground to obtain the final catalyst. Because bulk compositions were not measured by inductively coupled plasma optical emission spectroscopy (ICP-OES) or inductively coupled plasma mass spectrometry (ICP-MS), all Pt:Fe labels in this manuscript refer to nominal precursor ratios.
Material Characterization
Transmission electron microscopy (TEM) and energy-dispersive X-ray spectroscopy (EDS) mapping were performed using a JEM-2100 transmission electron microscope operated at an accelerating voltage of 200 kV. The catalyst morphology and metal-containing particle sizes were examined by TEM, while the spatial distributions of Pt and Fe were evaluated by EDS mapping over a representative CeO₂ support region.
X-ray diffraction (XRD) measurements were performed using an X-Pert3 Powder diffractometer with Cu Kα radiation (λ = 0.15418 nm). The diffraction patterns were collected over a 2θ range of 20°–80° at a scan rate of 5° min⁻¹. The CeO₂ crystal structure and detectable crystalline phases were evaluated from the observed diffraction features.
X-ray photoelectron spectroscopy (XPS) measurements were performed using an AXIS Supra photoelectron spectrometer with Al Kα radiation. Binding energies were calibrated using the C 1s peak at 284.8 eV. The Pt 4f, Fe 2p, and Ce 3d regions were evaluated qualitatively from the available spectra to compare composition-dependent differences in surface chemical states.
Glycerol Oxidation
Glycerol oxidation was conducted in a high-pressure reactor. Catalyst (0.05 g), NaOH (1.0 g), and 25 mL of 0.1 mol/L aqueous glycerol solution were added sequentially to the reactor. After sealing, the reactor was purged three times with high-purity oxygen to replace the air and then charged to an initial O₂ pressure of 0.8 MPa before heating. The reactor was then placed in a constant-temperature water bath and the reaction mixture was stirred at 800 rpm and 80 °C for 3 h 20 min. No pressure-time record during heating or reaction was available for this revision. After the reaction, the reactor was cooled to room temperature using ice water, and the remaining gas was carefully released.
After the reaction, the solution was centrifuged at 9000 rpm for 3 min, and the supernatant was analyzed using a 400 MHz Avance III proton nuclear magnetic resonance (¹H NMR) spectrometer. Glycerol conversion was determined from the decrease in the glycerol signal before and after reaction. The relative distribution among the quantified products was calculated from the integrated ¹H NMR peak areas after correction for the number of protons contributing to each selected resonance. The corrected integral for each product was calculated as:
where Iᵢ is the integrated peak area of the selected resonance for product i, and Nᵢ is the number of protons represented by that resonance.
Relative product distribution was then calculated according to:
where the denominator represents the sum of the proton-corrected integrals of all quantified products. Replicate-level values and standard deviations were unavailable in the retained dataset and are therefore not reported.
Results
Catalyst morphology, crystal structure, surface chemical states, glycerol conversion, and relative product distribution for Pt–Fe/CeO₂ catalysts with different Pt:Fe ratios are presented in Figures 1–3 and Tables 1–2.
Microscopic Morphology and Elemental Distribution of the Catalyst
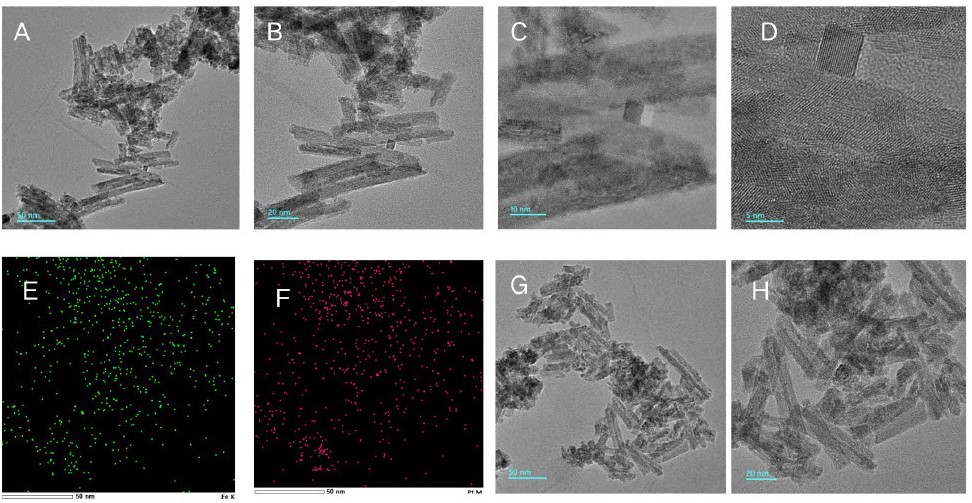
To examine the effects of Pt:Fe ratio on catalyst morphology and metal dispersion, the samples were characterized by transmission electron microscopy (TEM) using a JEM-2100 instrument operated at an accelerating voltage of 200 kV, together with energy-dispersive spectroscopy (EDS) mapping. Representative images are shown in Figure 1. For the Pt:Fe = 2:1 sample (Figure 1A–F), the CeO₂ support exhibited a rod-like morphology with lengths of approximately 50–100 nm and diameters of 10–20 nm. Local aggregation of metal-containing particles was observed, with particle sizes of approximately 6–8 nm in the imaged regions. No clear lattice fringes were resolved in the corresponding high-magnification image. EDS mapping (Figure 1E–F) further indicated local Fe-rich regions with overlapping Pt signals. In contrast, the Pt:Fe = 1:1 sample (Figure 1G–H) showed rod-like CeO₂ with less apparent aggregation. Metal-containing particles in the representative 20 nm image were mainly observed in the range of approximately 2–5 nm and appeared more uniformly distributed than those in the 2:1 sample.
In the representative regions shown, metal-containing particles were approximately 6–8 nm for Pt:Fe = 2:1 and approximately 2–5 nm for Pt:Fe = 1:1. Local Fe-rich regions were observed in the Pt:Fe = 2:1 sample, whereas the Pt:Fe = 1:1 sample appeared more uniformly distributed. The particle-size comparison is qualitative because complete size distributions were not obtained.
Crystal Structure of the Catalyst
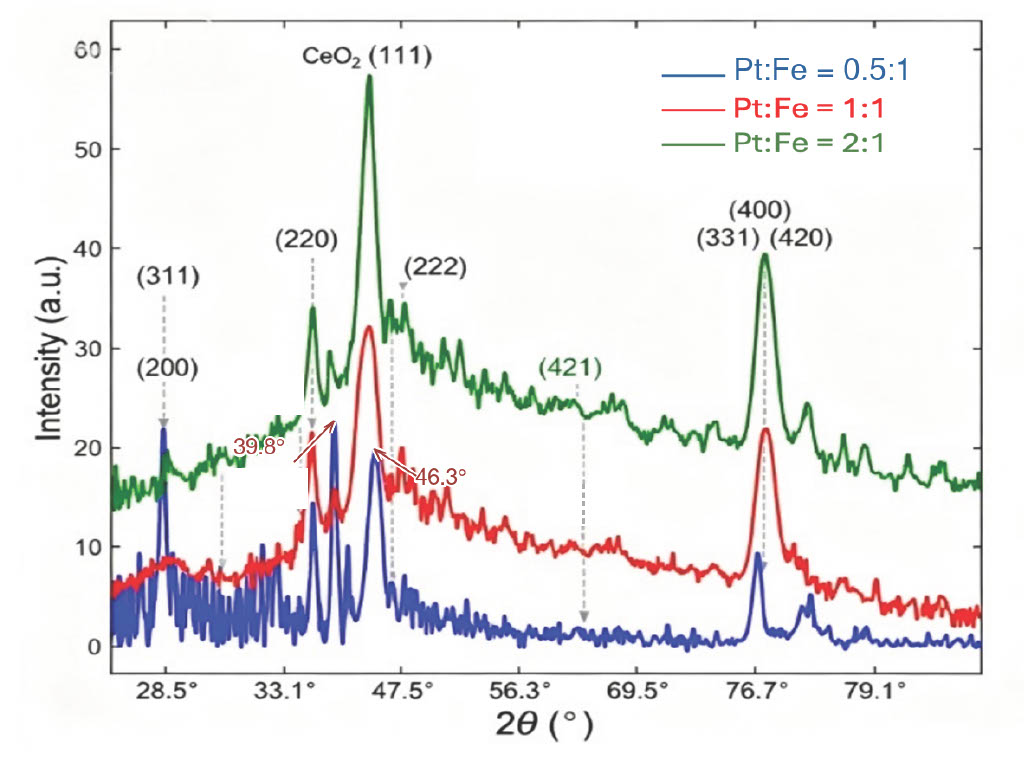
To analyze the crystal structure of catalysts with different Pt:Fe ratios, the samples were characterized by X-ray diffraction (XRD, Cu Kα radiation, λ = 0.15418 nm, 2θ scanning range: 20°–80°). The XRD patterns are shown in Figure 2. All samples exhibited characteristic diffraction peaks of the cubic fluorite CeO₂, including the major reflections at approximately 2θ = 28.5° and 33.1°, indicating that the CeO₂ crystal structure was retained after metal loading. No distinct additional crystalline Pt- or Fe-containing phases were resolved for the Pt:Fe = 1:1 and Pt:Fe = 2:1 samples within the detection range of the measurement. For the Pt:Fe = 0.5:1 sample, weak additional features were observed near 2θ = 39.8° and 46.3°.
Overall, the XRD patterns showed that the cubic fluorite structure of CeO₂ was retained across all tested Pt:Fe compositions. Additional diffraction features differed among the samples, with weak peaks observed near 2θ = 39.8° and 46.3° for the Pt:Fe = 0.5:1 sample, while no distinct additional metal-related peaks were resolved for the Pt:Fe = 1:1 and 2:1 samples.
Surface Chemical States
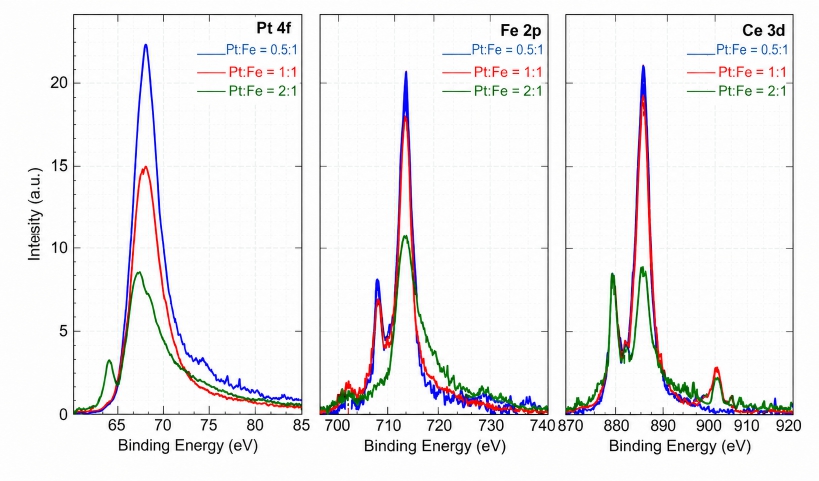
X-ray photoelectron spectroscopy (XPS) was used to compare the surface spectra of the catalysts (Figure 3). Composition-dependent spectral differences were observed in the Pt 4f, Fe 2p, and Ce 3d regions. Because the original raw XPS data were unavailable for complete peak fitting and re-quantification, these spectra are discussed qualitatively, and no oxidation-state percentages are reported.
Glycerol Catalytic Oxidation Performance
To evaluate the catalytic performance of Pt–Fe/CeO₂ catalysts, glycerol oxidation experiments were conducted at 80 °C and an O₂ pressure of 0.8 MPa, using 25 mL of a 0.1 mol/L aqueous glycerol solution and 0.05 g of catalyst. The reaction was carried out for 3 hours and 20 minutes. Glycerol conversion and relative product distribution were determined by proton nuclear magnetic resonance (¹H NMR). The results correspond to Tables 1 and 2.
| Pt:Fe atomic ratio | Glycerol conversion rate (%) |
| 0.5:1 | 65.3 |
| 1:1 | 85.6 |
| 2:1 | 72.8 |
| Pt:Fe atomic ratio | Glyceric acid share (%) | Dihydroxyacetone share (%) | Glyoxal share (%) |
| 0.5:1 | 43.7 | 29.1 | 27.2 |
| 1:1 | 56.3 | 23.1 | 20.6 |
| 2:1 | 47.8 | 26.9 | 25.3 |
Glycerol Conversion
As shown in Table 1, glycerol conversion varied with Pt:Fe atomic ratio. The Pt:Fe = 0.5:1, 1:1, and 2:1 samples showed glycerol conversions of 65.3%, 85.6%, and 72.8%, respectively. The Pt:Fe = 1:1 sample had the highest measured conversion.
Relative Product Distribution
The results in Table 2 show that the relative distribution among the three quantified products varied with catalyst composition. The nominal Pt:Fe = 1:1 sample showed a glyceric acid contribution of 56.3%, the highest measured value among the tested bimetallic compositions. Because the catalysts were compared at different endpoint conversions and the available analysis did not provide a complete carbon balance, these values are treated as endpoint relative distributions rather than intrinsic catalyst selectivities. The observed differences may be associated with composition-dependent structural and electronic characteristics, but the present data do not establish a direct mechanistic relationship.
Discussion
This study examined how Pt:Fe ratio influenced the structural characteristics and glycerol oxidation performance of Pt–Fe/CeO₂ catalysts using three characterization techniques: transmission electron microscopy (TEM), X-ray diffraction (XRD), and X-ray photoelectron spectroscopy (XPS), and catalytic oxidation experiments. Among the tested bimetallic compositions, the Pt:Fe = 1:1 sample showed the highest measured glycerol conversion of 85.6% and a relative glyceric acid contribution of 56.3% among the three quantified products. The characterization results also revealed composition-dependent differences in metal morphology, diffraction features, Pt electronic environment, and surface XPS spectral features. These observations indicate that changing the Pt composition is associated with measurable differences in both catalyst structure and endpoint catalytic performance.
TEM observations suggested that the Pt:Fe = 1:1 sample contained smaller and more uniformly distributed metal-containing particles in the representative regions examined than the Pt:Fe = 2:1 sample. Such differences in morphology may contribute to differences in catalytic behavior; however, complete particle-size distributions and measurements of accessible active-site density were not obtained for all catalyst compositions21,22. Therefore, the present data do not establish a quantitative relationship between particle dispersion and catalytic activity. Similarly, the XRD results showed that the cubic fluorite structure of CeO₂ was retained across the tested compositions, while differences in additional diffraction features were observed. The absence of distinct metal-related diffraction peaks is not interpreted as direct quantitative evidence of metal dispersion.
The XPS spectra further showed composition-dependent differences in the surface chemical states of the catalysts. The Pt:Fe = 1:1 sample exhibited a lower Pt 4f binding-energy feature than the other tested compositions, which is consistent with a change in the electronic environment of Pt. However, because binding-energy shifts can also be influenced by oxidation state, particle size, metal-support interactions, and other effects, the present XPS data are not considered direct evidence of Fe-to-Pt electron transfer6,14,16,23,24. Composition-dependent differences were also observed in the Ce 3d region. Because the original XPS raw data were unavailable for complete re-fitting and re-quantification, the Ce 3d spectra are discussed qualitatively; no oxidation-state percentages or quantitative oxygen-vacancy values are reported.
Taken together, the structural and catalytic results suggest that the Pt:Fe ratio influences several catalyst characteristics that may contribute to glycerol oxidation performance. A possible interpretation is that differences in metal morphology and surface electronic states contribute jointly to the ratio-dependent catalytic behavior. However, this interpretation should be regarded as a hypothesis rather than a demonstrated mechanism. The present experiments do not isolate the individual effects of Pt loading, Fe loading, Pt ratio, or oxygen-defect concentration. In particular, because the total metal loading was fixed while the Pt ratio was varied, the absolute Pt and Fe contents also changed between samples. Therefore, the higher activity of the Pt:Fe = 1:1 sample cannot be attributed uniquely to a Pt-Fe synergistic effect.
The relative product-distribution results should also be interpreted cautiously. For the nominal Pt:Fe = 1:1 catalyst, glyceric acid represented 56.3% of the three quantified products, the highest measured contribution among the tested bimetallic compositions. Dihydroxyacetone and glyoxal represented 23.1% and 20.6%, respectively, so 43.7% of the quantified distribution was assigned to these two products. However, previous studies have shown that glycerol oxidation can yield multiple products and that product distributions depend strongly on catalyst composition and reaction conditions1,2,7,18,25. Therefore, these values are considered endpoint relative distributions among the quantified products rather than intrinsic catalyst selectivities or a complete carbon balance. Additional kinetic measurements at matched conversion would be required to determine whether the observed selectivity differences arise directly from catalyst composition.
Several limitations of the present study should therefore be acknowledged. First, Brunauer–Emmett–Teller (BET) surface-area measurements and quantitative measurements of accessible active sites were not available, limiting direct comparison of intrinsic catalytic activity. Second, complete particle-size distributions were not obtained for all catalyst compositions. Third, the original XPS raw data were unavailable for complete re-fitting of the Pt 4f, Fe 2p, and Ce 3d regions, so the XPS results are interpreted qualitatively. Fourth, independent measurements of oxygen vacancies, such as Raman spectroscopy, O 1s analysis, or electron paramagnetic resonance, were not performed. Fifth, relative product distribution was determined from the available ¹H NMR measurements without an independent chromatographic method, and complete carbon-balance information was not available. Replicate-level values and standard deviations were unavailable in the retained dataset. Finally, catalytic testing was performed under a single reaction condition of 80 °C and an O₂ pressure of 0.8 MPa, and selectivity was not compared at matched conversion.
Future work should address these limitations by including monometallic Pt/CeO₂ and Fe/CeO₂ controls, catalyst series with constant Pt or Fe loading, and additional Pt ratios near 1:1. BET measurements, complete particle-size distributions, and activity normalized to accessible Pt sites would help separate composition effects from differences in active-site density. Additional XPS measurements with complete raw-data analysis, together with independent characterization of oxygen-defect-related species, would strengthen interpretation of the electronic and surface-structural changes. Time-dependent catalytic measurements, matched-conversion comparisons, product carbon balances, and complementary analytical techniques such as high-performance liquid chromatography would also provide a more rigorous basis for evaluating activity, selectivity, and reaction pathways.
Despite these limitations, the results demonstrate clear composition-dependent differences among the Pt–Fe/CeO₂ catalysts examined in this study. The Pt:Fe = 1:1 sample showed the highest measured glycerol conversion and relative glyceric acid contribution among the tested bimetallic compositions, together with distinct structural and surface-chemical characteristics. These findings provide a basis for further investigation of composition–structure–performance relationships in Pt–Fe/CeO₂ catalysts for glycerol oxidation, while additional controlled experiments are required to establish the underlying mechanism and determine whether the 1:1 composition represents a true optimum.
Acknowledgments
The authors sincerely thank Professor Yawen Zhang and his research group at the College of Chemistry and Molecular Engineering, Peking University, for their guidance and support throughout this research. Special thanks are extended to Shengzhi Xue for his assistance with catalyst preparation, experimental procedures, data analysis, and manuscript revision. The authors also gratefully acknowledge the Beijing Talent Program for providing the opportunity and support for this research project, as well as the support from the High School Affiliated to Beijing Normal University.
References
- W. C. Ketchie, M. Murayama, R. J. Davis. Selective oxidation of glycerol over carbon-supported AuPd catalysts. Journal of Catalysis. Vol. 250, pg. 264–273, 2007, https://doi.org/10.1016/j.jcat.2007.06.011. [↩] [↩]
- I. Sobczak, K. Jagodzińska, M. Ziolek. Glycerol oxidation on gold catalysts supported on group five metal oxides—a comparative study with other metal oxides and carbon based catalysts. Catalysis Today. Vol. 158, pg. 121–129, 2010, https://doi.org/10.1016/j.cattod.2010.04.022. [↩] [↩]
- S. Carrettin, P. McMorn, P. Johnston, K. Griffin, G. J. Hutchings. Selective oxidation of glycerol to glyceric acid using a gold catalyst in aqueous sodium hydroxide. Chemical Communications. No. 7, pg. 696–697, 2002, https://doi.org/10.1039/B201112N. [↩] [↩]
- F. Porta, L. Prati. Selective oxidation of glycerol to sodium glycerate with gold-on-carbon catalyst: an insight into reaction selectivity. Journal of Catalysis. Vol. 224, pg. 397–403, 2004, https://doi.org/10.1016/j.jcat.2004.03.009. [↩]
- Y.-B. Choi, N. Nunotani, K. Morita, N. Imanaka. Selective glycerol oxidation to glyceric acid under mild conditions using Pt/CeO₂-ZrO₂-Fe₂O₃/SBA-16 catalysts. Journal of Asian Ceramic Societies. Vol. 10, pg. 178–187, 2022, https://doi.org/10.1080/21870764.2022.2028980. [↩] [↩] [↩]
- X. Zhang, D. Zhou, X. Wang, J. Zhou, J. Li, M. Zhang, Y. Shen, H. Chu, Y. Qu. Overcoming the deactivation of Pt/CNT by introducing CeO₂ for selective base-free glycerol-to-glyceric acid oxidation. ACS Catalysis. Vol. 10, pg. 3832–3837, 2020, https://doi.org/10.1021/acscatal.9b05559. [↩] [↩] [↩] [↩]
- A. Tsuji, K. T. V. Rao, S. Nishimura, A. Takagaki, K. Ebitani. Selective oxidation of glycerol by using a hydrotalcite-supported platinum catalyst under atmospheric oxygen pressure in water. ChemSusChem. Vol. 4, pg. 542–548, 2011, https://doi.org/10.1002/cssc.201000359. [↩] [↩] [↩]
- Y. Shen, Y. Li, H. Liu. Base-free aerobic oxidation of glycerol on TiO₂-supported bimetallic Au–Pt catalysts. Journal of Energy Chemistry. Vol. 24, pg. 669–673, 2015, https://doi.org/10.1016/j.jechem.2015.08.015. [↩]
- S. Chen, P. Qi, J. Chen, Y. Yuan. Platinum nanoparticles supported on N-doped carbon nanotubes for the selective oxidation of glycerol to glyceric acid in a base-free aqueous solution. RSC Advances. Vol. 5, pg. 31566–31574, 2015, https://doi.org/10.1039/C5RA02112J. [↩]
- M. S. Gross, B. S. Sánchez, C. A. Querini. Glycerol oxidation in liquid phase: highly stable Pt catalysts supported on ion exchange resins. Applied Catalysis A: General. Vol. 501, pg. 1–9, 2015, https://doi.org/10.1016/j.apcata.2015.04.026. [↩]
- C. Dai, L. Sun, H. Liao, B. Khezri, R. D. Webster, A. C. Fisher, Z. J. Xu. Electrochemical production of lactic acid from glycerol oxidation catalyzed by AuPt nanoparticles. Journal of Catalysis. Vol. 356, pg. 14–21, 2017, https://doi.org/10.1016/j.jcat.2017.10.010. [↩]
- X. Jin, M. Zhao, W. Yan, C. Zeng, P. Bobba, P. S. Thapa, B. Subramaniam, R. V. Chaudhari. Anisotropic growth of PtFe nanoclusters induced by lattice-mismatch: efficient catalysts for oxidation of biopolyols to carboxylic acid derivatives. Journal of Catalysis. Vol. 337, pg. 272–283, 2016, https://doi.org/10.1016/j.jcat.2016.02.015. [↩] [↩] [↩]
- V. S. Lima, T. S. Almeida, A. R. De Andrade. Glycerol electro-oxidation in alkaline medium with Pt-Fe/C electrocatalysts synthesized by the polyol method: increased selectivity and activity provided by less expensive catalysts. Nanomaterials. Vol. 13, pg. 1173, 2023, https://doi.org/10.3390/nano13071173. [↩] [↩]
- Y. Meng, H. Wang, Y. Dai, J. Zheng, H. Yu, C. Zhou, Y. Yang. Modulating the electronic property of Pt nanocatalyst on rGO by iron oxides for aerobic oxidation of glycerol. Catalysis Communications. Vol. 144, pg. 106073, 2020, https://doi.org/10.1016/j.catcom.2020.106073. [↩] [↩] [↩]
- X. Liu, C. Yang. Electrocatalytic selective oxidation of glycerol to glyceric acid over efficient Pt/CNTs-CeO₂ catalysts. Materials Letters. Vol. 324, pg. 132658, 2022, https://doi.org/10.1016/j.matlet.2022.132658. [↩]
- X. Gong, Q. Shi, X. Zhang, J. Li, G. Ping, H. Xu, H. Ding, G. Li. Synergistic effects of PtFe/CeO₂ catalysts afford high catalytic performance in selective hydrogenation of cinnamaldehyde. Journal of Rare Earths. Vol. 41, pg. 233–239, 2023, https://doi.org/10.1016/j.jre.2022.02.010. [↩] [↩] [↩] [↩]
- R. K. P. Purushothaman, J. van Haveren, D. S. van Es, I. Melián-Cabrera, J. D. Meeldijk, H. J. Heeres. An efficient one pot conversion of glycerol to lactic acid using bimetallic gold-platinum catalysts on a nanocrystalline CeO₂ support. Applied Catalysis B: Environmental. Vol. 147, pg. 92–100, 2014, https://doi.org/10.1016/j.apcatb.2013.07.068. [↩]
- Y. Xiao, J. Greeley, A. Varma, Z.-J. Zhao, G. Xiao. An experimental and theoretical study of glycerol oxidation to 1,3-dihydroxyacetone over bimetallic Pt-Bi catalysts. AIChE Journal. Vol. 63, pg. 705–715, 2017, https://doi.org/10.1002/aic.15418. [↩] [↩]
- X. Ning, Y. Li, H. Yu, F. Peng, H. Wang, Y. Yang. Promoting role of bismuth and antimony on Pt catalysts for the selective oxidation of glycerol to dihydroxyacetone. Journal of Catalysis. Vol. 335, pg. 95–104, 2016, https://doi.org/10.1016/j.jcat.2015.12.020. [↩]
- A. C. Garcia, Y. Y. Birdja, G. Tremiliosi-Filho, M. T. M. Koper. Glycerol electro-oxidation on bismuth-modified platinum single crystals. Journal of Catalysis. Vol. 346, pg. 117–124, 2017, https://doi.org/10.1016/j.jcat.2016.12.013. [↩]
- Y. Li, F. Zaera. Factors affecting activity and selectivity in the oxidation of glycerol promoted by platinum catalysts. Catalysis Science & Technology. Vol. 5, pg. 3773–3781, 2015, https://doi.org/10.1039/C5CY00586H. [↩]
- Y. Li, F. Zaera. Sensitivity of the glycerol oxidation reaction to the size and shape of the platinum nanoparticles in Pt/SiO₂ catalysts. Journal of Catalysis. Vol. 326, pg. 116–126, 2015, https://doi.org/10.1016/j.jcat.2015.04.009. [↩]
- J. Li, Z. Li, Z. Zheng, X. Zhang, H. Zhang, H. Wei, H. Chu. Tuning the product selectivity toward the high yield of glyceric acid in Pt−CeO₂/CNT electrocatalyzed oxidation of glycerol. ChemCatChem. Vol. 14, pg. e202200509, 2022, https://doi.org/10.1002/cctc.202200509. [↩]
- Z. Luo, Z. Zhu, R. Xiao, D. Chu. Synergy of Pt single atom and clusters toward selective glycerol oxidation. ChemNanoMat. Vol. 9, pg. e202200494, 2023, https://doi.org/10.1002/cnma.202200494. [↩]
- W. Chen, L. Zhang, L. Xu, Y. He, H. Pang, S. Wang, Y. Zou. Pulse potential mediated selectivity for the electrocatalytic oxidation of glycerol to glyceric acid. Nature Communications. Vol. 15, pg. 2420, 2024, https://doi.org/10.1038/s41467-024-46752-4. [↩]